The nature of very-faint X-ray binaries: Near-infrared spectroscopy of 1RXH J173523.7–354013 reveals a giant companion
Abstract
Very-faint X-ray binaries (VFXBs) are a sub-class of black holes and neutron stars in binaries that appear to be accreting at a very low rate. In addition to providing interesting constraints on poorly understood forms of accretion, elucidating the nature of VFXBs is particularly interesting for binary evolution and population modeling. Through near-infrared (nIR) spectroscopy, we here investigate the nature of the bursting neutron star and VFXB 1RXH J173523.7–354013 (J1735), which persistently accretes at an X-ray luminosity of . Our analysis shows that the nIR emission is dominated by that of the companion star, which we find to be a late G or early K-type giant, making this the second neutron star identified as a VFXB found to have a giant companion. We discuss how several of the system properties are difficult to reconcile with a wind-fed symbiotic X-ray binary. We therefore also propose an alternative scenario wherein J1735 is a wide binary system (supported by the discovery of a d modulation in the nIR light curves) with a quiescent luminosity of , in which the donor star is overflowing its Roche lobe. This raises the possibility that J1735 may, every century or more, exhibit very long and very bright outbursts during which it reaches accretion rates around the Eddington limit like the neutron star Z sources.
keywords:
accretion: accretion disks – X-rays: individual (1RXH J173523.7–354013) – stars: neutron – X-rays: binaries – X-rays: bursts1 Introduction
Among the brightest X-ray point sources in the sky are neutron stars (NSs) and black holes (BHs) that are in a binary system accreting gas from a less massive companion star. These low-mass X-ray binaries (LMXBs) can generate an X-ray luminosity of when actively accreting. However, a significant sub-set of the LMXBs (comprising 25% of the currently known population; Bahramian & Degenaar, 2022) has a much lower peak accretion output of : the very faint X-ray binaries (VFXBs; Wijnands et al., 2006).
Due to their low luminosity, detailed studies of VFXBs were long hampered by sensitivity limitations of astronomical instrumentation. Whereas there has been a significant uprise in targeted studies to find and characterize VFXBs over the past 2 decades (e.g., Sakano et al., 2005; Muno et al., 2005; in’t Zand et al., 2005; Wijnands et al., 2006; Wijnands, 2008; Degenaar & Wijnands, 2010; Armas Padilla et al., 2011; Sidoli et al., 2011; Shaw et al., 2020; Bahramian et al., 2021), many aspects of the accretion morphology and binary configurations of this large LMXB sub-group remain to be explored. There is significant interest in this, because VFXBs are a gateway to study accretion processes and outflows in an under-explored mass-accretion regime (e.g., Armas Padilla et al., 2013a; Knevitt et al., 2014; Wijnands et al., 2015; Degenaar et al., 2017; Gusinskaia et al., 2020). Moreover, elucidating the binary configuration of VFXBs allows to test and refine various binary evolution and population synthesis models (e.g., Pfahl et al., 2002; King & Wijnands, 2006; Yungelson et al., 2006; van Haaften et al., 2012; Maccarone & Patruno, 2013; Maccarone et al., 2015).
A natural explanation for the X-ray faintness of VFXBs may be that these LMXBs have small accretion disks (i.e. short orbital periods; e.g. King & Wijnands, 2006; in’t Zand et al., 2007; Heinke et al., 2015). This includes the sub-population of ultra-compact X-ray binaries (UCXBs), which have degenerate donor stars and hence require orbital periods 90 min to facilitate accretion through Roche-lobe overflow (e.g. Nelson et al., 1986). Indeed, by now several VFXBs have been conclusively identified as UCXBs (see Bahramian & Degenaar, 2022, and references therein). Nevertheless, at least three VFXBs, 1RXH J173523.7–354013 (aka 1RXS J173524.4–353957, RX J1735.3–3540, IGR J17353–3539; J1735 hereafter), M15 X-3, and SAX J1806.52215, must have non-degenerate donor stars; strong H emission was detected in the optical spectrum of J1735 (Degenaar et al., 2010), the high optical/X-ray ratio of M15 X-3 is inconsistent with an UCXB interpretation Arnason et al. (2015), and SAX J1806.52215 appears to exhibit absorption in Brackett , providing evidence for hydrogen in the system and therefore excluding a hydrogen-stripped companion (Shaw et al., 2017).
Another possible explanation for the faint X-ray emission of VFXBs is that the accretion flow is radiatively-inefficient. Standard accretion theory predicts that towards low accretion rates the radiative efficiency decreases (Rees et al., 1982; Narayan & Yi, 1995). This should be particularly pronounced for BH systems with short (though not ultra-compact) orbital periods (Wu et al., 2010; Knevitt et al., 2014), of which indeed a handful of candidates have been identified among the VFXBs (McClintock et al., 2001; Corral-Santana et al., 2013; Stoop et al., 2021). In NS systems, the strong NS magnetic field may also hamper efficient accretion onto the stellar surface (e.g., Wijnands, 2008; Degenaar et al., 2014; Heinke et al., 2015). Several VFXBs have been identified as accreting millisecond pulsars (e.g., Altamirano et al., 2010; Strohmayer & Keek, 2017; Sanna et al., 2018, 2022). For one of these the inner accretion disk was found to be truncated and hints of outflowing material were found, suggesting that some material might be propelled out Degenaar et al. (2017); van den Eijnden et al. (2018).
Finally, recent systematic surveys to find and identify VFXBs have revealed that symbiotic systems (e.g. Iben & Tutukov, 1996; Corbet et al., 2008; Bozzo et al., 2022) could be a growing sub-class (Shaw et al., 2020; Bahramian et al., 2021). In these systems the compact object (which can be a NS or even a white dwarf) accretes from the weak wind of the low-mass companion, which is inefficient, and hence can explain the low X-ray luminosity. A somewhat surprising aspect of this is that the one VFXB identified as a symbiotic X-ray binary (IGR J174452747; Shaw et al., 2020; Bahramian et al., 2021) displays thermonuclear bursts (Mereminskiy et al., 2017). These bursts (see e.g., Galloway & Keek, 2021, for a review) are often regarded as exclusively occurring in LMXBs, since bursts are suppressed or have a different observational signature on high field NSs (Bildsten & Brown, 1997), and most low- NSs are found in LMXBs. Symbiotic systems, on the other hand, are a short-lived stage of binary evolution such that there is not enough time for accretion to reduce the magnetic field of the NS to a level where bursts can be produced. Bursts from a symbiotic system therefore strongly suggest that the NS was born with a low field. In summary, the VFXBs appear to be an inhomogeneous group, consisting of several sub-classes of LMXBs: UCXBs, short-period (though not ultra-compact) BH systems, accreting millisecond X-ray pulsars and symbiotic X-ray binaries.
In this work, we investigate the nature of the VFXB J1735. Degenaar et al. (2010) identified this system as a NS-LMXB based on the detection of a thermonuclear burst. Reprocessed X-ray burst emission was clearly detected at optical and UV wavelengths, which allowed them to pin down a unique counterpart for the X-ray source. Ultraviolet (UV), optical and near-infrared (nIR) photometry indicated that the counterpart was rather red, while optical spectroscopy revealed a strong H emission line (Degenaar et al., 2010). Deep radio observations of the source did not yield a detection (van den Eijnden et al., 2021), which implies that it is unlikely that its bright nIR emission is due to the contribution of a jet. Gaia Data Release 3 (DR3; Gaia Collaboration et al., 2016, 2022) measured the parallax to the optical counterpart to be mas, and Bailer-Jones et al. (2021) calculated the photogeometric distance to be kpc based on Gaia Early Data Release 3 (EDR3; Gaia Collaboration et al., 2021). In this paper we further investigate the nature of this VFXB using nIR spectroscopy.
2 Observations and Data Reduction
2.1 Near-infrared monitoring
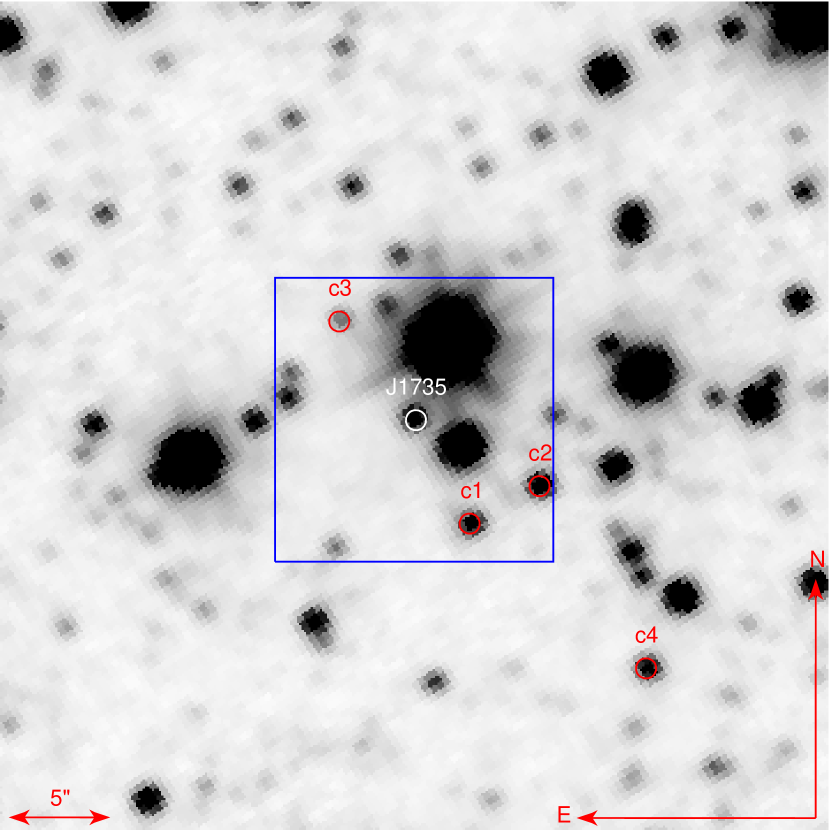
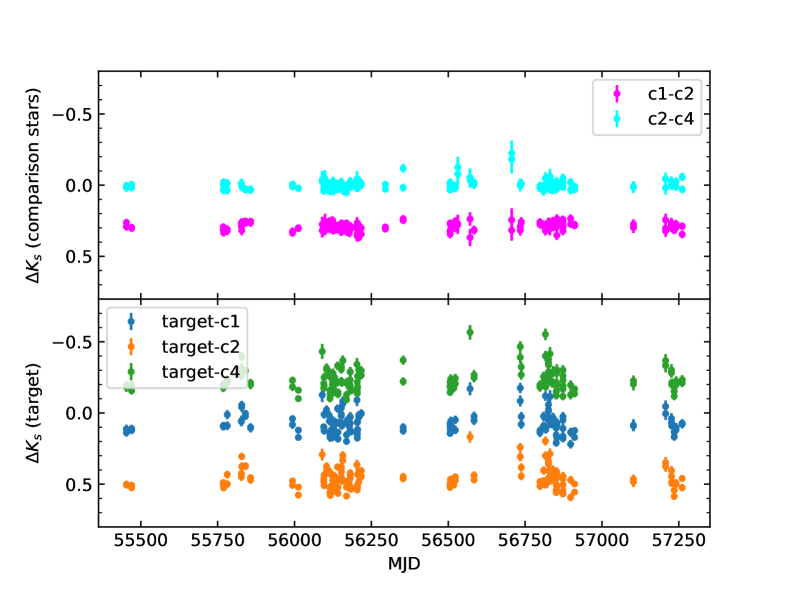
We queried data release 5 (DR5) of the Visible and Infrared Survey Telescope for Astronomy (VISTA) Variable in the Via Lactea Survey (VVV; Minniti et al., 2010) for nIR imaging of the J1735 field. We found that the field had been observed multiple times since 2010 Sept, with the densest coverage in the -band. A -band image of the field is shown in the upper panel of Fig. 1. We downloaded the source detection table for the nIR counterpart of J1735 (known as VVV J173523.74-354016.58), which contains aperture photometry for numerous values of aperture radius.111For an overview of VISTA science archive data, see http://horus.roe.ac.uk/vsa/dboverview.html . We also downloaded source detection tables for four comparison stars (see Fig. 1). We extracted the 1″ radius (as recommended by Saito et al., 2012, for the crowded field case) aperture photometry from the source detection tables for J1735 and the comparison stars and assembled differential -band light curves, plotting them in Fig. 2.222For clarity, we do not include the third comparison star in Fig. 2, but the observed variability is nearly identical to what is shown. We choose to calculate differential magnitudes instead of simply plotting the VVV apparent magnitudes, because this allows us to assess whether any variability is intrinsic to the J1735 system, or is an artefact of performing aperture photometry in a crowded field.
2.2 Near-infrared spectroscopy
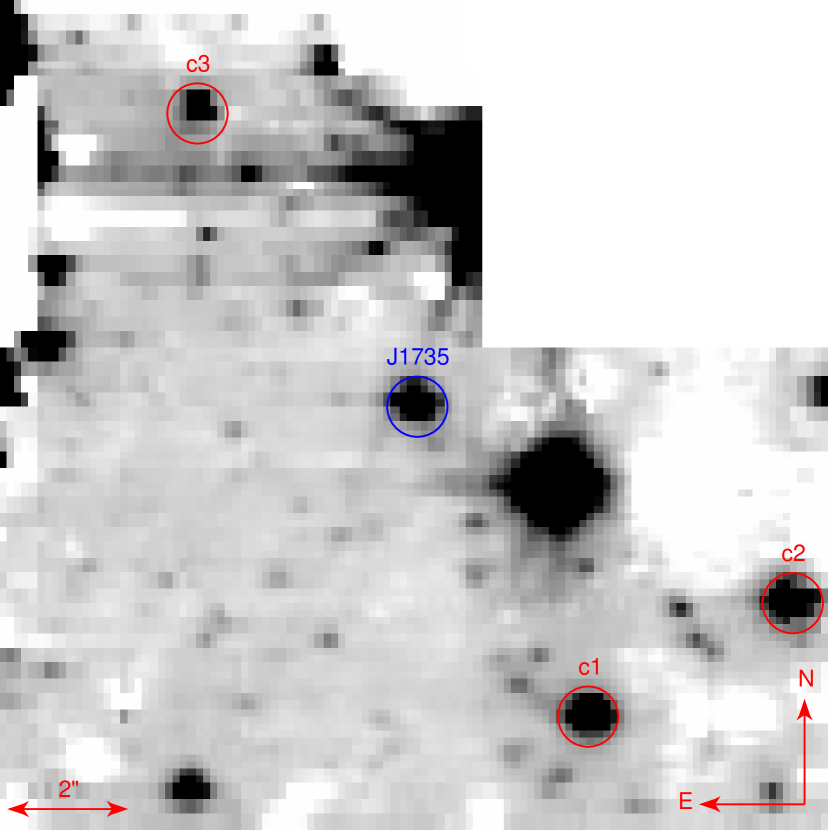
The J1735 field was observed with the Spectrograph for INtegral Field Observations in the Near Infrared (SINFONI; Eisenhauer et al., 2003) on the Very Large Telescope at Paranal, Chile on 2018 August 03. Target of Opportunity (ToO) observations were obtained as part of proposal 0102.D-0650 (PI: Degenaar). We obtained 14 total images, the first ten of which consisted of 5 co-added 20s exposures while each of the remaining 4 images consisted of 4 co-added 20s exposures, all of which were obtained with the grating ( m). We utilised the 025 spatial pixel scale, corresponding to an 8″8″field-of-view for each image. A dithering pattern was applied to account for the variable nIR sky background. We used a nearby bright star as a natural guide star (NGS) to correct for atmospheric distortions with the SINFONI adaptive optics (AO).
Data were reduced with the ESO Recipe Execution tool (esorex) pipeline,333https://www.eso.org/sci/software/cpl/esorex.html which performs typical reduction steps including dark subtraction, non-linearity correction, flat fielding, wavelength calibration and sky subtraction to provide a co-added data cube, from which the median image in Fig. 1 was derived. We extracted the spectrum of the nIR counterpart to J1735 with the esorex task sinfo_utl_cube2spectrum, using a circular region of radius 2 pixels (05).
We corrected for telluric features in the spectrum of J1735 using the software molecfit (Smette et al., 2015; Kausch et al., 2015), which uses the source spectrum itself as an input to fit and remove telluric lines. The advantage of molecfit over the typical method of observing a telluric standard is that using the science spectrum as an input means the derived telluric spectrum is representative of the nIR sky spectrum under the actual observing conditions. Telluric standards are typically observed at different times, airmasses and sky background conditions and this can affect the accuracy of the telluric correction of the science spectrum.
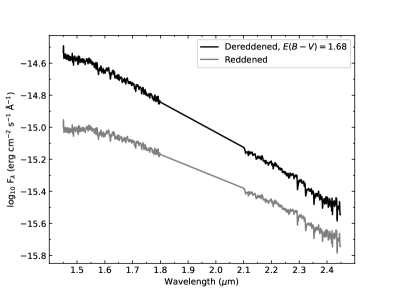
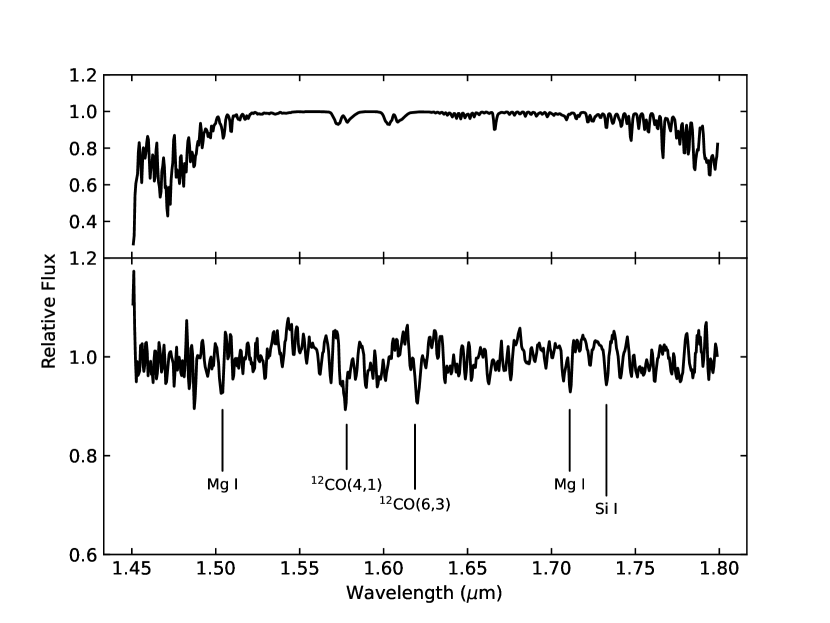
We also flux calibrated the spectrum of J1735 using observations of HIP 084435 (HD 155888), a B4V star originally included in the calibration plan as a telluric standard, obtaining a single image consisting of five, 3s exposures. We followed the same reduction steps as for J1735, and corrected for telluric features using molecfit. We used the Image Reduction and Analysis Facility (iraf; Tody, 1986) to perform the flux calibration of J1735. We first removed all hydrogen absorption lines from the telluric-corrected spectrum of HIP 084435 using iraf task splot, fitting a Voigt profile to the Brackett lines and subtracting the fit from the spectrum. We then calculated the sensitivity function by assuming a 17200K blackbody for the HIP 084435 spectrum, with magnitudes of and (Skrutskie et al., 2006). The resultant sensitivity function was applied to the spectrum of J1735 to derive the flux calibrated spectrum. We show this spectrum in Fig. 3, along with the dereddened spectrum, obtained using the iraf task deredden, assuming (Degenaar et al., 2010) and a Cardelli et al. (1989) extinction law, for a standard Milky Way ratio of total to selective extinction, .
3 Analysis and Results
3.1 Long-term nIR monitoring
The VVV -band differential light curve of the nIR counterpart to J1735 is shown in Fig. 2. When comparing the target/comparison differential light curves with the comparison/comparison differential light curves, we note that J1735 appears to show nIR variability with an amplitude of up to mag. The absence of such variability in the comparison light curves implies that it is real, and intrinsic to the J1735 system. We also find that the excess variance (an estimator of the intrinsic source variance, see e.g. Vaughan et al., 2003) is much stronger for the target light curve than for any comparison star light curve. The average NIR magnitudes of J1735 (using the 1″ aperture photometry from the source detection table) are , and .
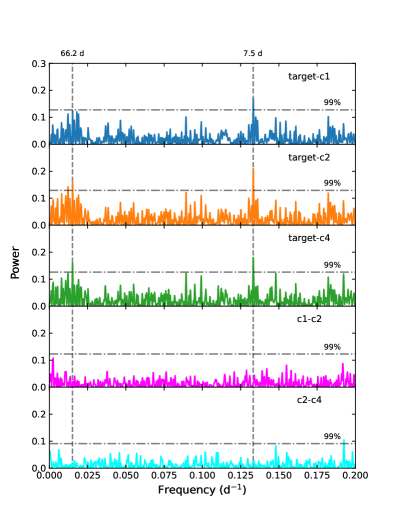
We performed timing analysis on the differential light curves in order to search for any periodic variability that might be associated with the system. We calculated Lomb-Scargle periodograms (Lomb, 1976; Scargle, 1982) for each of the five differential light curves shown in Fig. 2 using the LombScargle class included in the astropy Python package (Astropy Collaboration et al., 2013, 2018). The periodograms are shown in Fig. 4. For each periodogram, we calculated a 99% significance threshold for the power. We did this by randomly shuffling the light-curve magnitudes but keeping the time stamps the same, effectively creating a randomized light curve with the same sampling as the original data. We calculated the peak Lomb–Scargle power for 10,000 of these randomized light curves, from which we derived the 99% significance for each periodogram.
The periodograms of the target/comparison differential light curves all show significant peaks, the two strongest of which correspond to periods of 7.5 and 66.2d, with the strongest peak (and only one to be consistently above the 99% significance line) at d. These peaks are persistent through the three target/comparison periodograms, and do not appear in the comparison/comparison periodograms, implying that the corresponding periods are real and not an artefact of the light curve sampling, though their origin is unclear.
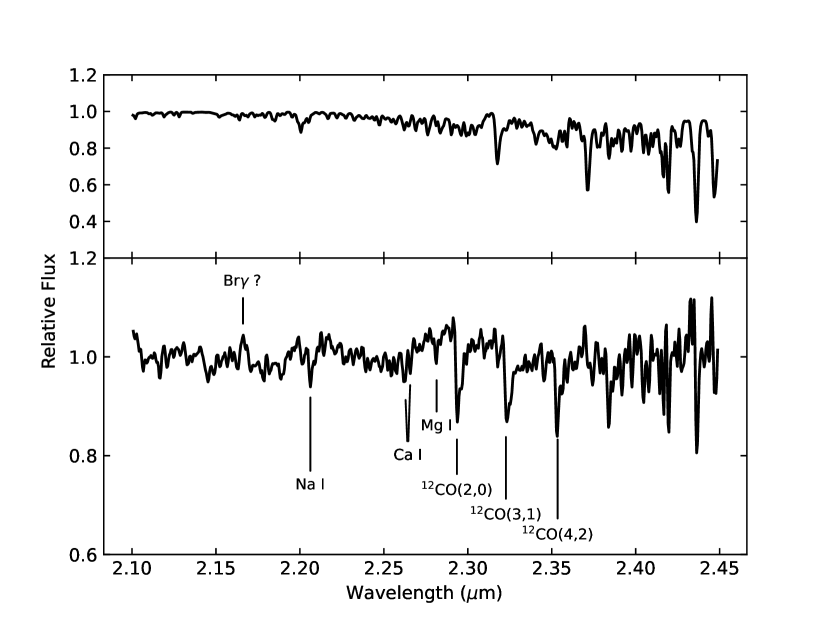
3.2 nIR spectroscopy
The flux-calibrated nIR spectrum of J1735 is shown in Fig. 3. We also show the spectrum divided into - and -band segments and continuum normalised in Fig. 5. An initial examination of the spectrum reveals numerous lines associated with neutral metals, along with molecular 12CO bandheads, classic nIR spectral signatures of late-type (K-M) stars (e.g. Kleinmann & Hall, 1986; Wallace & Hinkle, 1997; Meyer et al., 1998; Ivanov et al., 2004; Rayner et al., 2009). Utilising the National Institute of Standards and Technology – Atomic Spectra Database (NIST-ASD Kramida et al., 2021) to obtain the most accurate rest wavelengths of these features, we used the iraf task rvidlines task to calculate the observed radial velocity, of the source. This is a sum of the systemic and orbital radial velocity of the system, as we are unable to disentangle the two from a single spectrum. We find km s-1. The spectra shown in Fig. 5 are velocity corrected using the measured .
The most striking lines in the nIR spectrum of J1735 are the strong CO bandheads at m. The presence of these bandheads (we note that CO is also present in the -band), along with the relative weakness of Ca i and Na i, is strong evidence for a late-type giant companion (see e.g. Wallace & Hinkle, 1997). To test this hypothesis, we can apply 2D spectral classification techniques to the -band portion of the nIR spectrum. Numerous studies have identified temperature-dependent and surface gravity-dependent features in nIR spectra of late-type stars (e.g. Ramirez et al., 1997; Ivanov et al., 2004; Comerón et al., 2004; Rayner et al., 2009; Messineo et al., 2017; Ghosh et al., 2019; Messineo et al., 2021). Comparing the strengths of these features allows one to derive the spectral type and luminosity class of the target. In the case of J1735 we assume this to be the donor star of the accreting binary. These techniques were successfully applied by Bahramian et al. (2014) and Shaw et al. (2020) to identify and type giant and subgiant donors in a number of accreting binaries.
We adopt the Na i (2.21m) and Ca i (2.26m) passbands as the temperature dependent features (e.g. Ramirez et al., 1997), and the 12CO (2.29m) bandhead as the surface-gravity and temperature-dependent feature. For each feature we calculate the equivalent width (EW), approximating the continuum level with a 1D polynomial (fit using astropy’s Polynomial1D function) using two nearby, featureless regions of the spectrum. We follow the method of Shaw et al. (2020), who define the continuum and line bandpasses according to those of Bahramian et al. (2014) and Comerón et al. (2004) and are almost identical to the continuum and line definitions of later studies (see e.g. Ghosh et al., 2019). As an additional check, we also measure the EW of the Mg i (1.71m) line which, when compared with 12CO , provides a strong diagnostic for luminosity class (Messineo et al., 2017, 2021). The line and continuum definitions, along with the measured EWs, are reported in Table 1. We also include continuum and line definitions for Si i (1.59 m), 12CO (1.62 m) and Mg i (2.28 m), the EWs of which can be used to investigate how much, if at all, the measured spectrum is diluted by non-stellar sources (such as an accretion disc; Förster Schreiber, 2000). Uncertainties on the EWs were calculated using a bootstrap-with-replacement method as follows: we determined 10,000 new EWs using continuum levels from a random sample of the passbands described in Table 1 and computed the standard error. For each new continuum passband, we allowed the same wavelength-flux pair to be selected multiple times. We cross-checked our EW calculations with the equivalent_width function provided by the astropy package specutils (Earl et al., 2023) and found them to be consistent. In Table 1, we also include the integrated line fluxes of each spectral feature of interest, measured from the continuum subtracted dereddened spectrum.
Aside from the metal lines, we also note the possible presence of a Brackett (Br) emission line at 2.17 m (continuum and line definitions provided in Table 1). Though weak (we measure EW Å), it is consistent with the presence of hydrogen emission in the optical spectrum (Degenaar et al., 2010). We see no further evidence of hydrogen emission in the nIR spectrum of J1735.
.
Line
Blue Continuum
Red Continuum
Feature
Centre
Centre
Centre
EW
Flux
Reference
(m)
(m)
(m)
(m)
(m)
(m)
(Å)
(erg cm-2 s-1)
Si i
1.5890
0.004
1.5859
0.0015
1.5937
0.0015
(1)
12CO
1.6198
0.0045
1.6160
0.003
1.6270
0.003
(2)
Mg i
1.7115
0.005
1.7035
0.001
1.7145
0.002
(1)
Br
2.1661
0.009
2.1560
0.012
2.1745
0.005
(3)
Na i
2.2075
0.007
2.1940
0.006
2.2150
0.004
(4)
Ca i
2.2635
0.011
2.2507
0.0106
2.2710
0.002
(4)
Mg i
2.2807
0.0035
2.277
0.0040
12.2865
0.008
(4)
12CO
2.2955
0.013
2.2500
0.016
2.2875
0.007
(4)
References for line and continuum passbands: (1) Messineo et al. (2017), (2) Ghosh
et al. (2019), (3) This work, (4) Comerón et al. (2004)
4 Discussion
4.1 Spectral type of the companion
4.1.1 Luminosity class
Table 1 shows the EWs of lines important for deriving the spectral type of the donor star in J1735. The first thing to note is that we measure EW[12CO (2,0)] Å. Comerón et al. (2004) note that supergiants typically exhibit EW[12CO (2,0)] Å, while all the supergiants in the Infrared Telescope Facility (IRTF) spectral library of cool stars (Rayner et al., 2009) show EW[12CO (2,0)] Å (Messineo et al., 2017, 2021). We are therefore able to confidently rule out a supergiant donor for J1735, implying that it is instead a dwarf, giant, or subgiant.
We can compare the EWs of 12CO to those of Na i and Ca i in order to determine the luminosity class of the donor star. Ramirez et al. (1997) showed that dwarfs exhibit {EW[12CO (2,0)]/(EW[Na i]EW[Ca i])} while giants show much higher ratios in the range {EW[12CO (2,0)]/(EW[Na i]EW[Ca i])}. Villaume et al. (2017) also note that EW[12CO (2,0)] alone is a strong discriminator between giant and dwarf stars for all metallicities. We measure {EW[12CO (2,0)]/(EW[Na i]EW[Ca i])}, strongly indicative of a giant companion. Another piece of evidence for a giant classification comes from EW[Mg i (1.71m)], which, when compared with EW[12CO (2,0)], is consistent with known giants (see figure 3 of Messineo et al., 2021). The strength of the Mg i (1.71m) line alone is also a good indicator of a giant classification, as late-type dwarfs typically show EW[Mg i (1.71m)] (Rayner et al., 2009). We can therefore confidently identify the companion star of J1735 as a late-type giant.
4.1.2 Contamination of the donor star spectrum by the accretion disc
We can also use EW ratios of temperature-dependent features to assess whether there is a source of diluting continuum emission that would affect the conclusions we draw from the measured EWs. Given that there is evidence for Br emission in the -band spectrum, it is possible that there could be continuum emission from the accretion disc contributing the nIR spectrum. Förster Schreiber (2000) demonstrated that ratios of temperature-dependent lines close in wavelength can provide an indication of continuum dilution in the - and -bands. In their figure 8, Förster Schreiber (2000) show plots of dilution-free EW ratios, with arrows indicating how measured ratios would change with a source of dilution. For J1735, our measured values for EW[12CO (2,0)], EW[Ca i] and EW[Mg i (2.28m)] strongly suggest that there is negligible dilution in the -band, as our measured ratios all lie on the loci for non-diluted sources. However, the ratio of the 12CO (6,3) and Si i lines in the -band lies below the observed distribution of non-diluted stars presented by Förster Schreiber (2000), implying that there could be some contamination in this portion of the nIR spectrum. We therefore focus on the -band spectrum when deriving the effective temperature of the donor star.
4.1.3 Effective temperature
We can use the measured EWs (typically of EW[12CO (2,0)]) to also derive the effective temperature, , and therefore the spectral subtype of the donor star. However, metallicity can play a role in the relationship between EW and . Ghosh et al. (2021) derive a relationship between EW[Na i] and metallicity [Fe/H] based on -band spectra of 260 late-type giants:
| (1) |
where , , and . Though the standard error of estimate (SEE) on the relation is large (SEE dex), it provides a first estimate of [Fe/H]. Assuming EW[Na i]=, we find [Fe/H], propagating uncertainties and factoring in the SEE. Despite the large scatter, the EW of the Na i line is indicative of a donor that is not unusually metal-rich or metal-poor.
Ghosh et al. (2021) also derive a linear relationship between and EW[12CO]:
| (2) |
where and in this instance refer to and EW[12CO (2,0)], respectively. For the full sample, Ghosh et al. (2021) derive and , from which we infer , factoring in the large scatter (SEE ). If, instead, we assume , which is likely given our calculation of [Fe/H], then Ghosh et al. (2021) derive and , which would increase the temperature to . Both ranges of are indicative of a spectral type in the range G6III – K1III according to the – spectral type relations of van Belle et al. (2021), putting the radius of the companion in the range (see table 17 of van Belle et al., 2021).
Deriving the spectral type of the companion also allows us to further investigate whether the Br feature described in Section 3.2 is real or chance coincidence. All giants in the IRTF spectral library of cool stars in the range G6III – K1III show weak, but detectable, Br absorption in the -band. Subtracting continuum-normalised IRTF standard spectra from our (continuum-normalised) SINFONI spectrum of J1735 therefore highlights the apparent Br emission in the source spectrum even further. An F-test of the Br region of the spectrum of J1735, comparing the spectrum with and without a best-fit Gaussian line at 2.166m indicates that the line is significant above 99.9% confidence for any IRTF standard in the G6III – K1III spectral type range, and thus we believe it to be real.
4.1.4 Surface gravity and mass
Ghosh et al. (2019) derived a linear relationship between the surface gravity () and EW[12CO (2,0)] with the same form as Equation 2, where is now and is EW[12CO (2,0)]. Using the best-fit values and we derive cm s-2 (factoring in SEE ). Though the uncertainty is relatively large, we can use this value to place a rough estimate on the mass of the donor star. Taking a median (see Section 4.1.3, above) and cm s-2 we estimate that the mass of the companion is - similar to the NS primary. We note that this is not a detailed calculation of as Ghosh et al. (2019) calibrated their relation using only K and M giants, and we have established that the range of we have derived for the donor of J1735 can include G stars. In addition, the large range of valid stellar radii and mean this number is also subject to a significant scatter. However, remains a useful estimate when we consider the nature of accretion in the J1735 system.
4.2 Timing analysis
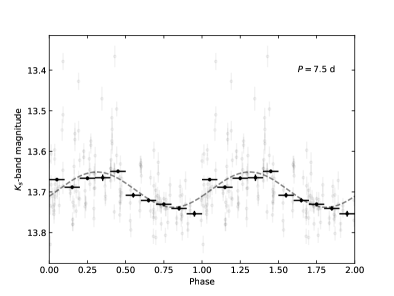
The periodograms presented in Fig. 4 imply at least two statistically significant periodicities associated with the J1735 system, the strongest of which is at d. In Fig. 6 we show the -band light curve of J1735, folded on this periodicity, along with the best-fit sinusoidal model as determined by the astropy LombScargle method. Fig. 6 shows that the phase-folded light curve follows a sinusoidal pattern with significant scatter about the mean, possibly indicative of short-term flaring episodes. Despite the high significance of the d peak in the periodogram (a false alarm probability of FAP=%), the folded light curve does not provide any insight into the nature of the variability. If d is the orbital period of the binary, then a future nIR spectroscopic radial velocity campaign will be able to confirm this.
4.3 The nature of 1RXH J173523.7-354013: wind accretion or Roche-lobe overflow?
Having identified the donor star in J1735 as a late-type giant through nIR spectroscopy, we can now turn to the X-ray properties of the system to discuss the binary configuration. Any plausible scenario must be able to explain i) its low persistent X-ray luminosity of (see Section 4.3.1), ii) its ability to ignite thermonuclear bursts, and iii) the large optical increase observed during its thermonuclear burst detection (Degenaar et al., 2010). It has already been established that J1735 cannot be a UCXB, owing to the detection of H in its optical spectrum. This is further confirmed by the detection of molecular lines in the nIR spectrum that indicate a giant companion. We therefore explore two more potential scenarios here: Scenario 1 in which J1735 is an LMXB, accreting via Roche lobe overflow (RLOF) and Scenario 2, in which J1735 is a wind-fed symbiotic X-ray binary.
4.3.1 A note on the distance
Degenaar et al. (2010) calculate an upper limit on the distance to J1735 to be kpc, inferred from the peak flux of the X-ray burst. However, Degenaar et al. (2010) note that the peak flux was only measured in the hard X-ray band, and extrapolated to lower energies, hence a large upper limit. Bailer-Jones et al. (2021), on the other hand, calculated the photogeometric distance to J1735 to be kpc, from Gaia EDR3.
Degenaar et al. (2010) calculate a persistent unabsorbed X-ray flux of erg cm-2 s-1 in the 0.5–10 keV band, and a persistent bolometric flux of erg cm-2 s-1 (0.01–100 keV). Combining these measured fluxes with the Bailer-Jones et al. (2021) distance range implies that J1735 has a persistent X-ray luminosity in the range erg s-1, and bolometric luminosity erg s-1.
These values are much lower than the upper limits calculated by Degenaar et al. (2010), which implies that the global mass-accretion rate on to the NS, , is also lower. For a NS of mass and radius and km, respectively, this would imply yr-1.
4.3.2 Scenario 1: Roche Lobe Overflow
The first possibility that we must consider is that J1735 is an LMXB undergoing RLOF, but with a giant companion rather than the typical main sequence secondary. If we assume that the periodicity measured in Section 4.2 is the orbital period of the binary and that the binary components are the same mass (; Section 4.1.4) then we can estimate the orbital separation, cm, using Kepler’s Third Law. The approximate radius of the Roche lobe in a binary system with equal masses is (Eggleton, 1983). Utilizing the same assumption above regarding , as well as (where is the binary mass ratio), we calculate cm, or .
Given the range of stellar radii given by van Belle et al. (2021) for a G6III – K1III star, it seems plausible that the companion would exceed its Roche Lobe. However, this is heavily dependent on the assumption that d. If the of J1735 is instead 66.2 d, where a peak is also seen in some of the periodograms in Fig. 4, a late G/early K giant would not fill the Roche Lobe. In addition, any change in component masses that would result in the assumed being higher, such as a more massive companion, or lower mass NS, increases the size of the Roche lobe, such that the lower end of the range calculated in Section 4.1.3 would not fill it in the d configuration.444We note that the opposite can also be true, such that a lower value of could reduce the size of the Roche Lobe.
If d and the system is indeed a RLOF system, then yr-1 (Webbink et al., 1983), and thus mass transfer would have to be highly non-conservative to match the calculated on to the NS. For several NS-LMXBs in compact orbits it has been proposed that mass-transfer is highly non-conservative based on timing studies of the X-ray pulsations (di Salvo et al., 2008; Burderi et al., 2009; Marino et al., 2019), or by modeling the multi-wavelength spectral energy distribution of the accretion disc (Hernández Santisteban et al., 2019). However, if severe mass losses are indeed the explanation for these observations, it is unclear what should be causing this and if the same could be happening in J1735. Severe mass losses, in principle, can be observed through future dedicated multi-wavelength studies of the system, e.g. as an additional source of absorption in X-rays (see e.g. Iaria et al., 2021), or as the origin of reprocessed emission in the mid – far IR (which would require JWST).
One possibility worth considering then is if J1735 could be a RLOF system ‘in quiescence’, in the sense that its accretion disk is currently cold and neutral but steadily filling up until sufficient mass is accumulated for it to become ionized and an outburst to occur (see Hameury, 2020, for a recent review on this disk instability paradigm). There is an empirical relation between the orbital period and quiescent X-ray luminosity of (BH) LMXBs accreting via RLOF (Garcia et al. 2001; see also Carotenuto et al. 2022 for a recent representation), where a longer is expected to lead to a higher quiescent due to the existence of a larger disk. In the work of Garcia et al. (2001), there are no NSs with known orbital periods on the order of hr and measured quiescent luminosities, but there are a few transient BH-LMXBs with long periods that have . At the same time, we know that for similar orbital periods, NS systems typically have a factor higher quiescent luminosities than the BH ones (due to NSs having a solid surface; Menou et al., 1999). While speculative, it does not seem implausible that J1735 is a quiescent LMXB with . One might then expect such a system to spend a long time in this quiescent state, filling up the large disk, before launching into a prolonged outburst. If true, such an outburst might further be expected to be very bright, reaching mass-accretion rates around the Eddington limit, as is seen in the NS Z-sources (e.g., Hasinger & van der Klis, 1989; Homan et al., 2010) It is worth noting that the calculated lies well inside the unstable (transient) regime predicted by the disk-instability model that reproduces many of the features of LMXB outbursts, assuming d (Lasota, 2001; Coriat et al., 2012).
We briefly note that the X-ray spectral properties of J1735 do not exclude the luminous quiescence scenario. An XMM-Newton observation of J1735 showed that it consists of a keV black-body component, plausibly emerging from the NS surface, and a power law (Armas Padilla et al., 2013b). This is consistent with many other transient NS-LMXBs that have lower X-ray luminosities in quiescence (e.g., Rutledge et al., 2001; Wijnands et al., 2002; Campana & Stella, 2003; Jonker et al., 2003). However, it is also true that short-period NS-LMXBs accreting at low rates have similar X-ray spectra (e.g., Degenaar et al., 2017; Armas Padilla et al., 2013b; Papitto et al., 2013).
Following van Paradijs & McClintock (1994), we can also test whether the observed burst properties work within the framework of optical reprocessing of the X-ray emission by an accretion disk. The peak of the X-ray burst was a factor brighter than the persistent X-ray flux (Degenaar et al., 2010). We would therefore expect an increase in optical flux by mag, provided it is dominated by an accretion disk (van Paradijs & McClintock, 1994). Degenaar et al. (2010) measured an optical increase of 3.2 mag, well within the scatter of the van Paradijs & McClintock (1994) relation. The observed increase in optical brightness is therefore consistent with the reprocessing of the X-ray burst in the accretion disk that one might expect in a RLOF LMXB.
Finally, we briefly consider the possibility that J1735 is a RLOF LMXB that is not X-ray faint because it is accreting at very low rate, but due to a very high inclination prohibiting us to see the bright central X-ray source. A number of such LMXBs are known and are referred to as Accretion Disk Coronae (ADC) sources because their X-ray emission comes from a small fraction of the central source that is scattered in material around the disk (e.g., White & Holt, 1982; Tomaru et al., 2023). If J1735 is an ADC source, the mass-accretion rate inferred from the observed X-ray luminosity is highly underestimated, and that it could in fact be as high as that expected for a 7.5-d binary. However, the multi-wavelength properties of J1735 do not show indications of a high inclination (such as a high X-ray absorption, dipping X-ray variability, or a flat optical/infrared spectral energy distribution). Moreover, in this scenario it would be difficult to explain why the system significantly brightened during its burst, by a factor of in X-rays and by mag in the UV/optical band (Degenaar et al., 2010). Finally, we note that the long duration of that burst is consistent with that seen in other low- NS-LMXBs (e.g., Falanga et al., 2009; Bozzo et al., 2015; Degenaar et al., 2011; Degenaar et al., 2013). The ADC scenario therefore does not seem likely for J1735.
4.3.3 Scenario 2: A wind-fed system
Given the propensity for giant stars to drive dense stellar winds, it is worth investigating if the companion of J1735 is able to drive a strong enough wind to produce the observed X-ray emission. Schröder & Cuntz (2005) developed a semi-empirical formula for the mass loss of cool stellar winds, building upon Reimers (1975) law. The mass loss rate, , according to this relation, can be described as such:
| (3) |
where , and are the star’s luminosity, radius and mass in solar units, respectively, and and are the star’s surface gravity and solar surface gravity, respectively and is a fitting parameter given as yr-1.
As we have already established that a star would fill its Roche Lobe, we can only investigate the wind scenario if we assume that the radius of the companion star is on the lower end () of the range given in Section 4.1.3 (van Belle et al., 2021). Making a simple assumption on the luminosity of the companion based from the Stefan-Boltzmann law, and assuming the same values for mass and surface gravity as in Section 4.1.4, we derive and thus yr-1.
By adopting a Bondi-Hoyle-Lyttleton formalism (Hoyle & Lyttleton, 1941; Bondi & Hoyle, 1944), we can estimate the mass accretion rate on to the NS in the wind-accreting scenario:
| (4) |
Where is the orbital separation, is the binary mass ratio ( in this case, as opposed to the inverse in Section 4.3.2), and is the wind velocity parameterized as a fraction of the companion star’s escape velocity (see Willems & Kolb, 2003). As discussed above, if the 7.5 d periodicity measured in Section 4.2 is , then cm, assuming the mass of each star is .
Using , as well as and yr-1, we estimate yr-1, assuming that the wind velocity is equivalent to the escape velocity of the companion (). This is inconsistent with the calculated in Section 4.3.1. Based on our assumptions, we find that Bondi-Hoyle-Lyttleton accretion is highly unlikely to be driving the observed properties of J1735.
Considering that a 9 star may not quite fill the Roche Lobe, especially if some of the assumptions regarding the mass ratio change even slightly, it is possible that its stellar wind is gravitationally focused in the direction of the NS (Friend & Castor, 1982; de Val-Borro et al., 2009). de Val-Borro et al. (2017) calculate that the mass-accretion rate on to the compact object can be up to 5–20% of the total wind mass-loss rate from the donor in the focused wind case. For J1735, this would imply that can be as high as yr-1, adopting the derived for a companion above. This is well within the calculated range of in Section 4.3.1. We do emphasize that this calculation depends heavily on many assumptions about the binary components, and this scenario only works if the companion star is a relatively small giant.
5 Conclusions
In this work, we have examined the - and -band spectrum of the nIR counterpart to the VFXB 1RXH J173523.7354013. We find that the -band spectrum is dominated by the companion star, which we derive to be a late G or early K giant. This makes J1735 the second NS system originally identified as a VFXB now known to have a giant companion, after IGR J174452747 (Shaw et al., 2020). Timing analysis of nIR photometry of J1735 has revealed a strong modulation on a period of d, which we postulate to be the orbital period of the system. Other periods are present in the periodograms, but only the d period is consistently detected above 99% confidence, regardless of the choice of comparison star.
Given the most likely properties of the binary, we consider the most likely accretion mode for J1735 to involve Roche lobe overflow, rather than accretion from the giant companion’s wind. However, we cannot rule out accretion from a focused wind. RLOF requires a large mass-transfer rate ( yr-1) and thus mass-transfer on to the NS would have to be highly non-conservative in order to be consistent with the calculated on to the NS (Section 4.3.1). Alternatively, we hypothesize that J1735 could be a transient system that is currently in a state in which its disk is building up to an outburst. The fact that it is much brighter than typical LMXBs in such a ‘quiescent’ state could be explained by its large accretion disk. This scenario predicts that the source at one point would exhibit a very bright and long outburst, appearing like a Z source.
In order to solidify our conclusions surrounding J1735, the next step will be to confirm with a nIR radial velocity campaign, which will not only confirm the orbital period, but will also allow us to derive the mass function of the binary, providing more constraints on the true mass of the companion. If the source is indeed the RLOF LMXB we claim it to be, then we may also be able to detect ellipsoidal modulations in time-series photometry, which will allow us to model the inclination of the binary.
Regardless of the true nature of accretion in J1735, it is becoming clear that compact objects with evolved companions are emerging as a significant contributor to the growing population of faint X-ray sources. Shaw et al. (2020) uncovered one symbiotic X-ray binary (IGR J174452747), as well as a cataclysmic variable with a subgiant donor (3XMM J174417.2293944) in their follow-up of sources discovered in a systematic X-ray survey of the Galactic bulge (Bahramian et al., 2021).
6 Acknowledgments
We thank the anonymous referee for their insightful comments that helped improve this manuscript. AWS thanks the hospitality of the Anton Pannekoek Institute, where part of this work was carried out. COH is supported by NSERC Discovery Grant RGPIN-2016-04602.
Based on observations collected at the European Organisation for Astronomical Research in the Southern Hemisphere under ESO programme 0102.D-0650(C). This research made use of astropy (https://www.astropy.org), a community-developed core python package for Astronomy (Astropy Collaboration et al., 2013, 2018).
Data Availability
The SINFONI observations of 1RXH J173523.7354013 are publicly available in the European Southern Observatory Science Archive Facility, along with the corresponding raw and processed calibration data. The VVV data used in this work are publicly available from the VISTA Science Archive.
References
- Altamirano et al. (2010) Altamirano D., et al., 2010, ApJL, 712, L58
- Armas Padilla et al. (2011) Armas Padilla M., Degenaar N., Patruno A., Russell D. M., Linares M., Maccarone T. J., Homan J., Wijnands R., 2011, MNRAS, 417, 659
- Armas Padilla et al. (2013a) Armas Padilla M., Degenaar N., Russell D. M., Wijnands R., 2013a, MNRAS, 428, 3083
- Armas Padilla et al. (2013b) Armas Padilla M., Degenaar N., Wijnands R., 2013b, MNRAS, 434, 1586
- Arnason et al. (2015) Arnason R. M., Sivakoff G. R., Heinke C. O., Cohn H. N., Lugger P. M., 2015, ApJ, 807, 52
- Astropy Collaboration et al. (2013) Astropy Collaboration et al., 2013, A&A, 558, A33
- Astropy Collaboration et al. (2018) Astropy Collaboration et al., 2018, AJ, 156, 123
- Bahramian & Degenaar (2022) Bahramian A., Degenaar N., 2022, arXiv e-prints, p. arXiv:2206.10053
- Bahramian et al. (2014) Bahramian A., Gladstone J. C., Heinke C. O., Wijnands R., Kaur R., Altamirano D., 2014, MNRAS, 441, 640
- Bahramian et al. (2021) Bahramian A., et al., 2021, MNRAS, 501, 2790
- Bailer-Jones et al. (2021) Bailer-Jones C. A. L., Rybizki J., Fouesneau M., Demleitner M., Andrae R., 2021, AJ, 161, 147
- Bildsten & Brown (1997) Bildsten L., Brown E. F., 1997, ApJ, 477, 897
- Bondi & Hoyle (1944) Bondi H., Hoyle F., 1944, MNRAS, 104, 273
- Bozzo et al. (2015) Bozzo E., Kuulkers E., Ferrigno C., 2015, The Astronomer’s Telegram, 7106, 1
- Bozzo et al. (2022) Bozzo E., Romano P., Ferrigno C., Oskinova L., 2022, Monthly Notices of the Royal Astronomical Society, 513, 42
- Burderi et al. (2009) Burderi L., Riggio A., di Salvo T., Papitto A., Menna M. T., D’Aì A., Iaria R., 2009, A&A, 496, L17
- Campana & Stella (2003) Campana S., Stella L., 2003, ApJ, 597, 474
- Cardelli et al. (1989) Cardelli J. A., Clayton G. C., Mathis J. S., 1989, ApJ, 345, 245
- Carotenuto et al. (2022) Carotenuto F., Corbel S., Tzioumis A., 2022, MNRAS, 517, L21
- Comerón et al. (2004) Comerón F., Torra J., Chiappini C., Figueras F., Ivanov V. D., Ribas S. J., 2004, A&A, 425, 489
- Corbet et al. (2008) Corbet R. H. D., Sokoloski J. L., Mukai K., Markwardt C. B., Tueller J., 2008, ApJ, 675, 1424
- Coriat et al. (2012) Coriat M., Fender R. P., Dubus G., 2012, MNRAS, 424, 1991
- Corral-Santana et al. (2013) Corral-Santana J. M., Casares J., Muñoz-Darias T., Rodríguez-Gil P., Shahbaz T., Torres M. A. P., Zurita C., Tyndall A. A., 2013, Science, 339, 1048
- Degenaar & Wijnands (2010) Degenaar N., Wijnands R., 2010, A&A, 524, A69
- Degenaar et al. (2010) Degenaar N., et al., 2010, MNRAS, 404, 1591
- Degenaar et al. (2011) Degenaar N., Wijnands R., Kaur R., 2011, MNRAS, 414, L104
- Degenaar et al. (2013) Degenaar N., Miller J. M., Wijnands R., Altamirano D., Fabian A. C., 2013, ApJL, 767, L37
- Degenaar et al. (2014) Degenaar N., et al., 2014, ApJ, 792, 109
- Degenaar et al. (2017) Degenaar N., Pinto C., Miller J. M., Wijnands R., Altamirano D., Paerels F., Fabian A. C., Chakrabarty D., 2017, MNRAS, 464, 398
- Earl et al. (2023) Earl N., et al., 2023, astropy/specutils: v1.12.0, doi:10.5281/zenodo.10016569, https://doi.org/10.5281/zenodo.10016569
- Eggleton (1983) Eggleton P. P., 1983, ApJ, 268, 368
- Eisenhauer et al. (2003) Eisenhauer F., et al., 2003, in Iye M., Moorwood A. F. M., eds, Proc. SPIEVol. 4841, Instrument Design and Performance for Optical/Infrared Ground-based Telescopes. pp 1548–1561 (arXiv:astro-ph/0306191), doi:10.1117/12.459468
- Falanga et al. (2009) Falanga M., Cumming A., Bozzo E., Chenevez J., 2009, A&A, 496, 333
- Förster Schreiber (2000) Förster Schreiber N. M., 2000, AJ, 120, 2089
- Friend & Castor (1982) Friend D. B., Castor J. I., 1982, ApJ, 261, 293
- Gaia Collaboration et al. (2016) Gaia Collaboration et al., 2016, A&A, 595, A1
- Gaia Collaboration et al. (2021) Gaia Collaboration et al., 2021, A&A, 649, A1
- Gaia Collaboration et al. (2022) Gaia Collaboration et al., 2022, arXiv e-prints, p. arXiv:2208.00211
- Galloway & Keek (2021) Galloway D. K., Keek L., 2021, in Belloni T. M., Méndez M., Zhang C., eds, Astrophysics and Space Science Library Vol. 461, Timing Neutron Stars: Pulsations, Oscillations and Explosions. pp 209–262 (arXiv:1712.06227), doi:10.1007/978-3-662-62110-3_5
- Garcia et al. (2001) Garcia M. R., McClintock J. E., Narayan R., Callanan P., Barret D., Murray S. S., 2001, ApJL, 553, L47
- Ghosh et al. (2019) Ghosh S., Mondal S., Das R., Khata D., 2019, MNRAS, 484, 4619
- Ghosh et al. (2021) Ghosh S., Ojha D. K., Ninan J. P., 2021, MNRAS, 501, 4596
- Gusinskaia et al. (2020) Gusinskaia N. V., et al., 2020, MNRAS, 492, 1091
- Hameury (2020) Hameury J. M., 2020, Advances in Space Research, 66, 1004
- Hasinger & van der Klis (1989) Hasinger G., van der Klis M., 1989, A&A, 225, 79
- Heinke et al. (2015) Heinke C. O., Bahramian A., Degenaar N., Wijnand s R., 2015, MNRAS, 447, 3034
- Hernández Santisteban et al. (2019) Hernández Santisteban J. V., et al., 2019, MNRAS, 488, 4596
- Homan et al. (2010) Homan J., et al., 2010, ApJ, 719, 201
- Hoyle & Lyttleton (1941) Hoyle F., Lyttleton R. A., 1941, MNRAS, 101, 227
- Iaria et al. (2021) Iaria R., Sanna A., Di Salvo T., Gambino A. F., Mazzola S. M., Riggio A., Marino A., Burderi L., 2021, A&A, 646, A120
- Iben & Tutukov (1996) Iben Icko J., Tutukov A. V., 1996, ApJS, 105, 145
- Ivanov et al. (2004) Ivanov V. D., Rieke M. J., Engelbracht C. W., Alonso-Herrero A., Rieke G. H., Luhman K. L., 2004, ApJS, 151, 387
- Jonker et al. (2003) Jonker P. G., Méndez M., Nelemans G., Wijnands R., van der Klis M., 2003, MNRAS, 341, 823
- Kausch et al. (2015) Kausch W., et al., 2015, A&A, 576, A78
- King & Wijnands (2006) King A. R., Wijnands R., 2006, MNRAS, 366, L31
- Kleinmann & Hall (1986) Kleinmann S. G., Hall D. N. B., 1986, ApJS, 62, 501
- Knevitt et al. (2014) Knevitt G., Wynn G. A., Vaughan S., Watson M. G., 2014, MNRAS, 437, 3087
- Kramida et al. (2021) Kramida A., Yu. Ralchenko Reader J., and NIST ASD Team 2021, NIST Atomic Spectra Database (ver. 5.9), [Online]. Available: https://physics.nist.gov/asd [2022, September 9] National Institute of Standards and Technology, Gaithersburg, MD.
- Lasota (2001) Lasota J.-P., 2001, New Astron. Rev., 45, 449
- Lomb (1976) Lomb N. R., 1976, Ap&SS, 39, 447
- Maccarone & Patruno (2013) Maccarone T. J., Patruno A., 2013, MNRAS, 428, 1335
- Maccarone et al. (2015) Maccarone T. J., et al., 2015, arXiv e-prints, p. arXiv:1501.02769
- Marino et al. (2019) Marino A., et al., 2019, A&A, 627, A125
- McClintock et al. (2001) McClintock J. E., Garcia M. R., Caldwell N., Falco E. E., Garnavich P. M., Zhao P., 2001, ApJL, 551, L147
- Menou et al. (1999) Menou K., Esin A. A., Narayan R., Garcia M. R., Lasota J., McClintock J. E., 1999, ApJ, 520, 276
- Mereminskiy et al. (2017) Mereminskiy I. A., Grebenev S. A., Sunyaev R. A., 2017, Astronomy Letters, 43, 656
- Messineo et al. (2017) Messineo M., Zhu Q., Menten K. M., Ivanov V. D., Figer D. F., Kudritzki R.-P., Chen C. H. R., 2017, ApJ, 836, 65
- Messineo et al. (2021) Messineo M., Figer D. F., Kudritzki R.-P., Zhu Q., Menten K. M., Ivanov V. D., Chen C. H. R., 2021, AJ, 162, 187
- Meyer et al. (1998) Meyer M. R., Edwards S., Hinkle K. H., Strom S. E., 1998, ApJ, 508, 397
- Minniti et al. (2010) Minniti D., et al., 2010, New Astronomy, 15, 433
- Muno et al. (2005) Muno M. P., Pfahl E., Baganoff F. K., Brandt W. N., Ghez A., Lu J., Morris M. R., 2005, ApJL, 622, L113
- Narayan & Yi (1995) Narayan R., Yi I., 1995, ApJ, 452, 710
- Nelson et al. (1986) Nelson L. A., Rappaport S. A., Joss P. C., 1986, ApJ, 304, 231
- Papitto et al. (2013) Papitto A., et al., 2013, MNRAS, 429, 3411
- Pfahl et al. (2002) Pfahl E., Rappaport S., Podsiadlowski P., 2002, ApJL, 571, L37
- Ramirez et al. (1997) Ramirez S. V., Depoy D. L., Frogel J. A., Sellgren K., Blum R. D., 1997, AJ, 113, 1411
- Rayner et al. (2009) Rayner J. T., Cushing M. C., Vacca W. D., 2009, ApJS, 185, 289
- Rees et al. (1982) Rees M. J., Begelman M. C., Blandford R. D., Phinney E. S., 1982, Nature, 295, 17
- Reimers (1975) Reimers D., 1975, Memoires of the Societe Royale des Sciences de Liege, 8, 369
- Rutledge et al. (2001) Rutledge R. E., Bildsten L., Brown E. F., Pavlov G. G., Zavlin V. E., 2001, ApJ, 551, 921
- Saito et al. (2012) Saito R. K., et al., 2012, A&A, 537, A107
- Sakano et al. (2005) Sakano M., Warwick R. S., Decourchelle A., Wang Q. D., 2005, MNRAS, 357, 1211
- Sanna et al. (2018) Sanna A., et al., 2018, A&A, 610, L2
- Sanna et al. (2022) Sanna A., et al., 2022, MNRAS, 516, L76
- Scargle (1982) Scargle J. D., 1982, ApJ, 263, 835
- Schröder & Cuntz (2005) Schröder K. P., Cuntz M., 2005, ApJL, 630, L73
- Shaw et al. (2017) Shaw A. W., Heinke C. O., Degenaar N., Wijnands R., Kaur R., Forestell L. M., 2017, MNRAS, 471, 2508
- Shaw et al. (2020) Shaw A. W., et al., 2020, MNRAS, 492, 4344
- Sidoli et al. (2011) Sidoli L., Paizis A., Mereghetti S., Götz D., Del Santo M., 2011, MNRAS, 415, 2373
- Skrutskie et al. (2006) Skrutskie M. F., et al., 2006, AJ, 131, 1163
- Smette et al. (2015) Smette A., et al., 2015, A&A, 576
- Stoop et al. (2021) Stoop M., et al., 2021, MNRAS, 507, 330
- Strohmayer & Keek (2017) Strohmayer T., Keek L., 2017, ApJL, 836, L23
- Tody (1986) Tody D., 1986, in Crawford D. L., ed., Society of Photo-Optical Instrumentation Engineers (SPIE) Conference Series Vol. 627, Instrumentation in astronomy VI. p. 733
- Tomaru et al. (2023) Tomaru R., Done C., Odaka H., Tanimoto A., 2023, MNRAS, 523, 3441
- Vaughan et al. (2003) Vaughan S., Edelson R., Warwick R. S., Uttley P., 2003, MNRAS, 345, 1271
- Villaume et al. (2017) Villaume A., Conroy C., Johnson B., Rayner J., Mann A. W., van Dokkum P., 2017, ApJS, 230, 23
- Wallace & Hinkle (1997) Wallace L., Hinkle K., 1997, ApJS, 111, 445
- Webbink et al. (1983) Webbink R. F., Rappaport S., Savonije G. J., 1983, ApJ, 270, 678
- White & Holt (1982) White N. E., Holt S. S., 1982, ApJ, 257, 318
- Wijnands (2008) Wijnands R., 2008, in Bandyopadhyay R. M., Wachter S., Gelino D., Gelino C. R., eds, American Institute of Physics Conference Series Vol. 1010, A Population Explosion: The Nature & Evolution of X-ray Binaries in Diverse Environments. pp 382–386 (arXiv:0801.0953), doi:10.1063/1.2945081
- Wijnands et al. (2002) Wijnands R., Guainazzi M., van der Klis M., Méndez M., 2002, ApJL, 573, L45
- Wijnands et al. (2006) Wijnands R., et al., 2006, A&A, 449, 1117
- Wijnands et al. (2015) Wijnands R., Degenaar N., Armas Padilla M., Altamirano D., Cavecchi Y., Linares M., Bahramian A., Heinke C. O., 2015, MNRAS, 454, 1371
- Willems & Kolb (2003) Willems B., Kolb U., 2003, MNRAS, 343, 949
- Wu et al. (2010) Wu Y. X., Yu W., Li T. P., Maccarone T. J., Li X. D., 2010, ApJ, 718, 620
- Yungelson et al. (2006) Yungelson L. R., Lasota J. P., Nelemans G., Dubus G., van den Heuvel E. P. J., Dewi J., Portegies Zwart S., 2006, A&A, 454, 559
- de Val-Borro et al. (2009) de Val-Borro M., Karovska M., Sasselov D., 2009, ApJ, 700, 1148
- de Val-Borro et al. (2017) de Val-Borro M., Karovska M., Sasselov D. D., Stone J. M., 2017, MNRAS, 468, 3408
- di Salvo et al. (2008) di Salvo T., Burderi L., Riggio A., Papitto A., Menna M. T., 2008, MNRAS, 389, 1851
- in’t Zand et al. (2005) in’t Zand J. J. M., Cornelisse R., Méndez M., 2005, A&A, 440, 287
- in’t Zand et al. (2007) in’t Zand J. J. M., Jonker P. G., Markwardt C. B., 2007, A&A, 465, 953
- van Belle et al. (2021) van Belle G. T., et al., 2021, ApJ, 922, 163
- van Haaften et al. (2012) van Haaften L. M., Voss R., Nelemans G., 2012, preprint, (arXiv:1206.0691)
- van Paradijs & McClintock (1994) van Paradijs J., McClintock J. E., 1994, A&A, 290, 133
- van den Eijnden et al. (2018) van den Eijnden J., et al., 2018, MNRAS, 475, 2027
- van den Eijnden et al. (2021) van den Eijnden J., et al., 2021, arXiv e-prints, p. arXiv:2107.05286