When and how does ram pressure stripping in low-mass satellite galaxies enhance star formation
Abstract
We investigate how a satellite’s star formation rate (SFR) and surviving gas respond to ram pressure stripping in various environments. Using a suite of high-resolution “wind-tunnel” simulations with radiative cooling, star formation, and supernovae feedback, we model the first infall orbit of a low-mass disk galaxy ( ) in different host halos, ranging from Milky Way-like to cluster hosts. When the ram pressure is moderate, we find that the stripping satellite shows an enhanced SFR relative to the isolated control case, despite gas loss due to stripping. The SFR enhancement is caused, not directly by compression, but by ram pressure-driven mass flows, which can increase the dense gas fraction in the central disk regions. The spatially-resolved star formation main sequence and Kennicutt-Schmidt relations in our simulations are consistent with recent findings of the VERTICO and GASP surveys. Our results predict the environmental signals of RPS in future multiwavelength, high-angular resolution observations: the star formation and gas surface densities will be centralized, and symmetrically enhanced within the stripping radius.
1 Introduction
A galaxy can either be star-forming or quenched, depending on internal and environmental processes (Kauffmann et al., 2004; Baldry et al., 2006; Peng et al., 2010). For the central galaxies within halos, internal processes such as supernova and AGN feedback are the main star formation regulators (Croton et al., 2006; Dalla Vecchia & Schaye, 2008). This explains the “main sequence” of star formation over cosmic time: a tight correlation between the star formation rate (SFR) and stellar mass () of galaxies (Speagle et al., 2014). For satellite galaxies, environmental factors from the interactions with a central halo become significant: satellites show a strong observational bias to be ‘red’, or star formation quenched, compared with their central counterparts at the same stellar masses (Peng et al., 2012; Wetzel et al., 2012; Phillips et al., 2014). The environmental quenching of satellite galaxies is also ubiquitous in cosmological simulations (Tremmel et al., 2019; Wright et al., 2019; Appleby et al., 2020; Donnari et al., 2021a, b).
Despite the consensus of environmental quenching in observations and simulations, uncertainties remain in the mass dependence and the scatter of the quenching effectiveness (Donnari et al., 2021a). The uncertainties likely arise from the complex physical processes during the satellite-environment interactions (see recent review by Cortese et al. 2021), of which the dominant is ram pressure stripping (RPS; Gunn & Gott 1972), the direct removal of the satellite’s interstellar medium (ISM) by a host halo medium. RPS galaxies, identified by unidirectional gas tails and little stellar disk deformation, have been observed in several clusters (van Gorkom, 2004; Boselli et al., 2006; Sun et al., 2007; Poggianti et al., 2016; Deb et al., 2022) as well as in both idealized (e.g., Abadi et al. 1999; Quilis et al. 2000; Schulz & Struck 2001; Roediger & Brüggen 2006; Jáchym et al. 2007; McCarthy et al. 2008) and cosmological simulations (Bahé et al., 2012; Yun et al., 2019; Rohr et al., 2023). Although the hallmark of RPS is gas removal and, therefore, the eventual quenching of star formation (Boselli et al., 2006; Crowl & Kenney, 2008), recent detailed observations have shown that the early stages of RPS may have complex effects on both the ISM phase distribution and SFRs. Under RPS, the satellite’s star formation can be triggered (Ebeling et al., 2014; Jáchym et al., 2019; Poggianti et al., 2019), the SFR globally (Vulcani et al., 2018; Roberts et al., 2021; Kolcu et al., 2022; Molnár et al., 2022) or locally (Vulcani et al., 2020) enhanced, and the molecular-to-atomic gas ratio boosted (Moretti et al., 2020).
The interplay between RPS and star formation is key to understanding environmental quenching, and has been explored in various controlled hydrodynamical simulations. Multiple simulations analyzed the star formation triggering- or enhancing-potential of RPS (Schulz & Struck, 2001; Kapferer et al., 2009; Tonnesen & Bryan, 2012; Roediger et al., 2014; Bekki, 2014; Steinhauser et al., 2016; Ruggiero & Lima Neto, 2017; Lee et al., 2020), but the physical reasons behind the enhancement are unclear. Ram pressure-driven shock passages can trigger local boosts to the SFR, but have little global effects (Roediger et al., 2014); pressure enhancement in the wind-leading halves of the galaxies undergoing stripping suggests that compression likely enhances the star formation efficiency (Troncoso-Iribarren et al., 2020); ram pressure-induced radial gas inflows can modify the star formation morphology, shifting it to the central regions with higher SFR (Schulz & Struck, 2001; Tonnesen & Bryan, 2012; Lee et al., 2020). There is a need to examine the physical causes of RPS-enhanced star formation in simulations, and to directly compare with recent observations.
In this work, we study the complicated effects of RPS on the ISM distribution and SFRs. (i) We simulate a low-mass spiral galaxy (lowest resolved in Donnari et al. 2021a, with tension in the quenched fractions) undergoing RPS in different environments, from a Milky Way-like to a cluster halo, and examine the galaxy’s gas and SFR response; (ii) For each host halo, we model a realistic infall orbit with time-varying ram pressure profiles; (iii) We analyze the local SFR-mass relations at comparable spatial resolutions with recent high angular resolution observations (Vulcani et al., 2020; Jiménez-Donaire et al., 2023); and finally (iv) We compare and identify key physical causes of RPS-enhanced star formation.
The structure of this paper is as follows. In §2 we introduce the methodology, with §2.1 on the satellite galaxy model, §2.2 on the infall orbits, and §2.3 the simulation initial conditions. We present the simulation global results in §3: the time evolution of star formation and the surviving gas (§3.1), and the gas morphology and kinematics (§3.2). Then, §4 compares the spatially resolved SFR-mass relations ( and ) between the stripping and isolated galaxy sets. We discuss our results in §5: the impact of RPS on star formation (§5.1), predictions for observations (§5.2), and limitations of our methodology (§5.3). §6 summarizes the key findings.
2 Methodology
We run a suite of three-dimensional “wind-tunnel” simulations using the adaptive mesh refinement (AMR) code Enzo (Bryan et al., 2014). The simulation volume is a kpc cube with a root grid resolution. We allow up to five levels of refinement, giving a highest spatial resolution of pc (marginally resolving giant molecular clouds). To model the radiative cooling of the multiphase gas, we use the Grackle chemistry and cooling library111https://grackle.readthedocs.io/ (Smith et al., 2017), which calculates photoheating and photoionization from the UV background of Haardt & Madau (2012). We use the star formation recipe of Goldbaum et al. (2015) with the following parameters: Once a gas cell reaches the Jeans criterion with a number density threshold of , it forms star particles (including regular stars and Type II supernovae) with a efficiency. The star particles, now followed in our simulations as active particles, subsequently deposit energy into the gas in the forms of stellar and supernovae feedback, under the Goldbaum et al. (2016) feedback model, which includes the terminal momentum input from the number of supernovae expected to go off during a given timestep, adding any additional energy in the form of thermal energy.
We use yt, a multi-code toolkit for analyzing and visualizing astrophysical simulation data (Turk et al., 2011), to create slices and projections, and to select the disk gas and the active star particles for subsequent analyses.
2.1 The galaxy
Our galaxy is placed at the center of the -kpc cubical simulation volume at (81, 81, 81) kpc. We choose a galaxy of low stellar mass , motivated by the lowest satellite examined in Donnari et al. (2021a) using the IllustrisTNG cosmological simulations (Weinberger et al., 2017; Pillepich et al., 2018). Table 1 summarizes the global parameters of the satellite galaxy.
| Stellar Disk | Dark Matter | Gas Disk | |||||
|---|---|---|---|---|---|---|---|
| () | (kpc) | (kpc) | () | (kpc) | () | (kpc) | (kpc) |
| 2.5 | 0.5 | 5.93e-25 | 11.87 | 3.75 | 0.75 | ||
Among the three components in Table 1, our simulations model the stellar disk and dark matter as static gravitational potential fields. The static stellar disk potential is under the Plummer-Kuzmin model (Miyamoto & Nagai, 1975) with the scale length () and height () of and kpc, respectively (from the baryonic mass-stellar disk size scaling relation; Wu 2018). We model the cold dark matter potential under the spherical Burkert model (Burkert, 1995; Mori & Burkert, 2000), which is selected to better match the observational rotation curves of low-mass galaxies (Salucci & Burkert, 2000; Blok et al., 2008). Given the stellar mass (Table 1), we obtain the circular velocity from the observational baryonic Tully-Fisher relation (Lelli et al., 2019; McGaugh et al., 2021), which gives the dark matter central density and scale radius (Table 1).
The gas disk in Table 1 is followed in our simulations with AMR. We adopt the gas mass from observed gas-(H i and H2 combined) to-stellar mass ratio (Calette et al., 2018), and the disk size from the size ratio (Swaters et al., 2002). This ensures that the resulting galaxy model is consistent with the observed scaling relations. The gas density is distributed under a softened exponential disk model (see Tonnesen & Bryan, 2009, 2010, eqn. 1), and the temperature and pressure are calculated to maintain hydrostatic equilibrium in the disk with the surrounding ICM. The rotational velocity is then calculated to balance the gravitational force and the combination of the centrifugal force and the pressure gradient.
2.2 The orbits
We model the time-varying infalling orbits — satellites travelling from the host’s virial radius to the pericenter location — of three host halos: a “Milky Way-like” host halo of , a “group” halo of , and a “cluster” halo of . The host mass selection is motivated by the mass-dependent quenched fraction disagreements in Donnari et al. (2021a): a satellite of tends to be under-quenched in the TNG300 simulations compared with SDSS observations for the low-mass hosts , but over-quenched in simulations for the higher-mass hosts (see Donnari et al., 2021a, Fig 9). Our host mass sampling ( ) is to span the mass range over which the Donnari et al. (2021a) turnover in quenching effectiveness happens for the satellite of .
In this subsection, we describe our two-step orbit modeling process: (1) Satellite orbit kinematics (Table 2), which gives the position and velocity of the satellite galaxy as a function of infalling time; and (2) Host halo radial profiles (Table 3), which gives the density and temperature of the host’s gaseous halo medium as a function of radius.
| Case(1) | |||||||||
|---|---|---|---|---|---|---|---|---|---|
| () | (kpc) | (kpc) | () | () | (Mpc) | ||||
| Milky-Way | 8.81 | 211 | 75 | 143 | (0.655, 0.832) | 265 | 0.674 | 1127 | |
| Group | 7.08 | 455 | 149 | 308 | (0.603, 0.786) | 565 | 0.666 | 1165 | |
| Cluster | 5.62 | 949 | 278 | 663 | (0.53, 0.782) | 1236 | 0.692 | 1164 |
Note. — (1) The case names represent the physical context of the central halos. (2) The present-day (redshift-zero) concentration values from Ludlow et al. (2014). (3) The virial radii (), and the pericentric radii () and velocities () from the Gala-generated orbits, see §2.2. (4) The virial velocities defined as , following Wetzel (2011). (5) The tangential () and radial () velocity magnitudes at in units of the virial velocity (; see note 4) from Wetzel (2011), used as velocity initial conditions for the orbit integration. (6) The resulting orbital eccentricities. (7) The infalling time from to .
We use the Galactic Dynamics package Gala (Price-Whelan, 2017; Price-Whelan et al., 2020) to perform time integration of the satellite orbits. First, we use Gala to construct the three host halos’ gravitational potential profiles, adopting an NFW halo structure (Navarro et al., 1996), and redshift-zero concentration values ( in Table 2; Ludlow et al. 2014). For simplicity, we assume that the satellite travels as a point mass when orbiting the host halos. The orbital integration begins at the host’s virial radius (from the Gala-generated NFW profiles), and takes the best-fit values of Wetzel (2011) as velocity initial conditions, see in Table 2. With the position and velocity initial inputs, we then use the Gala orbital integrator to integrate for a sufficient time (e.g., 100 Gyr) to ensure we capture many stable orbits, and focus on the branch from to pericenter . The resulting orbits contain the satellite’s position and velocity as a function of infalling time, as summarized in Table 2.
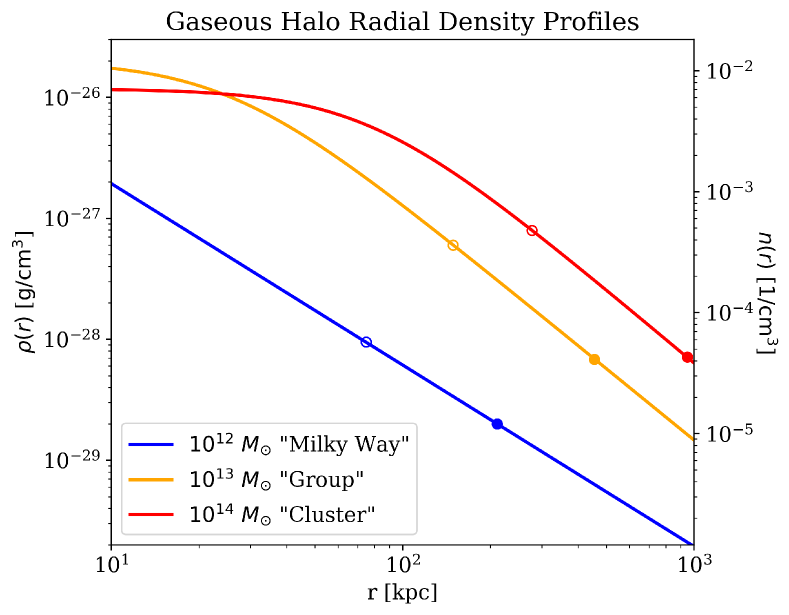
We model the extended, diffuse gaseous halos of the hosts as an isothermal sphere with a -profile in density (Cavaliere & Fusco-Femiano, 1976; Arnaud, 2009). The spherical model is a relatively simple three-parameter model capable of reproducing the X-ray surface brightness observations for a range of galaxies (Makino et al., 1998; O’Sullivan et al., 2003; Anderson & Bregman, 2011; Dai et al., 2012). It gives the gaseous halo density at a distance from the center as,
| (1) |
where is the core density, is the core radius, and is the density slope at large radii. Among our three host cases, we apply the generic -modeling for the group and cluster cases, but it breaks down at the low mass of , where we instead use observational data of the Milky Way (Miller & Bregman, 2013, 2015; Salem et al., 2015; Voit, 2019). The parameters of the halo models are summarized in Table 3 below.
| Case(1) | Refs(4) | ||||
|---|---|---|---|---|---|
| () | (kpc) | (K) | |||
| Milky-Way | 1.35 | 2.73 | 0.5 | 2.51E6 | MB15 |
| Case(1) | Refs(4) | ||||
| () | (kpc) | (K) | |||
| Group | 0.0121 | 25 | 0.655 | 5.53e6 | KS01 |
| Cluster | 0.0071 | 76 | 0.675 | 2.02e7 | KS01 |
Note. — (1). Case names as in Table 2. We list the Milky Way case separately from the group and cluster cases because of the different methods; see §2.2. (2). Best fit parameter for the modified profile of Miller & Bregman (2015), which fits and of a profile together (equations 1 and 2). (3). The constant factor in equation 2 to match with the LMC-constrained pericentric conditions of the Milky Way halo (Salem et al., 2015). (4). References for our adopted -profile (or modified in the Milky Way case) parameters, , , and the isothermal gas halo temperatures . MB15: Miller & Bregman (2015); KS01: Komatsu & Seljak (2001).
For the “Milky Way” host case, we refer to the Miller & Bregman (2015) parameterization of a modified profile,
| (2) |
where , , and are defined as in equation 1 above (see Miller & Bregman, 2015, eqn. 2). However, this profile becomes less constrained at the large radii of our satellite’s orbit (Table 2), and tends to underestimate densities compared with other studies (see Voit, 2019, Fig. 3). To address this density underestimation at large radii, we boost the best-fit Miller & Bregman (2015) model by a constant factor , obtained by matching the LMC-constrained pericentric (at 48.2 kpc) density from Salem et al. (2015).
For the galaxy group and cluster cases, we obtain the three parameters in the model (equation 1) as follows: We adopt and from the gas halo profiles of Komatsu & Seljak (2001), and solve for as an integration constant by assuming the gas-to-total mass fraction at is (Lovisari et al. 2015; ). The gas mass within under a -profile in density (equation 1) can be written as,
| (3) |
where we supply , from Komatsu & Seljak (2001), and from the Gala-generated host NFW halos, and the relation from Lovisari et al. (2015). Solving equation 3 for the integration constant gives the central mass density and hence the number density .
Figure 1 shows the density profiles of the three gaseous halo cases shown in Table 3, where we annotate the infall orbits’ initial (virial radius) and final (pericenter) locations from Table 2. At a given time of an infall orbit, the orbital density is given by the density profiles in Figure 1, taking the radius from the Gala-generated orbits. The resulting orbital density ranges (densities between the solid and empty circles in Figure 1) for the group and the cluster cases are relatively similar, but the cluster case has a higher pericentric velocity (Table 2), which leads to about five times the ram pressure of the group case at the pericenter, see Section 2.3 below for details.
2.3 The simulations
Our suite of four simulations includes three “wind-tunnel” runs and one “isolated galaxy” run. In each of the “wind-tunnel” runs, we introduce a 45-degree-inclined boundary inflow (velocity normal vector ) from the , corner of the simulation box. Instead of a purely face-on or edge-on wind, we choose the 45∘ inclination angle to investigate the ram pressure effects both perpendicular and parallel to the disk. The inflow is modeling the ram pressure ‘wind’, which carries the time-varying orbital conditions (gas density, temperature, and velocities) set in §2.2. The metallicities of the inflow gas (the ‘wind’) and the initial galaxy gas disk (see §2.1) are set as , , respectively, which are subsequently used as tracers for galactic versus wind material. The isolated galaxy run is a control case without inflow, but otherwise has the same setup of galaxy structure, radiative cooling, star formation, and feedback as in the wind runs.
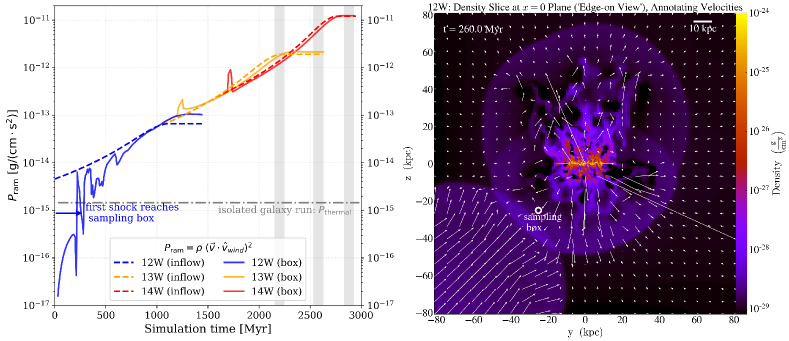
We summarize key aspects of the simulations in Table 4 and Figure 2. The time-dependent ram pressure is defined as , where the host halo medium density (Figure 1) is evaluated at the satellite location ; and the satellite location and velocity, and , are from the gala-generated orbits (§2.2 and Table 2). For the three wind runs (hereafter 12W, 13W, and 14W), we list the initial and final ram pressure values from the orbits described in §2.2, and show their time evolution in Figure 2. We initialize the 13W run from a snapshot in the 12W run where the ram pressure matches the 13W initial conditions, and similarly start the 14W run from a 13W snapshot; see the relevant time frames in Figure 2. This results in the initial galaxy disk in the 13W and 14W runs being “pre-processed”: it has been orbiting in smaller host halos prior to their accretion onto the more massive group- or cluster-host, a highly probable process for low-mass galaxies that has abundant observational and theoretical evidence (Zabludoff et al., 1996; Wetzel et al., 2013; Haines et al., 2015; Jung et al., 2018; Bahé et al., 2019; Donnari et al., 2021b). For the masses modeled in this paper, TNG simulations find of satellites below have been pre-processed in hosts of or above, if they reside in a cluster of at (Donnari et al., 2021b).
Initializing the simulations from a previous snapshot effectively avoids the numerical artifacts in the initial few hundred Myr, like an unstable outburst of star formation (Tasker & Bryan, 2006) and significant transient ringing (Goldbaum et al., 2015) in the gas disk. Previous works such as Tonnesen & Bryan (2012) addressed these artifacts by delaying the wind and allowing for a thermal relaxation phase of at least 200 Myr to stabilize the disk. For our 12W run (the only wind simulation that begins at ), however, the wind delay is unnecessary. Because of the Milky Way wind’s initial slow speed ( ; Table 2), it takes the first shock wave (of Mach number 2) generated by the initial inflow more than 300 Myr to reach the galaxy disk, and longer for the stable inflow, see Figure 2. The location of the sampling box for ram pressure values (right panel of Figure 2) is chosen to be relatively close to the galactic disk, while avoiding the bow shock in front of the galaxy after the thermal relaxation phase.
The three wind runs cover over three orders of magnitude in ram pressure (solid lines in Figure 2), which generally follow the input orbit conditions (dashed lines). We attach a constant ram pressure value at the end of each wind run to ensure the pericentric inflow from the corner of the simulation box reaches the galactic disk, and the attached time periods are relatively short (300 Myr). We annotate the input ICM thermal pressure of the isolated case as the dash-dotted line in Figure 2, which is lower than the weakest ram pressure input of the wind runs ( of 12W). The sampled ram pressure of 12W (blue solid line) is low during Myr because it shows the initial collapse of the gas before the wind reaches the sampling box; then during Myr, its stochasticity reflects an interplay between the feedback outflows and ram pressure of a comparable strength. The two short peaks in ram pressure at 1250 (13W) and 1700 Myr (14W) are due to shock waves generated when we stack the ram pressure profiles; they have no global effects on the simulations.
| Simulation | |||
|---|---|---|---|
| () | () | (Myr) | |
| 12W | 4.6e-15 | 6.7e-14 | 0 |
| 13W | 6.4e-14 | 1.9e-12 | 1060 |
| 14W | 2.6e-13 | 1.2e-11 | 1600 |
| iso | 0 |
Note. — (1) Simulation short names, used throughout this paper. 12W: “Milky Way” halo ( ) wind; 13W: “group” halo ( ) wind; and 14W: “cluster” halo ( ) wind; iso: isolated galaxy (no wind). (2) and (3) The initial and final ram pressure values of the wind orbits (§2.2), also see Figure 2. (4) The initial time of each simulation. 12W and iso both begin at , but the 13W and 14W runs are each continued from a lower halo mass case’s evolved snapshot with matching ram pressures. For example, the 13W run is a continuation from the Myr snapshot of 12W, where the initial ram pressure matches the 12W run’s , see Figure 2.
3 Global Results: Gas Stripping and Star Formation Rate Response
We present our simulation results as follows: §3.1 summarizes the global evolution of baryonic mass, star formation rate (SFR), and star forming location; §3.2 describes the wind-driven gas morphology and kinematics, which explains the global evolution in §3.1.
3.1 The Fate of the Ram Pressure Stripped Galaxy
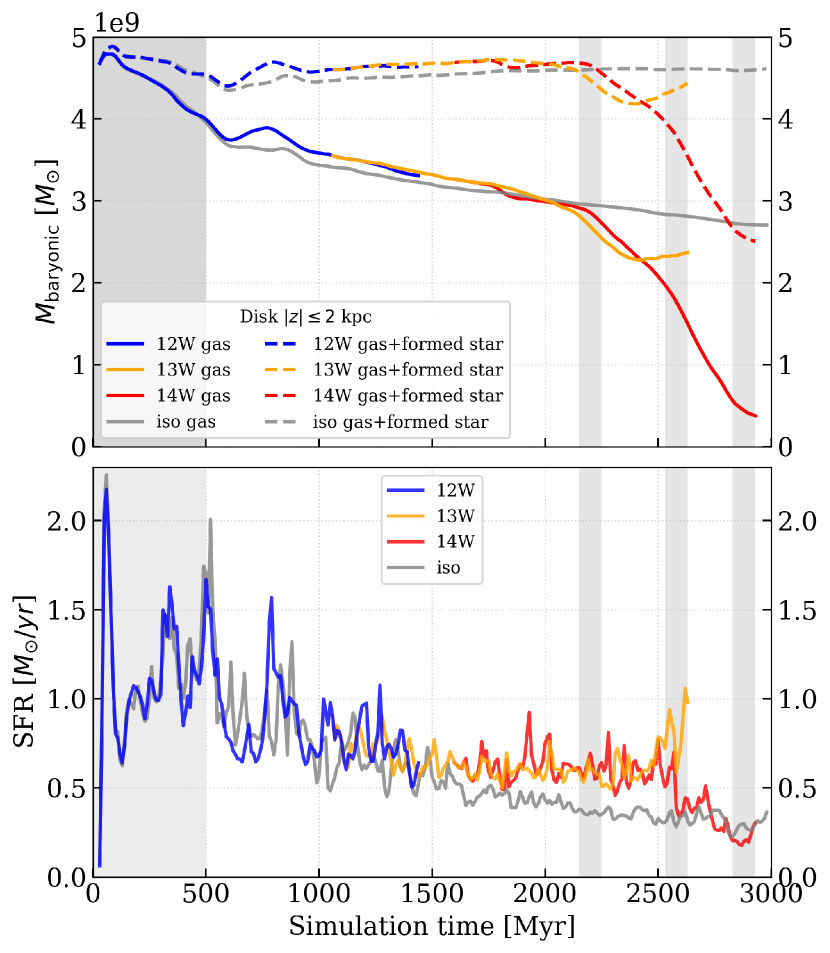
The global effects of RPS on the disk mass and SFR are demonstrated in Figure 3, comparing the three wind cases and the iso case. The upper panel shows the galactic disk masses: gas as solid lines and gas plus formed stars as dashed lines, versus simulation time. We apply a spatial disk cut ( kpc, kpc) and a metallicity cut () to select the gas in the galactic disk, and place the same spatial cut when calculating masses of the formed stars. We verified that varying these selection criteria to include more gas (e.g., using kpc and ) does not change the trends. The gas fuels star formation and decreases in mass in all four cases. Without RPS, star formation accounts for most of the gas mass loss, as shown by the iso case’s gas plus formed stellar mass (dashed gray line), which remains at its initial value — almost conserved after 3 Gyr of evolution over which time nearly of the initial gas mass is converted to stars.
In the wind runs, in addition to forming stars, the gas can gain or lose mass due to interactions with the wind, depending on the ram pressure strength. In 12W, there is no stripping-induced mass loss compared to the iso case due to the weak ram pressure (Figure 2). Instead, there is a mild mass excess at Myr, because ram pressure pushes part of the feedback outflows back to the disk (this will be discussed in §3.2). Both 13W and 14W experience the onset of the stripping phase at Myr, seen from the steepened gas mass slopes in Figure 3 (leftmost vertical bar; see Figure 2 for the corresponding ). The stripping only lasts for 200 Myr in 13W, after which the gas mass slope flattens as the ram pressure is kept constant (Figure 2). But in 14W, as the ram pressure continues to increase, the stripping continues until nearly the entire gas disk is removed.
The lower panel of Figure 3 shows the SFR evolution, manifesting both the SFR enhancing and quenching potential of the wind. The first 500 Myr is the thermal relaxation phase where star formation is still stabilizing, and the 12W wind has yet to reach the galaxy (Figure 2 and §2.3). This period will be omitted in subsequent plots and analyses. After the relaxation phase, the SFR steadily decreases in the iso case throughout the 3 Gyr of evolution, as its gas density steadily decreases due to starvation without cosmological inflow replenishing the disk. The SFR of 12W remains similar to the iso case throughout its orbit. In 13W and 14W, the SFR remains approximately constant at until Myr, which is a relative enhancement compared with iso. The SFR then mildly increases in 13W as the gas mass remains almost constant, resulting in a 2.5 times SFR enhancement relative to iso at the first-infall pericenter (middle vertical bar). In 14W during the final Myr, the SFR decreases by , dropping to below iso at the cluster pericenter (rightmost vertical bar), as the gas is rapidly removed from the disk (from to ). The 14W galaxy will ultimately be quenched judging from the rapid, almost complete gas removal.
Combining the ram pressure, the disk mass, and SFR (Figures 2 and 3) gives the direct effect of ram pressure on these star-forming disks’ global evolution. The turning point at Myr, where the effective gas stripping takes place in 13W and 14W, corresponds to a total 45∘-angled ram pressure of g/(). Before this critical ram pressure is reached, the gas plus formed stellar masses in the disks (dashed lines in Figure 3) remain conserved with respect to ram pressure for all wind runs. Unlike gas stripping, which is a direct consequence of strong ram pressure, the SFR shows no immediate correlation to ram pressure. The SFR turning points in 13W and 14W appear 300 Myr delayed compared to the gas mass change (Figure 3), likely because it takes time for the wind-driven mass flows around the disk to affect the global SFR.
As the wind interacts with the galactic disk, the location of star formation changes, as shown in Figure 4. We select stars newly formed within 100 Myr of each given time and obtain their distribution in cylindrical/disk radius () and height (). These stars’ radial distribution has a power-law tail, and Figure 4 shows their percentile values as solid lines. The height distribution characterizes a thin disk of cold gas — symmetrically peaked around kpc without wind impact, or skewed towards under a wind that has a component, and Figure 4 shows their percentiles as colored bands.
The radial ringing in Figure 4 results from epicyclic oscillations triggered by rapid radiative cooling disturbing the initial equilibrium disk (Goldbaum et al., 2015), and has no global effect on our results. In the iso case, the radius of star formation in an undisturbed disk shows a slow and steady increase and asymptotes to 11 kpc at the final stage of evolution, and the height remains symmetric within kpc, which 12W closely follows throughout its orbit. In 13W and 14W, when the gas stripping begins at Myr (Figure 3), their radii of star formation begin to deviate from the iso case, with the 13W radius decreasing slightly faster and its symmetrically thickening, while the 14W radius decreasing relatively slowly to 6 kpc and its extending to kpc, highly skewed towards the wind direction. The star formation radius in 13W decreases faster than in 14W, where ram pressure is higher, which seems to contradict the Gunn & Gott (1972) face-on stripping picture. But this is because of the wind inclination: more 14W gas is stripped into an extensive tail inclined to the disk (see Figure 5 below), forming stars in the tail, which skews the 14W star formation to higher cylindrical radii.
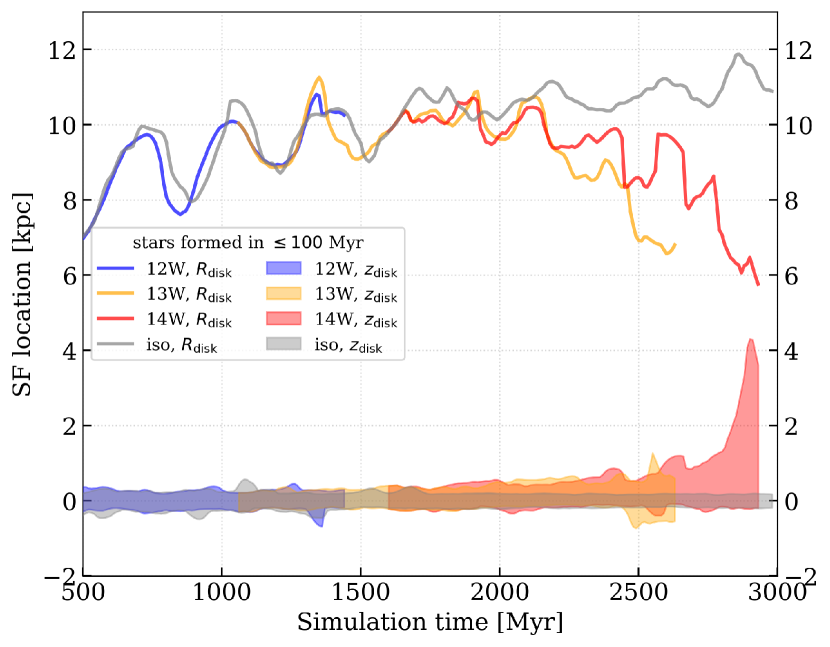
We selected the 100 Myr timescale in Figure 4 in order to match the typical timescales in UV observations of star formation (e.g., Leroy et al. 2012; Kennicutt & Evans 2012). We also experimented with 10 Myr (typical H timescale), 30 Myr, and all formed stars within the simulations (1-3 Gyr, roughly matching the timescales in optical observations, see Tasker & Bryan 2006), and found the temporal trends agree for the 10, 30, 100 Myr selections. If using all formed stars, however, the radial distributions in all cases asymptote to kpc, characterizing a steady stellar disk (rather than recent star formation); the similar radius across all cases is expected as RPS has no direct effect on the stellar disk.
3.2 Wind-driven Gas Morphology and Kinematics
The global results in §3.1 show that RPS directly affects the gas mass and, although the global SFR is eventually affected, that impact occurs a few hundred Myr after the onset of gas stripping. We find the impact on star formation can evolve in opposite directions: enhance or quench (Figure 3). In this section, we examine the wind-driven gas flows to determine the physical reasons behind the bimodal effects on star formation.
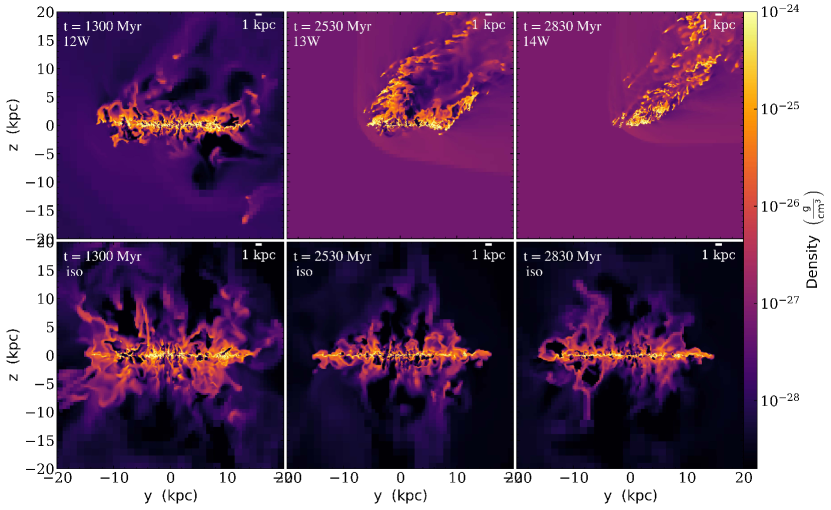
We first show the different morphology of the gas via density slices along the plane in Figure 5, comparing the iso case to each wind run when the ram pressure has reached its peak value at the galaxy position. The three lower panels show that, without RPS, the isolated galactic disk remains cylindrically symmetric and drives an outflow above and below the disk via star formation feedback, which decays in strength as the SFR decreases with time (Figure 3). The three wind runs demonstrate different interactions between the wind and the galactic gas, as summarized below.
-
•
12W: There is no clear signal of RPS within the gas disk. Ram pressure appears to interact with the feedback-driven outflows, likely suppressing those outflows below the disk (against the wind direction).
-
•
13W: Gas is being stripped and forms an outer ring that, in this slice, looks like two tails. The feedback-launched gas below the disk in the iso and 12W runs is missing because of the higher ram pressure.
-
•
14W: Gas is being stripped relatively uniformly from all radii of a shrunken and highly fragmented disk, forming a single extended tail tracing the wind direction. The 14W wind has a similar density but 2 times higher velocity compared with 13W, leading to its 4 times higher pericentric ram pressure (Tables 2 and 4).
Moving from 12W to 13W and finally to 14W, we see a clear progression from negligible stripping to outer gas removal to nearly complete stripping. However, the 13W gas morphology in Figure 5 demonstrates a unique complexity: within the stripping radius (characterized by the outer ring of stripped gas), there is high-density gas above the disk. We zoom in and examine the gas kinematics of 13W in Figure 6. The slice (left; not mass-weighted) shows that much of the gas above the disk has a 0 or negative z-velocity — falling back to the disk. The stripped material from the leading side (), initially traveling at 45∘ (), experiences gravitational forces toward the disk center where the potential well is deepest (perpendicular to the contour lines, Figure 6). This fallback phenomenon is confirmed by the mass-weighted gas velocity streamlines, indicating the paths of motion, in the edge-on projection map of gas that originated in the galaxy (middle panel). Fallback happens for the relatively dense stripped gas at the wind leading edge ( kpc) onto the leading half of the disk, and also for the more diffuse stripped gas in the tail ( kpc), which occurs on a larger spatial scale.
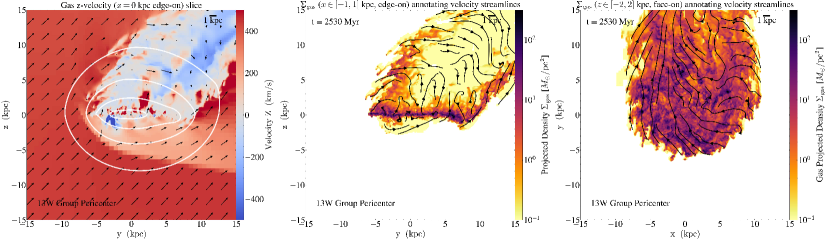
The face-on projection map (Figure 6 right panel), on the other hand, shows the interplay between ram pressure and disk rotation within the disk plane. On the side of the disk where the ram pressure in-plane component () counters disk rotation, the disk gas can lose its angular momentum, manifested in radial inflows towards the disk center. This is clearly distinct from the side, where ram pressure aligns with disk rotation, and the in-plane gas kinematics transforms into radial outflows in the wind-trailing end of the disk (). Gas that is pushed above the disk while losing angular momentum, as illustrated in the third panel, will be more able to fall back along the streamlines shown in the middle panel.
We now focus on RPS-driven mass losses using the gas motions perpendicular to the disk (Roediger & Brüggen, 2006; Bekki, 2014). In our simulations, this corresponds to flows in the z-direction, , where the surfaces are selected to be kpc for the gas with metallicity 222The metallicity selection excludes the ICM inflows (§2.3)., consistent with our disk ISM selection (Figure 3). In addition, the mass flows are expected to have radial dependence, because gas removal typically begins at larger disk radii where the local gravity is weakest, and migrates radially inward as the ram pressure increases (Gunn & Gott 1972, also see Figure 4). To characterize the radial dependence, we further distinguish the mass flows across the full planes ( kpc) versus only the central 5 kpc regions of the planes ( kpc, kpc). The resulting of the full and central planes are shown in Figure 7, together with the gas mass and SFR time evolution (similar to Figure 3) of the central plane.
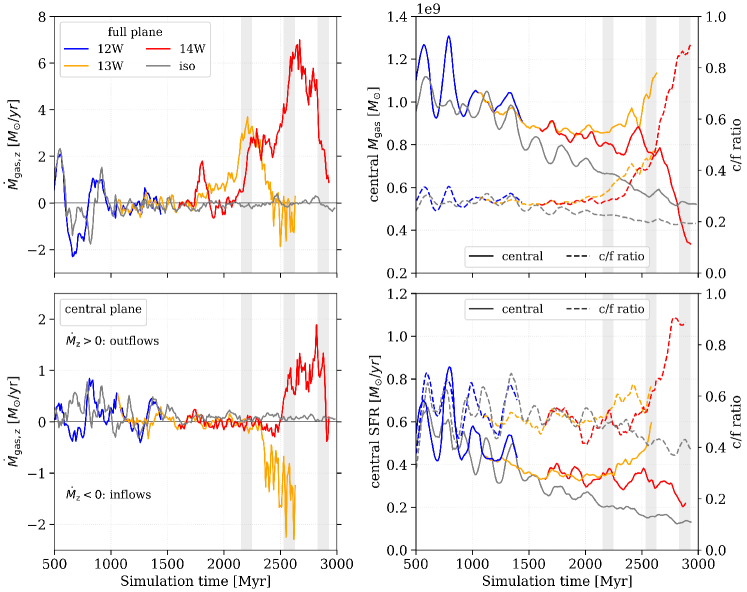
The mass loss rates in Figure 7’s left two panels are obtained by summing above and below the disk (at and kpc), where a positive value is outflow/mass loss by definition. For the iso case, the mass loss rate demonstrates galactic fountain flows driven by the stochastic star formation feedback alone: in the central plane where the star formation and feedback is strongest, remains an outflow (lower left panel); but the full plane oscillates around 0 (upper left panel), and results in 0 net baryonic mass loss throughout the 3 Gyr iso simulation (gray dashed line, Figure 3). The fountain flows’ (or central plane feedback outflows’) amplitudes decay as the SFR decreases with time (Figure 3). The mass loss rate of 12W overall follows iso, except for a mildly enhanced inflow within its full plane (upper left panel) at Myr, which explains the mild 12W gas mass excess around this time (Figure 3). We verified that the 12W enhanced inflow relative to iso is via the kpc surface, indicating that the ram pressure, although not yet sufficient to strip the gas disk, transfers momentum with the diffuse fountain flows below the disk.
For 13W and 14W, the mass loss rates are dominated by RPS. Across the full plane, the first peak of mass loss occurs at Myr (leftmost vertical bar, Figure 7), corresponding to the onset of effective stripping in both 13W and 14W (Figure 3). After that, the 13W mass loss rate steadily decreases to 0 at its pericenter, as the ram pressure becomes constant (Figure 2), and the 14W mass loss rate keeps increasing for another 400 Myr with its still increasing ram pressure. For the central plane, however, there is a clear dichotomy: 13W shows a central inflow () with increasing amplitude, while 14W shows a (slightly delayed) central outflow. During the onset of effective stripping, the stripping radius is greater than the selected central region (5 kpc), so for both cases. At Myr, the 14W stripping radius reaches the inner 5 kpc, and hence the central outflows begin. But for 13W, ram pressure was never sufficient to strip the inner disk; instead, the gravitational fallback of the stripped material (as described in Figure 6) replenishes the central disk.
The right-hand two panels of Figure 7 show the central disk gas mass and SFR time evolution and the central-to-full disk ratios (“c/f ratio”; see Figure 3 for the full disk). For all four simulations, the central gas mass evolution tightly correlates with the central SFR evolution. The temporal oscillations arise from the radial ringing discussed previously in Figure 4. In the absence of effective RPS, the iso and 12W cases maintain an almost constant c/f ratio throughout the simulations (gray and blue dashed lines). Effective RPS (13W and 14W) leads to a radial redistribution of the gas and SFR: (i) the profiles are more radially centralized (enhanced c/f ratios), and (ii) the inner disk and SFR values (solid lines) are both enhanced relative to iso. Although (i) partially results from the removal of outer disk gas, (ii) directly reflects the star formation enhancement potential of RPS.
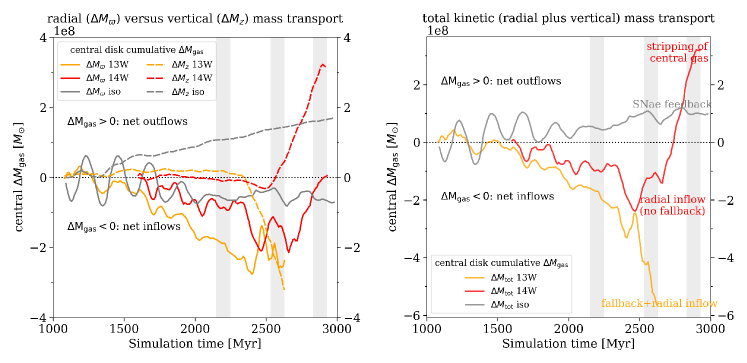
The gas motions perpendicular to the disk (Figure 7) demonstrated an indirect mode of radial mass transfer in 13W: gas is lifted by RPS from the edge of the disk, and falls back to the central disk a few 100 Myr later, replenishing star formation there (also see Figure 6, middle panel). Another mode of radial mass transfer is directly via the (cylindrical) radial direction, , where is the cylindrical radial vector, and the surface can be approximated by a thin cylindrical shell of average width , such that . We evaluated the radial mass flow rate for the central disk in Figure 8 ( kpc, kpc)333The shell width is obtained by , where is the individual cell volume, and is the shell area. We tested a range of shell widths, pc, which corresponds to 1 to 4 times the highest-refined cell length (§2), and is approximately constant over these . After obtaining , we evaluate for the cells in the thin shell that satisfy the ISM metallicity selection . The final is an average of over pc.. Because characterizes mass transfer within the galaxy, its amplitude is particularly susceptible to radial oscillations (Figure 4). Therefore, we show the time cumulative (; frequent temporal oscillations cancel out) mass flows in Figure 8: the left panel compares the radial and vertical (perpendicular to the disk) components, the right shows the total kinetic flows (the sum of the two).
The dashed lines in Figure 8’s left panel is the time integration of the central plane (Figure 7 lower left panel). As described above, in the central plane there is a consistent feedback outflow in iso, fallback replenishment in 13W, and stripping in 14W when becomes sufficient to affect the inner disk ( kpc). In the radial direction (solid lines, Figure 8 left panel), however, both 13W and 14W show an excess of inflow relative to iso, with peak amplitudes ( ) comparable to the net fallback inflow in 13W. These radial inflows can be explained by an interplay between the edge-on ram pressure component and disk rotation (right panel of Figure 6). Rotating gas in the disk, when countered by ram pressure (where ; Figure 6), can lose angular momentum and migrate radially inward. For 14W, this radial inflow eventually decreases to 0 as stripping proceeds into the central region of the disk with increasing .
The right panel of Figure 8 shows the sum of the radial and vertical components: the total kinetic mass transport across all surfaces of the central disk. We summarize the key physical processes at play in the figure. For iso, the gradual mass loss is dominated by the central plane’s star formation feedback. For 13W, there is a combination of replenishment from fallback and from direct radial inflow, resulting in its highest central plane gas mass and SFR (Figure 7 right panels). For 14W, because the ram pressure keeps increasing, there is net replenishment from radial inflow but little to no fallback around the group pericentric time (middle vertical bar), which eventually becomes a net outflow as the stripping radius reaches within the selected central disk ( kpc) at the cluster pericenter (rightmost vertical bar). Collectively, the kinetic mass transport (Figure 8) explains the central plane and SFR evolution (Figure 7). We found RPS-driven direct radial inflows, in agreement with literature results (Schulz & Struck, 2001; Tonnesen & Bryan, 2009; Akerman et al., 2023), can replenish the central star-forming disk; and we identified fallback as an indirect mode of radial mass transport (Figures 6, 7, and 8) that can add to the enhancement for certain orbits.
We emphasize that as long as the profiles are consistent, even with different , components (§2.3), the galaxy undergoes a similar global evolution. For example, at Myr (leftmost vertical bar), the global properties and the mass loss rates of 13W and 14W closely match (Figures 3, 7, and 8) as their values are comparable (Figure 2), despite the 14W orbit consisting of a higher and a lower . Importantly, the galaxy’s global evolution is also sensitive to the time derivative of ram pressure, . When the 13W ram pressure stops increasing as the galaxy reaches the group pericenter (, Figure 2 leftmost to middle vertical bar), the stripping radius is kept at constant and the remaining gas disk acts as a “shield” for the stripped gas above it, such that gravity outweighs ram pressure in shielded regions and causes the central plane fallback (, Figure 7). Conversely, in 14W where keeps increasing after Myr for 500 Myr, the stripping radius decreases, so the shielded region shrinks (Figure 5); without shielding the stripped gas above the disk is unable to fall back.
The global evolution described in §3.1 and 3.2 can be summarized as follows. In the iso run, the gas disk primarily loses mass to steady star formation, which drives feedback fountain flows that decrease in magnitude with decreasing SFR. In 12W with weak , the global properties are overall consistent with iso, other than the additional interactions between the wind and the low-density fountain flows. In 13W with moderate , RPS in the disk outskirts dominates the mass loss, and actually enhances the SFR in the remaining disk. Because the pericentric is insufficient to remove the entire gas disk, gas can migrate radially inward via fallback and direct radial inflows, both replenishing the central disk’s star formation. In 14W, is sufficient to strip the gas first in the outskirts and then in the center, ultimately resulting in a rapid decline in the galaxy’s SFR.
4 Spatially Resolved Star Formation Rate-Mass Relation
In the previous section, we found that RPS can enhance the satellite galaxy’s global SFR while removing its gas (Figure 3), and the wind-enhanced star formation favors central disk regions (Figures 4 and 7). In this section, we evaluate the spatially-resolved SFR-mass relations — a direct clue to the star formation microphysics (e.g., Kennicutt & Evans 2012). We compare the relations between the RPS and isolated cases to characterize the physical conditions of ram pressure-enhanced star formation.
4.1 Spatial Division Methodology and Radial Profiles
When spatially resolving galactic regions, the sampling scales need to exceed certain minima for galactic star formation-mass scaling relations to hold (Kruijssen & Longmore, 2014; Kruijssen et al., 2018); the selected sampling scales need to account for the incomplete statistical sampling of independent star-forming regions and the spatial drift between gas and stars. Empirically, this minimum spatial scale works out to be kpc for typical star-forming galaxy disks (see Kruijssen & Longmore, 2014, Fig. 2). Here, we select the sampling scale to be 1 to satisfy the validity of the scaling relations; and to match with typical scales () in high-angular-resolution observations in the local universe (Bigiel et al., 2008; Vulcani et al., 2019, 2020; Jiménez-Donaire et al., 2023).
For a given simulation snapshot, we divide the satellite disk into 1 -resolved patches, integrate the patches along the disk-height direction (for disk height kpc), and calculate the projected SFR, gas, and stellar surface densities (, , and ) of each patch. We focus on the galaxy group and cluster pericenter time frames, when RPS most effectively enhances/quenches the satellite star formation (Figure 3), and compare the wind cases with the isolated galaxy case (iso) at the corresponding times. Using 100 Myr windows (10 simulation outputs) produces larger samples of 1 kpc2 regions with recent star formation (10 Myr) across the disk. Changing the number of outputs does not qualitatively affect our results. Global properties of the selected patches are summarized in Table 5. Throughout the Section, we will focus on the four pericentric cases in Table 5: 13W, 14W, iso group, and iso cluster control, while iso pre-starvation is a special reference case for the star formation law comparison in §4.2 below.
| Case | ||||
|---|---|---|---|---|
| (Myr) | () | (Gyr) | ||
| 13W pericenter | 2530-2630 | 1427 | 0.85 | 2.28 |
| iso group control | 2530-2630 | 3016 | 0.38 | 7.12 |
| 14W pericenter | 2830-2930 | 447 | 0.21 | 1.70 |
| iso cluster control | 2830-2930 | 2933 | 0.32 | 8.16 |
| iso pre-starvation | 580-680(a) | 2292 | 1.08 | 3.11 |
Note. — (1) Simulation cases. (2) Simulation time periods that correspond to 13W and 14W pericenter passages. (a) The iso “pre-starvation” time frame is selected to match the central plane of 13W pericenter (Figure 7), see §4.1. (3) The number of star-forming patches, where star formation is defined to have per patch. (4) The total SFR of the star-forming patches averaged over the selected 100 Myr time period. (5) The gas depletion time defined as , where is the total gas mass in the patches, and SFR as in column 4.
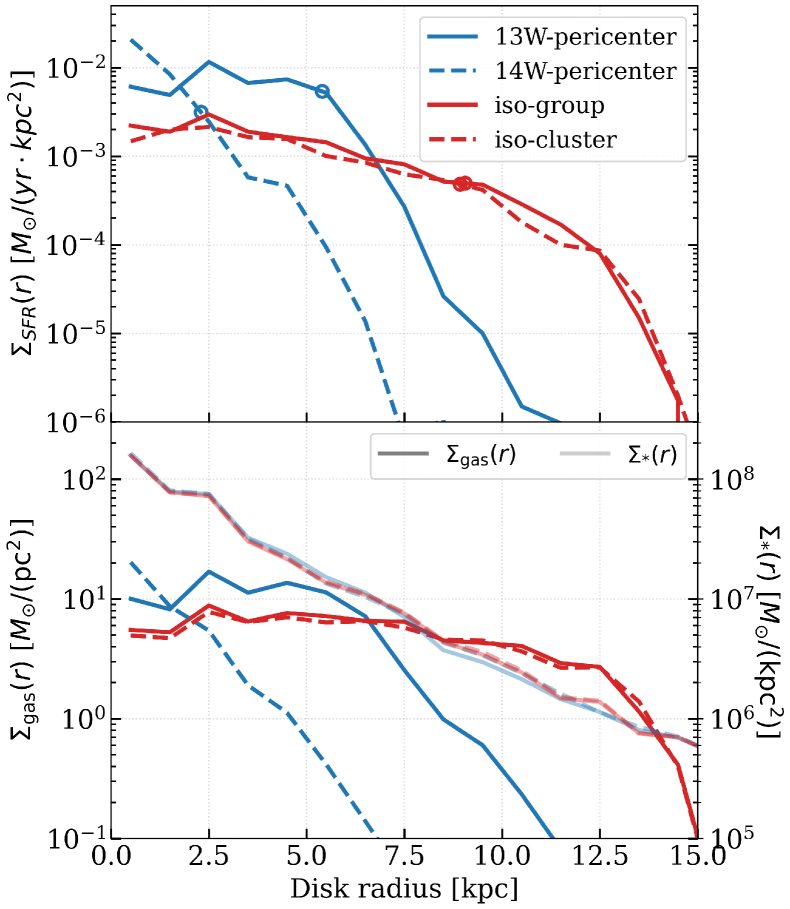
The radial profiles of the resulting patches are shown in Figure 9. The SFR profiles (top panel) closely resemble the respective gas profiles (bottom panel) in all cases. In the central few kpc, the wind cases (blue) are enhanced in both the SFR and gas densities relative to iso (red); at larger radii, the wind radial profiles show a steeper decrease with radius than iso. This is expected given our previous finding that ram pressure removes gas in the outer disk while driving gas into the central disk (Figure 7). The 95 enclosing radii of the SFR, denoted by the open circles, show that star formation is more centrally-concentrated with increasing ram pressure, with the iso cases forming stars within 9.0 kpc (no ram pressure), 13W within 5.4 kpc (moderate ram pressure, enhanced SFR), and 14W within 2.3 kpc (strong ram pressure, approaching complete stripping). The time evolution in iso from the group to cluster pericenter times (300 Myr duration; red solid and dashed curves) is due to star formation “starvation”, which has a relatively small impact on the radial profiles (and reduces the global SFR by ; see Table 5).
The bottom panel of Figure 9 directly compares the gas and stellar surface density ( and ) profiles. The y-axes are under the same physical scale following the conventional units of each quantity, as will be used in Sections 4.2 and 4.3 and figures therein. In all cases, profiles (lighter lines) are greater than (deeper lines) within the inner 8 kpc region that encloses the majority of star formation. Unlike (or ) that clearly distinguishes wind and iso, the profiles are consistent among all cases. This is because (i) ram pressure only directly impacts the gas disk and not the stellar disk; (ii) the formed stellar mass is low compared with the static stellar potential (; Figure 3 and §2), therefore the static potential is dominated by the total (and dark matter) at all radii.
4.2 SFR: The Kennicutt-Schmidt Relation
We investigate the SFR relation, also known as the Kennicutt-Schmidt (KS) relation (Schmidt, 1959; Kennicutt, 1989), for the resolved 1 patches. The KS relation is an empirical power-law between the observed SFR and gas surface densities, . Physically, it is a proxy for how efficiently gas forms stars at given surface densities. In our suite of simulations, both the stripping and the isolated galaxy cases follow the same numerical star formation and feedback recipe (Goldbaum et al. 2015, 2016; see §2), and differences on the (KS) phase plane will directly reflect the impact of RPS.
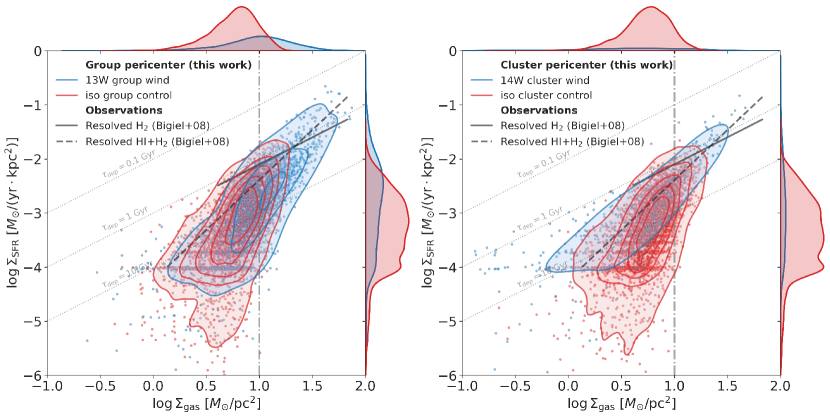
Figure 10 shows the KS relation in the RPS and isolated galaxy disks at the group and cluster pericenters (Table 5). For all cases, the gas densities are tightly correlated with SFR on the resolved scale, but the RPS cases populate a distinct phase space of high-density, high-SFR gas that is absent in iso. To quantify this excess, we first identify the 99.85 percentile surface density thresholds (empirically 3 upper limits) in iso using the 1D histograms of and . For each of these distributions, these upper limits are nearly identical at both the group and cluster pericentric times: and . Many patches in 13W and 14W occupy the KS phase space beyond these upper limits in iso (blue scatter points; upper right corner of Figure 9); these are the dense gas excess in the RPS cases and have a significant contribution to the total SFR (58% in both 13W and 14W).
For 13W, star formation from this dense gas (58% or 0.5 ) is comparable with its SFR enhancement relative to iso (SFR ; Table 5). For 14W, ram pressure is strong enough to remove most of the surviving ISM and leads, ultimately, to a quenching of star formation. Despite 14W’s dense gas excess, its number of star-forming patches (; Table 5) has decreased to 30% of 13W and 15% of the iso control, resulting in its lowest total SFR of all cases. We will further discuss why gas and SFR surface densities are enhanced in the RPS cases in §5.1.
We showed in Figure 10 that the RPS and iso cases populate different ranges. At the selected pericentric time frames, in iso primarily belongs in the H i-dominated regime (the left of the dashed vertical line in both panels), while in 13W and 14W, it populates both H i and H2 regimes (Krumholz et al., 2009). The relatively low surface densities in iso are a direct result of the gradual gas consumption due to star formation and the feedback-driven outflows, also known as “starvation” (Larson et al., 1980; van den Bosch et al., 2008; Trussler et al., 2020). To evaluate the effect of RPS on the KS relation over a similar range, we identified an earlier time frame in iso (iso pre-starvation; see Table 5), where the central disk gas mass — and hence the highest — is comparable to 13W at the pericenter (Figure 7). This comparison will determine if the star formation efficiency at given gas densities is modified in the RPS cases.
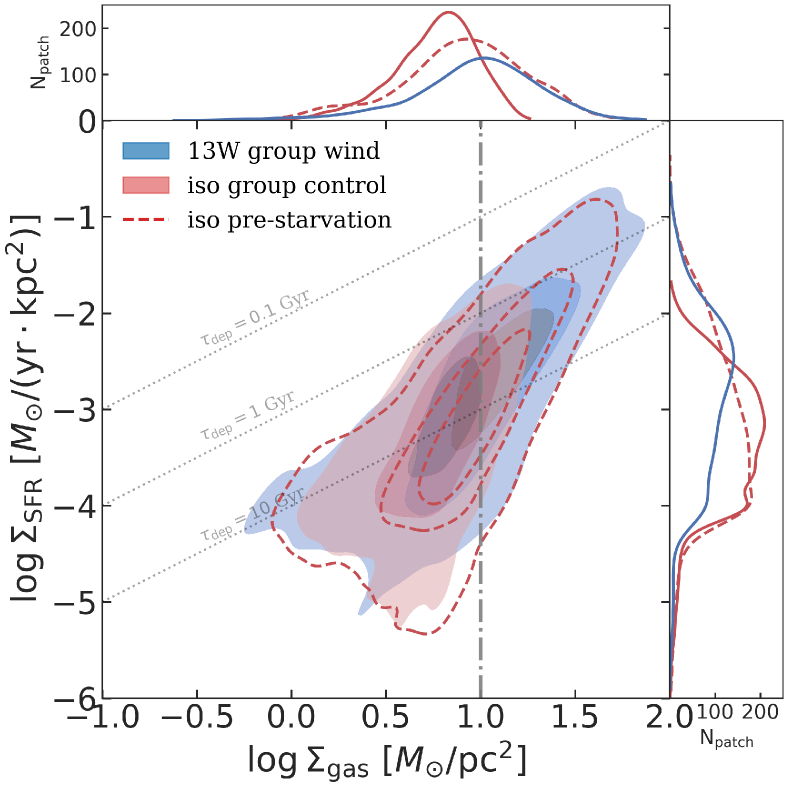
Figure 11 shows the effect of RPS versus starvation on the KS plane by comparing three cases: 13W and iso at group pericenter time and iso pre-starvation. Starvation shifts the isolated galaxy to lower surface densities along the KS relation (red dashed versus red filled) via gas consumption and feedback-driven outflows. However, the iso pre-starvation case shares a very similar KS relation with the RPS case (red dashed versus blue filled), despite their distinct evolutionary history and gas morphology (Figures 3 and 5). Judging from the similar KS relation, the star formation efficiency in RPS and iso cases remains the same at comparable .
Independent of RPS, the resolved patches in our simulations show a KS power-law slope turnover from the H i to H2 regimes when sufficient dense gas exists as H2 (Figures 10 and 11). This is a direct reflection of our numerical star formation recipe (see Goldbaum et al., 2016, Fig 5), which agrees with observational findings that the KS power-law slope transitions from superlinear in the atomic regime ( with poor correlation; Bigiel et al. 2008; Leroy et al. 2008; Kennicutt & Evans 2012) to approximately linear in the molecular regime (; Krumholz et al. 2009; Heiderman et al. 2010; Krumholz et al. 2012; Jiménez-Donaire et al. 2023; see the solid line in Figure 10). We also annotated the H i+H2 combined fitting result from Bigiel et al. (2008) in Figure 10 (dashed line, N); our simulations follow a mildly steeper slope in the atomic regime (N), still well within the observational scatter (Bigiel et al., 2008). An exception to the overall consistent KS slope in our simulations is 14W at the lowest gas surface densities ( ; see Figure 10 right panel), which shows distinctively higher than iso and hence a lower KS slope in the low-density H i regime. The high (H2-dominated) regime in 14W is similar to the other cases. We suspect that the low-density star-forming gas in 14W is driven by fast gas removal from RPS in recently star-forming regions.
4.3 SFR: Strong Stripping and Disk Truncation
In this section, we investigate the SFR relation, also known as the star formation main sequence relation (e.g., Schiminovich et al. 2007; Sargent et al. 2014; Speagle et al. 2014), on the spatially-resolved plane. We examine the impact of RPS using our simulations and make comparisons with Vulcani et al. (2020) (from the GAs Stripping Phenomena in galaxies “GASP” survey; Poggianti et al. 2017). The SFR surface densities of the resolved simulation patches are identical to those in the KS relation (§4.2), while the stellar surface densities are a combination of the static stellar disk and the formed star particles as outlined in §4.1, which turns out to be highly consistent among all simulations (Figure 9). The Vulcani et al. (2020) sample contains 1 resolved patches within 30 RPS galaxies under various stripping stages in nearby clusters, along with 10 isolated control case galaxies of similar masses (see Vulcani et al. 2019). Our simulated galaxy with lies well within the GASP sample range and is directly comparable.
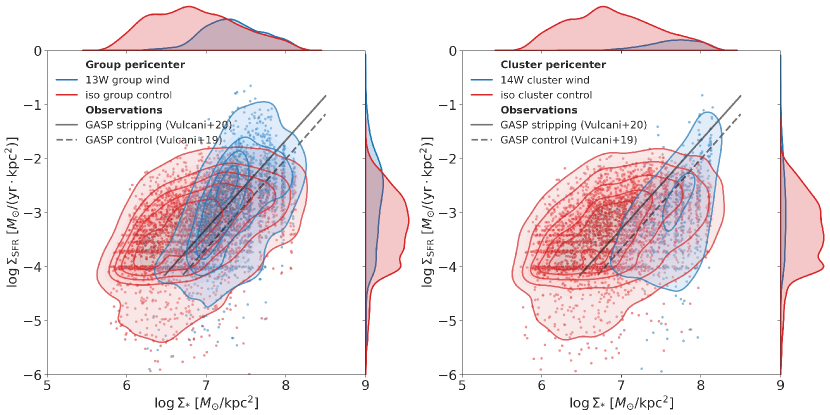
Figure 12 shows the relation for the resolved patches, comparing 13W, 14W at their pericenters with the respective iso control cases in the same style as Figure 10. Since is a tight, monotonic function of disk radius (Figure 9), it is an indicator for star formation location on the phase plane. Two major effects of RPS can be identified from the differences between the wind and iso cases, (i) the truncation of the star-forming disk, shown by the high cutoffs for star formation, in 13W and in 14W; (ii) the enhancement of star formation in the central disk regions, shown by the excess at in 13W and in 14W. The disk truncation is more evident in 14W, where the ram pressure is higher, which is consistent with the radial profiles (Figure 9).
In Figure 12, we annotated the GASP best-fit power-law lines for the stripping (solid) and isolated control (dashed) samples (Vulcani et al., 2020), where the slopes are almost identical, but the stripping sample is 0.35 dex higher in at all . Our result is consistent with Vulcani et al. (2020) at high (central disk regions) that the spatially-resolved SFR is enhanced in the stripping cases. But we do not see a similar SFR enhancement at low ; instead, the low phase space is poorly populated in our wind cases due to disk truncation. We note that, however, the Vulcani et al. (2020) sample contains an ensemble of galaxies with a range of , inclinations, and environments, while our simulations focus on one galaxy under different ram pressure strengths versus in isolation. The disk truncation and SFR enhancement in our wind cases are consistent with the “Jstage=3” (strongest stripping) galaxies in Vulcani et al. (2020), which do have a steeper fitted - slope.
We also examined earlier pre-pericenter time frames in our simulations: qualitatively, the wind cases at earlier times (weaker stripping) show a similar truncation at lowest (disk edge) and a mild SFR enhancement at relatively high as those in Figure 12. The transition , where in the wind cases becomes higher than in iso, increases with ram pressure strength, as expected for outside-in stripping. We will present the “time-stacked” results from various RPS stages in §5.2.
5 Discussion
5.1 Impacts of RPS on star formation
Our key results in Sections 3 and 4 are,
-
1.
In certain orbits, RPS can lead to an enhanced global star formation rate (SFR) in relatively gas-deficient galaxies.
-
2.
The SFR enhancement is driven by an excess of dense gas in the disk central regions, while the star formation efficiency at given gas surface densities (the Kennicutt-Schmidt relation) remains the same.
There are two possible channels through which the SFR is enhanced in the galaxies undergoing ram pressure stripping: compression and mass transport, which are usually not separable (Tonnesen & Bryan, 2012; Roediger et al., 2014; Troncoso-Iribarren et al., 2020; Vulcani et al., 2020). The ISM at the ram pressure interface can be locally compressed, leading to a higher star formation rate and efficiency; global mass flows driven by ram pressure can redistribute gas in the disk and cause SFR enhancement.
Our results show that RPS-driven mass transport, including fallback and radial inflows (§3.2; Figures 7 and 8), is directly responsible for the central disk gas mass enhancement relative to iso during the Gyr early stripping stage (Figure 7 upper right panel). The centralized ISM mass distribution in the RPS galaxies results in enhanced central surface densities ( and ; Figures 9 and 10), which account for the global enhancement of SFR in the stripping cases relative to iso (with only starvation). The signal of relative SFR enhancement exists for longer than Gyr timescales unless ram pressure becomes sufficient to remove the entire gas disk and quench the star formation (Figure 3).
The role of compression is more challenging to quantify and is often inferred indirectly. Roediger et al. (2014) found that compression, indicated by shock passages, can drive a local, short-lived SFR burst (15 Myr), but it only impacts the low-density outer disk and has only a mild effect on the global SFR. Choi et al. (2022) modeled a local patch of star-forming galactic disks under RPS and found a similar short-lived enhancement (20 Myr; see their fig 13(c)) in the dense gas surface density (), demonstrating vertical gas compression by the initial ram pressure passage. Compression would increase the gas volume density () without increasing the surface density integrated throughout the disk (). If such compression happens, at comparable , will be systematically higher on the KS plane. However, our Figures 10 and 11 show that at the same gas surface densities, the stripping set follows the same KS relation as the iso set. This suggests that local compression is insufficient to account for the galaxy-scale SFR enhancement in our simulations.
Another search for compression in RPS galaxies in simulations was performed by Troncoso-Iribarren et al. (2020), which spatially divided satellite galaxy disks from the EAGLE simulations into leading and trailing halves (LH and TH) separated by the infall velocity vector. Under this LH-TH division, which maximizes the SFR asymmetry between the two halves of the satellite galaxies, Troncoso-Iribarren et al. (2020) found that gas in the LH that tends to be more compressed, as inferred from higher average pressure, also has a higher star formation efficiency (defined as the total ) compared with the TH. Here, we follow the methodology of Troncoso-Iribarren et al. (2020) to further test for galaxy-scale effects of compression. We divide the galaxy disks based on a simple LH: and TH: spatial criterion, given the infall velocity vector (Figure 5) and that the star-forming disk is thin throughout the simulations (Figure 4). In the discussion hereafter, we will assume that the LH is under higher compression than the TH because of ram pressure. The disparity (or the lack of) in mass and star formation between the LH and TH will help disentangle the effects of mass transport and compression.
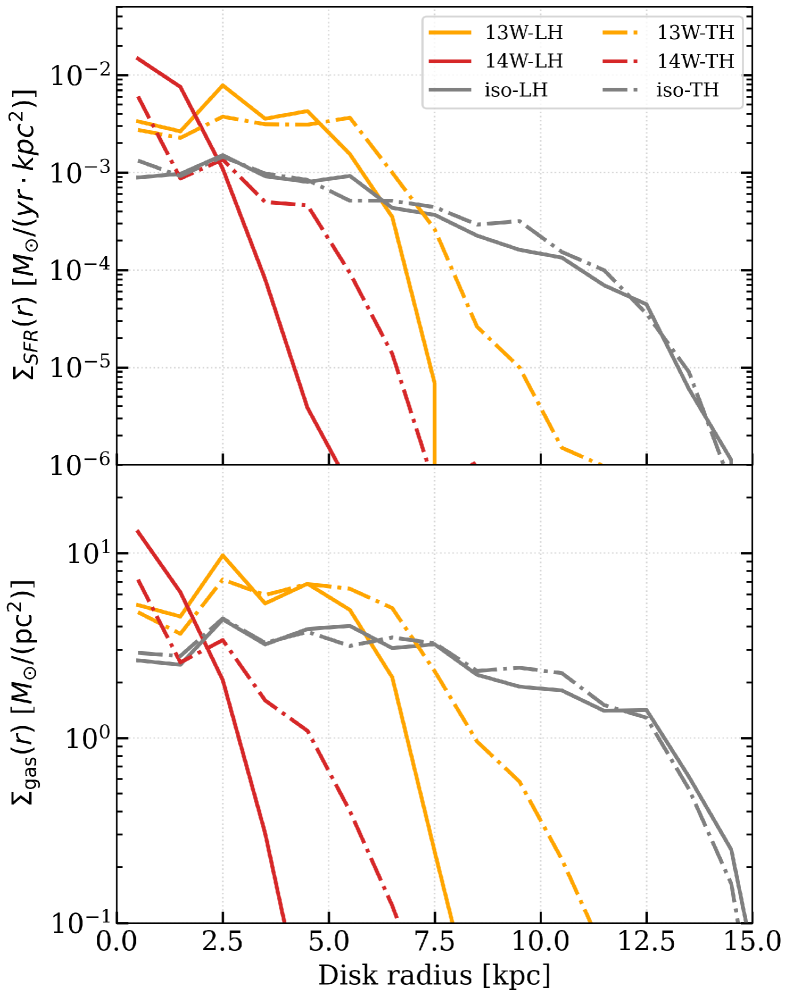
Figure 13 shows the SFR and gas radial profiles of the wind and iso runs (similar to Figure 9), distinguishing the LH (solid lines) and TH (dashed lines) of the disks. As expected, the surface density profiles for the isolated galaxy control case are an equal division between the two halves at all radii. In the wind runs, the surface densities in the LH consistently show a steeper decrease with disk radius than the TH; the disk radius at which the two halves diverge decreases with ram pressure. The more extended low , material in the TH is caused by the asymmetric disk morphology444Our kpc disk height selection excludes tail contamination. under an inclined wind (Figure 5). Within the central few kpcs of the disk, the surface density profiles show a mild LH excess in 13W and a stronger excess in 14W. However, we found that the 14W signal oscillates over time555Figure 14 shows the temporal oscillations of the LH-TH differences, which can explain the 14W central disk LH excess in Figure 13. If we select, e.g., 100 Myr prior to the pericenter (t=2730-2830 Myr), the LH densities become lower than the TH in the central disk. But the mild LH excess in the 13W central disk is independent of the oscillations during the few hundred Myr approaching the pericenter because the accumulation of fallback gas mildly favors the LH (Figure 6)., which is likely due to the orbit of the few dense clouds remaining before complete stripping instead of compression.
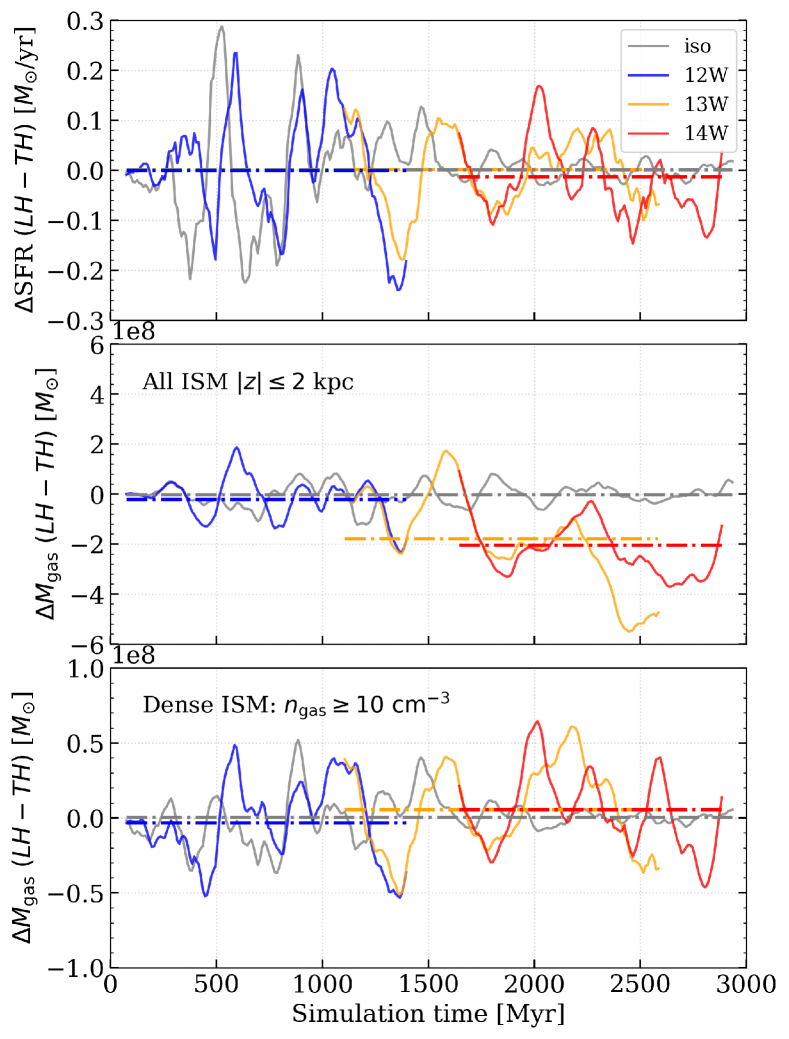
Figure 14 shows the time evolution of the LH-TH disparity. The time-dependent differences in the SFR and gas mass are subject to oscillations due to disk rotation and epicyclic motions (as previously shown in Figure 4; also see Tonnesen & Bryan 2009), which always average to 0 in the absence of ram pressure; see the time averages of iso (horizontal gray dash-dotted line). Under ram pressure, the time-averaged SFR remains close to equal between the two halves (top panel); the disk ISM mass shows a strong excess in the TH under intermediate and strong ram pressure (middle panel); but the dense, star-forming ISM (bottom panel) mass is again almost equal between the two halves. The temporal trends of the SFR generally follow those of the dense ISM; they are much less sensitive to the total ISM, which acquired the strongest LH-TH disparity from RPS.
The primary effect of RPS (with an edge-on component) is generating an excess of low-density gas in the TH that has a low contribution to the global SFR (Figure 13). The SFR and dense ISM of the two halves, although subject to temporal oscillations, show close to equal time-averaged values and no trend with respect to ram pressure (Figure 14). Our finding of the RPS-driven gas excess in the TH agrees with Troncoso-Iribarren et al. (2020), but our interpretation of this asymmetry differs. Since Troncoso-Iribarren et al. (2020) defined the star formation efficiency of each half as the mass-weighted , the TH efficiency may be biased by the excess of non-star forming gas, appearing as an efficiency enhancement in the LH. We showed that the dense ISM responsible for star formation shows no such disparity (Figure 14), indicating that the likely more compressed LH has the same efficiency as the TH.
To conclude, compression is not the direct cause of the ram pressure-induced SFR enhancement in our simulations, judging from two independent tests, (i) the spatially resolved SFR surface densities () in the stripping set show no systematic enhancement at comparable (inferred from KS relation; Figures 10 and 11), (ii) galaxy-scale global properties, SFR and dense ISM mass, show no enhancement in the LH where compression is stronger. Instead, the RPS-induced mass flows (Figures 7 and 8) account for the centralized mass and SFR profiles (enhanced central surface densities; Figures 9 and 13), which supports mass transport as the direct mechanism for the SFR enhancement.
5.2 Predictions for observations
Here we predict RPS observables based on the simulation results, where Section 5.2.1 focuses on the surviving gas in the disk and Section 5.2.2 on the local SFR-mass relations. We will discuss our predictions in the context of recent environmental surveys, GASP (Poggianti et al., 2017; Moretti et al., 2020; Vulcani et al., 2020) and VERTICO (Brown et al., 2021; Jiménez-Donaire et al., 2023).
5.2.1 Surviving gas in the disk: the dense gas ratio and the gas mass fraction
We describe the surviving gas using two global quantities: the dense gas ratio () and the gas mass fraction () within the simulated disk. The dense gas ratio is an estimate for the H2 to H i mass ratio, defined as , where is adopted as an empirical atomic-to-molecular transition density (Krumholz et al. 2009; Kennicutt & Evans 2012; also see §4.2). The ratio is not direct modeling of , but it self-consistently compares the molecular- and atomic-dominated gas masses in our simulations. The gas mass fraction is defined as , where is the total gas mass within the disk and includes the static stellar potential (§2) and the formed star particles. Figure 15 shows the time evolution of both quantities, for which we consistently selected disk height kpc, hence excluding most of the unbound gas in the tail.
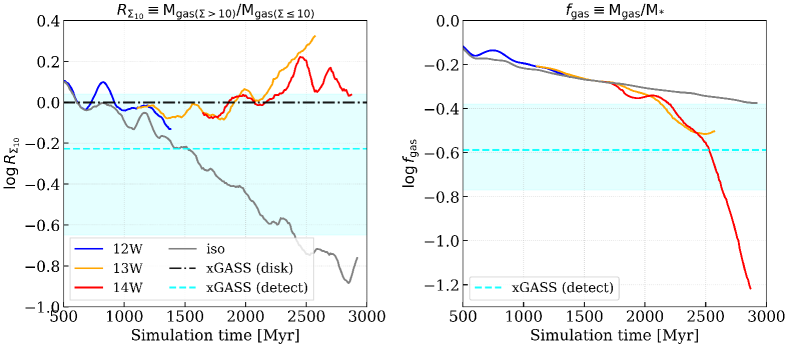
In Figure 15, we annotated the observational results from the extended GALEX Arecibo SDSS Survey (xGASS; Catinella et al. 2018) as a reference. The comparison sample we adopted (cyan on both panels, dashed line for median, shading for first to three quartiles) is a subset of 21 xGASS galaxies with comparable stellar masses () to our simulated satellite galaxy, and with detections in both CO and H i (Saintonge et al., 2017; Catinella et al., 2018). We consistently adopted as the dense gas ratio (left panel) for the observational samples. Additionally, we showed the average dense gas ratio of xGASS disk regions (dashed-dotted line; following Moretti et al. 2020), which has an additional disk radius selection (Wang et al., 2020) that results in a higher dense gas ratio.
In our simulations, the dense gas ratio in the RPS cases is consistently higher than that in the isolated galaxy case (Figure 15 left panel). The ratio increases with time in 13W and 14W, as opposed to the clearly decreasing trend in iso. The decreasing trend in iso is a result of starvation (Figure 11): gas depletion due to star formation and feedback favors the high regions with high local , reducing the ratio of the denser (e.g., ; H2-dominated) gas. While in the RPS cases, gas removal favors the low regions where the gravitational restoring force is weakest (“outside-in stripping”), and the disk central regions can be replenished by the ram pressure-driven mass flows like fallback and radial inflows (§5.1) — both mechanisms increasing the dense gas ratio within the disk. Compared at the pericenter times (Table 5), in 13W and 14W are and dex higher than iso (a factor of and ), respectively.
Our result that RPS can increase the dense gas ratio agrees with Moretti et al. (2020), which found a factor of 4 to 100 higher ratios for three GASP jellyfish galaxies (undergoing active RPS) than the xGASS disk control sample (dash-dotted line in Figure 15). Moretti et al. (2020) suggested that a more efficient conversion of neutral into molecular gas in these jellyfish galaxies can explain their significantly higher molecular mass ratios. However, the trends in our simulations can be explained by the different gas depletion models under starvation versus RPS described above, independent of the H i-H2 conversion. Despite the different definitions, our values are comparable with the observational values of the xGASS sample (Figure 15); we do not see the high () of the three jellyfish galaxies in Moretti et al. (2020).
The evolution of the gas mass fraction (Figure 15 right panel) closely follows that of (Figure 3), because the stellar mass evolution is relatively minimal throughout the simulations ( ). The initial condition of we adopted (§2.1) is 0.5 dex higher than the xGASS average value ( galaxies, Catinella et al. 2018, but within 1 of Calette et al. 2018), otherwise the evolution throughout the iso simulation is within the observational scatter of xGASS (cyan shading in Figure 15). We take in iso as the reference gas fraction in our simulations: 12W is in overall agreement with iso, 13W at the group pericenter is mildly lower ( dex), and 14W at the cluster pericenter significantly lower ( dex). As expected, direct removal by RPS decreases the total and hence in the group and cluster cases. But in the group case, a dex deviation from prediction is within the typical observational scatter ( dex) of such relations (see Figure 15 and Cortese et al. 2021 fig 2). The satellite at 13W pericenter has a reduced gas fraction but still belongs to the gas normal regime, while at 14W, it is gas deficient during the final 400 Myr approaching the pericenter.
For the simulation cases with observable gas stripping morphology (13W and 14W), RPS always reduces in the galaxy disks. This means that under RPS, despite the mass transfer channels that can potentially replenish the dense/central-disk gas, stripping of the low-density/outer-disk gas dominates the global mass evolution (see, e.g., Figure 7). But when we account for the total gas in the disk and tail (tail gas potentially unbound), we find, similarly to Moretti et al. (2020), that is similar between the RPS and iso cases.
To summarize §5.2.1, first, RPS with an edge-on component tends to increase the dense gas ratio in the disk, while starvation decreases it. This could explain the observed higher molecular-to-atomic gas ratio () in jellyfish galaxies (Moretti et al., 2020) without requiring a substantially higher H i-H2 conversion efficiency. Second, RPS (unsurprisingly) reduces the gas mass fractions in the disk, even where the global SFR is enhanced. Where ram pressure at the orbital pericenter is insufficient to remove the densest ISM (13W), the reduction can be mild, maintaining the stripped galaxy in the gas normal regime ( dex). The remaining gas in the disk at 13W pericenter will likely be perturbed by galaxy-galaxy gravitational interactions, which are expected to be effective in group environments; see §5.3.
5.2.2 RPS signatures on the local SFR-mass relations
High angular resolution observations have enabled the direct mapping of galactic star formation laws on small scales (Bigiel et al., 2008; Leroy et al., 2008; Kennicutt & Evans, 2012). Some recent programs include the PHANGS (Physics at High Angular resolution in Nearby GalaxieS) survey for nearby galaxies (Leroy et al., 2021; Lee et al., 2022), the VERTICO survey for Virgo cluster galaxies (Brown et al., 2021; Jiménez-Donaire et al., 2023), and the GASP survey for environmentally selected jellyfish galaxies (Poggianti et al., 2017; Jaffé et al., 2018; Vulcani et al., 2020; Moretti et al., 2020). RPS is one of the main environmental processes in the environmentally-selected samples (e.g., GASP and VERTICO), but the assessment of the RPS impact often faces several challenges: (i) the inevitable mixture of sample stellar masses and inclination angles, (ii) the difficulties of constraining the environment (e.g., ICM densities) and the satellite orbits, and (iii) the complex gravitational effects that could coexist with RPS. Here, we use our simulation suite, which focuses on a single galaxy across various environments undergoing RPS and no tidal effects, to make predictions for the observational “RPS signatures” on the local SFR-mass relations.
To create mock observational datasets, we selected 900 Myr of simulation data (90 outputs) that cover more than 3 dex of in the wind runs (Figure 2), ranging over 1.5 Gyr in simulation time. Stacking the selected data creates two datasets, the stripping set and the isolated control set. This is equivalent to observing an ensemble of galaxies at undergoing various stages of RPS (stripping set: Milky Way-like to cluster pericenter environments) or starvation (isolated control set: 1.5 Gyr duration). Figure 16 shows the local SFR-mass relations for the two sets on 1 kpc2 scale, following the methodology described in §4. In Figure 16, we shaded the low SFR regions where are below observational limits (-4 dex, e.g., Leroy et al. 2012; Kennicutt & Evans 2012; Vulcani et al. 2020). The over-densities in the simulation data at certain low is a numerical effect due to our star particle mass resolution (e.g., the lowest horizontal over-density corresponds to the from a single star particle of ). To guide observational comparison, we show the global KS relation for the 61 non-starburst spiral galaxies from Kennicutt (1998) on the left panel in addition to the resolved KS relations from Bigiel et al. (2008); also see Figure 10. The discontinuous sampling at high (right panel) is caused by the limited 1 kpc2 spatial patch number in the disk center.
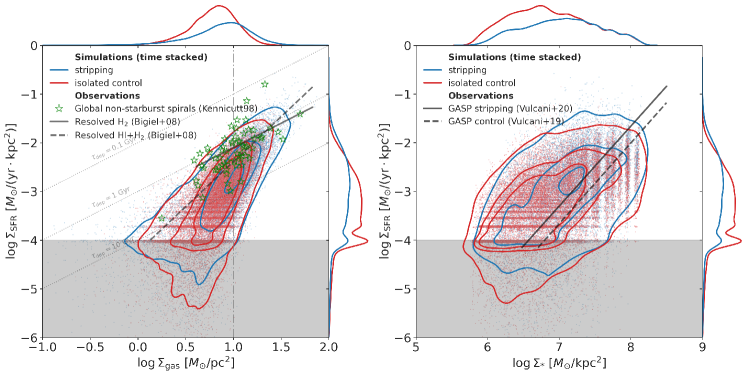
The resolved KS relation for the time-stacked stripping and iso sets is remarkably consistent (Figure 16 left panel). When observed at different snapshots in time (e.g., in Figures 10 and 11), the galaxy populates different ranges, which is closely correlated with the local (§4.2). In the time-stacked view, where the ranges become similar between the two sets, the underlying KS relation is in overall agreement. Our finding is consistent with Jiménez-Donaire et al. (2023) (VERTICO) results that the local KS relation agrees between an ensemble of Virgo RPS satellites and their isolated field counterparts, which suggests that RPS does not directly affect the local star formation efficiency within the gas.
The main difference between the stripping and isolated control sets is best seen in the 1D distributions of and . The stripping set reaches higher maximum surface densities and is truncated at low surface densities; the peaks in both and distribution are at higher values compared with the isolated set. The difference can be explained by a combination of low-density gas removal and high-density gas replenishment in the stripping set; see the evolution of the dense gas ratio (§5.2.1). Another relatively minor difference is that the stripping set reaches higher at low ( dex), which, as also discussed above, is likely due to fast gas removal by RPS in still star-forming regions. The signals of high at low only occur shortly before the complete removal of gas (cluster pericenter in Figure 10).
The time-stacked star formation main sequence relation (Figure 16 right panel) shows a mild enhancement over a range of in the stripping set. Independent of RPS or starvation, the radial profiles remain monotonic (Figure 9), so the local can be used as an indicator of disk radii. Under increasing ram pressure, the threshold where the wind SFR exceeds iso SFR increases (corresponding disk radius decreases), so the time-stacked result here shows a smoother enhancement that extends to lower (larger radii) compared with the group and cluster pericenter cases (Figure 12). This agrees with the Vulcani et al. (2020) (GASP) finding that can be enhanced over a range of when accounting for various stripping stages. However, at the lowest end, where Vulcani et al. (2020) found SFR enhancement in the stripping sample, our simulations always show disk truncation (lowest not populated in the stripping set; §4.3), instead of SFR enhancement. We note that since we focused on the disk region ( kpc), our sampled patches are free of star-forming clumps in the tail, which are shown to have a higher than the disk at low (Vulcani et al., 2020).
Our predictions in §5.2.2 can be summarized as follows. When observing a large ensemble of RPS and isolated galaxies at the same stellar mass, the set of galaxies undergoing RPS will have the same KS relation with the isolated control set at comparable gas surface densities. Individual galaxies may populate different ranges and hence occupy different subsets of the ensemble KS relation, which can be caused by both active (RPS-driven gas flows) and passive (gas consumption due to starvation) mechanisms, as shown in Figure 11. But there is no evidence of star formation efficiency change at given in the RPS cases. On the star formation main sequence plane (), the RPS galaxy disks (clear of tail contamination and inclination/projection effects) will show enhanced above a certain threshold, and sparse sampling indicating disk truncation below the threshold. This is because galaxies undergoing RPS tend to have more centrally concentrated gas (and SFR) radial profiles than their isolated counterparts under starvation (e.g., Figure 9). All predictions here assume that RPS is the only active effect and starvation is the only passive effect. We discuss how these assumptions are limited and their implications in §5.3 below.
5.3 Limitations
We made idealistic simplifications in our modeling choices in order to focus on the science goals. We adopted a single star formation and feedback recipe (Goldbaum et al., 2015, 2016) and a static dark matter potential, omitted the direct modeling of magnetic fields, turbulence, and cosmic rays, and only sampled a single (most probable; Wetzel 2011) satellite orbit and a 45∘ wind inclination in each halo, instead of conducting a population study. In particular, we discuss the following two and their implications.
(i) Gas removal by gravitational mechanisms. Our controlled suite of hydrodynamical simulations only includes active gas removal by RPS; we are missing the gravitational mechanisms, including satellite-host and satellite-satellite interactions (Boselli & Gavazzi, 2006). In clusters, RPS by the ICM is the dominant mechanism for cold gas stripping (Boselli & Gavazzi, 2006; Cortese et al., 2021). In galaxy groups (lower relative velocities), satellite-satellite gravitational interactions are traditionally considered the primary stripping mechanism based on the observational evidence in various systems (e.g., Yun et al. 1994; Serra et al. 2013; Lee-Waddell et al. 2019; Wang et al. 2022). However, the observational selection bias towards gas-rich galaxies in groups may have favored the gravitational mechanisms (Cortese et al., 2021); in fact, both simulations (Bekki, 2014; Bahé & McCarthy, 2015; Marasco et al., 2016) and recent observational work (Roberts et al., 2021; Putman et al., 2021; Kolcu et al., 2022) have found that RPS can be efficient in galaxy groups. RPS and gravitational (satellite-satellite) interactions are likely both effective in groups, and the relative importance depends on individual environments and satellites.
Missing the aspect of gravitational interactions, we likely overestimated the final (and ) in our galaxy group case (13W; Figures 3 and 15), as gravitational encounters can contribute to active gas removal. As the satellite still retains some ISM at 13W pericenter, gravitational interactions will additionally perturb the remaining gas, affecting its morphology and kinematics (Figures 5 and 6), and cause disturbances in the stellar disk. Such effects may also be present in the Milky Way and cluster halo cases but will have a weaker impact on the global properties (low likelihood of massive galaxy-galaxy close encounters in a Milky Way-like halo; high relative velocities in clusters).
Gravitational interactions will not change our key result of the RPS-induced star formation enhancement. Gas stripping by gravitational mechanisms is “outside-in” like RPS and will have a relatively minimal impact on the dense gas in the disk center, where the SFR enhancement occurs in our simulations (e.g., Figures 9 and 12). Our result is overall consistent with current observational evidence of triggered star formation that is of RPS origin, including global and local SFR enhancement (Vulcani et al., 2018, 2020; Roberts & Parker, 2020), and star formation in the tail (Hester et al., 2010; Ebeling et al., 2014; Poggianti et al., 2019).
(ii) Passive gas depletion and accretion. We modeled passive gas depletion (i.e., free of direct removal) in our isolated galaxy simulation: steady consumption by star formation and stellar and supernova feedback-driven outflows. This scenario, however, only applies to a special case of galaxies where gas accretion has been halted, which we referred to as starvation following literature conventions (Larson et al., 1980). Accretion flows can naturally be halted by RPS, but they also likely occur in many of the star-forming field galaxies today, whose SFR relies on the rejuvenating cold gas accretion, e.g., via cooling inflows from the circumgalactic medium (CGM; Tumlinson et al. 2017).
Gas accretion is a fundamental aspect of galaxy evolution that remains poorly constrained (Fox & Davé, 2017). With the typical inflow rates and redshift dependence being highly uncertain, direct modeling of accretion is challenging. But we can infer the impact of accretion by comparing the SFR-time evolution in our simulated iso case (starvation without accretion), with the observational SFR-redshift relation (Speagle et al., 2014) at our modeled stellar mass. The difference in the SFR time evolution will characterize the star formation fueled by accretion missing in our iso simulation.
Taking the initial and final conditions in iso (Figure 3; Myr and Myr), which converts to Gyr and the present day, the best-fit relation from Speagle et al. (2014) gives of 0.07 and -0.24 dex. While in the iso simulation (starvation without accretion), the initial and final are 0.18 and -0.46 dex, respectively. The simulation values are still within the expected scatter of (0.3 dex; Speagle et al. 2014), but unsurprisingly decrease faster with time due to the lack of replenishment. If we use the observational best-fit value as our field galaxy control case instead, which represents the average of observed star-forming galaxies at this stellar mass, the galaxy group case (13W) still shows globally enhanced SFR, although the enhancement becomes mild (a factor of 1.5 instead of 2.5).
6 Summary and Conclusions
In this paper, we present a suite of galaxy-scale “wind-tunnel” simulations with radiative cooling, star formation, and supernovae feedback, modeling a low-mass satellite galaxy undergoing RPS in various halo environments. The input time-varying ram pressure covers over three orders of magnitude (Figure 2), representing realistic satellite infall orbits from a Milky Way-like halo’s to a cluster’s pericenter. We simulate the same satellite galaxy in isolation for 3 Gyr as a control case, and compare the simulations in terms of their global evolution, gas morphology and kinematics, and the spatially resolved SFR-mass relations. Our key findings can be summarized as follows.
-
1.
RPS has the potential to quench or enhance (up to a factor of 2.5) the global SFR of a satellite galaxy while gas is being removed (Figure 3). The impact on SFR depends on both the strength and the time derivative of the ram pressure.
- 2.
-
3.
Under an inclined wind (with face-on and edge-on components), stripping in the disk outskirts dominates the gas mass loss, but when the pericentric ram pressure is insufficient for complete gas removal (13W), some stripped gas falls back and replenishes the central disk (Figures 6 and 7). The edge-on component of ram pressure also drives a direct radial gas inflow (13W and 14W; Figure 8) where it counters the disk rotation (right panel of Figure 6).
This radial gas transport has the following consequences:
-
4.
The stripping set (13W and 14W) shows an excess of high -high material relative to the iso control set on the spatially resolved KS plane (Figure 10). However, the underlying KS relation is the same between the two sets when compared at similar (Figure 11), indicating that RPS has no direct effect on the star formation efficiency.
-
5.
On the spatially resolved SFR-stellar mass plane, the stripping set shows enhanced at high (corresponding to central disk regions) relative to iso, and is truncated at the lowest (Figure 12).
-
6.
The dense gas ratio (; an approximation for ) increases with time in the stripping set because of a combination of low-density gas removal and dense gas replenishment, as opposed to the decreasing trend in iso due to starvation (Figure 15).
Several of our findings agree with observational results. First, the RPS-induced global SFR enhancement is mild, up to a factor of 2.5 relative to iso, or 1.5 relative to the observational SFR-redshift relation (Speagle et al. 2014; see §5.3). This agrees with the typical enhancement factor of 2 in observational samples of RPS-triggered star formation (Iglesias-Páramo et al., 2004; Vulcani et al., 2018; Roberts & Parker, 2020). Second, despite occupying different ranges, the stripping and isolated sets follow the same local KS relation, consistent with Jiménez-Donaire et al. (2023) (the VERTICO survey); the stripping set’s is smoothly enhanced at high — the inner disk, consistent with Vulcani et al. (2020) (the GASP survey). Third, the stripping set acquires an enhanced dense gas ratio, which agrees with the high ratios found for three GASP jellyfish galaxies (Moretti et al., 2020). Finally, RPS by a galaxy group medium can be effective for low-mass spiral galaxies and potentially lead to enhanced global SFR (Roberts et al., 2021; Kolcu et al., 2022).
The radial redistribution of gas in the galaxy is a key result of this work: gas is stripped from the outskirts and enhanced in the center. It is the direct cause of the SFR enhancement when is insufficient to remove the entire gas disk; when is sufficient for central gas removal, the galaxy is ultimately quenched of star formation. This mass transport scenario is consistent with the increased dense gas ratio in jellyfish galaxies (Moretti et al., 2020), the local KS relation agreement between environmentally selected samples (Jiménez-Donaire et al., 2023), and the comparable star formation efficiency between the leading and trailing halves of the disk (Figure 14). We find that this explanation is a better match to the simulations than compression by ram pressure (§5.1) or a more efficient H i-H2 conversion (§5.2.1) — as the main driver for potential SFR enhancement.
References
- Abadi et al. (1999) Abadi, M. G., Moore, B., & Bower, R. G. 1999, MNRAS, 308, 947, doi: 10.1046/j.1365-8711.1999.02715.x
- Akerman et al. (2023) Akerman, N., Tonnesen, S., Poggianti, B. M., Smith, R., & Marasco, A. 2023, ApJ, 948, 18, doi: 10.3847/1538-4357/acbf4d
- Anderson & Bregman (2011) Anderson, M. E., & Bregman, J. N. 2011, ApJ, 737, 22, doi: 10.1088/0004-637X/737/1/22
- Appleby et al. (2020) Appleby, S., Davé, R., Kraljic, K., Anglés-Alcázar, D., & Narayanan, D. 2020, MNRAS, 494, 6053, doi: 10.1093/mnras/staa1169
- Arnaud (2009) Arnaud, M. 2009, A&A, Volume 500, Issue 1, 2009, pp.103-104, 500, 103, doi: 10.1051/0004-6361/200912150
- Astropy Collaboration et al. (2013) Astropy Collaboration, Robitaille, T. P., Tollerud, E. J., et al. 2013, A&A, 558, A33, doi: 10.1051/0004-6361/201322068
- Astropy Collaboration et al. (2018) Astropy Collaboration, Price-Whelan, A. M., Sipőcz, B. M., et al. 2018, AJ, 156, 123, doi: 10.3847/1538-3881/aabc4f
- Astropy Collaboration et al. (2022) Astropy Collaboration, Price-Whelan, A. M., Lim, P. L., et al. 2022, ApJ, 935, 167, doi: 10.3847/1538-4357/ac7c74
- Bahé & McCarthy (2015) Bahé, Y. M., & McCarthy, I. G. 2015, MNRAS, 447, 969, doi: 10.1093/mnras/stu2293
- Bahé et al. (2012) Bahé, Y. M., McCarthy, I. G., Crain, R. A., & Theuns, T. 2012, MNRAS, 424, 1179, doi: 10.1111/j.1365-2966.2012.21292.x
- Bahé et al. (2019) Bahé, Y. M., Schaye, J., Barnes, D. J., et al. 2019, MNRAS, 485, 2287, doi: 10.1093/mnras/stz361
- Baldry et al. (2006) Baldry, I. K., Balogh, M. L., Bower, R. G., et al. 2006, MNRAS, 373, 469, doi: 10.1111/j.1365-2966.2006.11081.x
- Bekki (2014) Bekki, K. 2014, MNRAS, 438, 444, doi: 10.1093/mnras/stt2216
- Bigiel et al. (2008) Bigiel, F., Leroy, A., Walter, F., et al. 2008, AJ, 136, 2846, doi: 10.1088/0004-6256/136/6/2846
- Blok et al. (2008) Blok, W. J. G. d., Walter, F., Brinks, E., et al. 2008, AJ, 136, 2648, doi: 10.1088/0004-6256/136/6/2648
- Boselli et al. (2006) Boselli, A., Boissier, S., Cortese, L., et al. 2006, ApJ, 651, 811, doi: 10.1086/507766
- Boselli & Gavazzi (2006) Boselli, A., & Gavazzi, G. 2006, Publications of the Astronomical Society of the Pacific, 118, 517, doi: 10.1086/500691
- Brown et al. (2021) Brown, T., Wilson, C. D., Zabel, N., et al. 2021, ApJS, 257, 21, doi: 10.3847/1538-4365/ac28f5
- Bryan et al. (2014) Bryan, G. L., Norman, M. L., O’Shea, B. W., et al. 2014, ApJS, 211, 19, doi: 10.1088/0067-0049/211/2/19
- Burkert (1995) Burkert, A. 1995, ApJ, 447, L25, doi: 10.1086/309560
- Calette et al. (2018) Calette, A. R., Avila-Reese, V., Rodríguez-Puebla, A., Hernández-Toledo, H., & Papastergis, E. 2018, Rev. Mex. Astron. Astrofis., 54, 443. https://ui.adsabs.harvard.edu/abs/2018RMxAA..54..443C
- Catinella et al. (2018) Catinella, B., Saintonge, A., Janowiecki, S., et al. 2018, MNRAS, 476, 875, doi: 10.1093/mnras/sty089
- Cavaliere & Fusco-Femiano (1976) Cavaliere, A., & Fusco-Femiano, R. 1976, A&A, 49, 137. https://ui.adsabs.harvard.edu/abs/1976A&A....49..137C/abstract
- Choi et al. (2022) Choi, W., Kim, C.-G., & Chung, A. 2022, ApJ, 936, 133, doi: 10.3847/1538-4357/ac82ba
- Cortese et al. (2021) Cortese, L., Catinella, B., & Smith, R. 2021, Publications of the Astronomical Society of Australia, 38, e035, doi: 10.1017/pasa.2021.18
- Croton et al. (2006) Croton, D. J., Springel, V., White, S. D. M., et al. 2006, MNRAS, 365, 11, doi: 10.1111/j.1365-2966.2005.09675.x
- Crowl & Kenney (2008) Crowl, H. H., & Kenney, J. D. P. 2008, AJ, 136, 1623, doi: 10.1088/0004-6256/136/4/1623
- Dai et al. (2012) Dai, X., Anderson, M. E., Bregman, J. N., & Miller, J. M. 2012, ApJ, 755, 107, doi: 10.1088/0004-637X/755/2/107
- Dalla Vecchia & Schaye (2008) Dalla Vecchia, C., & Schaye, J. 2008, MNRAS, 387, 1431, doi: 10.1111/j.1365-2966.2008.13322.x
- Deb et al. (2022) Deb, T., Verheijen, M. A. W., Poggianti, B. M., et al. 2022, MNRAS, 516, 2683, doi: 10.1093/mnras/stac2441
- Donnari et al. (2021a) Donnari, M., Pillepich, A., Nelson, D., et al. 2021a, MNRAS, 506, 4760, doi: 10.1093/mnras/stab1950
- Donnari et al. (2021b) Donnari, M., Pillepich, A., Joshi, G. D., et al. 2021b, MNRAS, 500, 4004, doi: 10.1093/mnras/staa3006
- Ebeling et al. (2014) Ebeling, H., Stephenson, L. N., & Edge, A. C. 2014, ApJ, 781, L40, doi: 10.1088/2041-8205/781/2/L40
- Fox & Davé (2017) Fox, A., & Davé, R. 2017, Gas Accretion onto Galaxies, 430, doi: 10.1007/978-3-319-52512-9
- Goldbaum et al. (2015) Goldbaum, N. J., Krumholz, M. R., & Forbes, J. C. 2015, ApJ, 814, 131, doi: 10.1088/0004-637X/814/2/131
- Goldbaum et al. (2016) —. 2016, ApJ, 827, 28, doi: 10.3847/0004-637X/827/1/28
- Gunn & Gott (1972) Gunn, J. E., & Gott, III, J. R. 1972, ApJ, 176, 1, doi: 10.1086/151605
- Haardt & Madau (2012) Haardt, F., & Madau, P. 2012, ApJ, 746, 125, doi: 10.1088/0004-637X/746/2/125
- Haines et al. (2015) Haines, C. P., Pereira, M. J., Smith, G. P., et al. 2015, ApJ, 806, 101, doi: 10.1088/0004-637X/806/1/101
- Harris et al. (2020) Harris, C. R., Millman, K. J., van der Walt, S. J., et al. 2020, Nature, 585, 357, doi: 10.1038/s41586-020-2649-2
- Heiderman et al. (2010) Heiderman, A., Evans, II, N. J., Allen, L. E., Huard, T., & Heyer, M. 2010, ApJ, 723, 1019, doi: 10.1088/0004-637X/723/2/1019
- Hester et al. (2010) Hester, J. A., Seibert, M., Neill, J. D., et al. 2010, ApJ, 716, L14, doi: 10.1088/2041-8205/716/1/L14
- Iglesias-Páramo et al. (2004) Iglesias-Páramo, J., Boselli, A., Gavazzi, G., & Zaccardo, A. 2004, A&A, 421, 887, doi: 10.1051/0004-6361:20034572
- Jaffé et al. (2018) Jaffé, Y. L., Poggianti, B. M., Moretti, A., et al. 2018, MNRAS, 476, 4753, doi: 10.1093/mnras/sty500
- Jiménez-Donaire et al. (2023) Jiménez-Donaire, M. J., Brown, T., Wilson, C. D., et al. 2023, A&A, 671, A3, doi: 10.1051/0004-6361/202244718
- Jung et al. (2018) Jung, S. L., Choi, H., Wong, O. I., et al. 2018, ApJ, 865, 156, doi: 10.3847/1538-4357/aadda2
- Jáchym et al. (2007) Jáchym, P., Palouš, J., Köppen, J., & Combes, F. 2007, A&A, 472, 5, doi: 10.1051/0004-6361:20066442
- Jáchym et al. (2019) Jáchym, P., Kenney, J. D. P., Sun, M., et al. 2019, ApJ, 883, 145, doi: 10.3847/1538-4357/ab3e6c
- Kapferer et al. (2009) Kapferer, W., Sluka, C., Schindler, S., Ferrari, C., & Ziegler, B. 2009, A&A, 499, 87, doi: 10.1051/0004-6361/200811551
- Kauffmann et al. (2004) Kauffmann, G., White, S. D. M., Heckman, T. M., et al. 2004, MNRAS, 353, 713, doi: 10.1111/j.1365-2966.2004.08117.x
- Kennicutt & Evans (2012) Kennicutt, R. C., & Evans, N. J. 2012, ARA&A, 50, 531, doi: 10.1146/annurev-astro-081811-125610
- Kennicutt (1989) Kennicutt, Jr., R. C. 1989, ApJ, 344, 685, doi: 10.1086/167834
- Kennicutt (1998) —. 1998, ApJ, 498, 541, doi: 10.1086/305588
- Kolcu et al. (2022) Kolcu, T., Crossett, J. P., Bellhouse, C., & McGee, S. 2022, MNRAS, 515, 5877, doi: 10.1093/mnras/stac2177
- Komatsu & Seljak (2001) Komatsu, E., & Seljak, U. 2001, MNRAS, 327, 1353, doi: 10.1046/j.1365-8711.2001.04838.x
- Kruijssen & Longmore (2014) Kruijssen, J. M. D., & Longmore, S. N. 2014, MNRAS, 439, 3239, doi: 10.1093/mnras/stu098
- Kruijssen et al. (2018) Kruijssen, J. M. D., Schruba, A., Hygate, A. P. S., et al. 2018, MNRAS, 479, 1866, doi: 10.1093/mnras/sty1128
- Krumholz et al. (2012) Krumholz, M. R., Dekel, A., & McKee, C. F. 2012, ApJ, 745, 69, doi: 10.1088/0004-637X/745/1/69
- Krumholz et al. (2009) Krumholz, M. R., McKee, C. F., & Tumlinson, J. 2009, ApJ, 693, 216, doi: 10.1088/0004-637X/693/1/216
- Larson et al. (1980) Larson, R. B., Tinsley, B. M., & Caldwell, C. N. 1980, ApJ, 237, 692, doi: 10.1086/157917
- Lee et al. (2020) Lee, J., Kimm, T., Katz, H., et al. 2020, ApJ, 905, 31, doi: 10.3847/1538-4357/abc3b8
- Lee et al. (2022) Lee, J. C., Whitmore, B. C., Thilker, D. A., et al. 2022, ApJS, 258, 10, doi: 10.3847/1538-4365/ac1fe5
- Lee-Waddell et al. (2019) Lee-Waddell, K., Koribalski, B. S., Westmeier, T., et al. 2019, MNRAS, 487, 5248, doi: 10.1093/mnras/stz017
- Lelli et al. (2019) Lelli, F., McGaugh, S. S., Schombert, J. M., Desmond, H., & Katz, H. 2019, MNRAS, 484, 3267, doi: 10.1093/mnras/stz205
- Leroy et al. (2008) Leroy, A. K., Walter, F., Brinks, E., et al. 2008, AJ, 136, 2782, doi: 10.1088/0004-6256/136/6/2782
- Leroy et al. (2012) Leroy, A. K., Bigiel, F., de Blok, W. J. G., et al. 2012, AJ, 144, 3, doi: 10.1088/0004-6256/144/1/3
- Leroy et al. (2021) Leroy, A. K., Schinnerer, E., Hughes, A., et al. 2021, ApJS, 257, 43, doi: 10.3847/1538-4365/ac17f3
- Lovisari et al. (2015) Lovisari, L., Reiprich, T. H., & Schellenberger, G. 2015, A&A, 573, A118, doi: 10.1051/0004-6361/201423954
- Ludlow et al. (2014) Ludlow, A. D., Navarro, J. F., Angulo, R. E., et al. 2014, MNRAS, 441, 378, doi: 10.1093/mnras/stu483
- Makino et al. (1998) Makino, N., Sasaki, S., & Suto, Y. 1998, ApJ, 497, 555, doi: 10.1086/305507
- Marasco et al. (2016) Marasco, A., Crain, R. A., Schaye, J., et al. 2016, MNRAS, 461, 2630, doi: 10.1093/mnras/stw1498
- McCarthy et al. (2008) McCarthy, I. G., Frenk, C. S., Font, A. S., et al. 2008, MNRAS, 383, 593, doi: 10.1111/j.1365-2966.2007.12577.x
- McGaugh et al. (2021) McGaugh, S. S., Lelli, F., Schombert, J. M., et al. 2021, AJ, 162, 202, doi: 10.3847/1538-3881/ac2502
- Miller & Bregman (2013) Miller, M. J., & Bregman, J. N. 2013, ApJ, 770, 118, doi: 10.1088/0004-637X/770/2/118
- Miller & Bregman (2015) —. 2015, ApJ, 800, 14, doi: 10.1088/0004-637X/800/1/14
- Miyamoto & Nagai (1975) Miyamoto, M., & Nagai, R. 1975, Publications of the Astronomical Society of Japan, 27, 533. https://ui.adsabs.harvard.edu/abs/1975PASJ...27..533M
- Molnár et al. (2022) Molnár, D. C., Serra, P., van der Hulst, T., et al. 2022, A&A, 659, A94, doi: 10.1051/0004-6361/202142614
- Moretti et al. (2020) Moretti, A., Paladino, R., Poggianti, B. M., et al. 2020, ApJL, 897, L30, doi: 10.3847/2041-8213/ab9f3b
- Mori & Burkert (2000) Mori, M., & Burkert, A. 2000, ApJ, 538, 559, doi: 10.1086/309140
- Navarro et al. (1996) Navarro, J. F., Frenk, C. S., & White, S. D. M. 1996, ApJ, 462, 563, doi: 10.1086/177173
- O’Sullivan et al. (2003) O’Sullivan, E., Ponman, T. J., & Collins, R. S. 2003, MNRAS, 340, 1375, doi: 10.1046/j.1365-8711.2003.06396.x
- Peng et al. (2012) Peng, Y.-j., Lilly, S. J., Renzini, A., & Carollo, M. 2012, ApJ, 757, 4, doi: 10.1088/0004-637X/757/1/4
- Peng et al. (2010) Peng, Y.-j., Lilly, S. J., Kovač, K., et al. 2010, ApJ, 721, 193, doi: 10.1088/0004-637X/721/1/193
- Perez & Granger (2007) Perez, F., & Granger, B. E. 2007, Computing in Science & Engineering, 9, 21, doi: 10.1109/MCSE.2007.53
- Phillips et al. (2014) Phillips, J. I., Wheeler, C., Boylan-Kolchin, M., et al. 2014, MNRAS, 437, 1930, doi: 10.1093/mnras/stt2023
- Pillepich et al. (2018) Pillepich, A., Springel, V., Nelson, D., et al. 2018, MNRAS, 473, 4077, doi: 10.1093/mnras/stx2656
- Poggianti et al. (2016) Poggianti, B. M., Fasano, G., Omizzolo, A., et al. 2016, AJ, 151, 78, doi: 10.3847/0004-6256/151/3/78
- Poggianti et al. (2017) Poggianti, B. M., Moretti, A., Gullieuszik, M., et al. 2017, ApJ, 844, 48, doi: 10.3847/1538-4357/aa78ed
- Poggianti et al. (2019) Poggianti, B. M., Gullieuszik, M., Tonnesen, S., et al. 2019, MNRAS, 482, 4466, doi: 10.1093/mnras/sty2999
- Price-Whelan et al. (2020) Price-Whelan, A., Sipőcz, B., Lenz, D., et al. 2020, adrn/gala: v1.3, Zenodo, doi: 10.5281/zenodo.4159870
- Price-Whelan (2017) Price-Whelan, A. M. 2017, Journal of Open Source Software, 2, 388, doi: 10.21105/joss.00388
- Putman et al. (2021) Putman, M. E., Zheng, Y., Price-Whelan, A. M., et al. 2021, ApJ, 913, 53, doi: 10.3847/1538-4357/abe391
- Quilis et al. (2000) Quilis, V., Moore, B., & Bower, R. 2000, Science, 288, 1617, doi: 10.1126/science.288.5471.1617
- Roberts & Parker (2020) Roberts, I. D., & Parker, L. C. 2020, MNRAS, 495, 554, doi: 10.1093/mnras/staa1213
- Roberts et al. (2021) Roberts, I. D., van Weeren, R. J., McGee, S. L., et al. 2021, A&A, 650, A111, doi: 10.1051/0004-6361/202140784
- Roediger et al. (2014) Roediger, E., Bruggen, M., Owers, M. S., Ebeling, H., & Sun, M. 2014, MNRAS, 443, L114, doi: 10.1093/mnrasl/slu087
- Roediger & Brüggen (2006) Roediger, E., & Brüggen, M. 2006, MNRAS, 369, 567, doi: 10.1111/j.1365-2966.2006.10335.x
- Rohr et al. (2023) Rohr, E., Pillepich, A., Nelson, D., et al. 2023, MNRAS, 524, 3502, doi: 10.1093/mnras/stad2101
- Ruggiero & Lima Neto (2017) Ruggiero, R., & Lima Neto, G. B. 2017, MNRAS, 468, 4107, doi: 10.1093/mnras/stx744
- Saintonge et al. (2017) Saintonge, A., Catinella, B., Tacconi, L. J., et al. 2017, ApJS, 233, 22, doi: 10.3847/1538-4365/aa97e0
- Salem et al. (2015) Salem, M., Besla, G., Bryan, G., et al. 2015, ApJ, 815, 77, doi: 10.1088/0004-637X/815/1/77
- Salucci & Burkert (2000) Salucci, P., & Burkert, A. 2000, ApJ, 537, L9, doi: 10.1086/312747
- Sargent et al. (2014) Sargent, M. T., Daddi, E., Béthermin, M., et al. 2014, ApJ, 793, 19, doi: 10.1088/0004-637X/793/1/19
- Schiminovich et al. (2007) Schiminovich, D., Wyder, T. K., Martin, D. C., et al. 2007, ApJS, 173, 315, doi: 10.1086/524659
- Schmidt (1959) Schmidt, M. 1959, ApJ, 129, 243, doi: 10.1086/146614
- Schulz & Struck (2001) Schulz, S., & Struck, C. 2001, MNRAS, 328, 185, doi: 10.1046/j.1365-8711.2001.04847.x
- Serra et al. (2013) Serra, P., Koribalski, B., Duc, P.-A., et al. 2013, MNRAS, 428, 370, doi: 10.1093/mnras/sts033
- Smith et al. (2017) Smith, B. D., Bryan, G. L., Glover, S. C. O., et al. 2017, MNRAS, 466, 2217, doi: 10.1093/mnras/stw3291
- Speagle et al. (2014) Speagle, J. S., Steinhardt, C. L., Capak, P. L., & Silverman, J. D. 2014, ApJS, 214, 15, doi: 10.1088/0067-0049/214/2/15
- Steinhauser et al. (2016) Steinhauser, D., Schindler, S., & Springel, V. 2016, A&A, 591, A51, doi: 10.1051/0004-6361/201527705
- Sun et al. (2007) Sun, M., Donahue, M., & Voit, G. M. 2007, ApJ, 671, 190, doi: 10.1086/522690
- Swaters et al. (2002) Swaters, R. A., van Albada, T. S., van der Hulst, J. M., & Sancisi, R. 2002, A&A, 390, 829, doi: 10.1051/0004-6361:20011755
- Tasker & Bryan (2006) Tasker, E. J., & Bryan, G. L. 2006, ApJ, 641, 878, doi: 10.1086/500567
- Tonnesen & Bryan (2009) Tonnesen, S., & Bryan, G. L. 2009, ApJ, 694, 789, doi: 10.1088/0004-637X/694/2/789
- Tonnesen & Bryan (2010) —. 2010, ApJ, 709, 1203, doi: 10.1088/0004-637X/709/2/1203
- Tonnesen & Bryan (2012) —. 2012, MNRAS, 422, 1609, doi: 10.1111/j.1365-2966.2012.20737.x
- Tremmel et al. (2019) Tremmel, M., Quinn, T. R., Ricarte, A., et al. 2019, MNRAS, 483, 3336, doi: 10.1093/mnras/sty3336
- Troncoso-Iribarren et al. (2020) Troncoso-Iribarren, P., Padilla, N., Santander, C., et al. 2020, MNRAS, 497, 4145, doi: 10.1093/mnras/staa274
- Trussler et al. (2020) Trussler, J., Maiolino, R., Maraston, C., et al. 2020, MNRAS, 491, 5406, doi: 10.1093/mnras/stz3286
- Tumlinson et al. (2017) Tumlinson, J., Peeples, M. S., & Werk, J. K. 2017, ARA&A, 55, 389, doi: 10.1146/annurev-astro-091916-055240
- Turk et al. (2011) Turk, M. J., Smith, B. D., Oishi, J. S., et al. 2011, ApJS, 192, 9, doi: 10.1088/0067-0049/192/1/9
- van den Bosch et al. (2008) van den Bosch, F. C., Aquino, D., Yang, X., et al. 2008, MNRAS, 387, 79, doi: 10.1111/j.1365-2966.2008.13230.x
- van Gorkom (2004) van Gorkom, J. H. 2004, 305, doi: 10.48550/arXiv.astro-ph/0308209
- Voit (2019) Voit, G. M. 2019, ApJ, 880, 139, doi: 10.3847/1538-4357/ab2bfd
- Vulcani et al. (2018) Vulcani, B., Poggianti, B. M., Gullieuszik, M., et al. 2018, ApJ, 866, L25, doi: 10.3847/2041-8213/aae68b
- Vulcani et al. (2019) Vulcani, B., Poggianti, B. M., Moretti, A., et al. 2019, MNRAS, 488, 1597, doi: 10.1093/mnras/stz1829
- Vulcani et al. (2020) Vulcani, B., Poggianti, B. M., Tonnesen, S., et al. 2020, ApJ, 899, 98, doi: 10.3847/1538-4357/aba4ae
- Wang et al. (2020) Wang, J., Catinella, B., Saintonge, A., et al. 2020, ApJ, 890, 63, doi: 10.3847/1538-4357/ab68dd
- Wang et al. (2022) Wang, S., Wang, J., For, B.-Q., et al. 2022, ApJ, 927, 66, doi: 10.3847/1538-4357/ac4270
- Weinberger et al. (2017) Weinberger, R., Springel, V., Hernquist, L., et al. 2017, MNRAS, 465, 3291, doi: 10.1093/mnras/stw2944
- Wetzel (2011) Wetzel, A. R. 2011, MNRAS, 412, 49, doi: 10.1111/j.1365-2966.2010.17877.x
- Wetzel et al. (2012) Wetzel, A. R., Tinker, J. L., & Conroy, C. 2012, MNRAS, 424, 232, doi: 10.1111/j.1365-2966.2012.21188.x
- Wetzel et al. (2013) Wetzel, A. R., Tinker, J. L., Conroy, C., & van den Bosch, F. C. 2013, MNRAS, 432, 336, doi: 10.1093/mnras/stt469
- Wright et al. (2019) Wright, R. J., Lagos, C. d. P., Davies, L. J. M., et al. 2019, MNRAS, 487, 3740, doi: 10.1093/mnras/stz1410
- Wu (2018) Wu, P.-F. 2018, MNRAS, 473, 5468, doi: 10.1093/mnras/stx2745
- Yun et al. (2019) Yun, K., Pillepich, A., Zinger, E., et al. 2019, MNRAS, 483, 1042, doi: 10.1093/mnras/sty3156
- Yun et al. (1994) Yun, M. S., Ho, P. T. P., & Lo, K. Y. 1994, Nature, 372, 530, doi: 10.1038/372530a0
- Zabludoff et al. (1996) Zabludoff, A. I., Zaritsky, D., Lin, H., et al. 1996, ApJ, 466, 104, doi: 10.1086/177495