IndoHerb: Indonesia Medicinal Plants Recognition using Transfer Learning and Deep Learning
Abstract
Herbal plants are nutritious plants that can be used as an alternative to traditional disease healing. In Indonesia there are various types of herbal plants. But with the development of the times, the existence of herbal plants as traditional medicines began to be forgotten so that not everyone could recognize them. Having the ability to identify herbal plants can have many positive impacts. However, there is a problem where identifying plants can take a long time because it requires in-depth knowledge and careful examination of plant criteria. So that the application of computer vision can help identify herbal plants. Previously, research had been conducted on the introduction of herbal plants from Vietnam using several algorithms, but from these research the accuracy was not high enough. Therefore, this study intends to implement transfer learning from the Convolutional Neural Network (CNN) algorithm to classify types of herbal plants from Indonesia. This research was conducted by collecting image data of herbal plants from Indonesia independently through the Google Images search engine. After that, it will go through the data preprocessing, classification using the transfer learning method from CNN, and analysis will be carried out. The CNN transfer learning models used are ResNet34, DenseNet121, and VGG11_bn. Based on the test results of the three models, it was found that DenseNet121 was the model with the highest accuracy, which was 87.4%. In addition, testing was also carried out using the scratch model and obtained an accuracy of 43.53%. The Hyperparameter configuration used in this test is the ExponentialLR scheduler with a gamma value of 0.9; learning rate 0.001; Cross Entropy Loss function; Adam optimizer; and the number of epochs is 50. Indonesia Medicinal Plant Dataset can be accessed at the following link https://github.com/Salmanim20/indo_medicinal_plant
keywords:
Transfer Learning , Convolutional Neural Network , Computer Vision , Medicinal Plant Images Recognition[inst1]organization=Informatics Engineering, Faculty of Computer Science, Brawijaya University, Malang, 65145, East Java, Indonesia,
1 Introduction
Indonesia is a tropical country that has various types of plants, one of which is herbal plants. Indonesia has 30,000 plant species, of which 9,600 are herbal plants. Herbal plants can be used as an alternative to traditional disease healing. The use of herbal plants as medicine has been used for a long time. However, due to the development of the era, making herbal plants as traditional medicine is starting to be replaced with modern medicine. This resulted in the efficacy of herbal plants starting to lag behind. Even though herbal plants are used less and less, there will certainly be times when herbal plants will be needed for treatment as not everyone can afford treatment with modern medicine due to limited funds or difficult to reach by people from rural areas.
Herbal plants are plants that are efficacious in healing or preventing various diseases. Along with the increase in the level of welfare, awareness and need for the need for a healthy life, including the need for healthy food that is produced naturally, without the use of synthetic chemicals, has also increased. These food products are generally produced through organic cultivation or reusing natural ones. This natural healthy lifestyle is followed by the use of natural herbs. Herbal plants used as medicinal ingredients absolutely must be free of harmful ingredients and must be produced naturally or environmentally friendly and this is termed organic cultivation of medicinal plants, which has recently been widely used by the public. Herbal plants can also be used to improve family and community health [1].
Knowing the types of herbal plants has many positive impacts. However, there are problems where plant identification can take a long time because it requires in-depth knowledge and careful examination of plant phenotypes. Plant identification can be done by various methods such as color, flowers, leaves, texture and structure. These methods can be complicated due to the large number of plant species and also the similarity of plants when reaching the family level [2]. From these problems, a method is needed to be able to identify plants quickly and accurately. At this time the development of science and technology, especially the application of computer vision, has made it easier, faster and more accurate for humans to identify plants. They only need to use a device with an integrated camera to access plant information from the images taken. Currently a lot of research on herbal plants in computer vision. Plant identification can be based on many elements such as plant leaves, roots, and fruits [3]
Quoc & Hoang [3] conducted research on herbal plant identification using the Scale-Invariant Feature Transform (SIFT)[4] and Speeded Up Robust Features (SURF)[5] algorithms. The research was divided into 2 resolution versions for each method, namely 256x256 and 512x512. With the 256x256 resolution version, the SURF method produces an accuracy of 21% and the SIFT method produces an accuracy of 28%. Whereas in the 512x512 resolution version, the SURF method produces an accuracy of 34.7% and the SIFT method produces an accuracy of 37.4%. Another study was conducted using the Naive Bayes[6] and K-Nearest Neighbor[7] methods by Liantoni [8] entitled ”Klasifikasi Daun Herbal Menggunakan Metode Naïve Bayes Classifier Dan Knearest Neighbor”. The results of this study, the Naive Bayes method produces an accuracy rate of 75%, while the K-Nearest Neighbor method produces an accuracy rate of 70.83%.
From the previous research it is known that the accuracy results are not high enough, so this research chooses the transfer learning[9] method from the Convolutional Neural Network[10] to try to improve the accuracy of the classification. This is because this method has advantages, namely in terms of the efficiency of learning algorithms by combining feature extraction and classification algorithms. This method is relatively better at solving object classification problems in images so that it is expected to produce good architecture and effective prediction results. In addition to classifying, this research will also create its own dataset by collecting images of herbal plants from Indonesia.
2 Related Works
There are several previous research about medicinal plants. Quoc & Hoang [3] conducted research on Vietnam Medicinal Plants which used the Scale-Invariant Feature Transform (SIFT)[4] and Speeded Up Robust Features (SURF)[5] algorithms. Then the dataset used is herbal plant images from Vietnam with a total of 20,000 images. The research was divided into 2 resolution versions for each method, namely 256x256 and 512x512. With the 256x256 resolution version, the SURF method produces an accuracy of 21% and the SIFT method produces an accuracy of 28%. Whereas in the 512x512 resolution version, the SURF method produces an accuracy of 34.7% and the SIFT method produces an accuracy of 37.4%. Another research using the Naive Bayes[6] and K-Nearest Neighbor[7] methods by Liantoni [8] entitled ”Classification of Herbal Leaves Using the Naïve Bayes Classifier and Knearest Neighbor Methods” used 120 images as a dataset with the distribution of 96 images of training data and 24 images of testing data. The results of this study show that the Naive Bayes method is a better method than the K-Nearest Neighbor. The Naive Bayes method produces an accuracy rate of 75%, while the K-Nearest Neighbor method produces an accuracy rate of 70.83%. Both methods were tested for 100 epochs. Another research was conducted by Naeem et al. [11] with the title ”The Classification of Medicinal Plant Leaves Based on Multispectral and Texture Feature Using Machine Learning Approach”. This research focuses on the leaves of herbal plants for classification. The dataset used is 6,000 leaf images with 6 classes. So that each class has 1,000 images. Leaf image classes used for research were Tulsi, Peppermint, Bael, Lemon, Balm, Catnip, and Stevia. The classification algorithm methods used in this study include Multi-Layer Perceptron (MLP)[12], LogitBoost (LB)[13], Bagging (B)[14], Random Forest (RF)[15], and Simple Logistic (SL)[16]. The research was divided into two versions of image sizes for each method, namely 220x220 and 280x280. In the 220x220 size version, the accuracy results were 95.87%, 95.04%, 94.21%, 93.38%, and 92.56% for the MLP, LB, B, RF, and SL methods respectively. Whereas in the 280x280 size version, the accuracy results were 99.01%, 98.01%, 97.02%, 96.03%, and 95.04% for the MLP, LB, B, RF, and SL methods respectively. In this study concluded that the Multi-Layer Perceptron method works better than other methods. The number of epochs used in this study was 100 epochs.
Based on that previous research, this research aims to create a new dataset of medicinal plants from Indonesia which are collected independently through the Google Images search engine. Then the datasets will be tested using the transfer learning method from the convolutional neural network. When collecting the datasets, the first thing to do is find out which classes of medicinal plants from Indonesia will be used for research. To find this, a search was made for several websites that provided class names of medicinal plants from Indonesia. From the several websites found, 100 classes of medicinal plants were collected to be used for research. After that, do an image search for each class of medicinal plants using the Google Images search engine. From the search results, images will be manually selected that meet the criteria of the class being searched from the top search results. This needs to be done because sometimes there are some search results that do not match with what we want. When performing image searches, there are some problems such as in the search results sometimes got some images that are the same but from different sources. In this study, this problem has been avoided as much as possible. However, if the same image is still selected accidentally, it will be left alone because the search result is the best search result according to the Google Images search engine, so it doesn’t matter. Another problem is that sometimes there are some images that are not good enough such as there are scribbles, watermarks, etc. so that images like this will not be selected. Then there is still another problem like sometimes there are classes that are less well known or rarely found so that the Google Images search engine gets few search results, such as initially intending to get 100 images but the Google Images search results only get about 30 images that meet the criteria for that class. To dealing with this problem, the thing to do is to do an image augmentation process from the image that has been obtained, such as doing a horizontal flip and a vertical flip. Because of each image that collected has a different size, then all images are resized into 128x128. After that, a dataset of medicinal plants from Indonesia has been created with a total of 10,000 images with 100 classes where each class has 100 images. For the distribution of the dataset before the augmentation process is carried out, it can be seen in Figure 1

Based on Figure 1, it can be seen that there are various numbers of images collected from each class before the augmentation process is carried out. This is due to the limited number of images that can be selected for research due to several problem factors as previously described. The class used in the dataset are Abelmoschus esculentus, Acorus calamus, Aloe vera, Alstonia scholaris, Amaranthus Spinosus, Andrographis paniculata, Annona Muricata, Annona squamosa, Anredera cordifolia, Apium Graveolens, Artocarpus heterophyllus, Artocarpus integer, Averrhoa Bilimbi, Blumea Balsamifera, Borreria hispida, Caesalpinia sappan L, Caladium cicolor, Calendula officinalis, Canangium odoratum, Catharanthus roseus, Celosia cristata, Centella asiatica, Cestrum nocturnum, Citrus hystrix, Clinalanthus nutans, Clitoria ternatea, Crinum Asiaticum, Curcuma domestica, Cyclea barbata, Cymbopogon nardus, Derris elliptica, Desmodium triquitrum, Dioscorea hispida, Eleutherine americana, Euodia suaveolens, Euphatorium triplinerve, Euphorbia tirucalli, Euphoria longan, Ficus carica, Ficus Septica, Graptophyllum pictum, Gynura segetum, Hibiscus rosa-sinensis, Hibiscus sabdariffa, Houttoynia Cordata, Hydrocotyle Sibthorpioides, Impatiens balsamina, Isotoma longiflora, Jasminum sambac, Jatropa multifida, Kaempferia galanga, Melaleuca leucadendra, Melia azedarach, Melissa officinalis, Merremia mammosa, Michelia alba, Mirabilis jalapa, Morinda citrifolia, Morus alba, Muraya paniculata, Murraya koenigii, Nepeta cataria, Nothopanax scutellarium, Ocimum Americanum, Ocimum, basilicum, Olea europaea, Orthosiphon spicatus, Pandanus amaryllifolius, Parameria laevigata, Peperomia pellucida, Phaleria macrocarpa, Physalis Angulata, Phytolacca americana, Piper betle, Piper sarmentosum, Plectranthus Scutellarioides, Pleomele angustifolia, Pluchea indica, Plumbago zeylanica, Pogostemon cablin, Pouteria caimito, Prunus domestica, Psidium guajava, Pyrrus communis, Raulvolvia serpentina, Ricinus communis, Rosmarinus officinalis, Ruellia tuberosa, Ruta angustifolia, Selaginella doederlinii, Syzygium polyanthum, Talinum triangulare, Tinospora tuberculata, Tithonia diversifolia, Typhonium flagelliforme, Vetiveria Zizaniodes, Vitex trifolia, Zephyrathes candida, Zingiber officinale, and Zingiber zerumbet.
3 Methodology
3.1 Gathering Data
The data collected are images of herbal plants, namely from the Vietnam Medicinal Plant public dataset and from the Google images search engine. The data collected from the Vietnam Medicinal Plant public dataset totals 20,000 images with a total of 200 classes of herbal plants to be studied. Whereas in the Indonesia Medicinal Plant dataset obtained from the Google search engine manually, there were 10,000 with 100 classes studied. The class studied is a herbal plant in Indonesia. For example images of Indonesia Medicinal Plant Dataset can be seen in Figures 1.


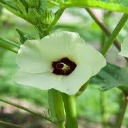
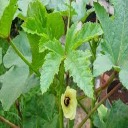

Abelmoschus Esculentus
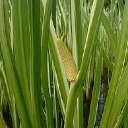
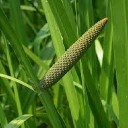

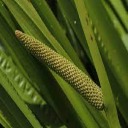
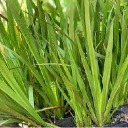
Acorus Calamus
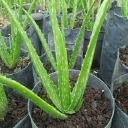
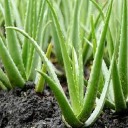
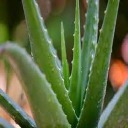
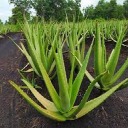

Aloe Vera
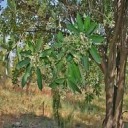
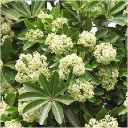
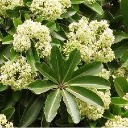
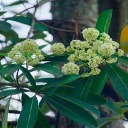
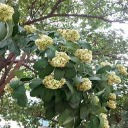
Alstonia Scholaris
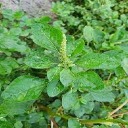
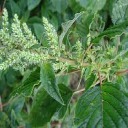
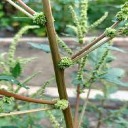
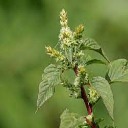
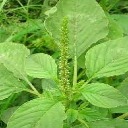
Amaranthus Spinosus
Based on the figure in figure 2, it is examples of 5 classes from the Indonesian herbal plant dataset which were collected by themselves with 5 image examples for each class. The 5 classes are Abelmoschus Esculentus, Acorus Calamus, Aloe Vera, Alstonia Scholaris, and Amaranthus Spinosus. Because the images are obtained from the Google Images search engine, the results of the selected images appear to be more varied from each class
3.2 Preprocessing Data
The data that has been collected will be preprocessed. First, the dataset will be read first and then will continue to carry out the next stage, namely transforming such as resizing, rotating, and normalizing the image data. The image will be resized to a size of 128x128 and normalized the pixel values in the 0-1 range. After that, data sharing was also carried out for training data and testing data.
3.3 Structuring Model
In this study, the Transfer Learning method will be used, so it is necessary to prepare the code to conduct training using Transfer Learning. The Transfer Learning models used in this study are the pretrained ResNet34[17], DenseNet121[18], and VGG11_bn[19] models. In addition, this research will also carry out tests using the scratch model.
The scratch model will create a Convolutional Neural Network design. In general, the CNN method has 2 stages, namely feature learning and classification. This stage initially inputs images to the CNN model using an image that is 128x128x3 in size. Then the image will be processed through the convolution process and the pooling process. The number of convolution processes that will be used in the CNN design in this study are three convolution layers. After that, a flatten process will be carried out or change the feature map resulting from the pooling layer to a vector form which is commonly referred to as the Fully Connected Layer process. At the convolution process stage, it will be designed with a different number of filters and kernel sizes.
The architecture of the scratch model used is that the first convolution will use a total of 32 output channels and a 3x3 kernel matrix. Then do Max Pooling using a 2x2 size. Furthermore, the second convolution will use a total of 64 output channels with a 3x3 kernel matrix. Then Max Pooling is also carried out with the same size as the first convolution, namely 2x2. The third convolution will use a total of 128 output channels with a 3x3 kernel matrix. Then do the Max Pooling process with a size of 2x2. After the convolution process is complete, it is continued with the flatten process, namely changing the output of the previous convolution process in the form of a matrix into a vector which will later be continued in the classification process.
3.4 Testing Model
Testing will be carried out to evaluate the model that has been designed by CNN. The testing will be carried out with training stages and testing stages. At the training stage, the CNN model will be tested with previously prepared training data. The number of training data prepared is 20,000 and 10,000 from two different datasets. The two herbal plant datasets will be divided into 60% training data and 40% testing data. After the training process is complete, it will proceed to the testing stage. The number of testing data used in this study were 8,000 and 4,000 images with 40 images for each class of herbal plants. At the testing stage, of course, it will use different images from those that have been carried out in the training process so that it can find out how accurate the model that has been designed is.
4 Experiments
4.1 Testing the Vietnam Medicinal Plant Dataset
In this study the dataset used is the Vietnam Medicinal Plant Dataset public dataset. This dataset will be tested on several models. These models include the ResNet34[17] pretrained model, the DenseNet121[18] pretrained model, the VGG11_bn[19] pretrained model, and the Scratch model. In addition, when carrying out the test, it will use the dynamic learning rate. The scheduler used for this dynamic learning rate is the ExponentialLR [20] scheduler with a gamma configuration of 0.9. While the learning rate used in this test is 0.001. The dataset being tested totaled 20,000 images with the distribution of training data and testing data of 60:40 so that there were 12,000 training data and 8,000 testing data. There are 200 classes in this dataset where each class has 60 training data images and 40 testing data. This test will be carried out as many as 50 epochs with the optimizer used is Adam[21]. Then the loss function used is Cross Entropy Loss[22].
| No. | Model Name | Training | testing | ||
|---|---|---|---|---|---|
| loss | accuracy | loss | accuracy | ||
| 1. | ResNet34 | 0.0042 | 0.9994 | 0.7834 | 0.8558 |
| 2. | DenseNet121 | 0.0012 | 0.9999 | 0.5801 | 0.8869 |
| 3. | VGG11_bn | 0.0243 | 0.9926 | 1.0907 | 0.8453 |
| 4. | Scratch | 1.6431 | 0.5445 | 2.8549 | 0.3674 |
Based on table 1 above, it can be seen from the four models tested, the DenseNet121 model with an accuracy of 88.69% in the testing process is the model that has the best accuracy compared to the other models. While the Scratch model is the model with the lowest accuracy because the Scratch model has a very simple architecture compared to other models. Then when comparing between the three pretrained models only, the VGG11_bn model is the model that has the lowest accuracy, namely 84.53%. For the loss and accuracy graphs of each model can be seen in the following discussion.
4.1.1 Testing Vietnam Dataset with pretrained model ResNet34
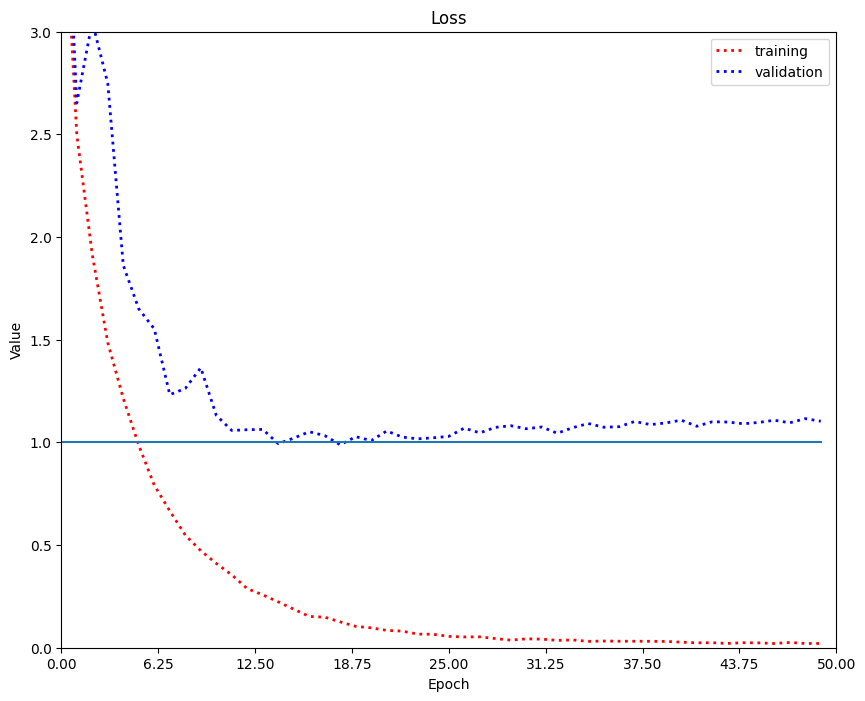
From the results of tests carried out using the ResNet34 pretrained model, the accuracy level of the testing data was 85.58%. The graph of the loss and accuracy values can be seen in the following figure.
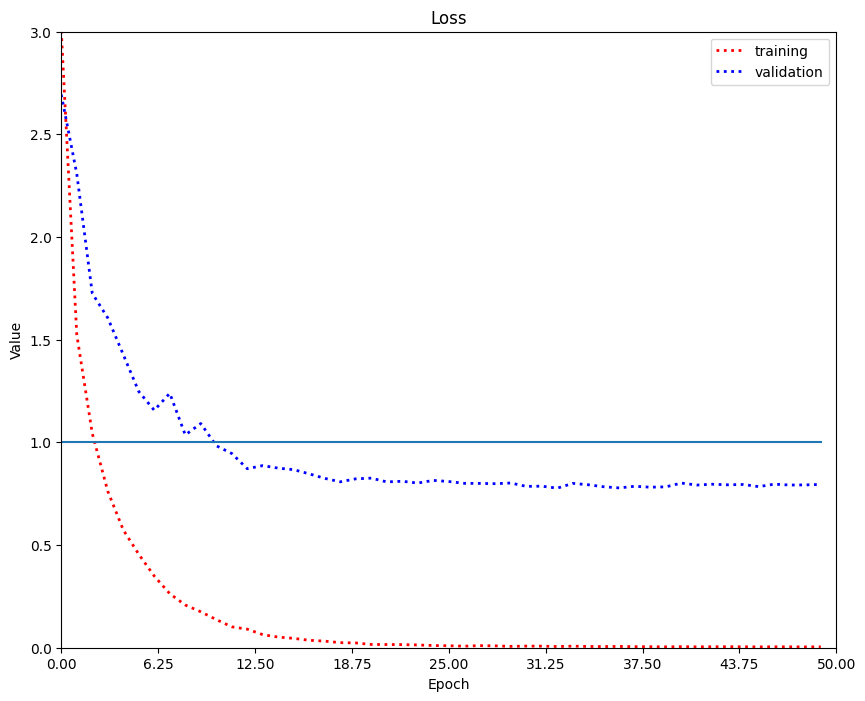
Based on Figure 3 it can be seen that the increasing number of epochs will be followed by a decreasing loss value both during the training and testing processes. From this it can be seen if the training process is running well enough to minimize the loss value so that it does not experience overfitting.
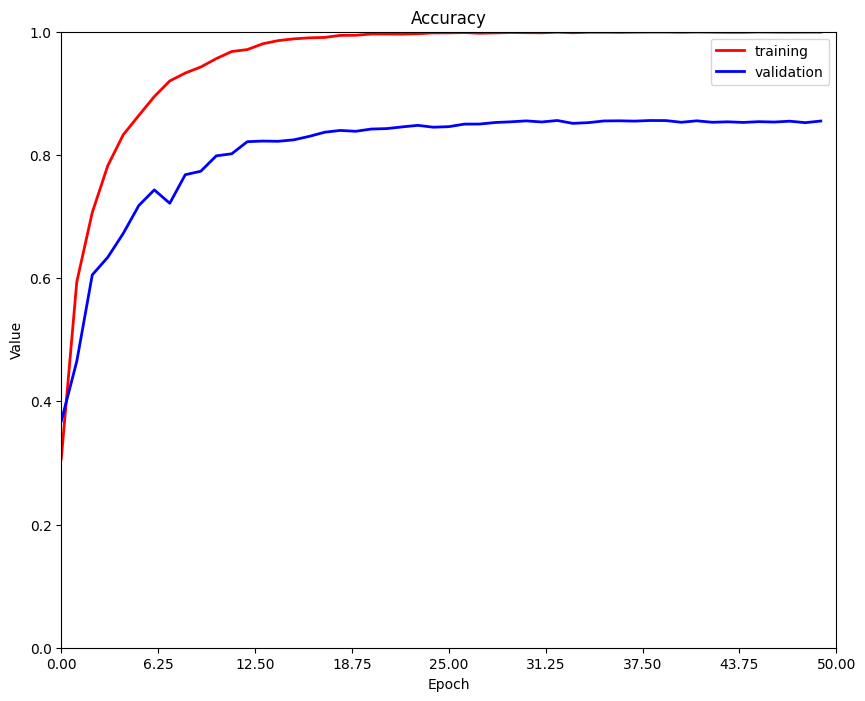
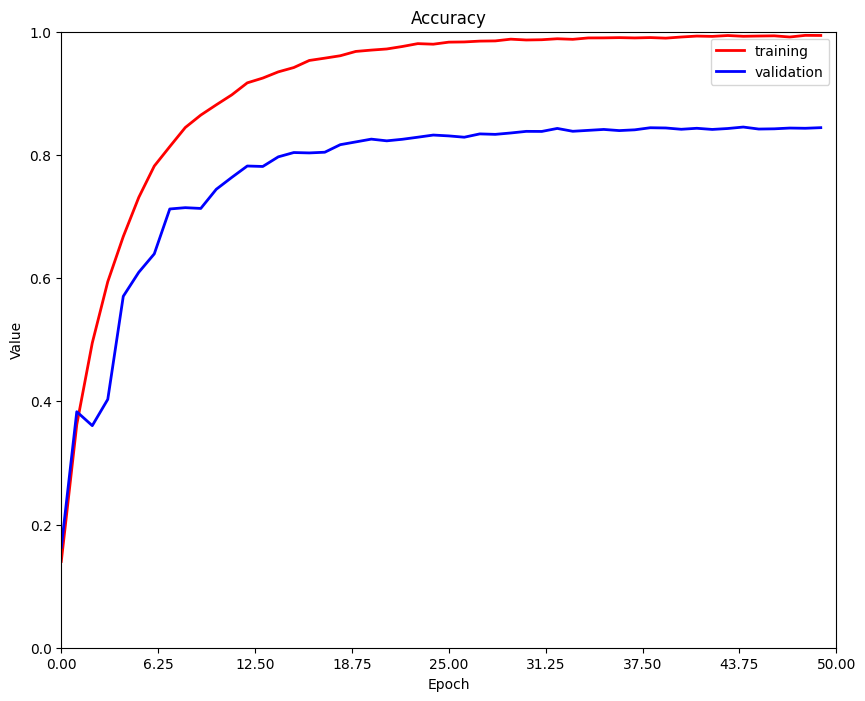
Based on Figure 4 it can be seen that the model can achieve a fairly high accuracy as the number of epochs increases. It can be seen that the accuracy value of the training data starts to pass 0.9 when the epoch is above 12 and increases with increasing epoch. Whereas in data testing it is able to achieve an accuracy level above 0.8 when the epoch is above 15. An increase in the accuracy value indicates that the training process is going quite well.
4.1.2 Testing Vietnam Dataset with pretrained model DenseNet121
The results of tests carried out using the DenseNet121 pretrained model obtained an accuracy level of the data testing of 88.69%. The following is a graph of the loss and accuracy values.
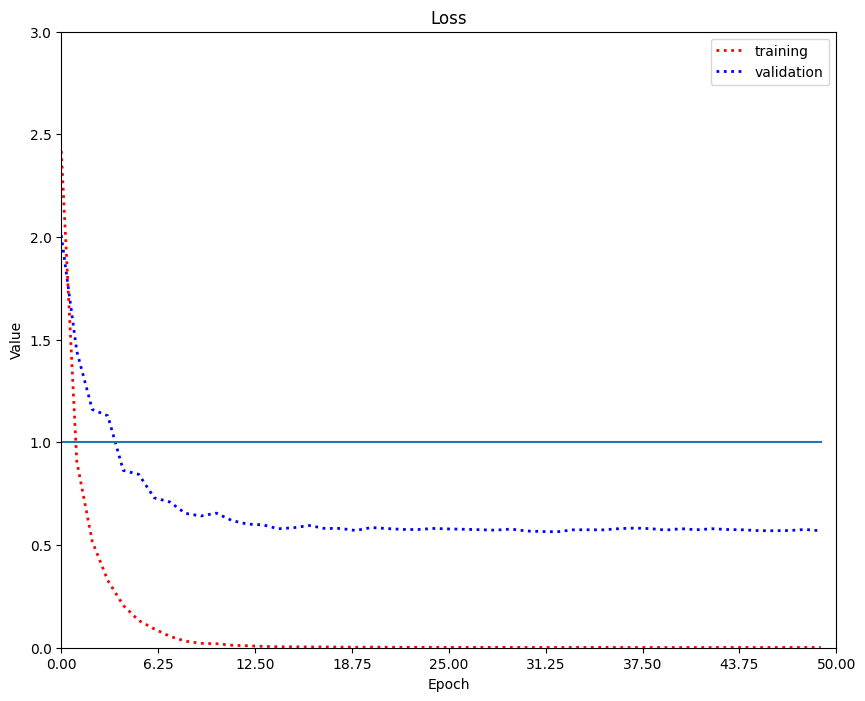
Based on Figure 5 it can be seen that the loss value is decreasing both during the training and testing processes. From this it can be seen if the training process goes well enough to minimize the loss value.
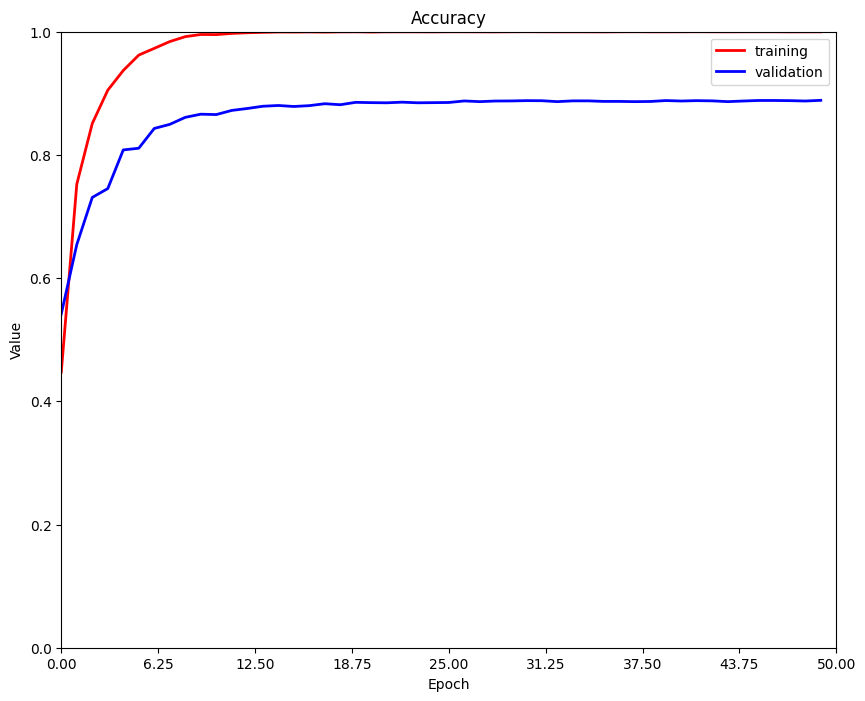
Based on Figure 6 it can be seen that the model can achieve high accuracy beyond 0.9 since the 5th epoch for training data. Whereas in data testing it is able to achieve an accuracy level above 0.8 when the epoch is above 7. An increase in the accuracy value indicates that the training process is going quite well.
4.1.3 Testing Vietnam Dataset with pretrained model VGG_bn
From the results of tests carried out using the VGG11_bn pretrained model, the accuracy level of the testing data was 84.53%. The following is a graph of the loss and accuracy of the model against the epoch.
Based on Figure 7 above, it can be seen that the increasing number of epochs will be followed by a decreasing loss value both during the training and testing processes. Compared to the two previous pretrained models, the loss value in the VGG11_bn pretrained model looks higher. From this, it can be seen that the training process is running well enough to minimize loss, but not better than the other pretrained models.
Based on Figure 8 it is known that the model can achieve high accuracy with increasing number of epochs. The accuracy value of the training data can exceed 0.9 when the epoch is above around 15 and increases again with increasing epochs. Whereas in data testing it is only able to achieve an accuracy level above 0.8 when the epoch is above 18. Even though there is an increase in the accuracy value indicating that the training process is going well, it requires more epochs to achieve a high score.
4.1.4 Testing Vietnam Dataset with Scratch model
From the results of tests carried out using the Scratch model, it was found that the small accuracy rate of the data testing was 37.63%. The following is a graph of the loss and accuracy of the model against the epoch.
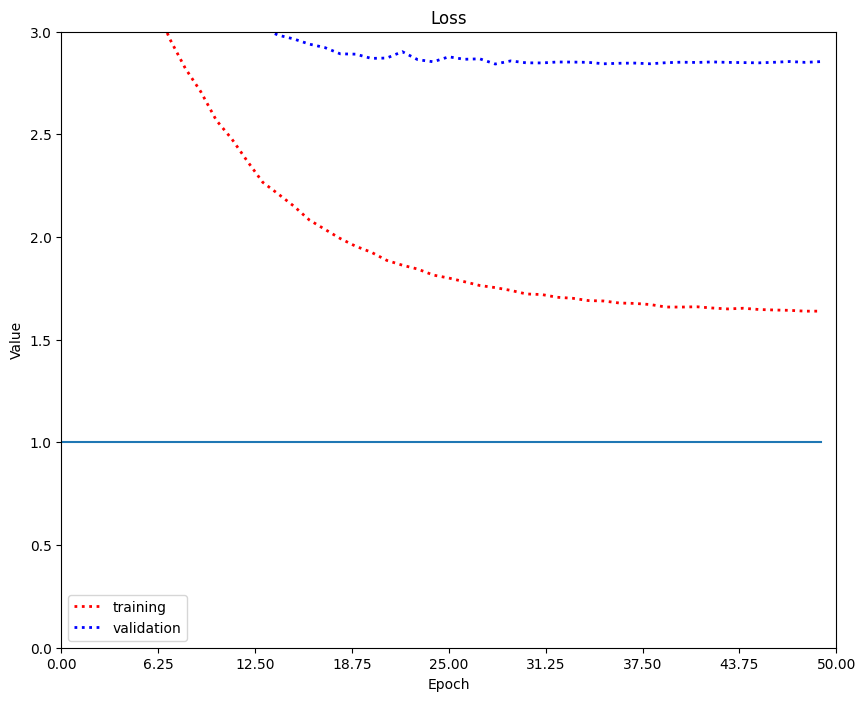
Based on Figure 9 above, it can be seen that the loss value of this model is quite high. Compared to the pretrained model tested, the loss value in this scratch model has a very far range compared to the loss value of the pretrained model tested. This is because the scratch model is very simple compared to the pretrained model. Therefore, to get a small loss value, a fairly complex model is needed.
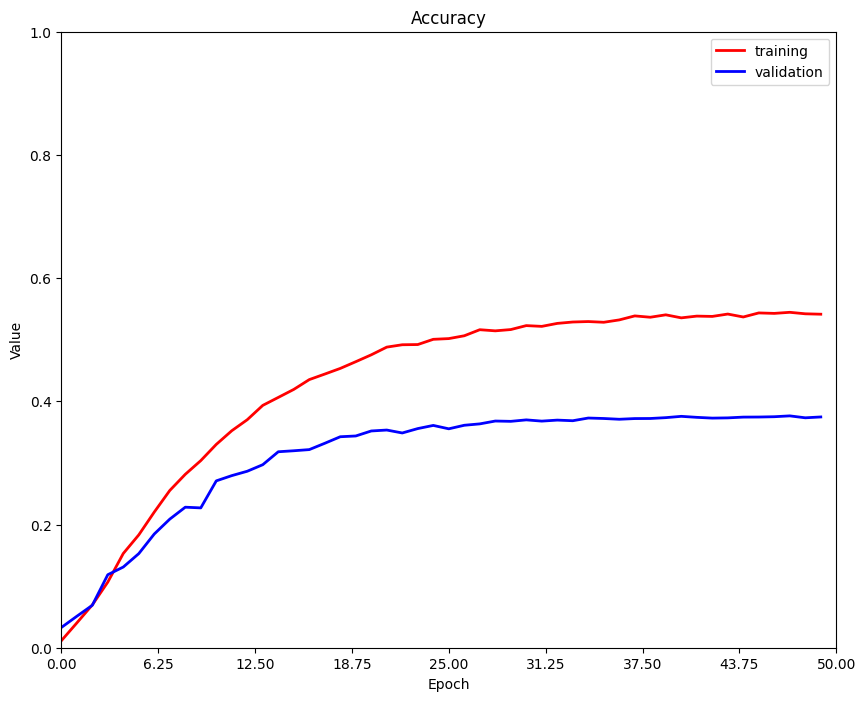
Based on Figure 10 above, it can be seen that the accuracy value of this model is quite low. The same as the loss value, this Scratch model has a range of accuracy values that are far enough compared to the accuracy values of the other tested pretrained models. So a more complex model is needed, such as the pretrained model to get a high accuracy value.
4.2 Testing the Indonesia Medicinal Plant Dataset
In this research the dataset used was a dataset collected by himself. This dataset will be tested on the same model as the Vietnam Medicinal Plant dataset, namely the ResNet34[17] pretrained model, the DenseNet121[18] pretrained model, the VGG11_bn[19] pretrained model, and the Scratch model. Dynamic learning rate will also be used in this test. The scheduler used for the dynamic learning rate is also the same, namely the ExponentialLR[20] scheduler with a gamma configuration of 0.9 as well. The learning rate used in this test is also 0.001. The dataset that has been collected for testing is 10,000 images with the distribution of training data and testing data of 60:40 so that there are 6,000 training data and 4,000 testing data. There are 100 classes in this dataset. This test will be carried out as many as 50 epochs also with the optimizer used is Adam[21]. Then the loss function used is Cross Entropy Loss[22].
| No. | Model Name | Training | testing | ||
|---|---|---|---|---|---|
| loss | accuracy | loss | accuracy | ||
| 1. | ResNet34 | 0.0138 | 0.9982 | 0.7745 | 0.8565 |
| 2. | DenseNet121 | 0.0027 | 1.0000 | 0.6275 | 0.8740 |
| 3. | VGG11_bn | 1.0552 | 0.9633 | 1.0552 | 0.8200 |
| 4. | Scratch | 1.2727 | 0.6597 | 2.5174 | 0.4353 |
Based on table 2, it can be seen from all the models that have been tested, the DenseNet121 model with an accuracy of 87.4% in the testing process is the model with the highest accuracy compared to the other models. Just like in testing the Vietnam Medicinal Plant Dataset, the Scratch model is the model with the lowest accuracy compared to the other models. Then of the three pretrained models, the VGG11_bn model is the model that has the lowest accuracy, namely 82%. For the loss and accuracy graphs of each model can be seen in the following discussion.
4.2.1 Testing Indonesia Dataset with pretrained model ResNet34
From the results of tests carried out using the ResNet34 pretrained model, the accuracy level of the testing data was 85.65%. The graph of the loss and accuracy values can be seen in the following figure.
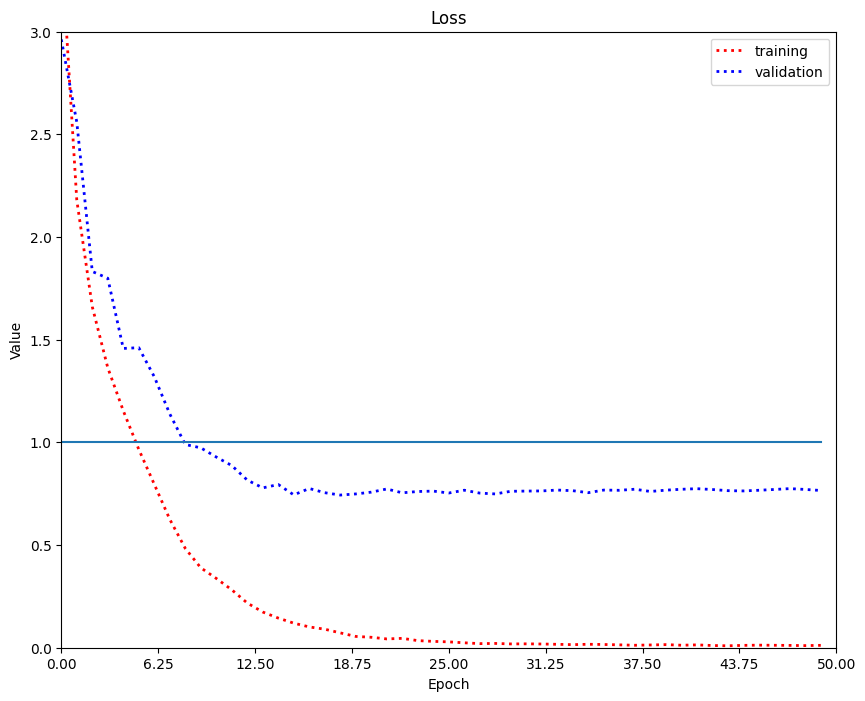
Based on Figure 11, it can be seen that if the number of epochs increases, the loss value will also decrease both during the training and testing processes. From the figure it can also be seen that the training process is going well even though the training process is better than testing in terms of minimizing loss values.
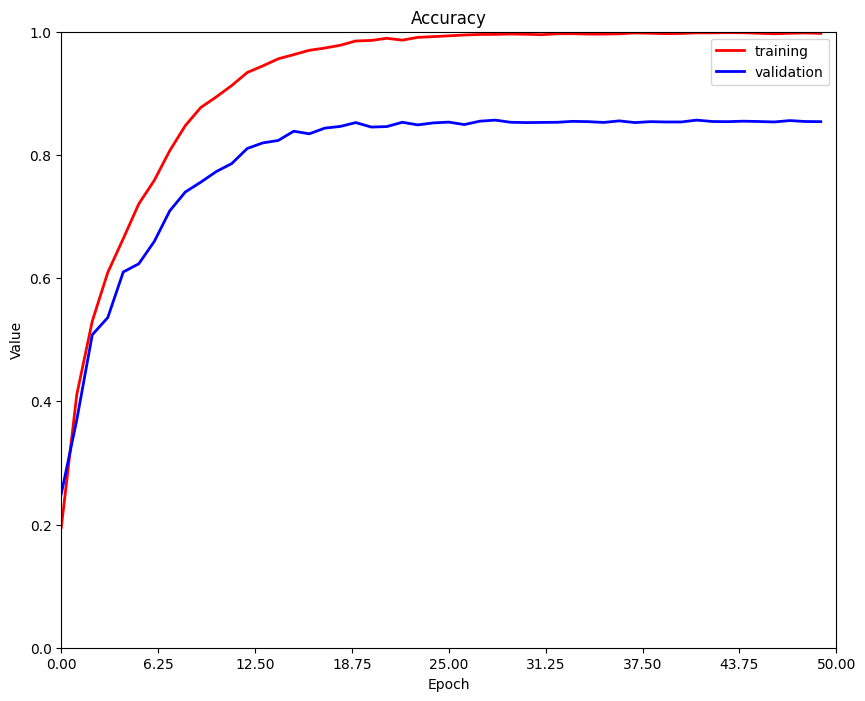
Based on Figure 12, it can be seen that the model can achieve higher accuracy with increasing number of epochs. When the epoch is 13, the accuracy value of the training data begins to exceed the accuracy value of 0.9. Meanwhile, data testing is able to reach an accuracy level of 0.8 when the epoch is above 12. The increase in the accuracy value indicates that the training process is going well.
4.2.2 Testing Indonesia Dataset with pretrained model DenseNet121
The results of tests carried out using the DenseNet121 pretrained model obtained an accuracy rate of 87.4% of the testing data. The following is a graph of the loss and accuracy values.
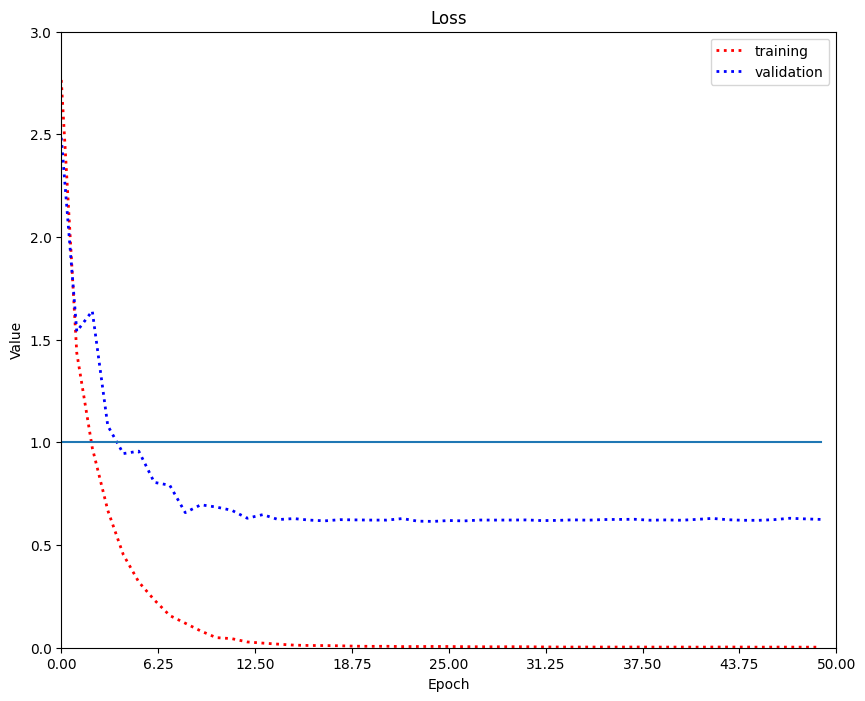
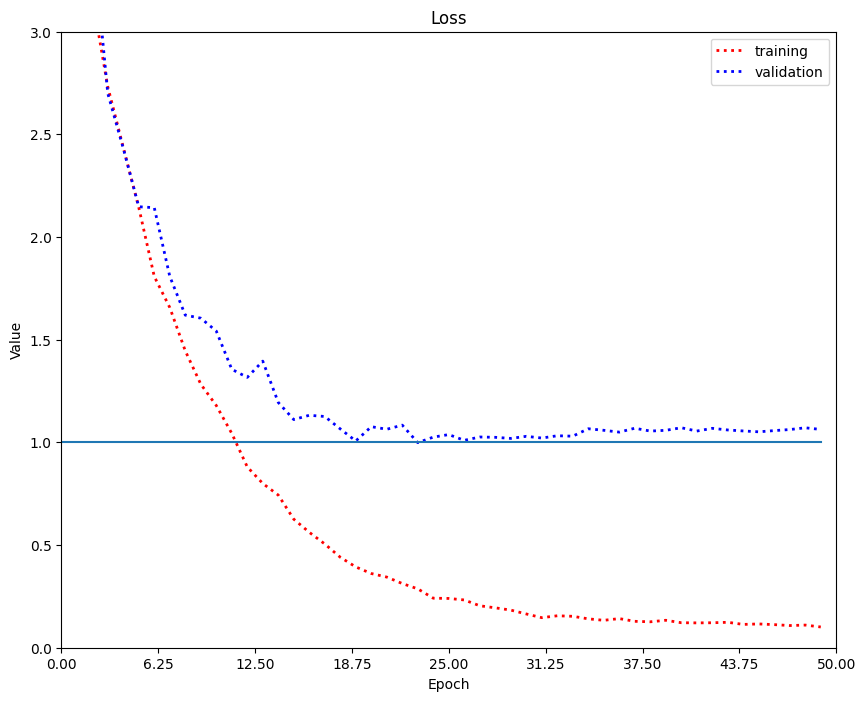
Based on Figure 13 it can be seen that the loss value decreases steadily for the training process. Whereas in testing the loss value starts to stop decreasing when it is at a value of 0.6. It can be seen if the training process on DenseNet121 goes well to minimize the loss value even though the testing process cannot decrease again when it is at a value of 0.6.
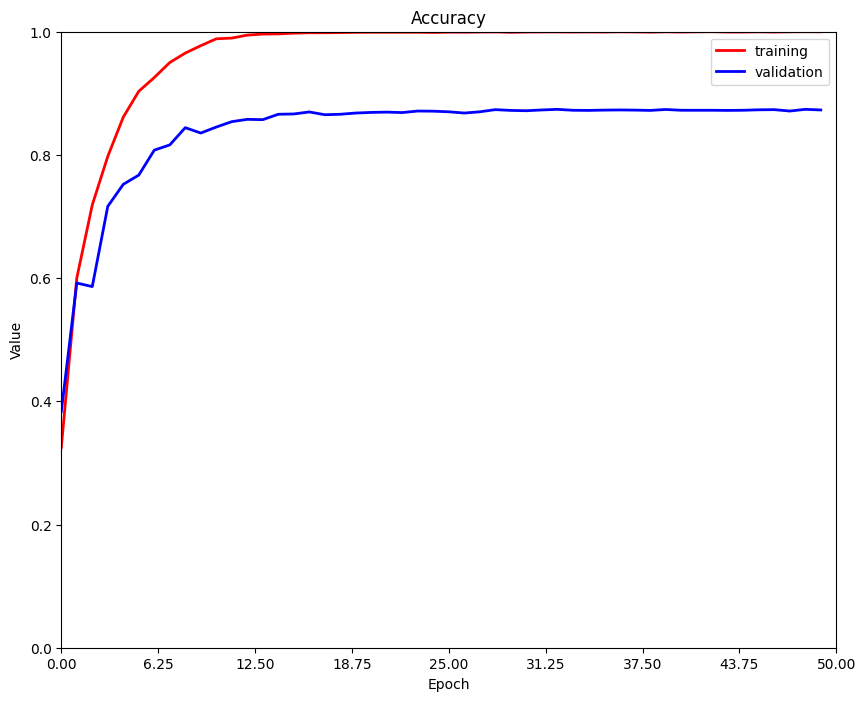
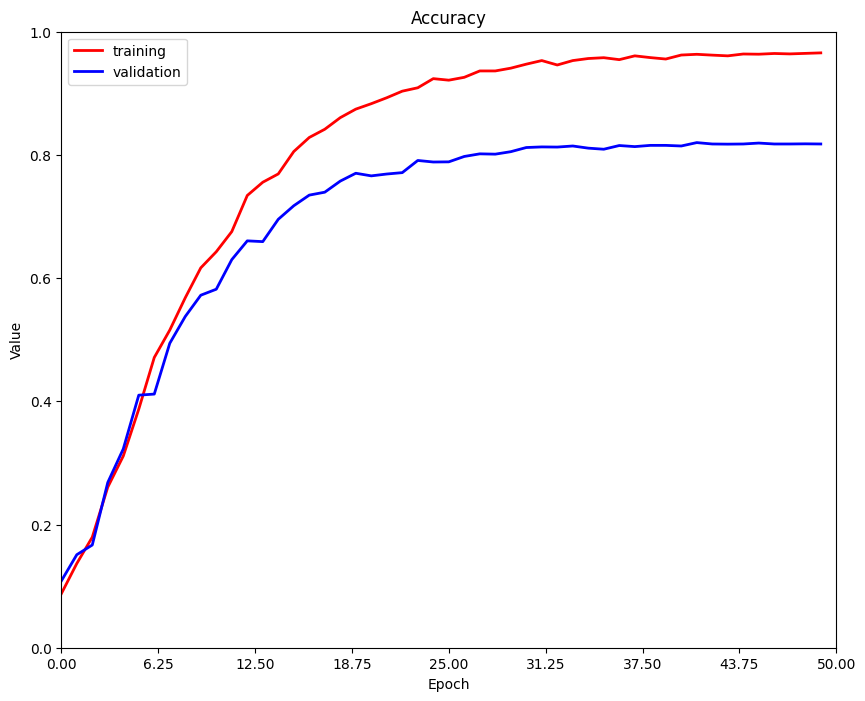
Based on figure 14 it can be seen that the training process can achieve high accuracy past 0.9 constantly when the epoch passes 7. Whereas in data testing it is only able to achieve an accuracy level above 0.8 when the epoch is above 6. The increase in the accuracy value indicates that the process the training went well.
4.2.3 Testing Indonesia Dataset with pretrained model VGG11_bn
From the results of tests carried out using the pretrained model VGG11_bn, the accuracy of the testing data was 82%. The following is a graph of the loss and accuracy of the model against the epoch.
Based on Figure 15 above, it can be seen that the loss value will decrease when the epoch increases, both during the training and testing processes. The loss value in the VGG pretrained model looks higher than the other pretrained models. From this it can be seen that the training process can minimize loss values but is not better than other pretrained models in minimizing loss values.
Based on Figure 16 it is known that the model achieves higher accuracy followed by an increase in the number of epochs. The accuracy value of the training data can exceed 0.9 when the epoch is above around 17. Meanwhile, data testing is only able to start to reach an accuracy level of 0.8 constantly when the epoch is above 17. This shows the need for an increasing number of epochs to get high accuracy value.
4.2.4 Testing Indonesia Dataset with Scratch model
From the results of tests carried out using the Scratch model using the Indonesia Medicinal Plant Dataset, it was found that the accuracy level of the testing data is small, namely 43.53%. The following is a graph of the loss and accuracy of the model against the epoch.

Based on Figure 17 above, it can be seen that the loss value of this model is quite high above 1. Then the loss value in this scratch model has a very far range compared to the loss value of the pretrained model being tested. To minimize the loss, it is necessary to make a more complex model, such as the pretrained model.

Based on Figure 18 above, it can be seen that the accuracy value of this model is lower than the pretrained model tested. In fact, the range of accuracy values is far enough compared to the accuracy values of the other tested pretrained models. To increase the accuracy value of the Scratch model, a more complex model is needed.
4.3 Analysis
From the results of tests on Vietnamese herbal plants Dataset and Indonesian herbal plants The dataset collected alone can be seen if the Vietnamese herbal plant dataset has more images and more classes so it will be more difficult to get a high accuracy value. This is because there is a possibility that the image and class will be more similar. Then from all the pretrained models tested it can be seen if the DenseNet121[18] pretrained model with an accuracy level of 87-88% has a model architecture that is more suitable for use in herbal plant image datasets compared to the ResNet34[17] and VGG11_bn[19] pretrained models. Meanwhile, the pretrained VGG11_bn model is considered to have the worst level of accuracy compared to the other two pretrained models, even though the accuracy value is quite good. In addition, compared to all the pretrained models tested, the scratch model has a much lower accuracy value. This is because the scratch model has a very simple architecture compared to the pretrained model.
The large number of epochs also affects the accuracy value. With the right number of epochs can help increase the accuracy value. In addition, it can also be seen that the CNN model is quite good at classifying herbal plant datasets even though the imagery of the herbal plant dataset itself is quite complicated. But to be able to get a good accuracy value, of course, a fairly complex CNN model is also needed, as is the case with using transfer learning.
5 Conclusion
From the tests carried out using the Convolutional Neural Network method, a model that is quite complex is needed to be able to classify herbal plants with good accuracy. Using transfer learning can help in making complex models quite easily and quickly so that they can produce good models for use in classifying herbal plants. From testing using transfer learning on three types of pretrained models, namely ResNet34, DenseNet121, and VGG11_bn, the best accuracy was obtained for the DenseNet121 pretrained model, with an accuracy rate of 88.69% for Vietnam Medicinal Plant Dataset and 87.4% for Indonesia Medicinal Plant Dataset.
For further research, maybe try to use other pretrained models to be tested because in this study it was limited to conducting research on three pretrained models. Then, when collecting the dataset of Indonesian herbal plants, the number of classes can be increased so that the herbal plants to be classified can be more diverse because Indonesia itself has a variety of herbal plants. Lastly, maybe try to use other Dynamic Learning Rate scheduler because in this study it is limited to using the ExponentialLR scheduler.
References
- [1] S. Yulianto, “Penggunaan Tanaman Herbal Untuk Kesehatan,” Jurnal Kebidanan dan Kesehatan Tradisional, vol. 2, no. 1, pp. 1–7, 2017.
- [2] I. A. M. Zin, Z. Ibrahim, D. Isa, S. Aliman, N. Sabri, and N. N. A. Mangshor, “Herbal plant recognition using deep convolutional neural network,” Bulletin of Electrical Engineering and Informatics, vol. 9, no. 5, pp. 2198–2205, 2020.
- [3] T. N. Quoc and V. T. Hoang, “VNPlant-200 – A Public and Large-Scale of Vietnamese Medicinal Plant Images Dataset,” Lecture Notes in Networks and Systems, vol. 136, no. January, pp. 406–411, 2021.
- [4] T. Lindeberg, “Scale Invariant Feature Transform,” Scholarpedia, vol. 7, no. 5, p. 10491, 2012.
- [5] H. Bay, T. Tuytelaars, and L. V. Gool, “LNCS 3951 - SURF: Speeded Up Robust Features,” Computer Vision–ECCV 2006, pp. 404–417, 2006.
- [6] G. I. Webb, “Naïve Bayes,” Encyclopedia of Machine Learning and Data Mining, pp. 895–896, 2017.
- [7] T. Seidl, “Nearest Neighbor Classification,” Encyclopedia of Database Systems, vol. 1, pp. 1885–1890, 2009.
- [8] F. Liantoni and H. Nugroho, “Klasifikasi Daun Herbal Menggunakan Metode Naïve Bayes Classifier Dan Knearest Neighbor,” Jurnal Simantec, vol. 5, no. 1, pp. 9–16, 2015.
- [9] L. Torrey and J. Shavlik, “Transfer learning,” Handbook of Research on Machine Learning Applications, 01 2009.
- [10] K. O’Shea and R. Nash, “An introduction to convolutional neural networks,” CoRR, vol. abs/1511.08458, 2015.
- [11] S. Naeem, A. Ali, C. Chesneau, M. H. Tahir, F. Jamal, R. A. K. Sherwani, and M. U. Hassan, “The classification of medicinal plant leaves based on multispectral and texture feature using machine learning approach,” Agronomy, vol. 11, no. 2, 2021.
- [12] L. B. Almeida, “Multilayer perceptrons,” Handbook of Neural Computation, pp. 1–30, 1997.
- [13] J. Friedman, R. Tibshirani, and T. Hastie, “Additive logistic regression: a statistical view of boosting (With discussion and a rejoinder by the authors),” The Annals of Statistics, vol. 28, no. 2, pp. 337–407, 2000.
- [14] L. Breiman, “Bagging predictors,” Machine Learning, vol. 24, no. 2, pp. 123–140, 1996.
- [15] T. K. Ho, “Random decision forests,” in Proceedings of 3rd international conference on document analysis and recognition, vol. 1, pp. 278–282, IEEE, 1995.
- [16] C. Y. J. Peng, K. L. Lee, and G. M. Ingersoll, “An introduction to logistic regression analysis and reporting,” Journal of Educational Research, vol. 96, no. 1, pp. 3–14, 2002.
- [17] K. He, X. Zhang, S. Ren, and J. Sun, “Deep residual learning for image recognition,” Proceedings of the IEEE Computer Society Conference on Computer Vision and Pattern Recognition, vol. 2016-Decem, pp. 770–778, 2016.
- [18] G. Huang, Z. Liu, L. Van Der Maaten, and K. Q. Weinberger, “Densely connected convolutional networks,” Proceedings - 30th IEEE Conference on Computer Vision and Pattern Recognition, CVPR 2017, vol. 2017-Janua, pp. 2261–2269, 2017.
- [19] K. Simonyan and A. Zisserman, “Very deep convolutional networks for large-scale image recognition,” 3rd International Conference on Learning Representations, ICLR 2015 - Conference Track Proceedings, pp. 1–14, 2015.
- [20] Z. Li and S. Arora, “An exponential learning rate schedule for deep learning,” 2019.
- [21] D. P. Kingma and J. L. Ba, “Adam: A method for stochastic optimization,” 3rd International Conference on Learning Representations, ICLR 2015 - Conference Track Proceedings, pp. 1–15, 2015.
- [22] Z. Zhang and M. R. Sabuncu, “Generalized cross entropy loss for training deep neural networks with noisy labels,” 2018.