Expert Knowledge-Aware Image Difference Graph Representation Learning for Difference-Aware Medical Visual Question Answering
Abstract.
To contribute to automating the medical vision-language model, we propose a novel Chest-Xray Difference Visual Question Answering (VQA) task. Given a pair of main and reference images, this task attempts to answer several questions on both diseases and, more importantly, the differences between them. This is consistent with the radiologist’s diagnosis practice that compares the current image with the reference before concluding the report. We collect a new dataset, namely MIMIC-Diff-VQA, including 700,703 QA pairs from 164,324 pairs of main and reference images. Compared to existing medical VQA datasets, our questions are tailored to the Assessment-Diagnosis-Intervention-Evaluation treatment procedure used by clinical professionals. Meanwhile, we also propose a novel expert knowledge-aware graph representation learning model to address this task. The proposed baseline model leverages expert knowledge such as anatomical structure prior, semantic, and spatial knowledge to construct a multi-relationship graph, representing the image differences between two images for the image difference VQA task. The dataset and code can be found at https://github.com/Holipori/MIMIC-Diff-VQA. We believe this work would further push forward the medical vision language model.
1. Introduction
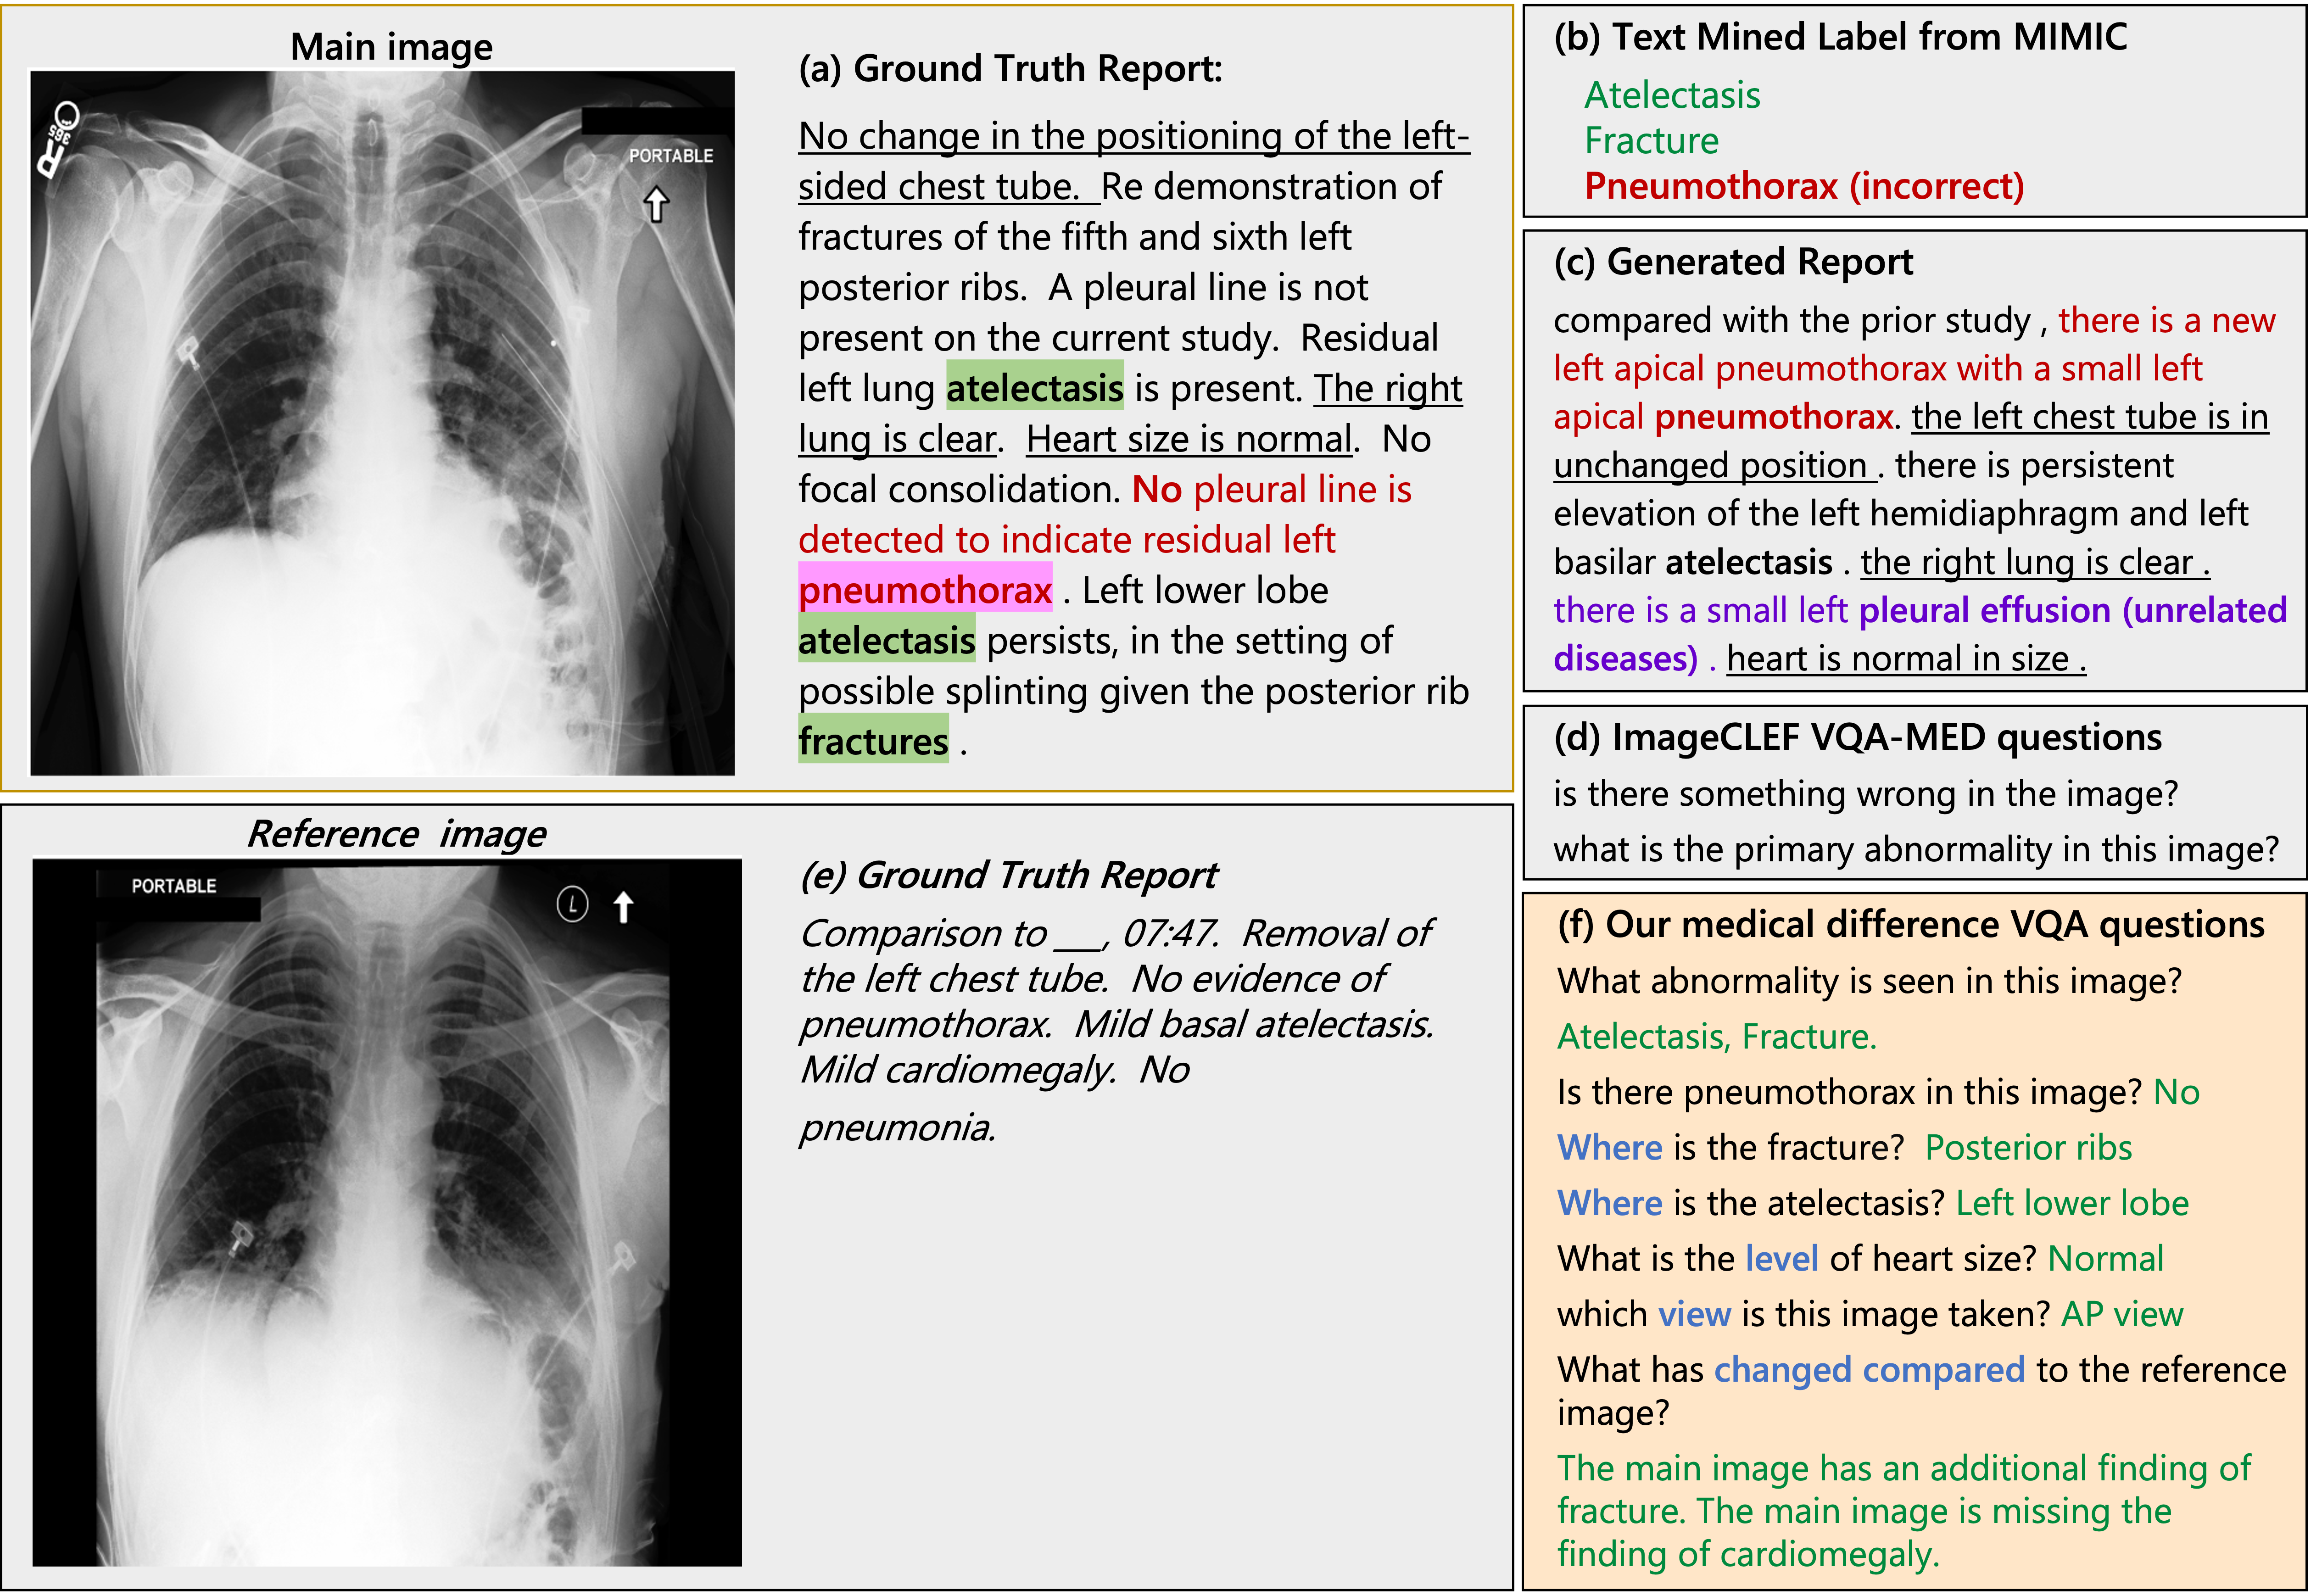
On the left side, two chest X-ray images taken during two separate visits are displayed with their corresponding text reports. On the right side, additional text information is provided, including the traditional MIMIC mined label, a generated report, ImageCLEF-VQA-MED questions, and our medical difference VQA questions.
The medical informatics community has been working on feeding the data-hungry deep learning algorithms by fully exploiting hospital databases with invaluable loosely labeled imaging data. Among diverse attempts, Chest X-ray datasets such as MIMIC (Johnson et al., 2019a), NIH14 (Wang et al., 2017) and Chexpert (Irvin et al., 2019) have received particular attention. During this arduous journey on vision-language (VL) modality, the community either mines per-image common disease label (Fig.1. (b)) through Natural Language Processing (NLP) or endeavors on report generation (Fig.1. (c) generated from (Nguyen et al., 2021)) or even answer certain pre-defined questions (Fig.1. (d)). Despite significant progress achieved on these tasks, the heterogeneity, systemic biases, and subjective nature of the report still pose many technical challenges. For example, the automatically mined labels from reports in Fig.1. (b) is problematic because the rule-based approach that was not carefully designed did not process all uncertainties and negations well (Johnson et al., 2019b). Training an automatic radiology report generation system to match the report appears to avoid the inevitable bias in the standard NLP-mined thoracic pathology labels. However, radiologists tend to write more obvious impressions with abstract logic. For example, as shown in Fig.1. (a), a radiology report excludes many diseases (either commonly diagnosed or intended by the physicians) using negation expressions, e.g., no, free of, without, etc. However, the artificial report generator could hardly guess which disease is excluded by radiologists.
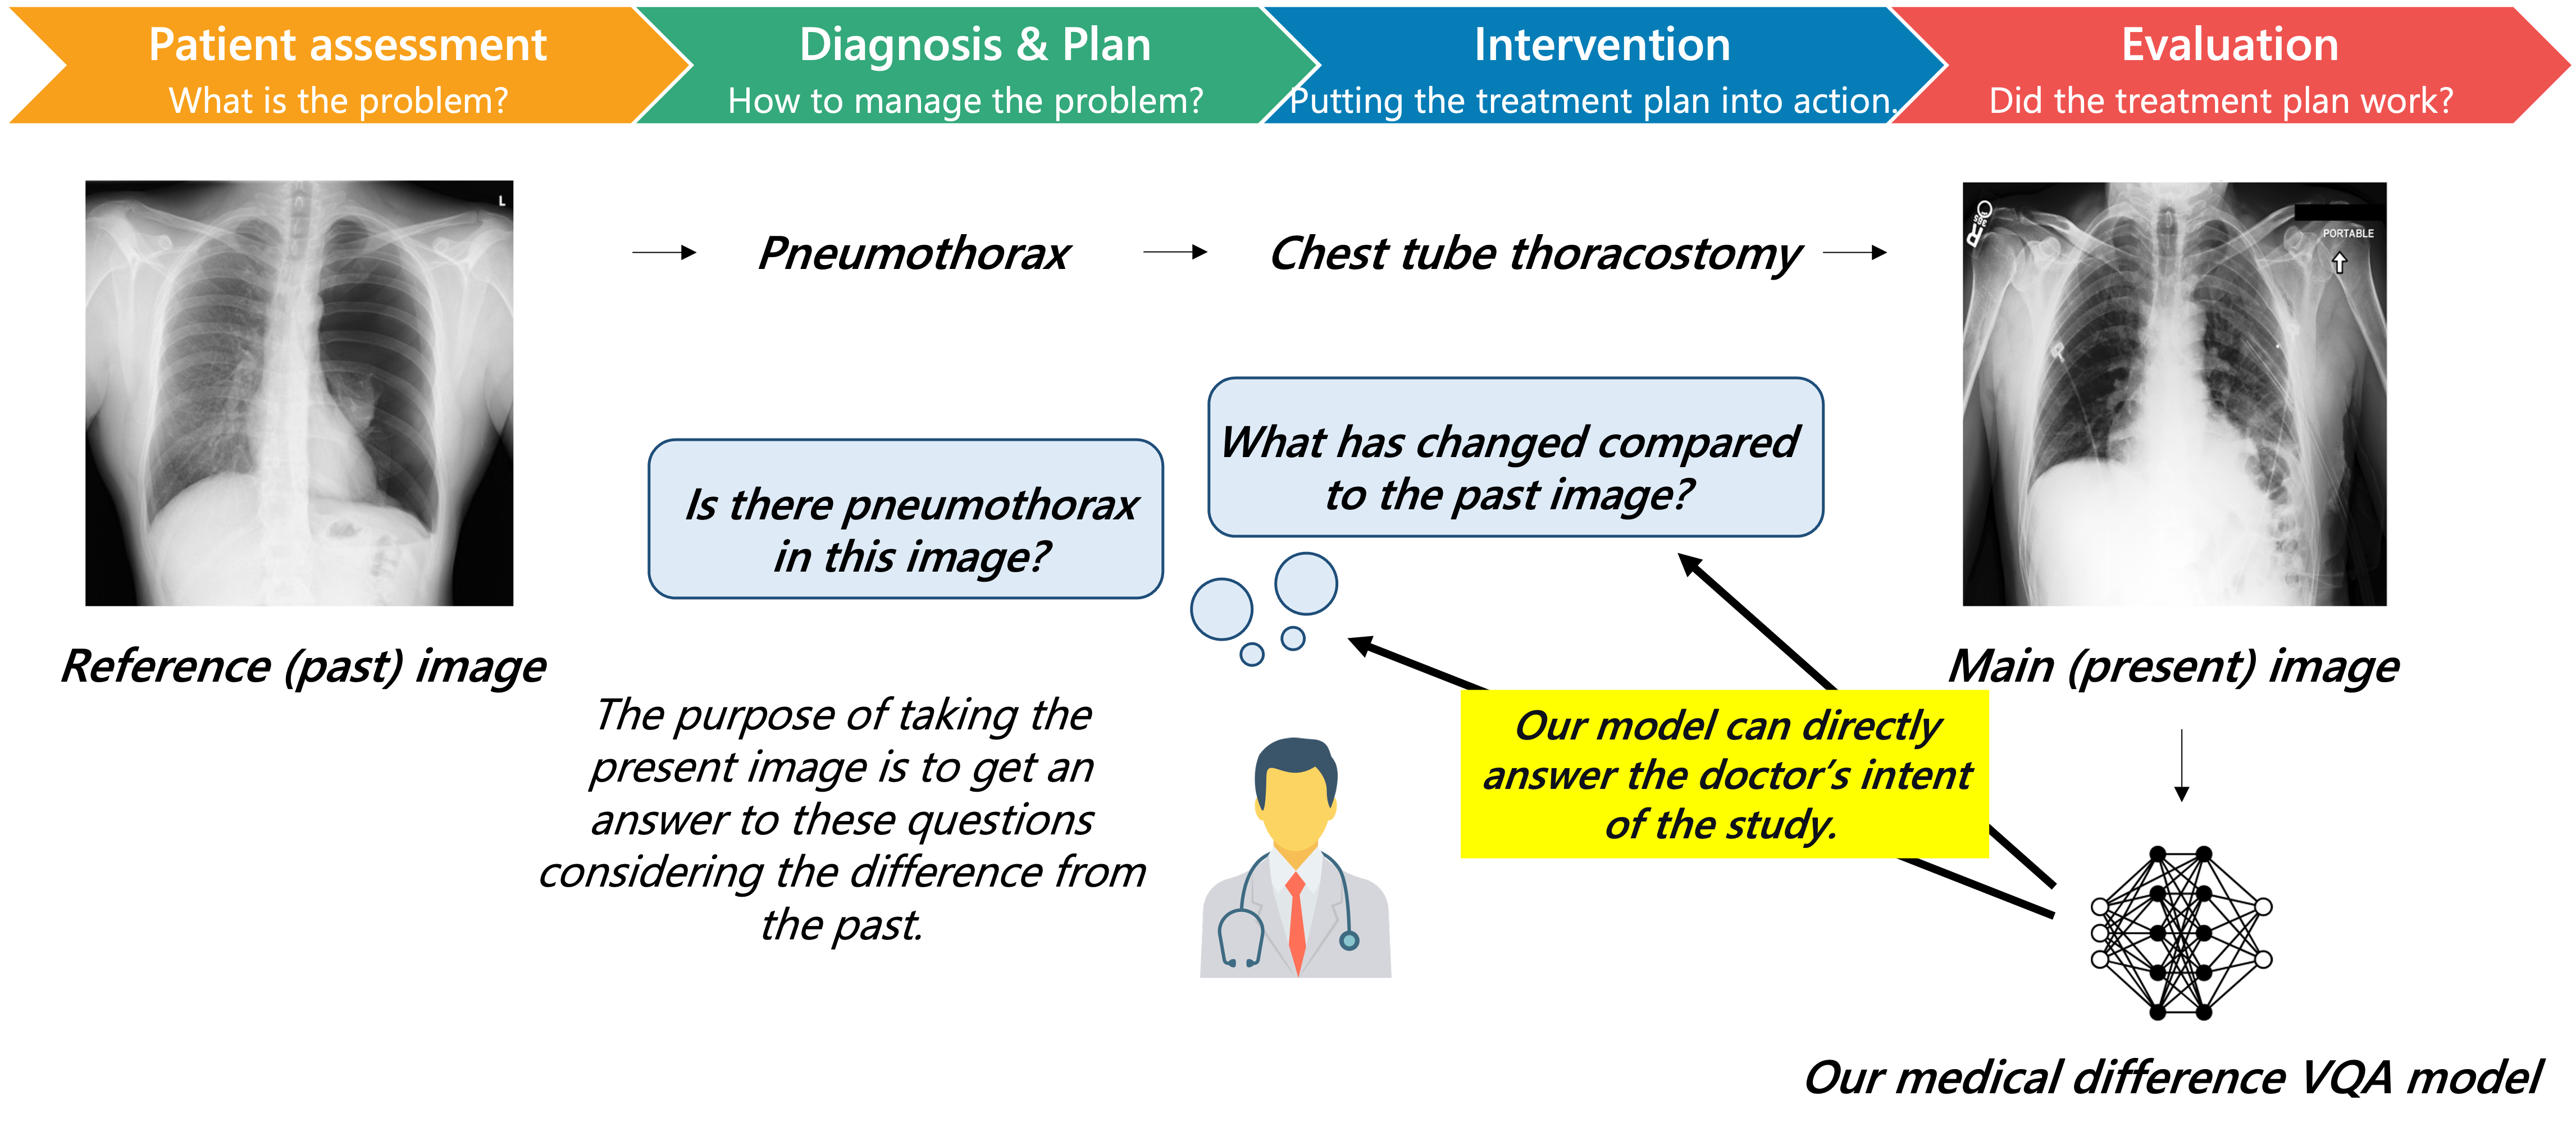
The two chest X-ray images are displayed on the left and right sides, demonstrating the process of clinical diagnosis from left to right: patient assessment, diagnosis and plan, intervention, and evaluation. The figure provides an example of the inference from Pneumothorax to Chest tube thoracostomy. In the center, the possible questions a doctor may ask are highlighted, such as ”Is there evidence of Pneumothorax in this image?” and ”What changes can be seen compared to the previous image?”
Instead of thoroughly generating all of the descriptions, VQA is more plausible as it only answers the specific question. As shown in Fig. 1, the question could be raised strictly for ”is there any pneumothorax in the image?” in the report while the answer is no doubt ”No”. However, the questions in the existing VQA dataset ImageCLEF-VQA-Med (Ben Abacha et al., 2021) concentrate on very few general ones, such as ”is there something wrong in the image? what is the primary abnormality in this image?”, lacking the specificity for the heterogeneity and subjective texture. It not only degrades VQA into classification but, more unexpectedly, provides little helpful information for clinics. While VQA-RAD (Lau et al., 2018) has more heterogeneous questions covering 11 question types, its 315 images dataset is relatively too small.
To bridge the aforementioned gap in the visual language model, we propose a novel medical image difference VQA task more consistent with radiologists’ practice. When radiologists make diagnoses, they compare current and previous images of the same patients to check the disease’s progress. Actual clinical practice follows a patient treatment process (assessment - diagnosis - intervention - evaluation) as shown in Fig. 2. A baseline medical image is used as an assessment tool to diagnose a clinical problem, usually followed by therapeutic intervention. Then, another follow-up medical image is retaken to evaluate the effectiveness of the intervention in comparison with the past baseline. In this framework, every medical image has its purpose of clarifying the doctor’s clinical hypothesis depending on the unique clinical course (e.g., whether the pneumothorax is mitigated after therapeutic intervention). However, existing methods can not provide a straightforward answer to the clinical hypothesis since they do not compare the past and present images. Therefore, we present a chest X-ray image difference VQA dataset, MIMIC-Diff-VQA, to fulfill the need of the medical image difference task. Moreover, we propose a system that answers doctors’ questions by comparing the current medical image (main) to a past visit medical image (reference). This allows us to build a diagnostic support system that realizes the inherently interactive nature of radiology reports in clinical practice.
MIMIC-Diff-VQA contains pairs of ”main”(present) and ”reference”(past) images from the same patient’s radiology images at different times from MIMIC-CXR(Johnson et al., 2019a) (a large-scale public database of chest radiographs with 227,835 studies, each with a unique report and images). The question and answer pairs are extracted from the MIMIC-CXR report for ”main” and ”reference” images using an Extract-Check-Fix cycle. There are seven types of questions included in our dataset: 1. abnormality, 2. presence, 3. view, 4. location, 5. type, 6. level, and 7. difference. The MIMIC-Diff-VQA dataset comprises 700,703 QA pairs extracted from 164,324 image pairs. Particularly, difference questions are pairs of inquiries that pertain to the clinical progress and changes in the ”main” image as compared to the ”reference” image, as shown in Fig. 1(e).
The current mainstream state-of-the-art image difference method only applies to synthetic images with small view variations,(Jhamtani and Berg-Kirkpatrick, 2018; Park et al., 2019) as shown in Fig. 5. However, real medical image difference comparing is a very challenging task. Even the images from the same patient show large variances in the orientation, scale, range, view, and nonrigid deformation, which are often more significant than the subtle differences caused by diseases as shown in Fig. 5. Since the radiologists examine the anatomical structure to find the progression of diseases, similarly, we propose an expert knowledge-aware image difference graph representation learning model as shown in Fig. 5. We extract the features from different anatomical structures (for example, left lower lung, and right upper lung) as nodes in the graph.
Moreover, we construct three different relationships in the graph to encode expert knowledge: 1) Spatial relationship based on the spatial distance between different anatomical regions. 2) Semantic relationship based on the disease and anatomical structure relationship from knowledge graph (Zhang et al., 2020). 3) Implicit relationship to model potential implicit relationship beside 1) and 2). The image-difference graph feature representation is constructed by simply subtracting the main image graph feature and the reference image graph feature. This graph difference feature is fed into LSTM networks with attention modules for answer generation(Toutanova et al., 2003).
Our contributions are summarized as:
1)We propose the medical imaging difference visual question answering problem and construct the first large-scale medical image difference visual question answering dataset, MIMIC-Diff-VQA. This dataset comprises 164,324 image pairs, containing 700,703 question-answer pairs related to various attributes, including abnormality, presence, location, level, type, view, and difference.
2) We propose an anatomical structure-aware image-difference model to extract the image-difference feature relevant to disease progression and interventions. We extracted features from anatomical structures and compared the changes in each structure to reduce the image differences caused by body pose, view, and nonrigid deformations of organs.
3) We develop a multi-relationship image-difference graph feature representation learning method to leverage the spatial relationship and semantic relationship (extracted from expert knowledge graph) to compute image-difference graph feature representation, generate answers and interpret how the answer is generated on different image regions.
2. MIMIC-Diff-VQA dataset.
We introduce our new MIMIC-Diff-VQA dataset for the medical imaging difference question-answering problem. The MIMIC-Diff-VQA dataset is constructed following an Extract-Check-Fix cycle to minimize errors. In MIMIC-Diff-VQA, each entry contains two different chest X-ray images from the same patient with a question-answer pair. Our question design is extended from VQA-RAD, but with an additional ”difference” question type. Ultimately, the questions can be divided into seven types: 1) abnormality, 2) presence, 3) view, 4) location, 5) type, 6) level, and 7) difference. Tab. 1 shows examples of the different question types.
| Question type | Example |
|---|---|
| Abnormality | what abnormality is seen in the left lung? |
| Presence | is there evidence of atelectasis in this image? |
| View | which view is this image taken? |
| Location | where in the image is the pleural effusion located? |
| Type | what type is the opacity? |
| Level | what level is the cardiomegaly? |
| Difference | what has changed compared to the reference image? |
The image pairs are selected from the MIMIC-CXR (Johnson et al., 2019a) dataset, and each image in an image pair is from the same patient. A total of 164,324 image pairs are selected from MIMIC-CXR, on which 700,703 questions are constructed. We also balance the ”yes” and ”no” answers to avoid possible bias. The statistics regarding each question type can be seen in Fig. 3. The ratio between the training, validation and testing set is 8:1:1.
2.1. MIMIC-Diff-VQA dataset construction
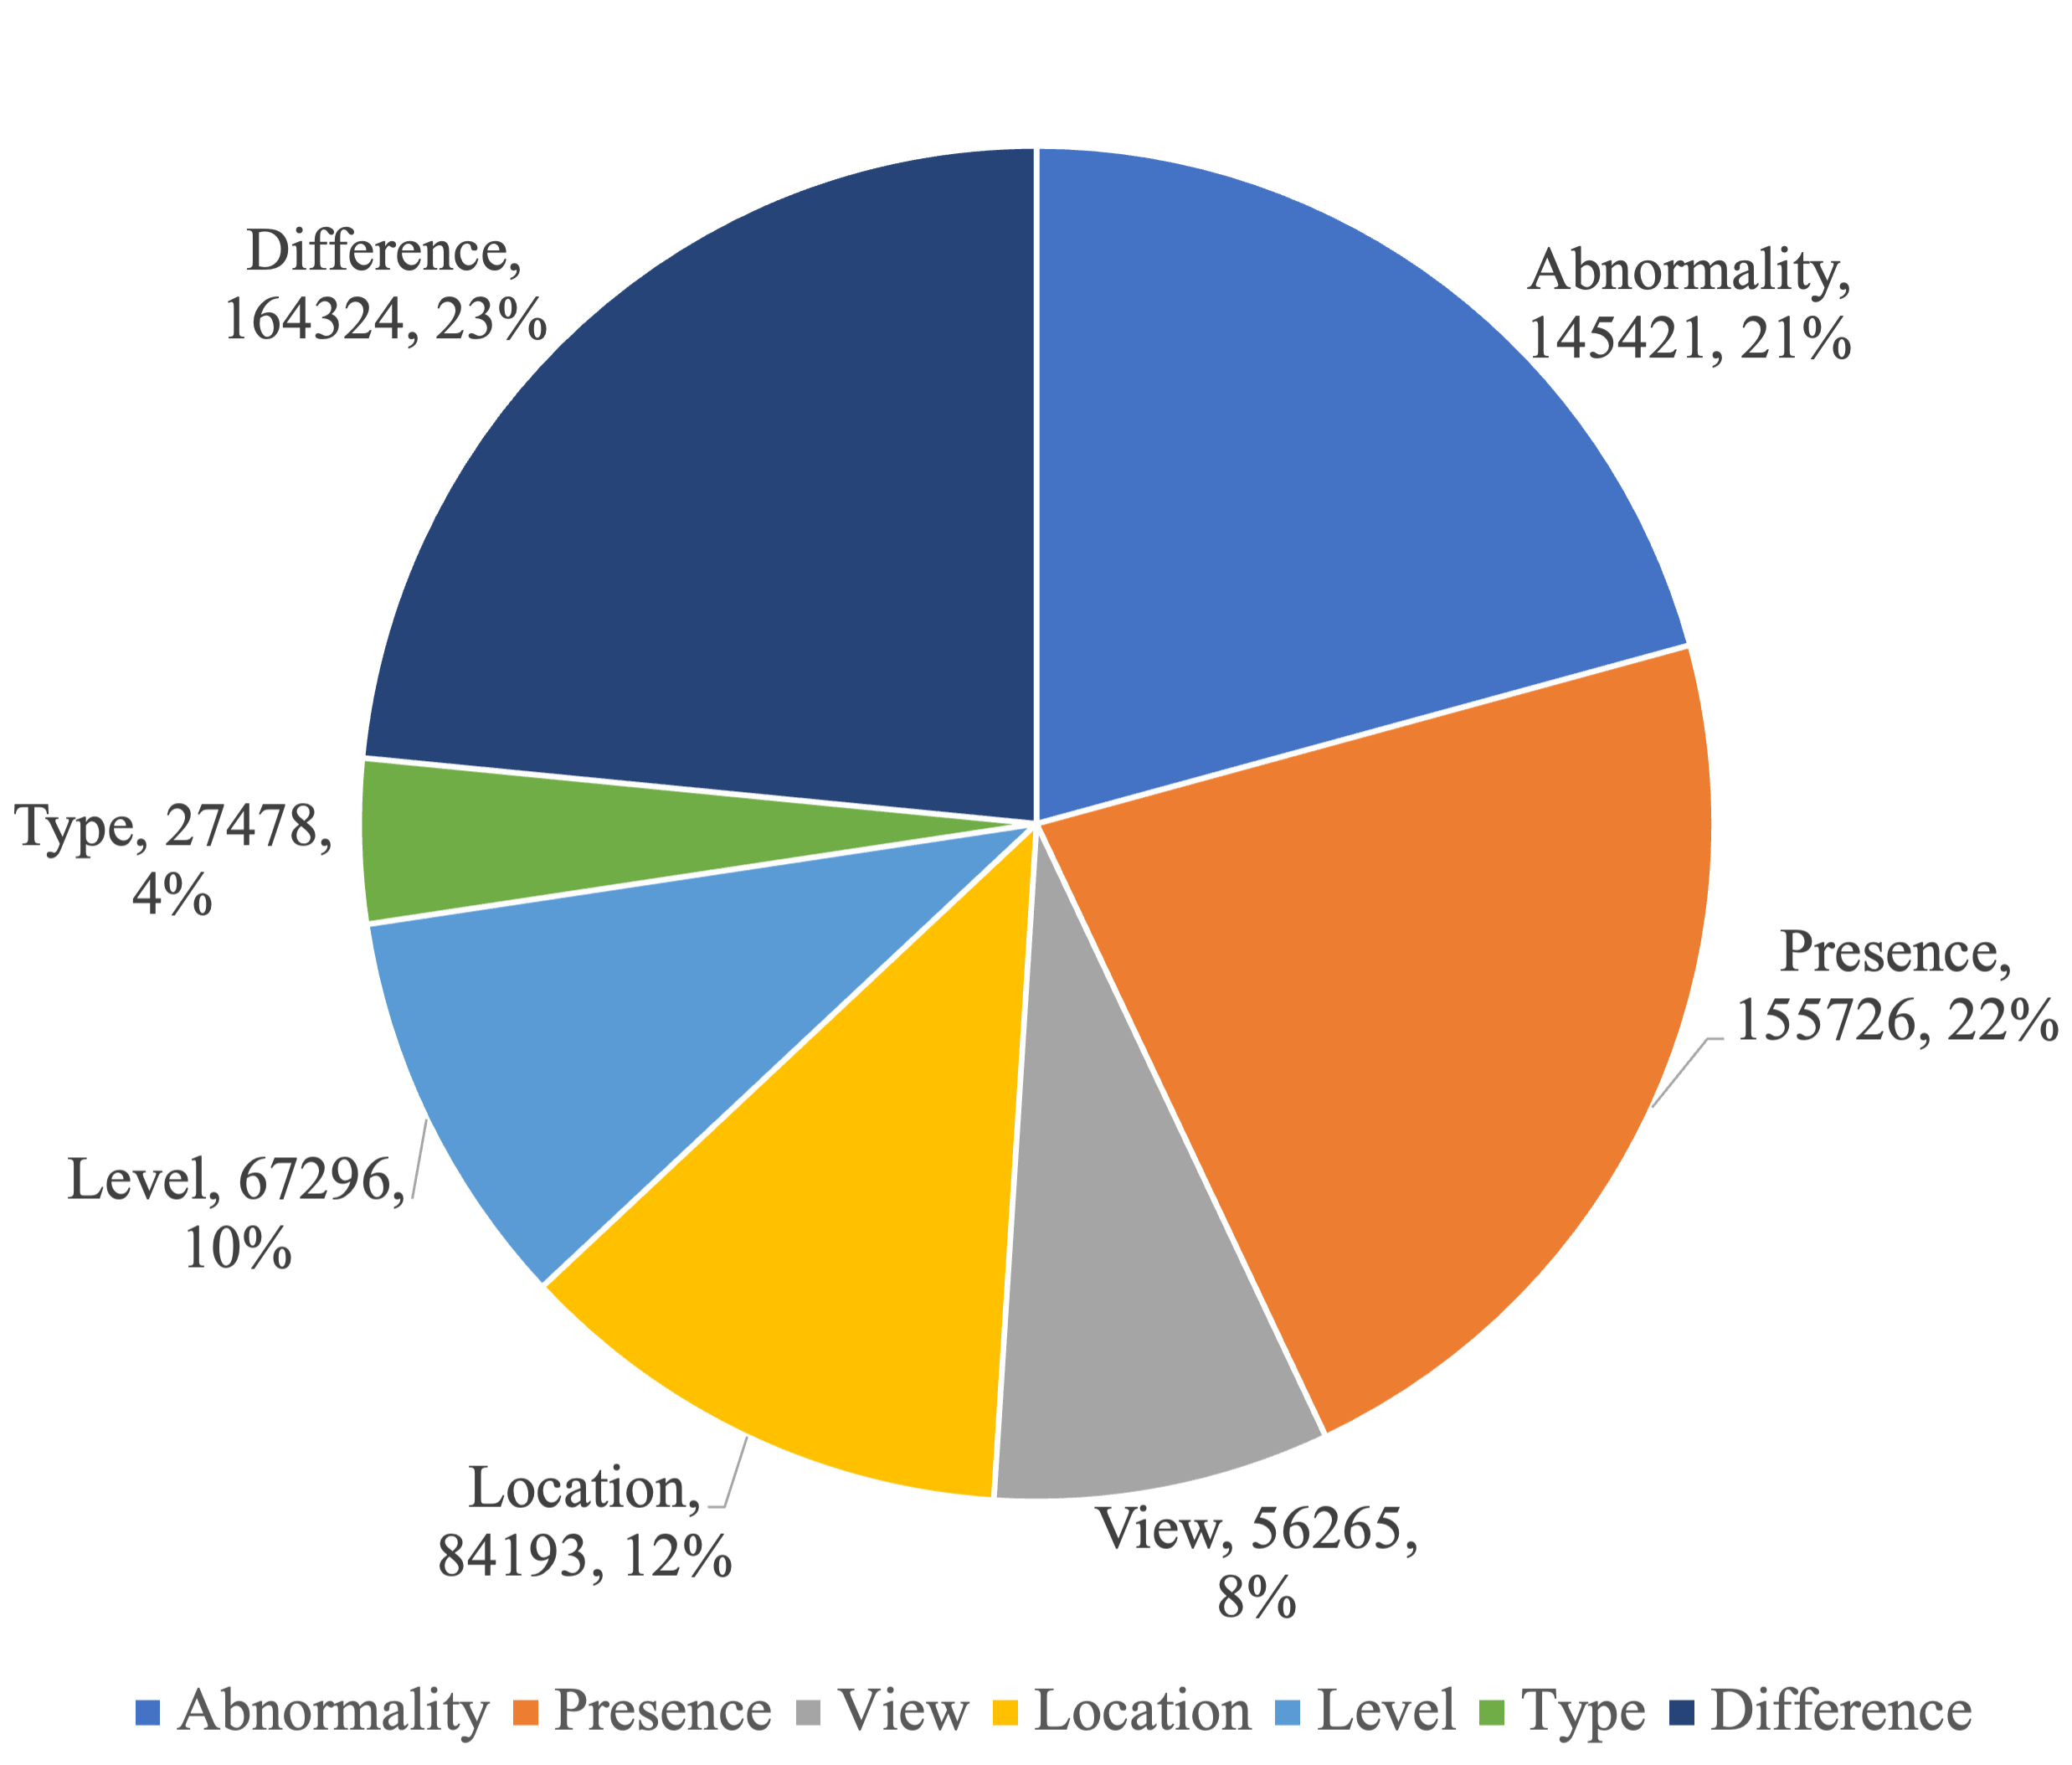
A pie chart displaying the number of all the question types.
To ensure the availability of a second image for differential comparison, we excluded patients with only one radiology visit before constructing our dataset. The overall process of dataset construction involves three steps: collecting keywords, building the Intermediate KeyInfo dataset, and generating questions and answers.
2.1.1. Collecting keywords
We follow an iterative approach to collect abnormality names and sets of important attributes, such as location, level, and type, from the MIMIC-CXR dataset. We utilize ScispaCy (Neumann et al., 2019), a SpaCy model for biomedical text processing, to extract entities from random reports. Subsequently, we manually review all the extracted entities to identify common, frequently occurring keywords that align with radiologists’ interests and add these to our lists of abnormality names and attribute words. We also record different variants of the same abnormality during this process. The full lists of the selected abnormality names and the attribute words are available in Appendix.
2.1.2. Intermediate KeyInfo dataset
The previous rule-based label extraction method was limited to a small set of disease-related labels, lacked important information such as complicated disease pathologies, levels, and location, and was prone to errors due to negations. To address these issues, we followed an Extract-Check-Fix cycle to customize the rule set for MIMIC-CXR, ensuring the quality of our dataset through extensive manual verification.
For each patient visit, we used regular expression rules to extract the abnormality names and their variants. Then, we detected attribute words near the identified abnormalities using these rules. Additionally, by going through the extracted entities, we manually selected the keywords/expressions that indicated negation information to locate the negative findings, i.e. cases where the abnormality did not exist.
Next, to ensure the accuracy and completeness of the extracted information, we conducted both manual and automated checks using tools such as Part-of-Speech, ScispaCy entity detection, and MIMIC-CXR-JPG (Johnson et al., 2019b) labels as references. These were used to identify any missing or potentially incorrect information that may have been extracted and refined the rules accordingly. We repeated the Extract-Check-Fix cycle until minimal errors were found.
As a result, we have created the Key-Info dataset, consisting of individual study details. As shown in Fig. 4, for each study, the Key-Info dataset includes information on all positive findings, their attributes, and negative findings. The ”posterior location” attribute represents the location information that appears after the abnormality keyword in a sentence.
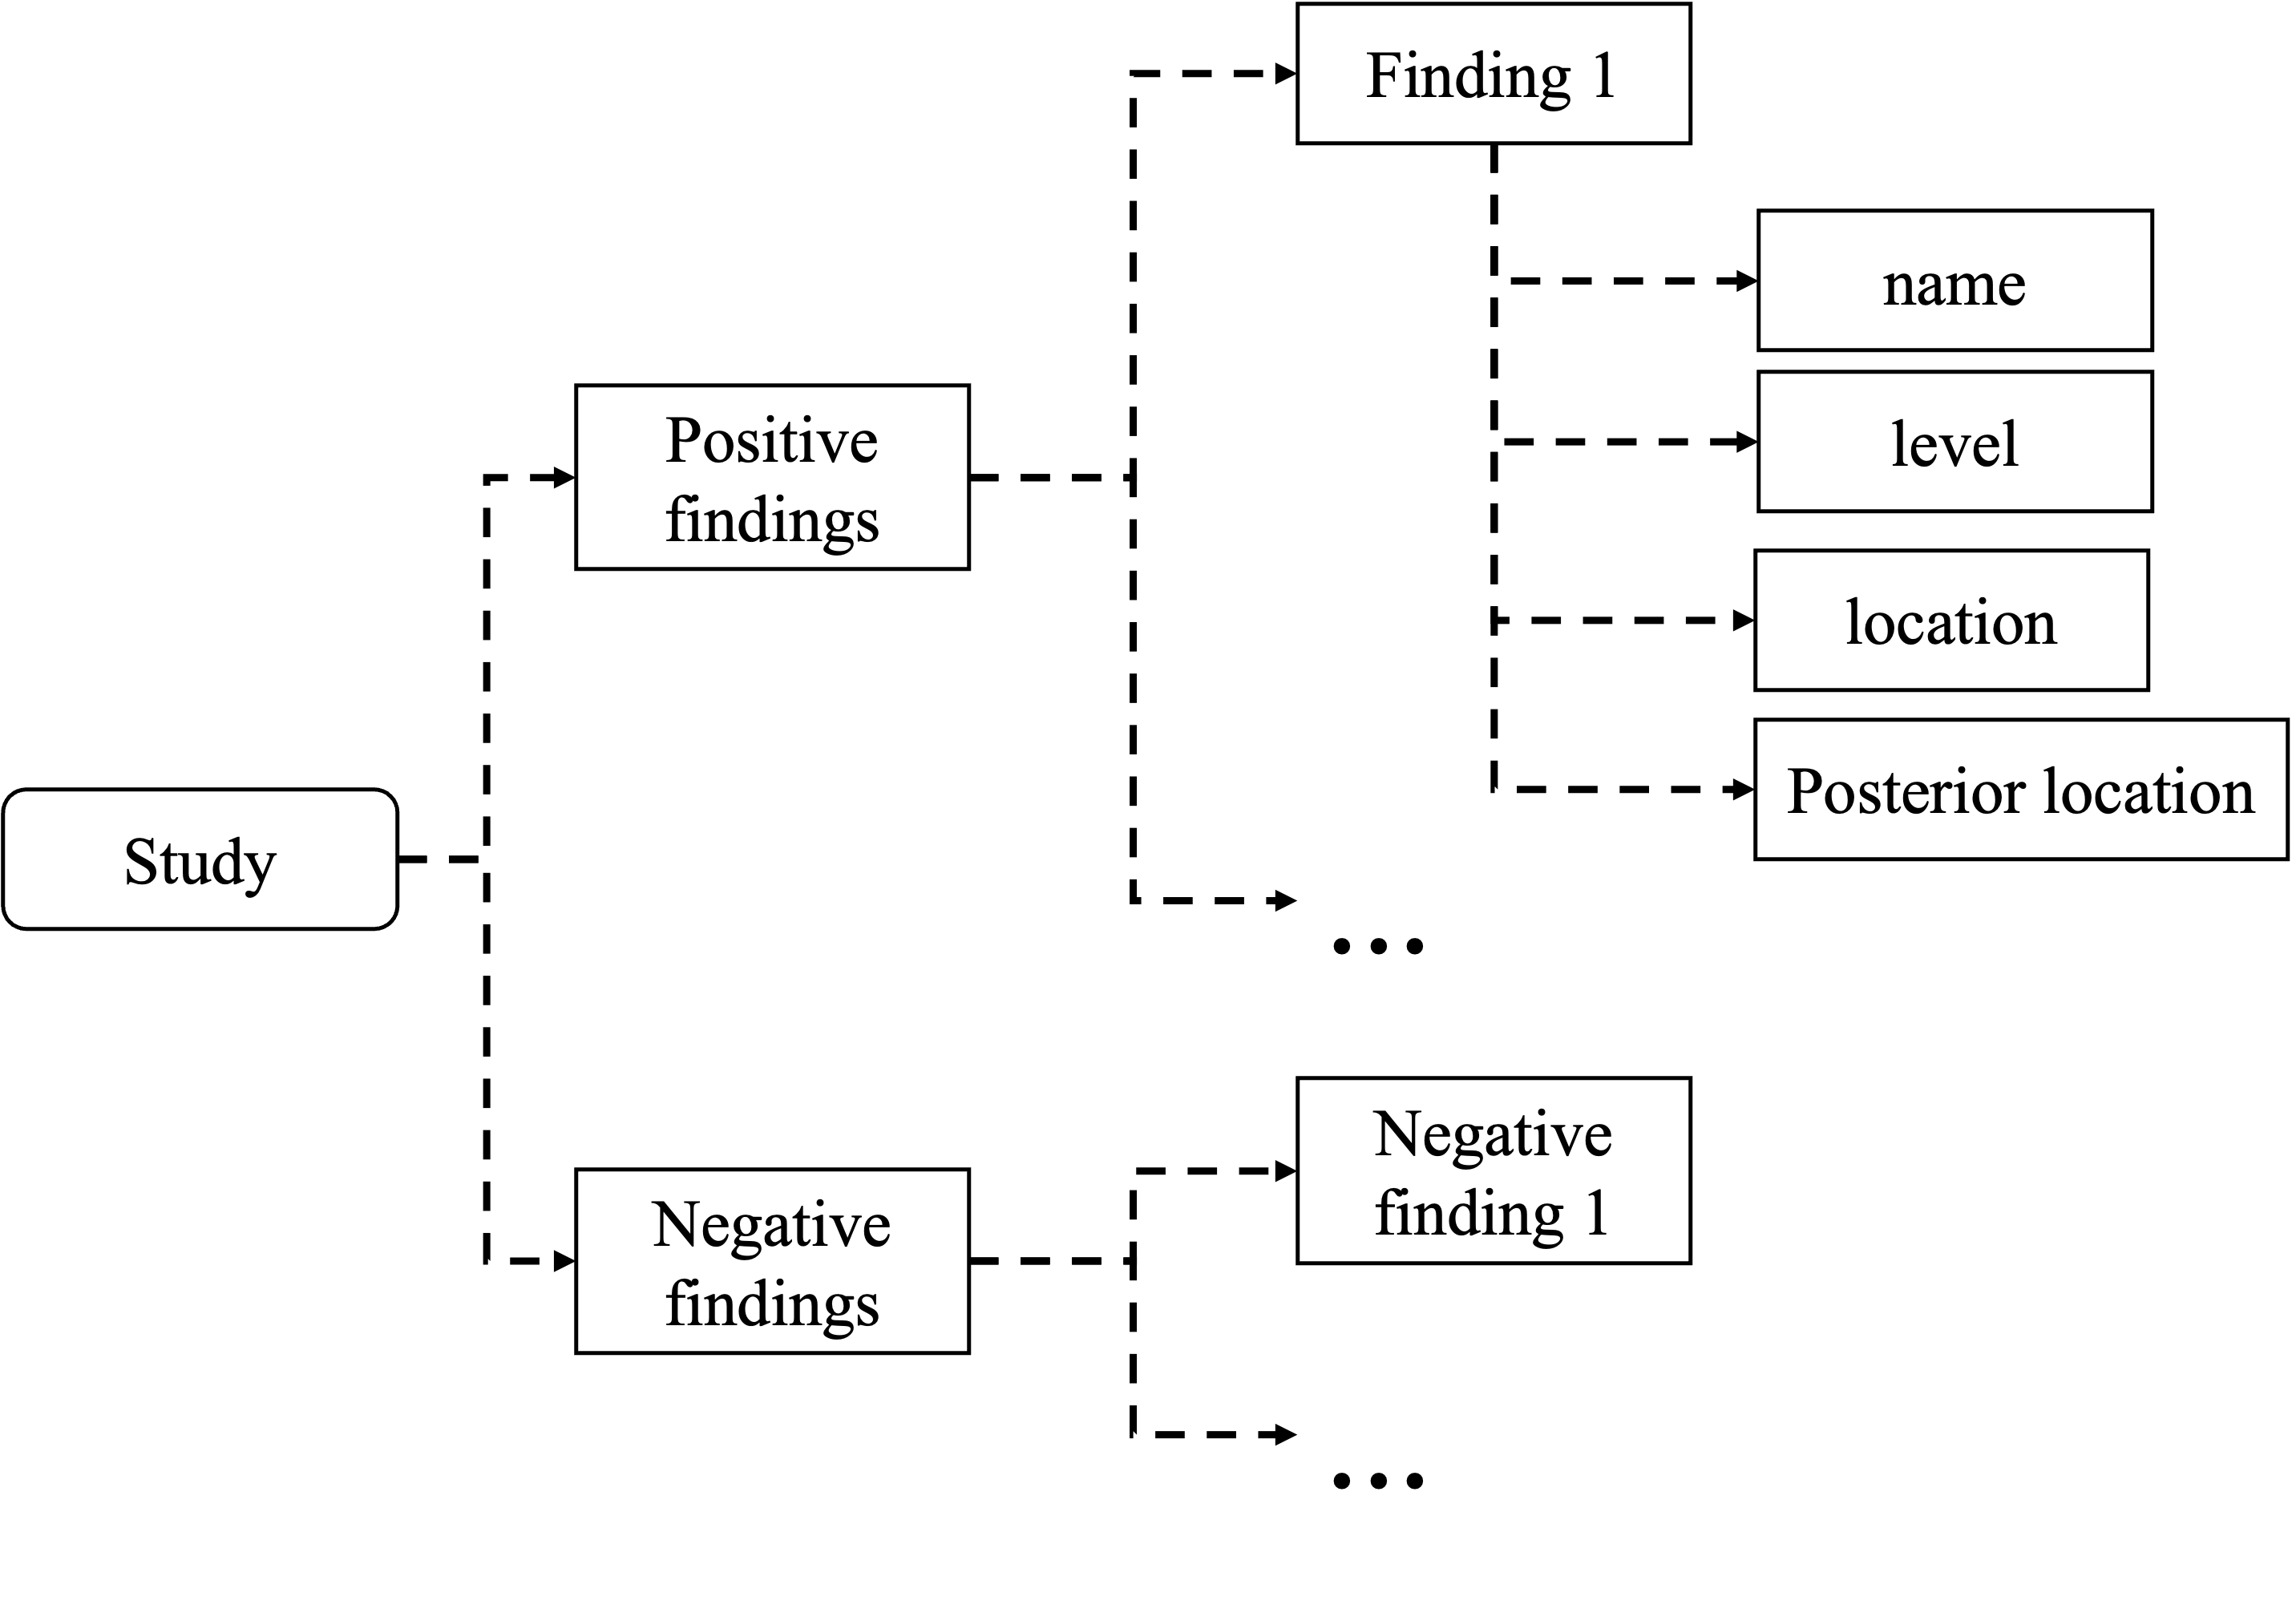
A few boxes connecting to each other, demonstrating the structure of the Key-Info dataset.
2.1.3. Study pairing and question generation
Once the intermediate Key-Info database is constructed, we can generate study pair questions accordingly. The examples of each question type are shown in Tab. 1. Each image pair contains the main image and a reference image, which are extracted from different studies of the same patient. The reference and main visits are chosen strictly based on the earlier visit as the ”reference” and the later visit as the ”main” image. Among all the question types, the first six question types are for the main image only, and the difference question is for both images.
2.2. Dataset Validation
To further verify the reliability of our constructed dataset, 3 human verifiers were assigned 1700 random sampled question-answer pairs along with the reports and evaluated each sample by annotating ”correct” or ”incorrect”. Finally, the correctness rate of the evaluation achieved 97.33%, which is acceptable for training neural networks. Tab. 2 shows the evaluation results of each verifier. It proves that our approach of constructing a dataset in an Extract-Check-Fix cycle works well in ensuring that the constructed dataset has minimum mistakes.
| Verifier | # of examples | # of correctness | Correctness rate |
|---|---|---|---|
| Verifier 1 | 500 | 475 | 95% |
| Verifier 2 | 1000 | 989 | 98.9% |
| Verifier 3 | 200 | 193 | 96.5% |
| Total | 1700 | 1657 | 97.4% |
3. Method
3.1. Problem Statement
Given an image pair , consisting of the main image and the reference image , and a question , our goal is to obtain the answer of the question from image pair. In our design, the main and reference images are from the same patient.
3.2. Anatomical Structure-Aware Graph Construction and Feature Learning
Within the language generation and vision research domain, the most related works to the medical image difference VQA task is image difference captioning (Qiu et al., 2021; Oluwasanmi et al., 2019; Yao et al., 2022), which is designed to identify object movements and changes within a spatial context such as a static or complex background. As shown in the left Fig.5, the object changes and movements in general image difference captioning are relatively large or significant compared to the background, making the problem easier to solve. These works usually assume a stable background with simple changes in the structure, position, and texture of foreground objects, without significant scaling.
The figure shows the architecture of the proposed model. On the left, two chest X-rays are fed into the model, after the anatomical feature disease feature extraction, multi-relationship graph module, feature attention module, and difference feature computation, the final answer is obtained by the Answer Generator.
However, the medical image difference is distinct from the general image difference. Changes caused by diseases are generally subtle, and the image position, pose, and scale can vary significantly even for the same patient due to the pose and nonrigid deformation. As a result, general image difference methods can have difficulty adapting to the medical image difference task. To better capture the subtle disease changes and eliminate the pose, orientation, and scale changes, we propose an anatomical structure-aware image difference graph learning solution. Specifically, we represent each anatomical structure as a node and then assess the image changes within each structure in a similar manner to that of radiologists.
3.2.1. Anatomical Structure, Disease Region Detection, and Question Encoding.
To begin, we use a pre-trained Faster-RCNN on the Chest ImaGenome dataset (Ren et al., 2015; Wu et al., 2021; Goldberger et al., 2000) to extract the anatomical bounding boxes and their corresponding features from the input images. Subsequently, we train a Faster-RCNN on the VinDr-CXR dataset (Pham et al., 2021) to detect diseases. Rather than directly detecting diseases on the given input images, we extract the features from the same anatomical regions by utilizing the previously extracted anatomical bounding boxes. Following previous work (Li et al., 2019; Norcliffe-Brown et al., 2018), we tokenized each question and answer and embedded them with Glove ((Pennington et al., 2014)) embeddings. We then used a bidirectional RNN with GRU (Cho et al., 2014) and self-attention to generate the question embedding .
A sketch of a human thorax, depicting the progression of disease from cardiomegaly to the initial signs of pulmonary edema, to pleural effusion, and finally to widespread opacification.
3.3. Expert Knowledge-Aware Multi-Relationship Graph Module
A chest X-ray image with doctor’s annotation on the abnormal locations.
After extracting the disease and anatomical structure, we construct an expert knowledge-aware image representation graph for the main and reference image. The multi-relationship graph is defined as , where and represent the edge sets of spatial graph, semantic graph and implicit graph, each vertex can be either anatomical node , or disease node , representing anatomical structures or disease regions, respectively. Both types of nodes are embedded with a question feature as shown in Fig. 5. is the dimension of the anatomical and disease features. is the dimension of the question embedding. represents the number of anatomical structures of one image. Since each disease feature is extracted from the same corresponding anatomical region, the total number of the vertex is .
We construct three types of relationships in the graph for each image: 1) spatial relationship: We construct spatial relationships according to the radiologist’s practice of identifying abnormalities based on specific anatomical structures. For example, an actual radiology report can state that ”the effusions remain moderate and still cause substantial bilateral areas of basilar atelectasis” In our MIMIC-Diff-VQA dataset, we design questions to assess spatial relationships, such as ”Where in the image is the pleural effusion located?” (see Table 1). Following previous work (Yao et al., 2018), we include 11 types of spatial relations between detected bounding boxes, such as ”left lower lung”, ”right costophrenic angle”, etc. The 11 spatial relations includes inside (class1), cover (class2), overlap (class3), and 8 directional classes. Each class corresponds to a 45-degree of direction. We define the edge between node i and the node j as , where c is the class of the relationship, , K is the number of spatial relationship classes, which equals to 11. When , we set , where is the Euclidean distance between the center points of the bounding boxes corresponding to the node and node , is the threshold. The threshold is defined as by reasoning and imitating the data given by (Li et al., 2019).
2) Semantic relationship: To incorporate expert knowledge into our approach, we use two knowledge graphs: an anatomical knowledge graph modified from (Zhang et al., 2020) and a label occurrence knowledge graph built by ourselves. Please refer to the Appendix for detailed information about these knowledge graphs. If two labels are linked by an edge in the knowledge graph, we connect the corresponding nodes in our semantic relationship graph. The knowledge graphs represent abstracted expert knowledge and relationships between diseases, which are essential for disease diagnosis since multiple diseases can interrelate during the progression of a particular disease. For example, Figure 6 shows the progression from cardiomegaly to edema and pleural effusion. Cardiomegaly, which refers to an enlarged heart, can result from heart dysfunction that causes blood congestion in the heart, eventually leading to its enlargement. The congested blood is pumped into the lungs’ veins, increasing the pressure in the vessels and pushing fluid out of the lungs and into the pleural spaces, indicating the initial sign of pulmonary edema. At the same time, fluid accumulates between the layers of the pleura outside the lungs, resulting in pleural effusion, which can also cause compression atelectasis. If pulmonary edema progresses, widespread opacification will appear in the lungs, as stated in actual diagnostic reports such as ”the effusions remain moderate and still cause substantial bilateral areas of basilar atelectasis” and ”Bilateral basilar opacity can be seen, suggesting the presence of the bilateral or right-sided basilar atelectasis” (Figure 7).
3) Implicit relationship: a fully connected graph is applied to find the implicit relationships that are not defined by the other two graphs (spatial and semantic graphs). This graph serves as a complement to the other two as it covers all possible relationships, although it is not specific to any one particular relationship. Among these three types of relationships, spatial and semantic relationships can be categorized as explicit relationships. The implicit graph itself is categorized as the implicit relationship.
3.4. Relation-Aware Graph Attention Network
we construct the multi-relationship graph for both main and reference images and use the relation-aware graph attention network (ReGAT) proposed by (Li et al., 2019) to learn the graph representation for each image. We then embed the image into the final latent feature, which is input into the answer generation module to generate the final answers. Please refer to Appendix for details of the calculation.
4. Experiments
4.1. Datasets
MIMIC-CXR. The MIMIC-CXR dataset is a large publicly available dataset of chest radiographs with radiology reports, containing 377,110 images corresponding to 227,835 radiograph studies from 65,379 patients (Johnson et al., 2019a). One patient may have multiple studies, each consisting of a radiology report and one or more images. Two primary sections of interest in reports are findings: a natural language description of the important aspects of the image, and an impression: a summary of the most immediately relevant findings. Our MIMIC-Diff-VQA is constructed based on the MIMIC-CXR dataset.
Chest ImaGenome. MIMIC-CXR has been added more annotations by (Wu et al., 2021) including the anatomical structure bounding boxes. This new dataset is named Chest ImaGenome Dataset. We trained the Faster-RCNN to detect the anatomical structures on their gold standard dataset, which contains 26 anatomical structures.
VinDr-CXR. The VinDr-CXR dataset consists of 18,000 images manually annotated by 17 experienced radiologists (Nguyen et al., 2020). Its images have 22 local labels of boxes surrounding abnormalities and six global labels of suspected diseases. We used it to train the pre-trained disease detection model.
4.2. Baselines
It is important to compare multiple baselines. However, we would like to emphasize that the image difference question and answer task is a novel problem even in the general computer vision domain. To date, no prior research has specifically addressed the ”image difference question answering” problem. Only a few studies have focused on the general image difference caption task, such as MMCFormers (Qiu et al., 2021) and IDCPCL (Yao et al., 2022). Therefore, our work serves as the first step in this new direction and provides a valuable contribution to the research community. We chose baseline models from traditional medical VQA tasks and image difference captioning tasks to address both non-”Difference” and ”Difference” queries. Below are the baseline models we have selected:
1.MMQ is one of the recently proposed methods to perform the traditional medical VQA task with excellent results. MMQ adopts Model Agnostic Meta-Learning (MAML) (Finn et al., 2017) to handle the problem of the small size of the medical dataset. It also relieves the problem of the difference in visual concepts between general and medical images when finetuning.
2.MCCFormers is proposed to handle the image difference captioning task (Qiu et al., 2021). It achieved state-of-the-art performance on the CLEVR-Change dataset (Park et al., 2019), a famous image difference captioning dataset. MCCFormers used transformers to capture the region relationships among intra- and inter-image pairs.
3.Image Difference Captioning with Pre-training and Contrastive Learning (IDCPCL) (Yao et al., 2022) is the state-of-the-art method performed on the general image difference captioning task. They use the pretraining technique to build the bridge between vision and language, allowing them to align large visual variance between image pairs and greatly improve the performance on the challenging image difference dataset, Birds-to-Words (Forbes et al., 2019).
4.3. Results and Discussion.
We implemented the experiments on the PyTorch platform. We used an Adam optimizer with a learning rate of 0.0001 to train our model for 30,000 iterations at a batch size of 64. The experiments are conducted on two GeForce RTX 3090 cards with 3 hours and 49 minutes of training time. The bounding box feature dimension is 1024. Each word is represented by a 600-dimensional feature vector including a 300-dimensional Glove (Pennington et al., 2014) embedding. We used BLEU (Papineni et al., 2002), METEOR (Lavie and Agarwal, 2007), ROUGE_L (Lin, 2004), CIDEr (Vedantam et al., 2015), which are popular metrics for evaluating the generated text, as the metric in our experiments. We obtain the results using Microsoft COCO Caption Evaluation (Chen et al., 2015). For the comparison with MMQ, we use accuracy as the metric.
4.3.1. Ablation Study.
In Tab. 3, we present the quantitative results of our ablation studies on the MIMIC-Diff-VQA dataset using different graph settings. Our method was tested with implicit graph-only, spatial graph-only, semantic graph-only, and the full model incorporating all three graphs. As we can see, our full model achieves the best performance across most metrics compared to other graph settings. Furthermore, in the Appendix, we illustrated the regions of interest (ROIs) of our model using different graphs to demonstrate the improved interpretability achieved by incorporating the spatial and semantic graphs. This is particularly useful in analyzing the location and relationship between abnormalities, providing crucial insights into the anatomical structure from a medical perspective.
| Metrics | Implicit | Spatial | Semantic | Full |
|---|---|---|---|---|
| Bleu-1 | 0.626 | 0.617 | 0.623 | 0.624 |
| Bleu-2 | 0.540 | 0.532 | 0.540 | 0.541 |
| Bleu-3 | 0.475 | 0.468 | 0.477 | 0.477 |
| Bleu-4 | 0.418 | 0.413 | 0.421 | 0.422 |
| METEOR | 0.333 | 0.337 | 0.340 | 0.337 |
| ROUGE-L | 0.649 | 0.647 | 0.644 | 0.645 |
| CIDEr | 1.911 | 1.896 | 1.898 | 1.893 |
4.3.2. Comparison of accuracy.
Due to the nature of MMQ being a classification model, MMQ cannot perform on our difference question type because of the diversity of answers. Also, given that the baseline model cannot take in two images simultaneously, we exclude the difference type question from this comparison. Therefore, we compare our method with MMQ only on the other six types of questions, including abnormality, presence, view, location, type, and level. These six types of questions have a limited number of answers. To compare with them, we use accuracy as the metric for comparison. Please note that our method is still a text-generation model. We count the predicted answer as a True answer only when the prediction is fully matched with the ground truth answer.
The comparison results are shown in Tab. 4. We have refined the comparison into open-ended question results and closed-ended question (with only ’yes’ or ’no’ answers) results. It is clear that the current VQA model has difficulty handling our dataset because of the lack of focus on the key regions and the ability to find the relationships between anatomical structures and diseases. Also, even after filtering out the difference questions, there are still 9,252 possible answers in total. It is difficult for a classification model to localize the optimal answer from such a huge amount of candidates.
| Question | Open | Closed | Total |
|---|---|---|---|
| MMQ | 11.5 | 10.8 | 11.5 |
| Ours | 26.4 | 79.9 | 52.5 |
4.3.3. Evidence and faithfulness
In terms of the evidence aspect, our model is designed to enhance the diagnostic process for doctors. Firstly, it highlights the regions of an image indicative of diseases, allowing doctors to quickly and easily inspect and verify their thoughts. Secondly, it empowers doctors to inquire further about specific abnormalities, providing them with the necessary tools to inspect and understand where the information comes from.
In terms of the faithfulness aspect, there is concern that the model may capture the distribution of the dataset, relying solely on language priors without comprehending the input image and medical knowledge. To assess this language prior issue, we performed another experiment by removing all images and only keeping the questions. As shown in Tab. 5, the resulting predictions were significantly worse than those obtained using the original images.
| Metrics | Questions only | Images + questions |
|---|---|---|
| Bleu-1 | 0.51 | 0.62 |
| Bleu-2 | 0.33 | 0.54 |
| Bleu-3 | 0.18 | 0.48 |
| Bleu-4 | 0.12 | 0.42 |
| METEOR | 0.319 | 0.337 |
| ROUGE_L | 0.340 | 0.645 |
| CIDEr | 0 | 1.893 |
4.3.4. Comparison of quality of the text.
To evaluate the generated answers in the ”difference” question, we use metrics specifically designed for evaluating generated text, such as BLEU, METEOR, ROUGE_L, and CIDEr. The comparison results between our method, MCCFormers, and IDCPCL are presented in Tab. 6. Our method outperforms MCCFormers in all metrics. Although IDCPCL performs better than MCCFormers, it is still not comparable to our method.
Even though our method utilized the pre-training technique, the comparison is not unfair. The main objective of our pre-trained model is to utilize medical knowledge (read and compare the images in each anatomical structure) to construct graph models and capture subtle changes in images related to disease progression. Our model is specifically tailored for the task of medical image difference VQA and does not employ any general pre-trained strategies like contrastive learning in our framework.
The IDCPCL baseline model used contrastive learning and a combination of three pre-training tasks (Masked Language Modeling, Masked Visual Contrastive Learning, and Fine-grained Difference Aligning) to align images and text. This approach was found to be effective in improving image difference captioning on datasets with large changes and complex background variations. To adapt this approach for the medical image difference VQA task, we made modifications to the IDCPCL model and pre-trained the image and text feature extraction on medical images and clinical notes. Contrastive learning has shown superior performances compared to the conventional pre-trained Resnet classification model (Khosla et al., 2020). Despite the complex pre-training tasks employed, our method significantly outperformed IDCPCL across almost all metrics and interpretability measures.
MCCFormers has inferior results compared to our method, as it struggles to differentiate between images. This is due to the generated answers of MCCFormers being almost identical and its failure to identify the differences between images. MCCFormers, a difference captioning method, compares patch to patch directly, which may work well in the simple CLVER dataset. However, in medical images, most of which are not aligned, the patch-to-patch method cannot accurately identify which region corresponds to a specific anatomical structure. Additionally, MCCFormers does not require medical knowledge graphs to find the relationships between different regions.
| Metrics | MCCFormers | IDCPCL | Ours |
|---|---|---|---|
| Bleu-1 | 0.214 | 0.614 | 0.628 |
| Bleu-2 | 0.190 | 0.541 | 0.553 |
| Bleu-3 | 0.170 | 0.474 | 0.491 |
| Bleu-4 | 0.153 | 0.414 | 0.434 |
| METEOR | 0.319 | 0.303 | 0.339 |
| ROUGE_L | 0.340 | 0.582 | 0.577 |
| CIDEr | 0 | 0.703 | 1.027 |
4.3.5. Disccussion
During the process of clinical reasoning using medical imaging studies, a significant amount of background knowledge is utilized to compare the baseline study (past) with the target study (present). However, modeling background clinical expert knowledge is not straightforward due to its implicitness, which necessitates inferring the best configuration of knowledge modeling based on multiple graphs, such as the implicit, spatial, and semantic graphs (see Figure 3). Therefore, we stand on the shoulder of (Li et al., 2019) which constructs a multi-relationship graph for general image VQA.
Please note that our model differs fundamentally from the one presented in (Li et al., 2019). Their model is designed specifically for single-image VQA problems, while ours is for medical image difference VQA, which is a novel problem that involves two images. Additionally, our approach extracts anatomical structure-aware features. This involves computing and normalizing the image differences within each anatomical structure, ensuring relevance to disease progression, and invariance to changes in image pose, orientation, and scale. To develop our approach, we created an expert knowledge-aware graph that utilizes clinical knowledge. This graph follows the workflow of clinicians who read, compare, and diagnose diseases from medical images based on anatomical structures. Our model is unique in its approach of incorporating clinical knowledge into a multi-relationship graph learning framework, which has not been utilized in general VQA models.
4.4. Visualization.
Visualized results can be found in Appendix.
5. Conclusion
First, We propose a medical image difference VQA problem and collect a large-scale MIMIC-Diff-VQA dataset for this task, which is valuable to both the research and medical communities. Also, we design an anatomical structure-aware feature learning approach and an expert knowledge-aware multi-relation image difference graph to extract image-difference features. We train an image difference VQA framework utilizing medical knowledge graphs and compare it to current state-of-the-art methods with improved performances. However, there are still limitations to our dataset and method. Our constructed dataset currently only focuses on the common cases and ignores special ones, i.e. cases where the same disease appears in more than two places. Our current Key-Info dataset can only take care of, at most, two locations of the same disease. Furthermore, there are specific cases where different abnormality names may be combined. For example, when examining edema, interstitial opacities are indicative of edema. Therefore, future work should focus on expanding the dataset to include more special cases.
It is worth noting that our model also brings some errors. Representative errors can be summarized into three types: 1, confusion between different presentation aspects of the same abnormality, such as atelectasis and lung opacity being mistaken for each other. 2, different names for the same type of abnormality, such as enlargement of the cardiac silhouette being misclassified as cardiomegaly. 3, the pre-trained backbone (Faster-RCNN) used for extracting image features may provide inaccurate features and lead to incorrect predictions, such as lung opacity being wrongly recognized for pleural effusion.
Acknowledgements.
This research received support from the JST Moonshot R&D Grant Number JPMJMS2011 and the Japan Society for the Promotion of Science Grant Number 22K07681. Additionally, it was partially supported by the Intramural Research Program of the National Institutes of Health Clinical Center.References
- (1)
- Ben Abacha et al. (2021) Asma Ben Abacha, Mourad Sarrouti, Dina Demner-Fushman, Sadid A. Hasan, and Henning Müller. 2021. Overview of the VQA-Med Task at ImageCLEF 2021: Visual Question Answering and Generation in the Medical Domain. In CLEF 2021 Working Notes (CEUR Workshop Proceedings). CEUR-WS.org, Bucharest, Romania.
- Chen et al. (2015) Xinlei Chen, Hao Fang, Tsung-Yi Lin, Ramakrishna Vedantam, Saurabh Gupta, Piotr Dollár, and C Lawrence Zitnick. 2015. Microsoft coco captions: Data collection and evaluation server. arXiv preprint arXiv:1504.00325 (2015).
- Cho et al. (2014) Kyunghyun Cho, Bart Van Merriënboer, Caglar Gulcehre, Dzmitry Bahdanau, Fethi Bougares, Holger Schwenk, and Yoshua Bengio. 2014. Learning phrase representations using RNN encoder-decoder for statistical machine translation. arXiv preprint arXiv:1406.1078 (2014).
- Finn et al. (2017) Chelsea Finn, Pieter Abbeel, and Sergey Levine. 2017. Model-agnostic meta-learning for fast adaptation of deep networks. In International conference on machine learning. PMLR, 1126–1135.
- Forbes et al. (2019) Maxwell Forbes, Christine Kaeser-Chen, Piyush Sharma, and Serge Belongie. 2019. Neural naturalist: generating fine-grained image comparisons. arXiv preprint arXiv:1909.04101 (2019).
- Goldberger et al. (2000) Ary L Goldberger, Luis AN Amaral, Leon Glass, Jeffrey M Hausdorff, Plamen Ch Ivanov, Roger G Mark, Joseph E Mietus, George B Moody, Chung-Kang Peng, and H Eugene Stanley. 2000. PhysioBank, PhysioToolkit, and PhysioNet: components of a new research resource for complex physiologic signals. circulation 101, 23 (2000), e215–e220.
- Irvin et al. (2019) Jeremy Irvin, Pranav Rajpurkar, Michael Ko, Yifan Yu, Silviana Ciurea-Ilcus, Chris Chute, Henrik Marklund, Behzad Haghgoo, Robyn Ball, Katie Shpanskaya, et al. 2019. Chexpert: A large chest radiograph dataset with uncertainty labels and expert comparison. In Proceedings of the AAAI conference on artificial intelligence, Vol. 33. 590–597.
- Jhamtani and Berg-Kirkpatrick (2018) Harsh Jhamtani and Taylor Berg-Kirkpatrick. 2018. Learning to describe differences between pairs of similar images. arXiv preprint arXiv:1808.10584 (2018).
- Johnson et al. (2019a) Alistair EW Johnson, Tom J Pollard, Seth J Berkowitz, Nathaniel R Greenbaum, Matthew P Lungren, Chih-ying Deng, Roger G Mark, and Steven Horng. 2019a. MIMIC-CXR, a de-identified publicly available database of chest radiographs with free-text reports. Scientific data 6, 1 (2019), 1–8.
- Johnson et al. (2019b) Alistair EW Johnson, Tom J Pollard, Nathaniel R Greenbaum, Matthew P Lungren, Chih-ying Deng, Yifan Peng, Zhiyong Lu, Roger G Mark, Seth J Berkowitz, and Steven Horng. 2019b. MIMIC-CXR-JPG, a large publicly available database of labeled chest radiographs. arXiv preprint arXiv:1901.07042 (2019).
- Khosla et al. (2020) Prannay Khosla, Piotr Teterwak, Chen Wang, Aaron Sarna, Yonglong Tian, Phillip Isola, Aaron Maschinot, Ce Liu, and Dilip Krishnan. 2020. Supervised contrastive learning. Advances in neural information processing systems 33 (2020), 18661–18673.
- Lau et al. (2018) Jason J Lau, Soumya Gayen, Asma Ben Abacha, and Dina Demner-Fushman. 2018. A dataset of clinically generated visual questions and answers about radiology images. Scientific data 5, 1 (2018), 1–10.
- Lavie and Agarwal (2007) Alon Lavie and Abhaya Agarwal. 2007. METEOR: An automatic metric for MT evaluation with high levels of correlation with human judgments. In Proceedings of the second workshop on statistical machine translation. 228–231.
- Li et al. (2019) Linjie Li, Zhe Gan, Yu Cheng, and Jingjing Liu. 2019. Relation-aware graph attention network for visual question answering. In Proceedings of the IEEE/CVF international conference on computer vision. 10313–10322.
- Lin (2004) Chin-Yew Lin. 2004. Rouge: A package for automatic evaluation of summaries. In Text summarization branches out. 74–81.
- Neumann et al. (2019) Mark Neumann, Daniel King, Iz Beltagy, and Waleed Ammar. 2019. ScispaCy: fast and robust models for biomedical natural language processing. arXiv preprint arXiv:1902.07669 (2019).
- Nguyen et al. (2020) Ha Q Nguyen, Khanh Lam, Linh T Le, Hieu H Pham, Dat Q Tran, Dung B Nguyen, Dung D Le, Chi M Pham, Hang TT Tong, Diep H Dinh, et al. 2020. VinDr-CXR: An open dataset of chest X-rays with radiologist’s annotations. arXiv preprint arXiv:2012.15029 (2020).
- Nguyen et al. (2021) Hoang T. N. Nguyen, Dong Nie, Taivanbat Badamdorj, Yujie Liu, Yingying Zhu, Jason Truong, and Li Cheng. 2021. Automated Generation of Accurate & Fluent Medical X-ray Reports. CoRR abs/2108.12126 (2021).
- Norcliffe-Brown et al. (2018) Will Norcliffe-Brown, Stathis Vafeias, and Sarah Parisot. 2018. Learning conditioned graph structures for interpretable visual question answering. Advances in neural information processing systems 31 (2018).
- Oluwasanmi et al. (2019) Ariyo Oluwasanmi, Enoch Frimpong, Muhammad Umar Aftab, Edward Y Baagyere, Zhiguang Qin, and Kifayat Ullah. 2019. Fully convolutional captionnet: Siamese difference captioning attention model. IEEE Access 7 (2019), 175929–175939.
- Papineni et al. (2002) Kishore Papineni, Salim Roukos, Todd Ward, and Wei-Jing Zhu. 2002. Bleu: a method for automatic evaluation of machine translation. In Proceedings of the 40th annual meeting of the Association for Computational Linguistics. 311–318.
- Park et al. (2019) Dong Huk Park, Trevor Darrell, and Anna Rohrbach. 2019. Robust change captioning. In Proceedings of the IEEE/CVF International Conference on Computer Vision. 4624–4633.
- Pennington et al. (2014) Jeffrey Pennington, Richard Socher, and Christopher D Manning. 2014. Glove: Global vectors for word representation. In Proceedings of the 2014 conference on empirical methods in natural language processing (EMNLP). 1532–1543.
- Pham et al. (2021) Van-Tien Pham, Cong-Minh Tran, Stanley Zheng, Tri-Minh Vu, and Shantanu Nath. 2021. Chest X-ray abnormalities localization via ensemble of deep convolutional neural networks. In 2021 International Conference on Advanced Technologies for Communications (ATC). IEEE, 125–130.
- Qiu et al. (2021) Yue Qiu, Shintaro Yamamoto, Kodai Nakashima, Ryota Suzuki, Kenji Iwata, Hirokatsu Kataoka, and Yutaka Satoh. 2021. Describing and Localizing Multiple Changes with Transformers. In Proceedings of the IEEE/CVF International Conference on Computer Vision. 1971–1980.
- Ren et al. (2015) Shaoqing Ren, Kaiming He, Ross Girshick, and Jian Sun. 2015. Faster r-cnn: Towards real-time object detection with region proposal networks. Advances in neural information processing systems 28 (2015).
- Toutanova et al. (2003) Kristina Toutanova, Dan Klein, Christopher D Manning, and Yoram Singer. 2003. Feature-rich part-of-speech tagging with a cyclic dependency network. In Proceedings of the 2003 Human Language Technology Conference of the North American Chapter of the Association for Computational Linguistics. 252–259.
- Vedantam et al. (2015) Ramakrishna Vedantam, C Lawrence Zitnick, and Devi Parikh. 2015. Cider: Consensus-based image description evaluation. In Proceedings of the IEEE conference on computer vision and pattern recognition. 4566–4575.
- Wang et al. (2017) Xiaosong Wang, Yifan Peng, Le Lu, Zhiyong Lu, Mohammadhadi Bagheri, and Ronald M Summers. 2017. Chestx-ray8: Hospital-scale chest x-ray database and benchmarks on weakly-supervised classification and localization of common thorax diseases. In Proceedings of the IEEE conference on computer vision and pattern recognition. 2097–2106.
- Wu et al. (2021) Joy T Wu, Nkechinyere N Agu, Ismini Lourentzou, Arjun Sharma, Joseph A Paguio, Jasper S Yao, Edward C Dee, William Mitchell, Satyananda Kashyap, Andrea Giovannini, et al. 2021. Chest ImaGenome dataset for clinical reasoning. arXiv preprint arXiv:2108.00316 (2021).
- Yao et al. (2022) Linli Yao, Weiying Wang, and Qin Jin. 2022. Image Difference Captioning with Pre-training and Contrastive Learning. arXiv preprint arXiv:2202.04298 (2022).
- Yao et al. (2018) Ting Yao, Yingwei Pan, Yehao Li, and Tao Mei. 2018. Exploring visual relationship for image captioning. In Proceedings of the European conference on computer vision (ECCV). 684–699.
- Zhang et al. (2020) Yixiao Zhang, Xiaosong Wang, Ziyue Xu, Qihang Yu, Alan Yuille, and Daguang Xu. 2020. When radiology report generation meets knowledge graph. In Proceedings of the AAAI Conference on Artificial Intelligence, Vol. 34. 12910–12917.
Appendix A Appendix for Visualizations, Related Work, MIMIC-Diff-VQA Dataset, and Our Method
For further information on the Visualizations, related work, MIMIC-Diff-VQA dataset, and our method, please refer to the additional appendix, available at https://github.com/Holipori/KDD2023Appendix/blob/main/Appendix.pdf.