Searching in H i for Massive Low Surface Brightness Galaxies:
Samples from HyperLeda and the UGC
Abstract
A search has been made for 21 cm H i line emission in a total of 350 unique galaxies from two samples whose optical properties indicate they may be massive The first consists of 241 low surface brightness (LSB) galaxies of morphological type Sb and later selected from the HyperLeda database and the the second consists of 119 LSB galaxies from the UGC with morphological types Sd-m and later. Of the 350 unique galaxies, 239 were observed at the Nançay Radio Telescope, 161 at the Green Bank Telescope, and 66 at the Arecibo telescope. A total of 295 (84.3%) were detected, of which 253 (72.3%) appear to be uncontaminated by any other galaxies within the telescope beam. Finally, of the total detected, uncontaminated galaxies, at least 31 appear to be massive LSB galaxies, with a total H i mass 1010 , for . If we expand the definition to also include galaxies with significant total (rather than just gas) mass, i.e., those with inclination-corrected H i line width 500 km s-1, this bring the total number of massive LSB galaxies to 41. There are no obvious trends between the various measured global galaxy properties, particularly between mean surface brightness and galaxy mass.
1 INTRODUCTION
Low Surface Brightness (LSB) galaxies – spiral galaxies with a central surface brightness at least one magnitude arcsec-2 fainter than the night sky – are now well established as a class of galaxies with properties distinct from the High Surface Brightness (HSB) objects that define the Hubble sequence. However, considerable uncertainty still exists about the range of LSB galaxy properties and their number density in the z0.1 Universe. As LSB galaxies encompass many of the extremes in galaxy properties, gaining a firm understanding of their properties and number counts is vital for testing galaxy formation and evolution theories, as well as for determining the relative amounts of baryons that are contained in galaxy potentials, compared to those that may comprise the intergalactic medium. As we will show, we have not yet fully sampled the LSB galaxy parameter space. In addition, it should be emphasized that there may still be large numbers of LSB galaxies with properties beyond our present detection limits.
The traditional (albeit erroneous) perception of LSB galaxies is that they are young dwarf galaxies which have undergone little star formation: low mass, late-type, fairly blue systems with relatively high ratios and low metallicities. In practice, however, LSB disk galaxies are known to have a remarkable diversity in properties, including very red objects with near-solar metallicity (e.g. O’Neil et al., 2007), as well as massive (1010 , for km s-1 Mpc-1), systems such as Malin 1 (the largest disk galaxy found to date), [SII93] 1226+010, Malin 2 and others (e.g. Bothun et al., 1987; Sprayberry et al., 1995). Note, too, that the galaxies’ observed H i-richness may be biased by the fact that their redshifts are often determined through H i observations – an optical redshift survey of LSB galaxies observed at 21 cm (Burkholder et al., 2001) also contains objects with very low ratios (Bell & Bower, 2000).
In principle, massive, or giant, LSB galaxies can be defined on different criteria. Based on surface photometry, Sprayberry et al. (1995) defined a “diffuseness index” to distinguish massive LSB galaxies, which is based on the deprojected blue central surface brightness and the scale length of the disk – the 7 giants in their paper have = 23.2 mag arcsec-2 and = 13.0 kpc. Other selection criteria can be used as well, such as: deprojected central blue disk surface brightness (0) 23 mag arcsec-2 and H i mass 109.5-10 or optical diameter 50 kpc (e.g. Kulier et al., 2020; Mishra et al., 2017; Pickering et al., 1997). In the present study we use the criterion 1010 to identify massive galaxies, although we also consider the cases with high dynamical mass as defined by an inclination-corrected line width 500 km s-1.
Massive LSB galaxies are interesting for a number of reasons:
-
1.
The current rate and history of star formation in massive LSB galaxies is puzzling. Optical photometry shows that most have blue colors, and this appears to be due in part to lower metallicities, as well as to a young population of stars (e.g. O’Neil et al., 1997). What has delayed star formation in such massive galaxies?
-
2.
How the massive LSB galaxies have evolved into large disk systems without converting much of their gas into stars poses an interesting problem for galaxy evolution models. Are they in environments where the disks have remained undisturbed, are they all in the late stage of mergers, have they only recently been assembled, or does their high dark matter content play a rôle in their stellar evolution (Du et al., 2015; Galaz et al., 2011; van den Hoek et al., 2000; Lelli et al., 2010; Pickering et al., 1997)?
-
3.
Much of the H i in the local universe is tied up in LSBs, either in dwarfs (which constitute the great majority of LSBs) or in higher-mass galaxies that have large H i-to-optical flux ratios (Rosenberg & Schneider, 2002). Massive LSBs are rare, but can contain very large H i masses. What is their overall contribution to the H i mass function?
-
4.
Finally, massive LSB galaxies often have a significant bulge component, and frequently an active nucleus raising the question of how the extremely large and extremely diffuse stellar disks of many of these objects continue to exist (e.g. Gallagher & Bushouse, 1983; Knezek, 1993; Knezek et al., 1999; Schombert, 1998)
The origin and evolutionary histories of massive LSB galaxies remain unclear. Hoffman et al. (1992) proposed a scenario with giants forming from rare, low density fluctuations in very low density regions, which should give rise to quiescent, gas-rich disks, with flat rotation curves with 300 km s-1. Knezek (1993) suggested an alternative scenario, based on Kormendy & Westpfahl (1989), whereby LSB Giants may have dissipatively formed from massive, metal-poor dark matter halos. More recent studies have expounded on these, theorizing that LSB galaxies start as a high surface brightness disk galaxy (Saburova et al., 2021) or spheroid (Clauwens et al., 2018) with the LSB disk forming later through accretion of external gas. Another possibility is that they form through the merger of more than one galaxy (e.g. Martin et al., 2019) and/or that the disk itself is the result of a recent merger and will eventually coalesce into a higher surface brightness disk (e.g. Clauwens et al., 2018; Zavala et al., 2016). Finally, of course, it is possible that all of these scenarios are correct in different circumstances, and that the evolutionary history of massive LSB galaxies is as complex as of their HSB counterparts (e.g. Kulier et al., 2020). However, the limited number of objects available for study makes testing these theories challenging, at best.
We have previously undertaken surveys to explore the number density and H i properties of massive LSB galaxies in the nearby Universe. These earlier projects focused on two different samples – late-type LSB galaxies found in the UGC (Uppsala General Catalogue of Galaxies, Nilson, 1973; O’Neil et al., 2004) and near-infrared LSB galaxies found in the 2MASS catalog (Monnier Ragaigne et al., 2003a, b, c). Both samples were observed in H i using the Nançay and Arecibo radio telescopes with good success: out of 231 UGC galaxies observed, 146 were detected, including 47 (32% of the detected objects) massive LSB galaxies, and out of the 701 2MASS galaxies observed, 278 were detected, of which 31 (11%) were also found to be massive. These results established that massive LSB galaxies are surprisingly abundant, but the surveys were incomplete and a more systematic set of H i observations of a homogeneous sample were required.
To search for additional massive LSB galaxies we undertook a second survey, using a combination of (1) 241 LSB galaxies selected from the online Lyon Extragalactic Database (HyperLeda - http://leda.univ-lyon1.fr) on their mean surface brightness in the band (referred to as the HyperLeda sample), and (2) 119 LSB galaxies from the UGC (Nilson, 1973) with morphological types Sd-m (the UGC sample). Initially the HyperLeda sample was observed in H i using the Arecibo, Green Bank, and Nançay radio telescopes, while the UGC sample was observed at Nançay only. At a later stage, the GBT was used for follow-up H i observations of both samples, to clarify any potential (RFI, or other) confusion regarding prior detections and to search for prior non-detections.
The selection of the two samples of LSB galaxies we observed in the 21 cm H i line is described in Section 2, the observations and the data reduction are presented in Section 3, and the results in Section 4. A discussion of the results is given in Sections 5 and 6, and our conclusions are presented in Section 7. Appendix A provides details of many of the individual galaxies observed.
Please note that throughout this paper a Hubble constant value of was used, and that all radial velocities are heliocentric and calculated according to the conventional optical definition (cz).
2 GALAXY SAMPLE SELECTION
The Hyperleda and UGC galaxy samples were defined in 2004 and 2002, respectively, before the stream of galaxy redshifts from the Sloan Digital Sky Survey (SDSS; see, e.g., York et al. 2000) became available. All values used here reflect the most recently available information, but this results in a few galaxies that are included in the sample which would not have been selected based on the more recently updated spectroscopic velocities and photometric values.
2.1 HyperLeda Sample
The HyperLeda galaxies were selected from the HyperLeda database (see e.g. Makarov et al. 2014), based on the following criteria, as available in 2004:
-
•
average blue surface brightness 25 mag arcsec-2, defined following Bothun et al. (1985), to select for galaxies with a low surface brightness disk: = + 2.5 log() + 8.63. Here is the apparent total blue magnitude and the blue major axis diameter, both at the 25 mag arcsec-2 isophotal level, in arcmin;
-
•
morphological type later than Sb, to insure galaxies have a disk and to increase the likelihood of detection in H i;
-
•
optical diameter 30″, to insure against selecting dwarf galaxies;
-
•
no known redshift (at the time of observation, in 2004);
-
•
inclination 70∘;
-
•
declination -38∘80∘ to allow for observation by the radio telescopes.
The complete list of galaxies meeting these criteria comprised 290 objects. Of these, 241 were randomly selected for observation. (The complete sample could not to be observed due to limitations in telescope availability.)
2.2 UGC Sample
The UGC galaxies were selected from the complete set of UGC dwarf and LSB galaxies that were originally observed by Schneider et al. (1990a) and Schneider et al. (1992) in H i, which comprises all listed dwarf, irregular, and magellanic galaxies in the UGC – a total of 1845 galaxies, or 14% of the total of 12,940 galaxies in the catalog. The original observations were made with the 305m Arecibo telescope and at the Green Bank 300 foot telescope otherwise. Most of the Green Bank detections were of nearby, H i-rich dwarfs only, due to the telescope’s narrow bandpasses (3000 km s-1) and low sensitivity.
By 1992, 85% were detected and by 2002, when we defined our present sample, the total detection rate had increased to , but more than 180 sources remained undetected. We selected all 119 remaining objects which lie outside the Arecibo declination range for observation at Nançay, excluding the following six objects whose declination is too high (82∘) for the telescope’s geometry (see below) to allow tracking: UGC 3461, UGC 5298, UGC 9478, UGC 10263, UGC 10581, and UGC 10605. The non-detections from the Arecibo sample were not re-observed with Nançay, as their non-detection limit is below what is practical with the Nançay. The GBT was later used to confirm a number of the Nançay detections and to look for non-detections from this subsample, as described in Section 3.
3 OBSERVATIONS AND DATA REDUCTION
3.1 The Arecibo Telescope
The Arecibo observations of the Hyperleda sample were carried out between November 26, 2004 and May 14, 2005 for a total of 32 hours of observing time. To avoid baseline ripples caused by the Sun, all the observations were made at night. The position-switching technique was applied, using an ON/OFF pattern with equal time given to the on-source and off-source position. The on-source integration time was 5 minutes for each galaxy. The backend was configured using 9-level sampling with the Wide band Arecibo Pulsar Processors (WAPPs) and 5 km s-1 resolution. This allowed for a velocity coverage of either a low velocity range of -2000 to 19,000 km s-1 (1330 – 1430 MHz), or a high velocity range of 19,000 to 36,000 km s-1 (1250–1330 MHz) for the two correlator boards separately. It should be noted that large sections of the high velocity range were filled with radio frequency interference (RFI) and that the r.m.s. noise levels in this band listed in the tables were measured in RFI-free sections. The original 5.3 km s-1 velocity resolution was kept throughout the data processing phase.
The data were calibrated using the on telescope noise diodes, from the original WAPP files including the two different velocity search ranges. Data analysis was performed using Supermongo routines developed by our team. The two polarizations were first averaged for each observation of a given galaxy, from which the overall r.m.s. noise level was measured by choosing a broad range without apparent unusual signatures. Obviously bad data were abandoned at this stage. After that, a polynomial baseline was fitted to the data within the vicinity of the galactic H i profile, excluding those velocity ranges with H i line emission (both from the Galaxy and the target galaxy) or RFI (e.g., the GPS L3 signal around 8300 km s-1). With a view toward optimization and faithfulness of the fitting, F-tests were performed on all the orders (0 – 9) of the polynomial fit and those that gave a result greater than 10 were considerably preferred. Fits of order higher than 4 were rarely adopted, and only the first order fit was used for profiles with low signal to noise ratios. Once the baseline was subtracted, the velocities were corrected to the optical, heliocentric system.
At 21 cm the Arecibo beam is .
3.2 The Robert C. Byrd Green Bank Telescope
The first observations of the Hyperleda sample galaxies taken with the Robert C. Byrd Green Bank Telescope (GBT) were taken in October, 2004 over a total of 9 nights for a total of 65 hours. All these observations used the Gregorian L-band receiver with the (now retired) auto-correlation spectrometer (Escoffier & Webber, 1998). As the redshifts for the observed galaxies were unknown, the spectrometer was set up to observe with a 9-level sampling, from -2000 to 25,600 km s-1 (1300 - 1430 MHz) with 2.57 km s-1 resolution, which was smoothed to 5.2 km s-1 during the data processing phase. Standard position switching techniques were used, with an ON/OFF source pattern and 300s for to each on-souce and off-source observation. A calibration noise diode was fired on blank sky at the end of each ON+OFF observing pair.
Follow-up observation of a number of the previously non-detected galaxies from the HyperLeda sample were taken with the GBT in early 2012. Again the autocorrelation spectrometer was used for the observations, with the same set-up as for the earlier observations. Position switching was used, with typically 3-5 on-source observations were taken for every off (the total number depending on available telescope time).
A second round of follow-up observations was made in the fall of 2022 to examine discrepancies among our prior detections, between our detections and those from the literature, and to try to detect the previously undetected galaxies from both the UGC and HyperLeda samples. Again the GBT’s L-band receiver was used, but now with the VEGAS spectrometer (Prestage et al., 2015). To maximize coverage, the backend was set-up to observe from -2000 to 30,250 km s-1 (1290 to 1430 MHz) with 0.15 km s-1 velocity resolution, which was smoothed to 15 km s-1 during the data processing phase. Please note though, that the presence of RFI at the lower frequencies limited the usable observing range to -2000 to 25,600 km s-1, i.e., the same as for the earlier GBT observations. Position switching was again used, with 300s scans. To maximize our science output from the telescope and taking advantage of the very stable baseline on the GBT, the observing pattern consisted of one ON+OFF source pair of scans, typically followed by 8 ON source observations, and a final ON+OFF pair. This pattern was used for all observations, if time allowed.
All data were calibrated using the engineering noise diode values measured at the GBT and checked by observing a minimum of one (and typically 2-3) standard flux calibrators each night.
Data were reduced using standard GBTIDL (http://gbtidl.nrao.edu) routines modified for our observing pattern. Any individual spectra showing baseline ripples due to RFI were removed from the data reduction package. Frequencies were converted to radial velocities in the optical, heliocentric velocity frame. Data obtained in 2022 were boxcar smoothed to 15 km s-1 resolution, cf. the 5.2 km s-1 resolution for the first sets of observations.
It should be noted that changes in instrumentation between observations make the averagine of the data together impractical.
At 21 cm, the GBT HPBW is .
3.3 The Nançay Radio Telescope
The 100-m class Nançay decimetric radio telescope (NRT), a meridian transit-type instrument of the Kraus/Ohio State design, consists of a fixed spherical mirror (300m long and 35m high), a tiltable flat mirror (20040m), and a focal carriage moving along a curved rail track; for further details on the instrument and data reduction, see van Driel et al. (2016) and references therein. Sources on the celestial equator can be tracked for about 60 minutes. Its collecting area is about 7000 m2 (equivalent to a 94-m diameter parabolic dish). Due to the E-W elongated shape of the mirrors, some of the instrument’s characteristics depend on the observed declination. At 21 cm, the telescope’s HPBW is in right ascension, independent of declination, while in the North-South direction it is 23′ for declinations up to 20∘, rising to 25′ at = 50∘ and 38′ at = 79∘, the northern limit of the survey. The instrument’s effective collecting area and, consequently, its gain follow the same geometric effect, decreasing correspondingly with declination. Flux calibration is determined through regular measurements of a cold load calibrator and periodic monitoring of strong continuum sources.
All data were taken in a standard ON/OFF position-switching mode, with an on-source integration time step of 40 seconds. An auto-correlator set-up of 4096 channels was used in a 50 MHz bandpass, with a velocity resolution of 2.6 km s-1. For most of the Hyperleda objects the default search range was -250 to 10,600 km s-1, whereas for the UGC sample it was 325 to 11,825 km s-1. For a number of objects with known higher redshifts, a search was also made at 6875 to 18,330 km s-1 (for 4 objects from the HyperLeda sample and 25 from the UGC sample). The bulk of the observations of the HyperLeda sample galaxies were made in the period July - November 2004, for a total of about 410 hours of telescope time, and the high-velocity observations were obtained in 2007, whereas the UGC sample observations were made in the period January - December 2003, using a total of about 240 hours of telescope time.
Averaging the two receiver polarizations and applying a declination-dependent factor to convert from units of system temperature to flux density in Jy was done using standard NRT software. In order to reduce the effect of relatively strong RFI in our observations, we used the RFI flagging and mitigation routine described in Monnier Ragaigne et al. (2003a) for further details). The RFI signal trigger was usually set to a level of 10 for each 40 second integration. Subsequent smoothing in velocity and baseline fitting was performed for the HyperLeda sample with standard Nançay software and for the UGC sample with Supermongo routines developed by one of our team which were based on the standard ANALYZ routines then in use at Arecibo.
Spectra with an H i line peak signal-to-noise ratio larger than 5 were boxcar smoothed to a velocity resolution of 10 km s-1 during the data reduction, whereas spectra with fainter lines and non-detections were smoothed to a resolution of 18 km s-1. Radial velocities were ultimately converted to a heliocentric, optical scale.
4 RESULTS
4.1 Literature Properties
Basic optical properties, including spectroscopic radial velocities, of the sample galaxies are listed for both H i detections and non-detections in Table 1. Details on the individual galaxies, when given, can be found in Appendix A. From the optical parameters (see list hereafter), the total blue magnitude, , and the axial ratio, , were taken from HyperLeda.
At present, redshifts are available for 177 of the observed galaxies, with 135 objects having optical spectroscopic redshifts (only), 80 having previously published H i redshifts, and 38 having both optical and H i redshifts in the literature (see Tables 1 and 4). References for all redshifts found are given in Table 1, and are divided into two categories – optical spectral line and H i velocities.
Listed in Table 1 are the following elements, in alphabetical order of galaxy name, and divided into four categories: galaxies detected in H i, spurious detections, galaxies not detected in H i and galaxies whose optical velocity measurements (taken after our observations) place them outside the H i search range. Please note that we have listed the current HyperLeda values in our Tables and used them for calculations.
-
1.
Name: Common name of the object;
-
2.
RA: Right ascension in J2000.0 coordinates;
-
3.
Dec: Declination in J2000.0 coordinates;
-
4.
Type: Morphological type, preferably from the HyperLeda database. If not available, the classification retrieved from NED, the NASA/IPAC Extragalactic Database , is given in brackets;
-
5.
: Total apparent magnitude in the band, from HyperLeda;
-
6.
D25: Length of the projected major axis of a galaxy at the isophotal level 25 mag arcsec-2 in the -band, from HyperLeda;
-
7.
: Axial ratio measured at a surface brightness level of 25 mag arcsec-2 in the -band, from HyperLeda;
-
8.
: Heliocentric velocity, from optical spectra;
-
9.
Opt. ref.: Literature reference for (the full references to the abbreviated notations used in the Table are given in the Notes to the Table);
-
10.
: Heliocentric velocity, from H i spectra;
-
11.
H i ref.: Literature reference for .
4.2 The HI Data
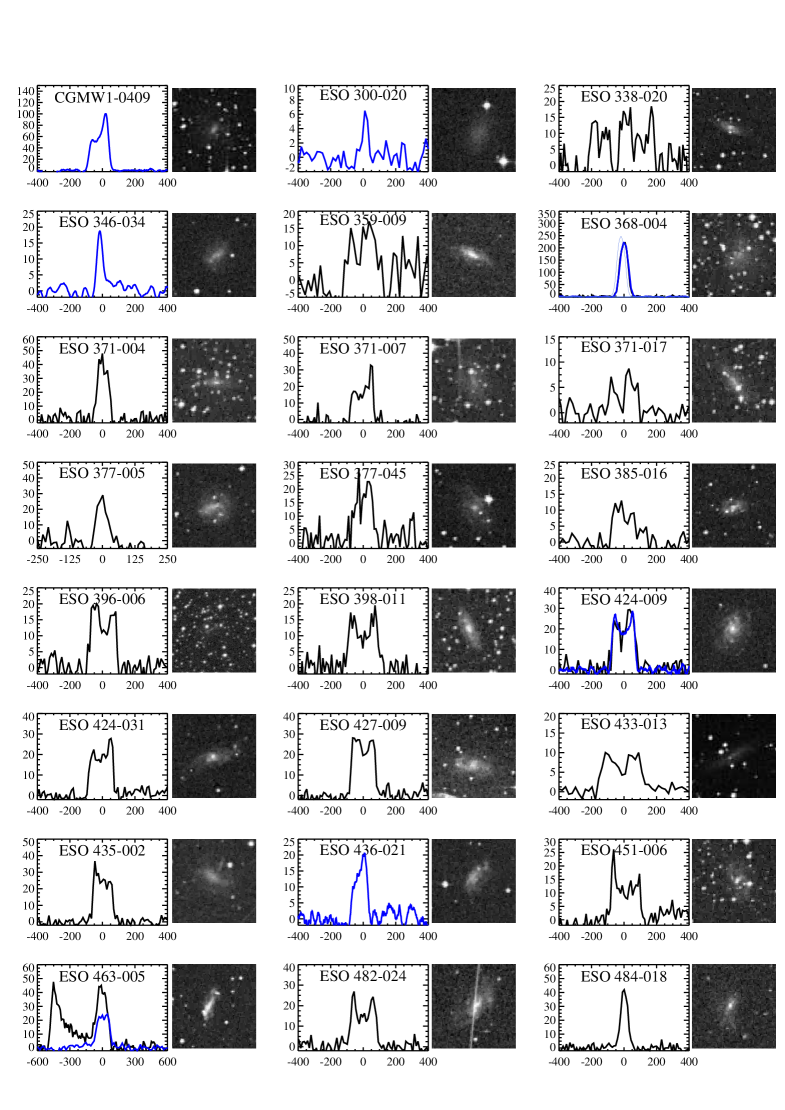
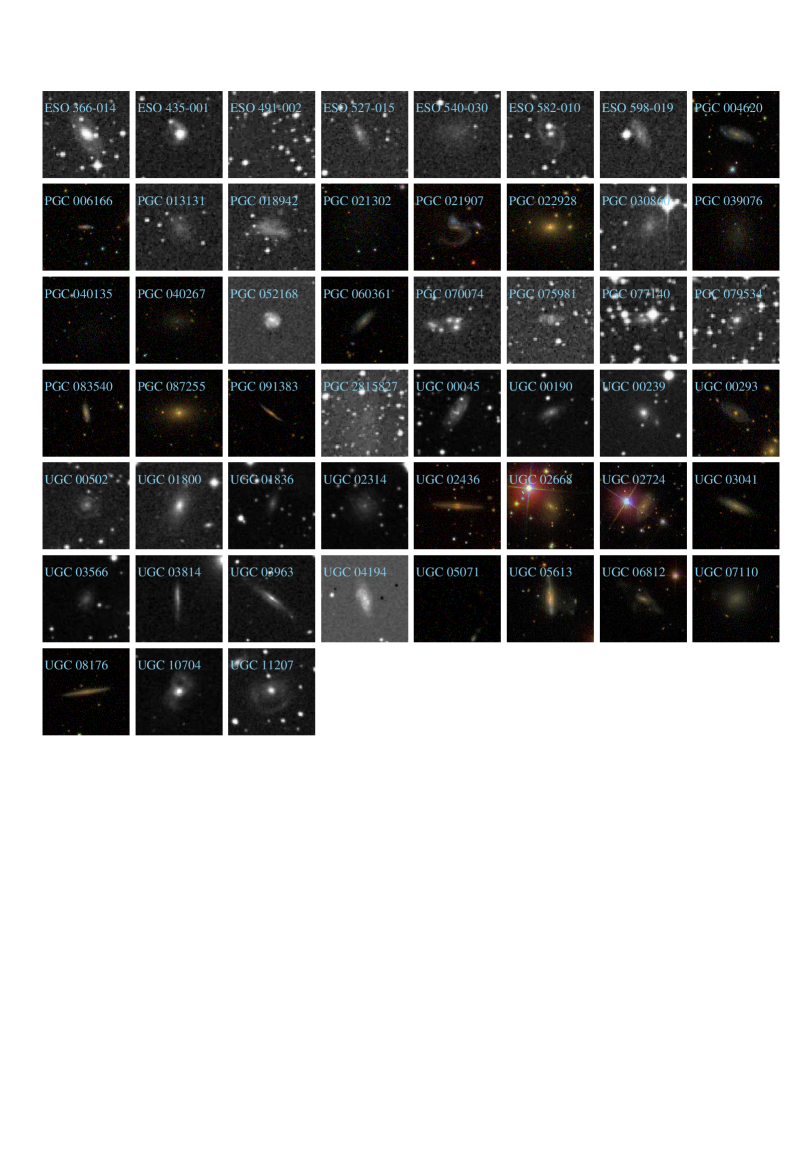
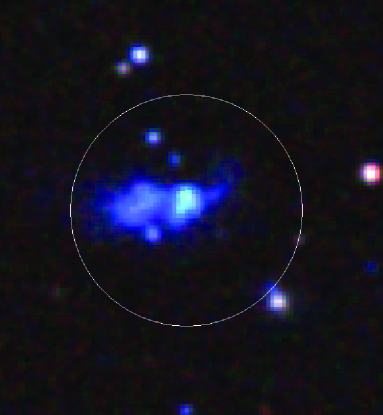
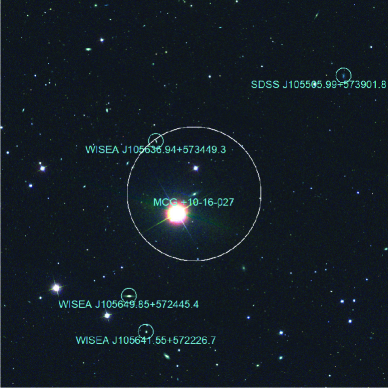
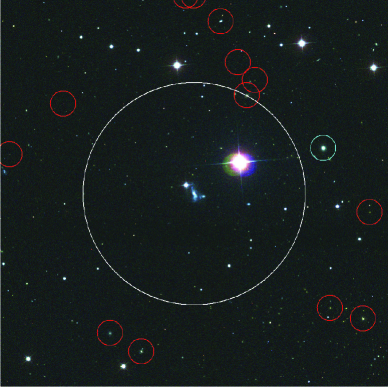
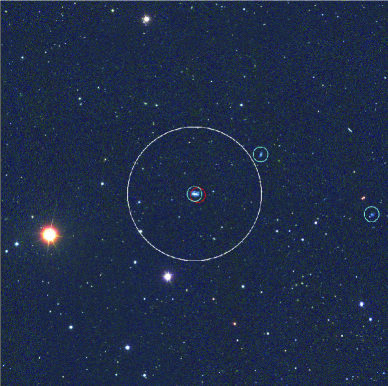
The primary results from the observations are given in Tables 2, 3, and 4. H i spectra and optical images of the detections are shown in Figure 1 and optical images of the non-detections are shown in Figure 2. The H i mass distributions for the samples can be seen in Figure 3.
Tables 2 and 3 give the measured H i line properties of all detected galaxies. Table 2 provides the median and therefore highest quality values, while Table 3 provides the values as measured by each telescope, for all galaxies which were observed by more than one telescope.
Finally, Table 4 lists the r.m.s. noise level values of all non-detections for each telescope.
In Table 2, if an object was observed with more than one telescope within the HyperLeda survey, non-weighted averages were used of the measured values, unless one or more of the individual measurements showed a significant discrepancy with the others, such as a much larger estimated uncertainty, lower line flux or difference in central velocity, in which case they were not used here (see also the notes on individual galaxies in the Appendix).
Listed in Tables 2 and 3 are the following elements for all detected galaxies, in alphabetical order of their name:
-
1.
Name: The common name of the object;
-
2.
Sample: The survey(s) for which the observation was made. The options are: HyperLeda (HL), UGC (UGC), both HyperLeda and UGC (HL/UGC), HyperLeda spurious dectection (HLS) and UGC spurious detection (UGCS). Please note that this column only appears in Table 2;
-
3.
Notes: Indication if the galaxy has notes in Appendix A; given as Y/N for Yes/No;
-
4.
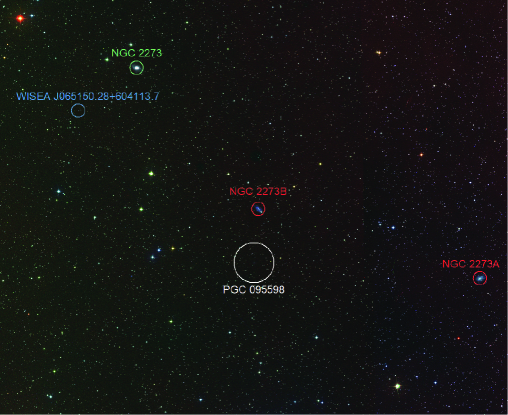
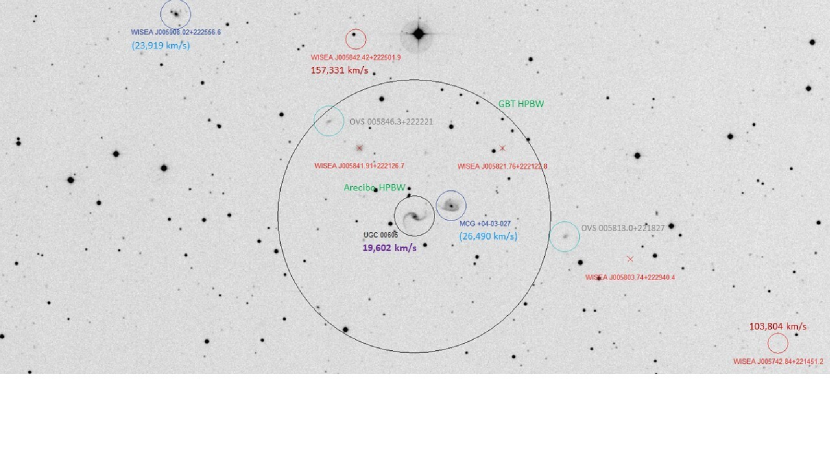
Conf: Contamination (confusion) status for detections, indicating the level of possibility that another galaxy within the telescope beam contributed some or all of the detected H i flux, graded as 1 (unlikely), 2 (possible) and 3 (very likely). For details on the assessment of the contamination status, see the description of potentially confusing sources given in Appendix for all galaxies with a confusion status of 3 or 2;
-
•
For the HyperLeda sample, a search was made (using HyperLeda and NED) within respectively 12′ radius and 1000 km s-1 around the position and systemic velocity of the detected galaxy. If no known source was found within that region, the confusion flag was set to 1, indicating the detection is likely not confused. If a known galaxy lay within that region but was unlikely to be contributing to the detected H i flux (e.g., the known galaxy is of type S0 or earlier), the confusion status flag was set to 2. If at least one galaxy lay within the region and was very likely to contribute to some or all of the detected H i gas, the confusion status was set to 3.
-
•
For the UGC sample, we first inspected Digitized Sky Survey (DSS) images centered on the position of each clearly or marginally detected source, over an area of 12′ 36′ ( ). In case galaxies were noted that might give rise to confusion with the H i profile of the target galaxy, we then queried the NED and HyperLeda databases for information on the objects.
All galaxies with possible contamination have notes in Section A;
-
•
-
5.
: Central H i line (optical, heliocentric) velocity as measured in our profiles, in km s-1;
- 6.
-
7.
: H i line velocity width measured at 50% of the H i profile peak value, in km s-1;
- 8.
-
9.
: H i line velocity width measured at 50% of the H i profile peak value, in km s-1, corrected for random motion effects, using (Tully & Fouque, 1985), and inclination:
-
10.
: H i line velocity width measured at 20 % of the H i profile peak value, in km s-1;
- 11.
-
12.
r.m.s.: r.m.s. noise level of the H i spectrum, in mJy, measured around the detected H i line. For Table 2 if the detection was made with more than one telescope only the r.m.s. for the most sensitive observation is given;
-
13.
: Measured integrated H i line flux, in Jy km s-1;
- 14.
-
15.
: Log of the total H i mass in units of , where = 2.356105D2, and is the galaxy’s distance (in Mpc);
-
16.
error: Error for log(/);
-
17.
Telescope: Telescope(s) used for observation: A = Arecibo, G = GBT, N = Nançay. The number of times a telescope is listed denotes the number of separate observations made with that telescope over the duration of our survey.
Listed in Table 4 are the following elements for all galaxies not detected by any telescope, in alphabetical order of their name.
-
1.
Name: The common name of the object;
-
2.
Sample: Which survey resulted in this detection. The options are: HyperLeda (HL), UGC (UGC) and both (HL/UGC);
- 3.
-
4.
Nançay: r.m.s. noise level across the observed spectra, in mJy, for all Nançay observations. For the HyperLeda sample, the search range is -250 to 10,600 km s-1. For the UGC sample a single value indicates a search was made only in the “lo” range, 325 to 11,825 km s-1, and a second value an additional search in the “hi”range, 6875 to 18,330 km s-1;
-
5.
GBT: r.m.s noise level across the observed spectra, in mJy, for all GBT observations, in the range 2000 to 25,600 km s-1;
-
6.
Arecibo low: r.m.s noise level across the observed spectra, in mJy, for all Arecibo observations in the low velocity range, -2000 to 19000 km s-1;
-
7.
Arecibo high: r.m.s noise level across the observed spectra, in mJy, for all Arecibo observations in the high velocity range, 19000 to 36000 km s-1.
4.3 Inter-telescope Comparisons
4.3.1 Telescope-Telescope Comparison
Of the 350 galaxies observed for this paper, the majority (255, or 72.9%) was observed with only one telescope. The remaining 95 galaxies, though, allow for a comparison of H i profiles detected with the different instruments. Included within these statistics are the 14 galaxies detected in both the UGC and HyperLeda surveys.
In all, then, the breakdown between the samples is:
-
•
63 galaxies observed by both the GBT and Nançay telescopes (8 were observed twice by the GBT) ;
-
•
20 galaxies observed by both the Arecibo and Nançay telescopes;
-
•
6 galaxies observed by both the Arecibo and GBT telescopes;
-
•
1 galaxy observed only at Nançay but separately for the UGC and HyperLeda samples;
-
•
5 galaxies observed by all three telescopes.
These inter-telescope comparisons are shown in Figure 4 for H i profile central velocities, velocity widths and integrated line fluxes. Overall, they are consistent.
Comparison between the central velocities measured by the different telescopes/surveys shows a spread of differences centered around 1 4 km s-1 for the 54 galaxies not contaminated by a nearby companion and observed by more than one telescope (indicated by filled dots in Figure 4). The comparisons between the individual telescope are consistent, with the Nançay and GBT telescopes having the smallest differences, but small number statistics makes drawing any conclusions difficult. The difference between telescopes and their standard error are: vNRT-vGBT = -1 8 km s-1; vGBT-vAO = 16 9 km s-1; vNRT-vAO = 18 4 km s-1; vNRT,UGC-vNRT,HL = -2 4 km s-1; and vGBT-vGBT = 0 3 km s-1.
The profile widths measured for non-contaminated detections are also similar. The measured values for the 54 uncontaminated galaxies averaged = -8 9 km s-1. Here the NRT and Arecibo values are the most similar. The difference between telescopes and their standard error are: - = -19 16 km s-1; - = 16 21 km s-1; - = -9 9 km s-1; - = 7 14 km s-1; and - = 2 15 km s-1.
The integrated H i line fluxes are comparable as well. Listed here are differences in measured flux values for the uncontaminated galaxies, given as a percentage of the galaxies’ flux. Here, the GBT values readily agree with those of Nançay, but Arecibo values do not agree as well with either telescope. The difference between telescopes and their standard error are: fNRT-fGBT = 0.01 0.08%; fGBT-fAO = 0.36 0.15%; fNRT-fAO = 0.22 0.07%; fNRT,UGC-fNRT,HL = 0.04 0.07; and fGBT-fGBT = 0.08 0.07%. Also in this case, the differences are small compared to the noise for small number statistics.
4.3.2 The Outliers
4.4 Comparisons with the Literature
4.4.1 Optical Velocity Comparison
Of the 350 galaxies observed, 177 have previously published spectral line velocities, with 135 having optical (spectroscopic) velocities in the literature. Of these 135, 124 were detected in our survey, and of these 101 are unlikely to be confused with any other object within the telescope beam.
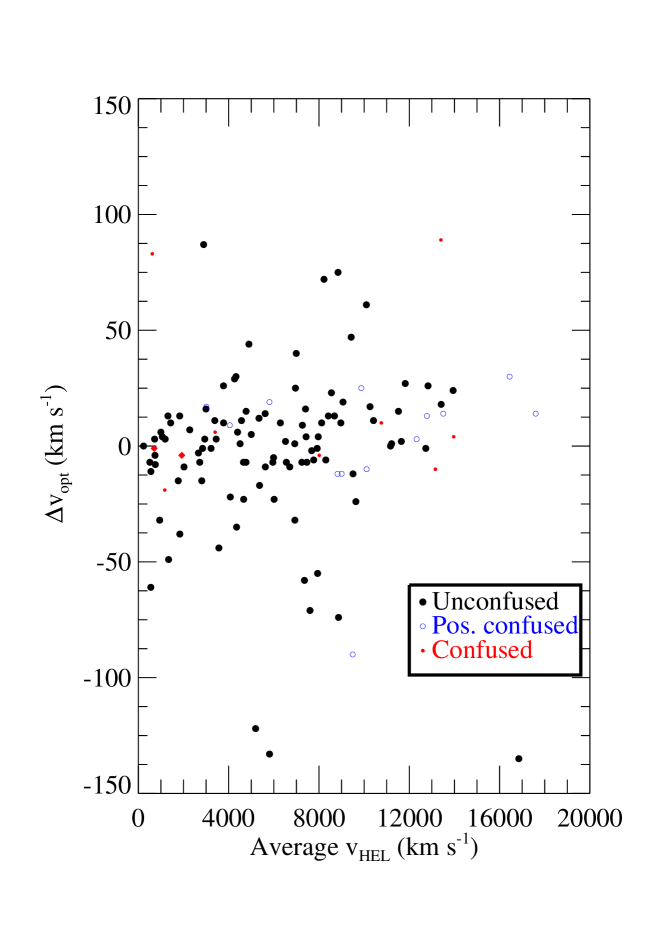
Figure 5 shows the difference between our central H i velocities (see Table 2) and the optical spectroscopic velocities (hereafter referred to as ”optical velocities”) found in the literature, as a function of . Almost all optical velocities are within 100 km s-1 of our H i measurements, with a median velocity difference of -2 2 km s-1. Those galaxies with velocity differences 100km s-1 are discussed in Table 6 and Appendix A.
The H i velocities of the three galaxies listed in Table 6 are all likely to be accurate and reliable values. None of their H i profiles are likely to be confused with H i from another galaxy within the beam. Two of the galaxies, UGC 263 and PGC 7225, have rather uncertain optical velocities, which are both only 1.5 different from our H i values, and the peak H i velocity of UGC 1145 was confirmed by two telescopes.
4.4.2 H I Literature Values
Published H i measurements are now available for 80 of our detected galaxies. Of these, 66 are of uncontaminated detections. A comparison between literature values and our measurements is shown in Figure 6 for , , and . On average the values match extremely well, with = -7 2, = 0 3, and = -0.4 0.1 Jy km s-1.
Only one galaxy, PGC 2815809, has significant differences between our measured H i values and those found in the literature, but this may be due to nearby H i source HIPASS J0756-26. Further observations are required to determine if PGC 2815809 and HIPASS J0756-26 are in fact the same object and, if so, where its center lies (see Appendix A for further details).
5 THE H I PROPERTIES OF THE SAMPLE
5.1 Sample Properties
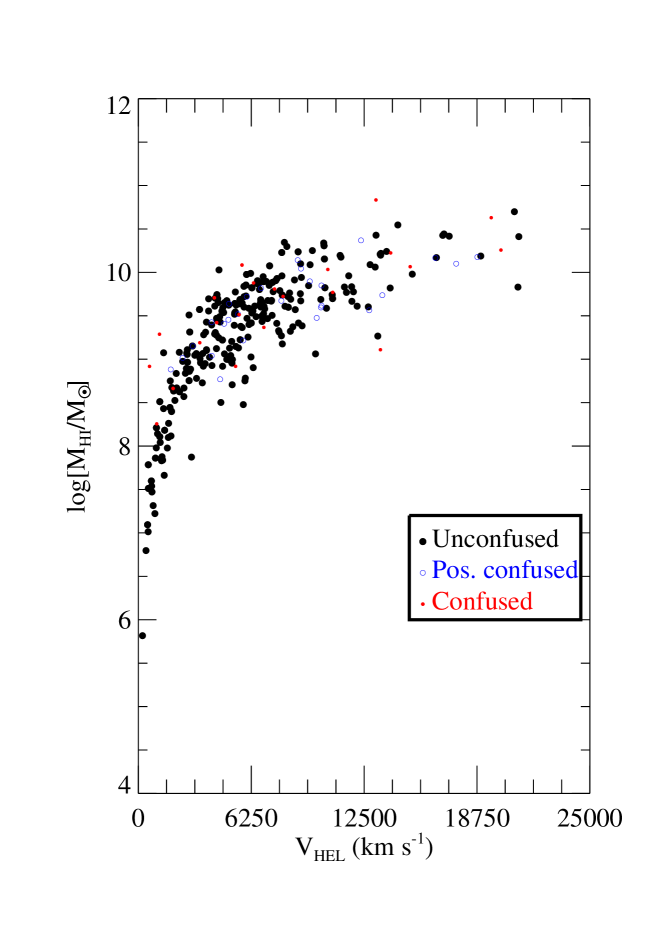
Figure 7 shows the total H i masses of our 295 detected galaxies as a function of radial velocity (). The plot shows the expected increase of with velocity, with most of the lower-mass detections at a given velocity obtained with the much larger Arecibo telescope.
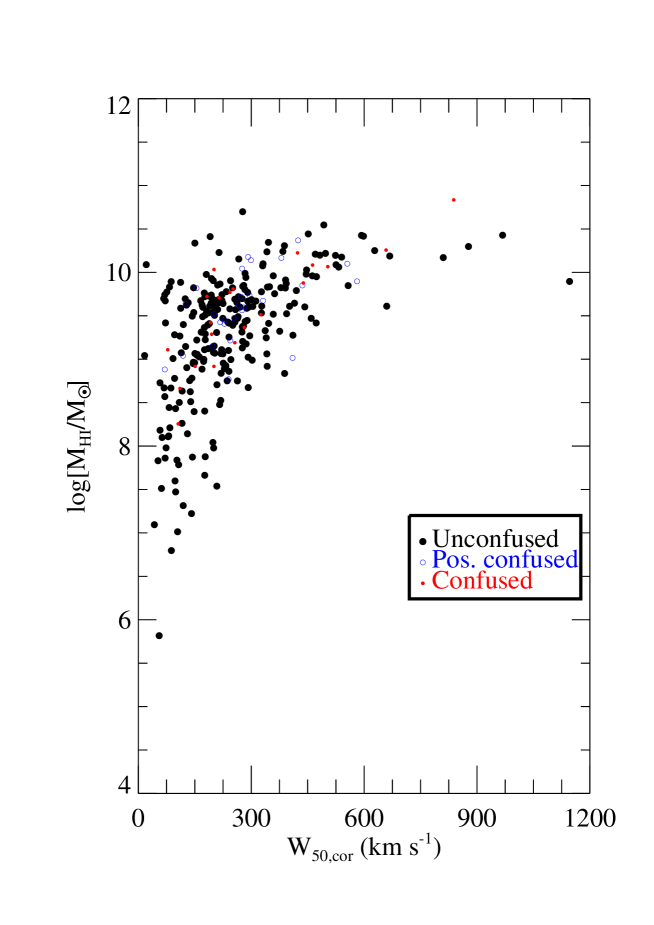
Plotted in Figure 8 is the total H i mass as a function of the inclination-corrected line width, a parameter indicative of the total galaxy mass, again showing the expected increase with and H i mass.
Looking at the data from this survey, there is no trend between average blue surface brightness and either H i mass, H i mass-to-luminosity ratio, blue luminosity , or total mass as indicated by (see Figures 9 and 10). That is, we do not see any trend toward galaxies becoming less (or more) massive, gas-rich or luminous as their surface brightness decreases. There is, however, a small trend for the upper limit to the ratio to increase as surface brightness decreases, which is consistent with the idea that the average LSB galaxy is more gas rich than its HSB counterpart, for a given luminosity.
5.2 Comparison with the HIPASS 1000 Brightest Galaxies Sample
It is an interesting idea to compare the H i mass distribution of the galaxies in this survey with those found in other H i surveys. It is difficult to find an identical sample however, as this survey has intentionally avoided selecting galaxies which are likely of low H i mass and catalogs such as Huang et al. (2014) and Lutz et al. (2017) do not contain enough galaxies for a meaningful statistical comparison. The best comparison sample is likely the HIPASS 1000 H i brightest galaxies sample (BGC) (Koribalski et al., 2004). Figure 11 shows a comparison of the cumulative distribution of the H i masses of the three galaxy samples (BGC, and our HyperLeda and UGC), and it is clear that the samples appear similar, but certainly not the same, in spite of attempting to choose a posteriori a closely matched galaxy sample. Confirming this, a two-sample Kolmogorov-Smirnov test on the probability for H i masses coming from the same distribution indicates a 46% 6% probability for the HyperLeda and BGC samples, and only a 15% 13% probability for the UGC and BGC samples.
Also in terms of the total galaxy mass indicator the distributions of the three samples show little similarity (Figure 11), like for their H i mass distributions. Here, the HIPASS bright galaxies distribution contains fewer lower total mass galaxies than either the HyperLeda or UGC sample. Again the two sample Kolmogorov-Smirnov test bear this out, giving only a 0% 19% chance the HyperLeda and BGC samples are from the same pool, and a 72% 8.4% chance for the UGC and BGC samples. Please note that , and not the inclination-corrected line width was used as the HIPASS bright galaxies catalog does not include inclination information.
The noted differences in total H i mass between the three samples are unsurprising, as the UGC and HyperLeda samples consist of galaxies that were not detected by previous H i surveys. That is, our samples are not unbiased and certainly do not consist of H i bright sources.
The differences in dynamical mass indicator between the three samples should also not be surprising: for a given H i mass a source with a smaller dynamic mass will tend to have a narrower H i line profile and thus a higher H i peak flux density, and will therefore be more likely to be included in the H i Bright Galaxy Catalog of the HIPASS blind H i line survey.
6 MASSIVE LSB GALAXIES?
The impetus behind this project was to look for massive low surface brightness galaxies and to study the properties of these systems. The obvious question, then is – how many massive LSB galaxies were detected in this search, and can any conclusions be drawn regarding this sample from our observations?
The initial question of how many massive LSB galaxies were found must be answered in two parts. First is the question of how many truly massive galaxies were found, and second is where or not these massive systems contain significant LSB disks.
Looking at the mass of the galaxies, in terms of their total H i gas mass we find that of the 253 uncontaminated galaxy detections in the survey, 189 (64.1%) have 109 , while 35 (11.9%) of these are massive in H i, with 1010 . We can also expand the definition of massive galaxy to include those with high dynamical masses, based on their inclination-corrected H i line velocity widths . We find that of the uncontaminated detections, 30 have 500 km s-1. Eliminating the overlapping galaxies in these two lists gives a total of 45 massive galaxies.
Determining the central surface brightness of these galaxies from literature data is not currently possible, but we can check . Of the 35 uncontaminated galaxies with 1010 , 31 also have 24 mag arcsec-2. Of the 30 uncontaminated galaxies with 400 km s-1, 30 have 24 mag arcsec-2. Finally, 20 galaxies have 1010 , 500 km s-1, and and 24 mag arcsec-2. All of these are clearly worthy of follow-up observations in the optical and radio to better understand their properties.
7 CONCLUSIONS
While the intent of this survey was to identify massive low surface brightness galaxies, it is very instructive to look at the overall mass distribution of the sample. The average H i mass of the (uncontaminated) sample is , and their average velocity width is 199 7 km s-1, reinforcing the fact that low surface brightness galaxies have the same mass distribution as their higher surface brightness counterparts and are not preferentially dwarf systems.
Of more interest will be follow-up H i radio synthesis and optical surface photometry observations of these galaxies. Mapelli et al. (2008) have shown that at least some of the massive LSB galaxies are formed through the interaction and merger of smaller galaxy systems. This sample will provide an excellent test case to determine if there is indeed a mass beyond which all LSB galaxies are formed through interactions and mergers or if, like their higher surface brightness counterparts, these systems follow a variety of paths to reach their current state.
References
- Abazajian et al. (2003) Abazajian, K., Adelman-McCarthy, J. K., Agüeros, M. A., et al. 2003, AJ, 126, 2081, doi: 10.1086/378165
- Abazajian et al. (2004) —. 2004, AJ, 128, 502, doi: 10.1086/421365
- Adelman-McCarthy et al. (2007) Adelman-McCarthy, J. K., Agüeros, M. A., Allam, S. S., et al. 2007, ApJS, 172, 634, doi: 10.1086/518864
- Ahn et al. (2012) Ahn, C. P., Alexandroff, R., Allende Prieto, C., et al. 2012, ApJS, 203, 21, doi: 10.1088/0067-0049/203/2/21
- Ahumada et al. (2020) Ahumada, R., Prieto, C. A., Almeida, A., et al. 2020, ApJS, 249, 3, doi: 10.3847/1538-4365/ab929e
- Alam et al. (2015) Alam, S., Albareti, F. D., Allende Prieto, C., et al. 2015, ApJS, 219, 12, doi: 10.1088/0067-0049/219/1/12
- Alatalo et al. (2016) Alatalo, K., Cales, S. L., Rich, J. A., et al. 2016, ApJS, 224, 38, doi: 10.3847/0067-0049/224/2/38
- Albareti et al. (2017) Albareti, F. D., Allende Prieto, C., Almeida, A., et al. 2017, ApJS, 233, 25, doi: 10.3847/1538-4365/aa8992
- Ann et al. (2015) Ann, H. B., Seo, M., & Ha, D. K. 2015, ApJS, 217, 27, doi: 10.1088/0067-0049/217/2/27
- Bell & Bower (2000) Bell, E. F., & Bower, R. G. 2000, MNRAS, 319, 235, doi: 10.1046/j.1365-8711.2000.03878.x
- Bellazzini et al. (2011a) Bellazzini, M., Perina, S., Galleti, S., & Oosterloo, T. 2011a, A&A, 533, A37, doi: 10.1051/0004-6361/201117275
- Bellazzini et al. (2011b) Bellazzini, M., Beccari, G., Oosterloo, T. A., et al. 2011b, A&A, 527, A58, doi: 10.1051/0004-6361/201016159
- Berlind et al. (2006) Berlind, A. A., Frieman, J., Weinberg, D. H., et al. 2006, ApJS, 167, 1, doi: 10.1086/508170
- Berrington et al. (2002) Berrington, R. C., Lugger, P. M., & Cohn, H. N. 2002, AJ, 123, 2261, doi: 10.1086/339840
- Bilicki et al. (2014) Bilicki, M., Jarrett, T. H., Peacock, J. A., Cluver, M. E., & Steward, L. 2014, ApJS, 210, 9, doi: 10.1088/0067-0049/210/1/9
- Bothun et al. (1985) Bothun, G. D., Beers, T. C., Mould, J. R., & Huchra, J. P. 1985, AJ, 90, 2487, doi: 10.1086/113951
- Bothun et al. (1987) Bothun, G. D., Impey, C. D., Malin, D. F., & Mould, J. R. 1987, AJ, 94, 23, doi: 10.1086/114443
- Bouchard et al. (2009) Bouchard, A., Da Costa, G. S., & Jerjen, H. 2009, AJ, 137, 3038, doi: 10.1088/0004-6256/137/2/3038
- Bouchard et al. (2005) Bouchard, A., Jerjen, H., Da Costa, G. S., & Ott, J. 2005, AJ, 130, 2058, doi: 10.1086/496977
- Bralts-Kelly et al. (2017) Bralts-Kelly, L., Bulatek, A. M., Chinski, S., et al. 2017, ApJ, 848, L10, doi: 10.3847/2041-8213/aa8ea0
- Braun et al. (2003) Braun, R., Thilker, D., & Walterbos, R. A. M. 2003, A&A, 406, 829, doi: 10.1051/0004-6361:20030761
- Bremnes et al. (1999) Bremnes, T., Binggeli, B., & Prugniel, P. 1999, A&AS, 137, 337, doi: 10.1051/aas:1999486
- Burkholder et al. (2001) Burkholder, V., Impey, C., & Sprayberry, D. 2001, AJ, 122, 2318, doi: 10.1086/323538
- Christlein & Zabludoff (2003) Christlein, D., & Zabludoff, A. I. 2003, ApJ, 591, 764, doi: 10.1086/375529
- Clauwens et al. (2018) Clauwens, B., Schaye, J., Franx, M., & Bower, R. G. 2018, MNRAS, 478, 3994, doi: 10.1093/mnras/sty1229
- Colless et al. (2001) Colless, M., Dalton, G., Maddox, S., et al. 2001, MNRAS, 328, 1039, doi: 10.1046/j.1365-8711.2001.04902.x
- Cool (2007) Cool, R. J. 2007, ApJS, 169, 21, doi: 10.1086/511179
- Courtois & Tully (2015) Courtois, H. M., & Tully, R. B. 2015, MNRAS, 447, 1531, doi: 10.1093/mnras/stu2405
- Courtois et al. (2009) Courtois, H. M., Tully, R. B., Fisher, J. R., et al. 2009, AJ, 138, 1938, doi: 10.1088/0004-6256/138/6/1938
- Dabringhausen & Fellhauer (2016) Dabringhausen, J., & Fellhauer, M. 2016, MNRAS, 460, 4492, doi: 10.1093/mnras/stw1248
- Doyle et al. (2005) Doyle, M. T., Drinkwater, M. J., Rohde, D. J., et al. 2005, MNRAS, 361, 34, doi: 10.1111/j.1365-2966.2005.09159.x
- Du et al. (2015) Du, W., Wu, H., Lam, M. I., et al. 2015, AJ, 149, 199, doi: 10.1088/0004-6256/149/6/199
- Escoffier & Webber (1998) Escoffier, R. P., & Webber, J. C. 1998, in Society of Photo-Optical Instrumentation Engineers (SPIE) Conference Series, Vol. 3357, Advanced Technology MMW, Radio, and Terahertz Telescopes, ed. T. G. Phillips, 424–431, doi: 10.1117/12.317375
- Falco et al. (1999) Falco, E. E., Kurtz, M. J., Geller, M. J., et al. 1999, PASP, 111, 438, doi: 10.1086/316343
- Focardi et al. (1986) Focardi, P., Marano, B., & Vettolani, G. 1986, A&A, 161, 217
- Galaz et al. (2011) Galaz, G., Herrera-Camus, R., Garcia-Lambas, D., & Padilla, N. 2011, ApJ, 728, 74, doi: 10.1088/0004-637X/728/2/74
- Gallagher & Bushouse (1983) Gallagher, J. S., & Bushouse, H. 1983, AJ, 88, 55, doi: 10.1086/113286
- Galloway et al. (2015) Galloway, M. A., Willett, K. W., Fortson, L. F., et al. 2015, MNRAS, 448, 3442, doi: 10.1093/mnras/stv235
- Garcia (1993) Garcia, A. M. 1993, A&AS, 100, 47
- Geha et al. (2017) Geha, M., Wechsler, R. H., Mao, Y.-Y., et al. 2017, ApJ, 847, 4, doi: 10.3847/1538-4357/aa8626
- Gourgoulhon et al. (1992) Gourgoulhon, E., Chamaraux, P., & Fouque, P. 1992, A&A, 255, 69
- Haynes et al. (1988) Haynes, M. P., Giovanelli, R., Starosta, B. M., & Magri, C. 1988, AJ, 95, 607, doi: 10.1086/114660
- Haynes et al. (2011) Haynes, M. P., Giovanelli, R., Martin, A. M., et al. 2011, AJ, 142, 170, doi: 10.1088/0004-6256/142/5/170
- Haynes et al. (2018) Haynes, M. P., Giovanelli, R., Kent, B. R., et al. 2018, ApJ, 861, 49, doi: 10.3847/1538-4357/aac956
- Hewitt et al. (1983) Hewitt, J. N., Haynes, M. P., & Giovanelli, R. 1983, AJ, 88, 272, doi: 10.1086/113317
- Hoffman et al. (1992) Hoffman, Y., Silk, J., & Wyse, R. F. G. 1992, ApJ, 388, L13, doi: 10.1086/186319
- Huang et al. (2014) Huang, S., Haynes, M. P., Giovanelli, R., et al. 2014, ApJ, 793, 40, doi: 10.1088/0004-637X/793/1/40
- Huchra et al. (1983) Huchra, J., Davis, M., Latham, D., & Tonry, J. 1983, ApJS, 52, 89, doi: 10.1086/190860
- Huchra et al. (1999) Huchra, J. P., Vogeley, M. S., & Geller, M. J. 1999, ApJS, 121, 287, doi: 10.1086/313194
- Huchra et al. (2012a) Huchra, J. P., Macri, L. M., Masters, K. L., et al. 2012a, ApJS, 199, 26, doi: 10.1088/0067-0049/199/2/26
- Huchra et al. (2012b) —. 2012b, ApJS, 199, 26, doi: 10.1088/0067-0049/199/2/26
- Huchtmeier (1997) Huchtmeier, W. K. 1997, A&A, 319, 401
- Huchtmeier et al. (2001a) Huchtmeier, W. K., Karachentsev, I. D., & Karachentseva, V. E. 2001a, A&A, 377, 801, doi: 10.1051/0004-6361:20011138
- Huchtmeier et al. (2001b) —. 2001b, A&A, 377, 801, doi: 10.1051/0004-6361:20011138
- Impey et al. (2001) Impey, C., Burkholder, V., & Sprayberry, D. 2001, AJ, 122, 2341, doi: 10.1086/323537
- Impey et al. (1996) Impey, C. D., Sprayberry, D., Irwin, M. J., & Bothun, G. D. 1996, ApJS, 105, 209, doi: 10.1086/192313
- Jerjen et al. (1998) Jerjen, H., Freeman, K. C., & Binggeli, B. 1998, AJ, 116, 2873, doi: 10.1086/300635
- Jones et al. (2005) Jones, D. H., Saunders, W., Read, M., & Colless, M. 2005, Publications of the Astronomical Society of Australia, 22, 277, doi: 10.1071/AS05018
- Jones et al. (2009a) Jones, D. H., Read, M. A., Saunders, W., et al. 2009a, MNRAS, 399, 683, doi: 10.1111/j.1365-2966.2009.15338.x
- Jones et al. (2009b) —. 2009b, MNRAS, 399, 683, doi: 10.1111/j.1365-2966.2009.15338.x
- Karachentsev & Karachentseva (1984) Karachentsev, I. D., & Karachentseva, V. E. 1984, Astrofizika, 21, 641
- Karachentsev et al. (2013) Karachentsev, I. D., Makarov, D. I., & Kaisina, E. I. 2013, AJ, 145, 101, doi: 10.1088/0004-6256/145/4/101
- Kazarian & Karapetian (2002) Kazarian, M. A., & Karapetian, E. L. 2002, Astrophysics, 45, 458, doi: 10.1023/A:1021855012813
- Knezek (1993) Knezek, P. M. 1993, PhD thesis, Massachusetts Univ., Amherst.
- Knezek et al. (1999) Knezek, P. M., Sembach, K. R., & Gallagher, John S., I. 1999, ApJ, 514, 119, doi: 10.1086/306921
- Kochanek et al. (2012) Kochanek, C. S., Eisenstein, D. J., Cool, R. J., et al. 2012, ApJS, 200, 8, doi: 10.1088/0067-0049/200/1/8
- Kopparapu et al. (2008) Kopparapu, R. K., Hanna, C., Kalogera, V., et al. 2008, ApJ, 675, 1459, doi: 10.1086/527348
- Koribalski et al. (2004) Koribalski, B. S., Staveley-Smith, L., Kilborn, V. A., et al. 2004, AJ, 128, 16, doi: 10.1086/421744
- Kormendy & Westpfahl (1989) Kormendy, J., & Westpfahl, D. J. 1989, ApJ, 338, 752, doi: 10.1086/167233
- Kourkchi & Tully (2017) Kourkchi, E., & Tully, R. B. 2017, ApJ, 843, 16, doi: 10.3847/1538-4357/aa76db
- Kozłowski et al. (2010) Kozłowski, S., Kochanek, C. S., Stern, D., et al. 2010, ApJ, 716, 530, doi: 10.1088/0004-637X/716/1/530
- Kruk et al. (2018) Kruk, S. J., Lintott, C. J., Bamford, S. P., et al. 2018, MNRAS, 473, 4731, doi: 10.1093/mnras/stx2605
- Kulier et al. (2020) Kulier, A., Galaz, G., Padilla, N. D., & Trayford, J. W. 2020, MNRAS, 496, 3996, doi: 10.1093/mnras/staa1798
- Lang et al. (2003) Lang, R. H., Boyce, P. J., Kilborn, V. A., et al. 2003, MNRAS, 342, 738, doi: 10.1046/j.1365-8711.2003.06535.x
- Lauberts & Valentijn (1989) Lauberts, A., & Valentijn, E. A. 1989, The surface photometry catalogue of the ESO-Uppsala galaxies (Garching: European Southern Observatory)
- Lelli et al. (2010) Lelli, F., Fraternali, F., & Sancisi, R. 2010, A&A, 516, A11, doi: 10.1051/0004-6361/200913808
- Lutz et al. (2017) Lutz, K. A., Kilborn, V. A., Catinella, B., et al. 2017, MNRAS, 467, 1083, doi: 10.1093/mnras/stx053
- Magri (1994) Magri, C. 1994, AJ, 108, 896, doi: 10.1086/117120
- Makarov et al. (2014) Makarov, D., Prugniel, P., Terekhova, N., Courtois, H., & Vauglin, I. 2014, A&A, 570, A13, doi: 10.1051/0004-6361/201423496
- Makarov et al. (2001) Makarov, D. I., Burenkov, A. N., & Tyurina, N. V. 2001, Astronomy Letters, 27, 213, doi: 10.1134/1.1358377
- Makarov et al. (2003) Makarov, D. I., Karachentsev, I. D., & Burenkov, A. N. 2003, A&A, 405, 951, doi: 10.1051/0004-6361:20030706
- Makarov et al. (1997) Makarov, D. I., Karachentsev, I. D., Tyurina, N. V., & Kaisin, S. S. 1997, Astronomy Letters, 23, 445
- Mapelli et al. (2008) Mapelli, M., Moore, B., Ripamonti, E., et al. 2008, MNRAS, 383, 1223, doi: 10.1111/j.1365-2966.2007.12650.x
- Martin et al. (2019) Martin, G., Kaviraj, S., Laigle, C., et al. 2019, MNRAS, 485, 796, doi: 10.1093/mnras/stz356
- Marzke et al. (1996) Marzke, R. O., Huchra, J. P., & Geller, M. J. 1996, AJ, 112, 1803, doi: 10.1086/118142
- Masters et al. (2014) Masters, K. L., Crook, A., Hong, T., et al. 2014, MNRAS, 443, 1044, doi: 10.1093/mnras/stu1225
- Matthews & Gallagher (1996) Matthews, L. D., & Gallagher, John S., I. 1996, AJ, 111, 1098, doi: 10.1086/117855
- Matthews & van Driel (2000) Matthews, L. D., & van Driel, W. 2000, A&AS, 143, 421
- Meyer et al. (2004) Meyer, M. J., Zwaan, M. A., Webster, R. L., et al. 2004, MNRAS, 350, 1195, doi: 10.1111/j.1365-2966.2004.07710.x
- Mishra et al. (2017) Mishra, A., Kantharia, N. G., Das, M., Omar, A., & Srivastava, D. C. 2017, MNRAS, 464, 2741, doi: 10.1093/mnras/stw2506
- Monnier Ragaigne et al. (2003a) Monnier Ragaigne, D., van Driel, W., O’Neil, K., et al. 2003a, A&A, 408, 67, doi: 10.1051/0004-6361:20030694
- Monnier Ragaigne et al. (2003b) Monnier Ragaigne, D., van Driel, W., Schneider, S. E., Balkowski, C., & Jarrett, T. H. 2003b, A&A, 408, 465, doi: 10.1051/0004-6361:20030714
- Monnier Ragaigne et al. (2003c) Monnier Ragaigne, D., van Driel, W., Schneider, S. E., Jarrett, T. H., & Balkowski, C. 2003c, A&A, 405, 99, doi: 10.1051/0004-6361:20030585
- Moretti et al. (2017) Moretti, A., Gullieuszik, M., Poggianti, B., et al. 2017, A&A, 599, A81, doi: 10.1051/0004-6361/201630030
- Ned Team (1992) Ned Team, T. 1992, Redshift obtained from Literature by the NED Team prior to November 1992, http://ned.ipac.caltech.edu/uri/NED::Refcode/1992NED11.R......1Nm
- Nilson (1973) Nilson, P. 1973, Uppsala general catalogue of galaxies (Uppsala Astron. Obs)
- Oegerle & Hill (2001) Oegerle, W. R., & Hill, J. M. 2001, AJ, 122, 2858, doi: 10.1086/323536
- O’Neil et al. (2004) O’Neil, K., Bothun, G., van Driel, W., & Monnier Ragaigne, D. 2004, A&A, 428, 823, doi: 10.1051/0004-6361:20047091
- O’Neil et al. (2000) O’Neil, K., Bothun, G. D., & Schombert, J. 2000, AJ, 119, 136, doi: 10.1086/301160
- O’Neil et al. (1997) O’Neil, K., Bothun, G. D., Schombert, J., Cornell, M. E., & Impey, C. D. 1997, AJ, 114, 2448, doi: 10.1086/118659
- O’Neil et al. (2007) O’Neil, K., Oey, M. S., & Bothun, G. 2007, AJ, 134, 547, doi: 10.1086/518831
- Pak et al. (2014) Pak, M., Rey, S.-C., Lisker, T., et al. 2014, MNRAS, 445, 630, doi: 10.1093/mnras/stu1722
- Paturel et al. (2000) Paturel, G., Petit, C., Garnier, R., & Prugniel, P. 2000, A&AS, 144, 475, doi: 10.1051/aas:2000345
- Paturel et al. (2003) Paturel, G., Theureau, G., Bottinelli, L., et al. 2003, A&A, 412, 57, doi: 10.1051/0004-6361:20031412
- Pickering et al. (1997) Pickering, T. E., Impey, C. D., van Gorkom, J. H., & Bothun, G. D. 1997, AJ, 114, 1858, doi: 10.1086/118611
- Prestage et al. (2015) Prestage, R. M., Bloss, M., Brandt, J., et al. 2015, in 2015 URSI-USNC Radio Science Meeting, 4, doi: 10.1109/USNC-URSI.2015.7303578
- Proctor et al. (2008) Proctor, R. N., Forbes, D. A., Brodie, J. P., & Strader, J. 2008, MNRAS, 385, 1709, doi: 10.1111/j.1365-2966.2008.12867.x
- Ramatsoku et al. (2016) Ramatsoku, M., Verheijen, M. A. W., Kraan-Korteweg, R. C., et al. 2016, MNRAS, 460, 923, doi: 10.1093/mnras/stw968
- Ramella et al. (1997) Ramella, M., Pisani, A., & Geller, M. J. 1997, AJ, 113, 483, doi: 10.1086/118270
- Rines et al. (2000) Rines, K., Geller, M. J., Diaferio, A., Mohr, J. J., & Wegner, G. A. 2000, AJ, 120, 2338, doi: 10.1086/316811
- Rines et al. (2003) Rines, K., Geller, M. J., Kurtz, M. J., & Diaferio, A. 2003, AJ, 126, 2152, doi: 10.1086/378599
- Rines et al. (2016) Rines, K. J., Geller, M. J., Diaferio, A., & Hwang, H. S. 2016, ApJ, 819, 63, doi: 10.3847/0004-637X/819/1/63
- Rosenberg & Schneider (2002) Rosenberg, J. L., & Schneider, S. E. 2002, ApJ, 567, 247, doi: 10.1086/338377
- Ryan-Weber et al. (2002) Ryan-Weber, E., Koribalski, B. S., Staveley-Smith, L., et al. 2002, AJ, 124, 1954, doi: 10.1086/342546
- Saburova et al. (2021) Saburova, A. S., Chilingarian, I. V., Kasparova, A. V., et al. 2021, MNRAS, 503, 830, doi: 10.1093/mnras/stab374
- Schneider et al. (1986) Schneider, S. E., Helou, G., Salpeter, E. E., & Terzian, Y. 1986, AJ, 92, 742, doi: 10.1086/114209
- Schneider et al. (1990a) Schneider, S. E., Thuan, T. X., Magri, C., & Wadiak, J. E. 1990a, ApJS, 72, 245, doi: 10.1086/191416
- Schneider et al. (1990b) —. 1990b, ApJS, 72, 245, doi: 10.1086/191416
- Schneider et al. (1992) Schneider, S. E., Thuan, T. X., Mangum, J. G., & Miller, J. 1992, ApJS, 81, 5, doi: 10.1086/191684
- Schombert (1998) Schombert, J. 1998, AJ, 116, 1650, doi: 10.1086/300558
- Simien & Prugniel (2002) Simien, F., & Prugniel, P. 2002, A&A, 384, 371, doi: 10.1051/0004-6361:20020071
- Sprayberry et al. (1995) Sprayberry, D., Impey, C. D., Bothun, G. D., & Irwin, M. J. 1995, AJ, 109, 558, doi: 10.1086/117300
- Springob et al. (2005) Springob, C. M., Haynes, M. P., Giovanelli, R., & Kent, B. R. 2005, ApJS, 160, 149, doi: 10.1086/431550
- Staveley-Smith et al. (2016) Staveley-Smith, L., Kraan-Korteweg, R. C., Schröder, A. C., et al. 2016, AJ, 151, 52, doi: 10.3847/0004-6256/151/3/52
- Stetson (1984) Stetson, P. B. 1984, PASP, 96, 128, doi: 10.1086/131311
- Strauss & Davis (1988) Strauss, M. A., & Davis, M. 1988, A Redshift Survey of IRAS Galaxies, Vol. 297 (Comets to Cosmology / Andrew Lawrence New York : Springer, 1988), 361, doi: 10.1007/BFb0118830
- Tempel et al. (2012) Tempel, E., Tago, E., & Liivamägi, L. J. 2012, A&A, 540, A106, doi: 10.1051/0004-6361/201118687
- Tempel et al. (2017) Tempel, E., Tuvikene, T., Kipper, R., & Libeskind, N. I. 2017, A&A, 602, A100, doi: 10.1051/0004-6361/201730499
- Theureau et al. (1998) Theureau, G., Bottinelli, L., Coudreau-Durand, N., et al. 1998, A&AS, 130, 333, doi: 10.1051/aas:1998416
- Theureau et al. (2005) Theureau, G., Coudreau, N., Hallet, N., et al. 2005, A&A, 430, 373, doi: 10.1051/0004-6361:20047152
- Tully & Fisher (1988) Tully, R. B., & Fisher, J. R. 1988, Catalog of Nearby Galaxies (Cambridge, UK: Cambridge University Press)
- Tully & Fouque (1985) Tully, R. B., & Fouque, P. 1985, ApJS, 58, 67, doi: 10.1086/191029
- van den Hoek et al. (2000) van den Hoek, L. B., de Blok, W. J. G., van der Hulst, J. M., & de Jong, T. 2000, A&A, 357, 397. https://arxiv.org/abs/astro-ph/0003224
- van Driel et al. (2000) van Driel, W., Arnaboldi, M., Combes, F., & Sparke, L. S. 2000, A&AS, 141, 385, doi: 10.1051/aas:2000321
- van Driel et al. (2016) van Driel, W., Butcher, Z., Schneider, S., et al. 2016, ArXiv e-prints. https://arxiv.org/abs/1607.02787
- Véron-Cetty et al. (2006) Véron-Cetty, M. P., Joly, M., Véron, P., et al. 2006, A&A, 451, 851, doi: 10.1051/0004-6361:20054237
- Wang et al. (2018) Wang, L.-L., Luo, A. L., Shen, S.-Y., et al. 2018, MNRAS, 474, 1873, doi: 10.1093/mnras/stx2798
- Warren et al. (2007) Warren, B. E., Jerjen, H., & Koribalski, B. S. 2007, AJ, 134, 1849, doi: 10.1086/521925
- Wegner et al. (1993) Wegner, G., Haynes, M. P., & Giovanelli, R. 1993, AJ, 105, 1251, doi: 10.1086/116507
- Wolfinger et al. (2013) Wolfinger, K., Kilborn, V. A., Koribalski, B. S., et al. 2013, MNRAS, 428, 1790, doi: 10.1093/mnras/sts160
- Yang et al. (2007) Yang, X., Mo, H. J., van den Bosch, F. C., et al. 2007, ApJ, 671, 153, doi: 10.1086/522027
- York et al. (2000) York, D. G., Adelman, J., Anderson, Jr., J. E., et al. 2000, AJ, 120, 1579, doi: 10.1086/301513
- Zabludoff & Mulchaey (1998) Zabludoff, A. I., & Mulchaey, J. S. 1998, ApJ, 496, 39, doi: 10.1086/305355
- Zavala et al. (2016) Zavala, J., Frenk, C. S., Bower, R., et al. 2016, MNRAS, 460, 4466, doi: 10.1093/mnras/stw1286
- Zwaan et al. (2004) Zwaan, M. A., Meyer, M. J., Webster, R. L., et al. 2004, MNRAS, 350, 1210, doi: 10.1111/j.1365-2966.2004.07782.x
Appendix A NOTES ON INDIVIDUAL GALAXIES
A.1 HyperLeda Galaxy Sample
A.1.1 CGMW 1-0409
This galaxy was not in the list of planned targets. It was however detected at the GBT in an OFF source (blank sky) spectrum used to calibrate another galaxy. Although our detection matches the Parkes’ HIPASS profile (Meyer et al., 2004) in (2805 km s-1) and (131 km s-1), our H i flux (8.60.2 Jy km s-1) is much lower than the HIPASS value of 16.1 Jy km s-1, indicating the source may be quite extended given the difference in the telescopes’ HPBW (GBT , Parkes although the Parkes positional accuracy is typically better than ; Zwaan et al. (2004)).
A.1.2 ESO 338-020
It is likely that some of the detected flux for ESO 338-020 is from the nearby galaxy 2MASX J19412558-3820561, whose optical velocity is only 12 km s-1 higher and is located away from our target, ESO 338-020, on the edge of the Nançay HPBW.
A.1.3 ESO 368-004
ESO 368-004 has no known galaxies within 15′ and 9,000 km s-1, yet the Nançay and GBT flux measurements for this galaxy differ by 1.6 Jy km s-1 (12%). Follow-up GBT observations confirmed the original GBT values. Yet, as all three spectra have high signal-to-noise, the average of the three results was reported in Table 2. Please note, too that the HIPASS detection of this object has even higher flux than our three measurements (Meyer et al., 2004): , , Jy km s-1.
A.1.4 ESO 377-045
Three marginal H i detections of ESO 377-045 with peak SNR values of 3.2 to 4.3 were reported by Matthews & Gallagher (1996) based on Green Bank 42m telescope observations with a 21′ HPBW, at 1323, 2057, and 3087 km s-1; the latter has = 167 km s-1 and = 2.5 Jy km s-1, similar to our detection with = 3125 km s-1, = 171 km s-1, and = 2.4 Jy km s-1.
A.1.5 ESO 398-011
Although the galaxy ESO 398-010 is only 12 km s-1 away from ESO 398-011. The galaxies’ E-W separation is 8′, or five times the E-W Nançay beam radius. It is therefore not likely that the measured spectrum contains some contribution from ESO 398-010.
A.1.6 ESO 463-005
The reported optical velocity for this galaxy (Jones et al., 2009a) is 303145 km s-1, significantly (5) different from the 28093 km s-1 H i measurement originally made with the Nançay telescope. Follow-up GBT observations, though, showed our Nançay spectrum to be likely contaminated by a nearby galaxy, NGC 6925, which was probably caught in the larger Nançay beam. The GBT observations give an H i velocity of 3014 km s-1, much closer to the (Jones et al., 2009a) result. Only the GBT results were used for the final values (Table 2).
A.1.7 ESO 482-024
It is highly likely that our Nançay H i spectrum is contaminated by the galaxy NGC 1403 which is 56 km s-1 and away from ESO 482-024, on the edge of the Nançay beam. NGC 1403 was detected at Parkes in HIPASS (Meyer et al., 2004).
A.1.8 ESO 491-002
A.1.9 ESO 491-003
As the original Nançay detection of this source had a nearby (in frequency) RFI source, follow-up observations were taken. Only the more recent GBT results are reported in Table 2.
A.1.10 ESO 492-001
The GBT profile has a 84 km s-1 (40%, or 6) larger line width than our Nançay profile, and a 22% (3.6) higher integrated flux. As there are no neighbors within either telescope beam, it is likely the higher signal-to-noise GBT measurements are more reliable than the Nançay values. Subsequent GBT observations agreed with the initial GBT values, and we therefore used only the GBT values used for Table 2.
A.1.11 ESO 501-029
It appears possible that nearby galaxy UGCA 212 has contaminated our GBT H i detection of our target, ESO 501-029. UGCA 212 is 28 km s-1 and (2.6 times the GBT beam radius) away from our target and its published Parkes (HPBW ) HIPASS profile (Meyer et al., 2004) shows = 1042 km s-1, = 63 km s-1, and = 29.4 Jy km s-1, or 7.5 times our flux measured towards ESO 501-029.
A.1.12 ESO 540-030
A weak H i detection of ESO 540-030 was reported by (Bouchard et al., 2005) in Parkes single-dish spectra and Australia Telescope Compact Array (ATCA) images at = 233 km s-1, with = 26 km s-1 and = 0.33 Jy km s-1. This low velocity is consistent with the distance of 3.2 Mpc estimated from Surface Brightness Fluctuations by Jerjen et al. (1998). Our Nançay data show a 7 mJy, SNR = 3.3 peak near the Parkes velocity, which is too weak for a confirmation. Follow-up observations with the GBT indicate no signal, with an r.m.s. of 1.8 mJy, compared to the 6.5 times higher 12mJy peak reported by (Bouchard et al., 2005). The GBT data confirm that the (Bouchard et al., 2005) detection was spurious. Similarly, we also consider the low signal-to-noise (SNR= 3.3) signal seen by Nançay at 8093 km s-1 to be spurious, as it was also not seen by the GBT.
A.1.13 IC 3852
There are no known galaxies within 15′ and 8,000 km s-1 of IC 3852, yet the difference between the fluxes measured at Arecibo and the two GBT measurements is large (2.7 and 3.2/3.4 Jy km s-1, respectively) as is the difference in velocity widths ( 203 and 205/222 km s-1, respectively). Published Arecibo data (Springob et al. 2005; Haynes et al. 2018) show = 4375 km s-1, = 198 km s-1 and = 3.75 Jy km s-1. With no clear reason for the differences, the average of our observations are listed in Table 2.
A.1.14 PGC 2582
The velocity of our GBT detection for PGC 2582 at 15,050 km s-1 does not match those of the two galaxies within the telescope beam with measured optical velocities, 2MASXJ00430067-0913463 at 29,310 km s-1 (Christlein & Zabludoff, 2003) and WISEA J004314.24-091247.0 at 22,892 km s-1 (Moretti et al., 2017). It is likely our detection of H i is actually from the Abell 85 cluster in the region which has a mean velocity of 16,500 km s-1 and a velocity dispersion of 1100 km s-1 (Oegerle & Hill, 2001). Unfortunately, radio frequency interference prevented the GBT observations from reliably detecting any H i at or near the optical velocities measured for the two galaxies within the telescope beam.
A.1.15 PGC 3843
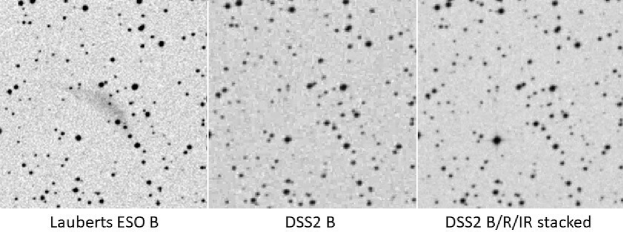
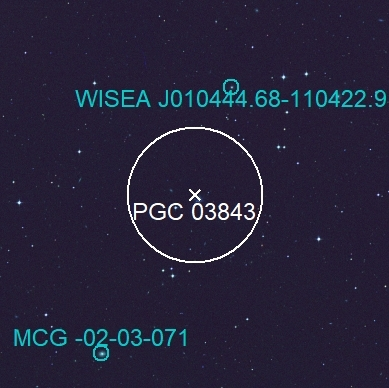
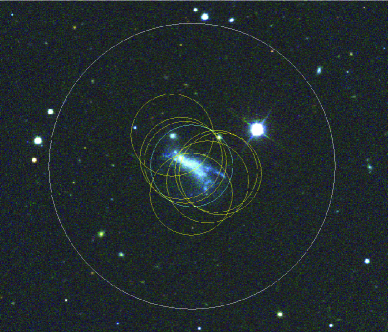
The H i profile measured at the GBT for PGC 3843 is quite broad ( = 403 km s-1). No previous redshift has been reported for PGC 3843, and there are no other galaxies within the GBT beam with velocities within 500 km s-1 of 14,367 km s-1, the central velocity of PGC 3843’s H i detection. However, two galaxies, WISEA J010444.68-110422.9 and MCG -02-03-071, lie on either side of PGC 3843, 7′ and 12′ away, respectively, and at 14,243 and 14,084 km s-1 (Figure 13). It is possible that PGC 3483 has had a recent encounter with (one of) its neighbors, resulting in its disturbed optical morphology and its exceptionally large H i line width. Follow-up observations will be required to determine if this is the case.
A.1.16 PGC 7225
Zabludoff & Mulchaey (1998) gives an optical velocity of 507180 km s-1, which is 123 km s-1 lower than that found by us in H i, but its high uncertainty, combined with our independent detections at Nançay and GBT, makes it likely our measurement is a more accurate value for the average velocity of the galaxy.
A.1.17 PGC 16370
Using the Westerbork Synthesis Radio Telescope (WRST), Ramatsoku et al. (2016) also measured PGC 16370’s H i properties. Their results for and match those we found, but their integrated flux value is only 60% of that found by our original low signal-to-noise Nançay detection. However, our much higher signal-to-noise GBT follow-up observations confirm the WRST data and are consequently listed in Table 2.
A.1.18 PGC 17124
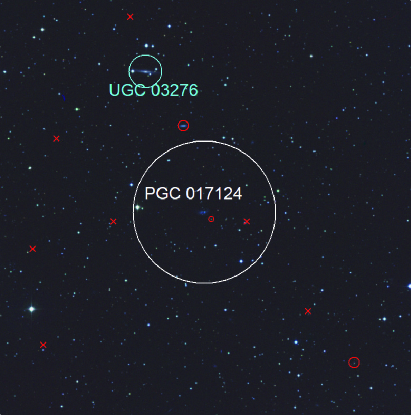
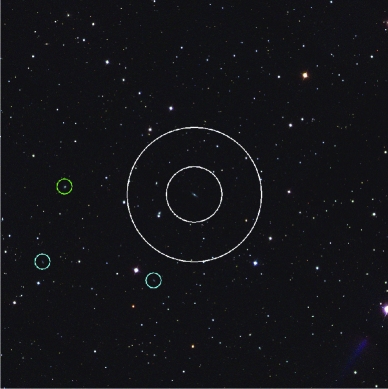
A potential source of confusion is the galaxy UGC 3276, which lies from PGC 17124, i.e. inside the NRT HPBW but outside the GBT beam (see Figure 14). Therefore, our GBT profile of PGC 17124 is unlikely to be contaminated by its neighbor and we used its line parameters in Table 2. Measurements centered on UGC 3276 with the National Radio Astronomy Observatory’s 300-ft telescope Springob et al. (2005) and Jodrell Bank’s 76m Lovell telescope Lang et al. (2003) give H i profile parameters consistent with our observations: = 2490 km s-1, = 270 km s-1 and = 15.3 Jy km s-1. The beam radii of the two telescopes are more than two times smaller than the separation between the two galaxies, so it is unlikely that these profiles are contaminated by our target galaxy, PGC 17124. As can also be seen in Figure 14, the morphology of PGC 17124 is clearly disturbed. It is quite possible, then, that UGC 3276 and PGC 17124 have had at least one encounter in the recent past.
A.1.19 PGC 21133
There is a 90 km s-1 difference between our Nançay and GBT line width, but the values are comparable. However, this difference is not really significant given the estimated uncertainty in the value of the lower signal-to-noise Nançay data. Both observations are averaged in Table 2.
A.1.20 PGC 21529
At from PGC 21529 ( = 40592 km s-1) lies KUG 0737+323 with a 138 km s-1 lower of 39213 km s-1 (Alam et al., 2015) Both our Nançay and GBT spectra likely include both PGC 21529 and KUG 0737+323, whereas due to its smaller beam size the Arecibo data appear to be unaffected by KUG 0737+323. As a result, only the Arecibo result is listed in Table 2.
A.1.21 PGC 21907
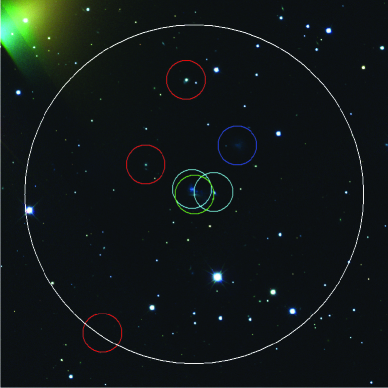
The intended target of this survey was PGC 21907. However observations taken after our survey, including optical velocity measurements, have shown it to be two distinct galaxies - KUG 0746+398A (the foreground LSB galaxy) and KUG 0746+398B (a.k.a. PGC 21907 - a background spiral galaxy). Including these two objects, there are a total of eight galaxies with known redshifts within the GBT beam when it was pointed toward PGC 21907, all of which have published redshifts (Table 7 & Figure 15). Four of these have redshifts within the frequency range of our GBT observations, whereas the others lie far outside it. Of these four, our GBT observations detected H i gas at the redshift of SDSS J074933.51+394424.3 only. A possible detection was seen at 12,420 km s-1 (KUG 0746+398A), but there were significant baseline issues, making an the detection uncertain. No H i emission was detected at the velocities of KUG 0746+398A, KUG 0746+398B (a.k.a. PGC 21907), or SDSS J074939.55+394316.7.
A.1.22 PGC 23328
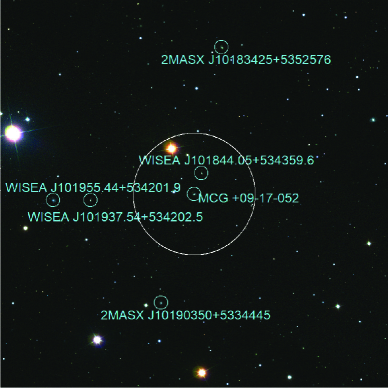
PGC 23328 is listed as member of a small group of galaxies by both Tempel et al. (2017) and Tempel et al. (2012) (Table 8). This group includes, at minimum, PGC 23328, WISEA J081923.48+252621.4, and WISEA J081955.30+252733.0, but it is likely that KUG 0816+256B is also part of this group. However, as none of the galaxies in this group were included in the telescope beams, it is likely the measured H i flux belongs only to PGC 23328 (Figure 16).
A.1.23 PGC 23879
PGC 23879 has one companion, LEDA 3097429 which lies but only 27 km s-1 away. There are two additional galaxies, ASK 151063.0 and ASK 151084.0, which lie /1675 km s-1 and 6/1721 km s-1 away, respectively. As the H i spectrum of PGC 23879 was taken with the GBT, which has a beam size of at the frequencies of interest, it is possible that it contains some H i gas from LEDA 3097429. It is highly unlikely that gas was detected from the other galaxy pair, but it is worth noting them nonetheless, as the four galaxies could form a loose group.
A.1.24 PGC 26708
This galaxy is part of the PGC 26708/NGC 2883 pair of galaxies, making it difficult to know which fraction of the measured H i flux can be attributed to our target, PGC 26708.
A.1.25 PGC 26936
The galaxy SDSS J092844.48+351641.3 is and 48 km s-1 away from our target, PGC 26936. As the larger Nançay beam does not show either a larger or line flux than we observed at Arecibo, it is highly unlikely that our spectra of our target are contaminated.
A.1.26 PGC 27485
We observed PGC 27485 at Nançay, Arecibo, and the GBT. Comparing the measured H i profiles it appears that the smaller Arecibo beam did not observe all of the extended H i of this N-S oriented galaxy (the line flux measured at Arecibo is 29% lower than at Nançay; ; ; Jy km s-1). However without a full map of the galaxy’s gas distribution we cannot know this for certain and listed the average of both values in Table 2.
A.1.27 PGC 27849
Although its values found with the three telescopes are highly consistent, the values measured for , , and the H i flux vary significantly. The GBT values are the largest, with log(/) = 9.88 and 10.05 (= 393/332 and = 357 & 312) while the Arecibo and Nançay observations are similar, with log(/) = 9.60 and 9.73 (= 247 & 236 and = 221 & 197), respectively. There are, however, no known galaxies within 14′ and 2,000 km s-1 from our target PGC 27849, nor are there any clear, unidentified neighbors. It is therefore unclear what the origins are of the additional flux measured by the GBT.
A.1.28 PGC 28799
The GBT data show a clear detection of H i emission at 4526 km s-1 with a second (marginal) detection at 6130 km s-1. These velocities do not, however, match the 7313 km s-1 found for the H i source HIPASS J0958-38 (Meyer et al., 2004; Doyle et al., 2005). Another galaxy, WISEA J095813.16-380926.6, lies from our target PGC 28799 and has an optical velocity of 723445 km s-1 (Jones et al., 2009b) Neither of these redshifts match those found in our survey, and no H i emission was found at either of these velocities.
A.1.29 PGC 29681
It is possible, though not likely, that our Nançay spectrum of our target PGC 29681 is contaminated by two nearby galaxies, UGC 5485 and SDSS J101131.31+650524.7, which are within and 58 km s-1 (SDSS optical velocities) from our target. Of the three, UGC 5485 is far the brightest, by about 2 magnitudes in . It was observed in H i at Effelsberg and Nançay (Huchtmeier, 1997; van Driel et al., 2000), and its separation from our target is, respectively, 1.3 and 3.5 times the beam radius for the Effelsberg and Nançay telescopes. The Nançay profiles of our target and UGC 5485 are therefore not likely to be contaminated by each other. The Effelsberg and NRT profiles of UGC 5485 are similar in , 5987 km s-1, and , 15 Jy km s-1 (i.e., almost 4 times of that of our target), but the Nançay of 331 km s-1 is 65 km s-1 broader.
A.1.30 PGC 30113
It is highly likely that our measured H i flux for PGC 30113 is contaminated by other galaxies. It is part of a small group of galaxies within approximately 14′ and 2500 km s-1 from each other (Figure 17 and Table 9). Likely due to its group membership, past observations have found a large range of redshifts for PGC 30113, from 10,983 km s-1 (Kruk et al., 2018) to 21,203 km s-1 (Bilicki et al., 2014), but the majority of observations give 13,4017 km s-1 (Ann et al., 2015; Abazajian et al., 2004; Galloway et al., 2015; Bilicki et al., 2014), consistent with our GBT value of 13,402 km s-1.
A.1.31 PGC 32862
A.1.32 PGC 34377
The galaxy 2MASX J11164683+3039330 is 8′ (or 4.5 Arecibo beam radii) and 287 km s-1 from our target, PGC 34377. It is possible, but unlikely, that our measured Arecibo H i profile for our target is contaminated by the galaxy.
A.1.33 PGC 36715
There are three galaxies within (2.2 times the Arecibo beam size) and 46 km s-1 from our target, PGC 36715: 2MASX J11462026+3543181, KUG 1143+360B, and 2MASX J11463995+3546070). It is likely that all three have contaminated our measured Arecibo H i profile.
A.1.34 PGC 38333
Lying within the Coma supercluster, PGC 38333 is part of a large group of galaxies, which includes a nearby companion galaxy, KUG 1203+206A, as well as NGC 4090 and a score of other galaxies, all within 15′ and 1,000 km s-1 of PGC 38333. Only our Arecibo result is listed in Table 2 since, due to the smaller beam size, it is likely less contaminated by the other sources than our Nançay profile, although it is doubtful that it measured only the H i gas in our target.
A.1.35 PGC 38698
PGC 38698’s morphology indicates it has recently undergone a significant interaction, most likely with its nearby companion I Zw 031, at = 6998 km s-1 (Figure 19), as all other nearby galaxies have velocities 5,000 km s-1 away from I Zw 031 and PGC 38698. However, as the Nançay and GBT H i profile parameters are very similar, it is likely that all the detected H i emission is associated with our target, but it is also likely to be greatly disturbed due to a recent interaction.
A.1.36 PGC 38958
The Arecibo ALFALFA survey reported a velocity of 5909 km s-1 (Haynes et al., 2018) for PGC 38958, significantly different from the 8185 km s-1 we found at Arecibo. To further explore this discrepancy, we made very deep GBT observations of PGC 38958 but did not detect a source at 5909 km s-1, with an r.m.s. of 0.62 mJy, well below the 8 mJy (3.5) H i peaks found by ALFALFA. It is therefore highly likely the ALFALFA detection is spurious. There is no other galaxy with a known redshift within 4,000 km s-1 and two beam-widths of our GBT detection.
A.1.37 PGC 39701
There is a large group of galaxies, including IC 3157, which lie - (1.1-2.0 times the GBT beam radius) away from PGC 39701, but their velocities (17,511-17,921 km s-1) are 850-1250 km s-1 lower than that of PGC 39701, at = 18,768 km s-1. It is possible, but unlikely, that our GBT detection is contaminated by that galaxy group.
A.1.38 PGC 43880
PGC 43880 is part of a group of at least four galaxies at similar velocities. One of these, SDSS J125405.61+481534.9, could in fact be considered part of our target galaxy PGC 43880 and it is surprising the SDSS survey identified is separately. The other two galaxies, WISEA J125341.21+481813.1 and WISEA J125257.97+481417.6, lie outside the GBT beam but still could be contaminating the H i profile (Figure 20). Nonetheless it is likely the measured H i emission is primarily from our target.
A.1.39 PGC 51872
PGC 51872 appears to be part of a loose group of galaxies (Figure 21 and Table 11). Although the various databases show a few objects within 1,000 km s-1 from our measured velocity and within the Arecibo beam, most of these appear to be parts of our target galaxy PGC 51872, which appears to be undergoing a significant disruptive event, rather than separate galaxies.
A.1.40 PGC 56738
The galaxy UGC 10138 is 230 km s-1 and from our target, PGC 56738. Both were observed at Arecibo (see also Springob et al. 2005), and their separation is 5 times the telescope beam radius. UGC 10138 has = 9645 km s-1, = 685 km s-1, and = 1.1 Jy km s-1. It is unlikely it has contaminated our measured Arecibo H i flux of our target. However, UGC 10138 lies within the Nançay telescope beam and our spectrum of PGC 56738 does appear contamination by it. Therefore, only the Arecibo result is listed in Table 2.
A.1.41 PGC 60396
We detected an H i profile centered at 7,915 km s-1 when pointing at PGC 60396 with the GBT. The galaxy has no published redshift and no known companions within and 8,000 km s-1 around our GBT velocity, yet our H i profile shows a clear asymmetry. There is, though, a nearby companion, PGC 60394, which lies only away but which has an unknown velocity. It is highly likely that we have detected both objects - PGC 60396 at 7,915 km s-1 and PGC 60394 near 7,800 km s-1.
A.1.42 PGC 65750
PGC 65750 has two neighbors, LEDA 888740, and 142 km s-1 away, and LEDA 3320352, and 1,172 km s-1 away. It is highly unlikely that either of these objects are contributing to the H i we detected at the GBT when pointing towards PGC 67570. As a result, while the optical morphology and lopsided H i profile of PGC 67570 indicate a disturbed morphology, our gas detection appears to be wholly a part of the intended target, PGC 65750.
A.1.43 PGC 74070
The galaxy NGC 798 is and 351 km s-1 away from our target, PGC 74070. It is possible that our Nançay data are slightly contaminated by NGC 798’s gas, as its distance from our target is 2.5 times the Nançay beam radius, and as the smaller Arecibo beam detected a somewhat smaller flux. If that is not the case, then the H i distribution of PGC 74070 must extend beyond the Arecibo beam. Both the Nançay and Arecibo observations are included in Table 2
A.1.44 PGC 77473
A.1.45 PGC 82395
The galaxy 2MASX J09262444+3304090 is (2.6 times the Arecibo beam radius) and 67 km s-1 from our target, PGC 82395. It is possible, but not likely, that it contaminates our Arecibo H i profile of our target.
A.1.46 PGC 82550
As the Arecibo observations of PGC 82550 have RFI at their edge, only the Nançay observations were used for our results in Table 2.
A.1.47 PGC 85851
The galaxies SDSS J235205.07+144047.2 and KUG 2349+134A are within (2.2 times the Arecibo beam radius), and 28 km s-1 from the measured H i velocity of our target, PGC 85851. It is highly likely that the H i flux we measured at Arecibo has been contaminated by these two other galaxies.
A.1.48 PGC 86863
Only the significantly higher signal-to-noise Arecibo observations were used for line profile parameter measurements in Table 2.
A.1.49 PGC 86903
PGC 86903 lies within a large group of galaxies. However, none of the other galaxies lie within a 5′ distance. It is therefore unlikely that the H i flux we measured is contaminated by another source.
A.1.50 PGC 89535
2MASS (Bilicki et al., 2014) lists a photometric redshift of 11,9004500 km s-1 for our target PGC 89535, which is consistent with our H i value of 13,387 km s-1. Otherwise, o ur target has no known neighbors both within the GBT beam and within 1,000 km s-1of its H i velocity. It is likely this is an isolated LSB galaxy.
A.1.51 PGC 89614
Our detection listed as PGC 89614 is more likely of KUG 1228+248, a galaxy only from it and with an optical velocity of 20,099 km s-1 (Albareti et al., 2017), only 14 km s-1 from the velocity we found at Arecibo.
A.1.52 PGC 91198
The galaxy SDSS J122526.1+360102.5 is (4.5 times the Arecibo beam radius) and 200 km s-1 away from our target, PGC 91198. It is therefore unlikely that it is significantly contaminating our Arecibo H i profile of PGC 91198.
A.1.53 PGC 91549
The galaxy SDSS J164503.80+304802.1 is (4.4 times the Arecibo beam radius) and 59 km s-1 from our target, PGC 91549. It is therefore highly unlikely that it is contributing an appreciable amount of flux to our Arecibo H i profile of our target.
A.1.54 PGC 95598
A.1.55 PGC 135624
Three galaxies (NGC 391, 2MASX J01072342+0053341, and 2MASX J01073154+0053232) are all within and 180 km s-1 of our target PGC 135624, and within the Nançay beam. All three are likely to have added to the H i flux of our target we measured at Nançay, although we note that our profile is rather narrow ( = 95 km s-1).
A.1.56 PGC 135894
Our target PGC 135894 is in a group of at least four galaxies, three of which lie within and 1,000 km s-1 of it – WISEA J233406.20+001311.8, DEEP2 33029695, and DEEP2 33029720. Furthermore, the H i flux we measured at Nançay is 40% (1.5) higher than at Arecibo, while the GBT flux lies between the two. It is therefore highly likely our H i measurements of PGC 135894 are contaminated by its companions. Please note that the Nançay spectrum is not shown in Figure 1.
A.1.57 PGC 166523
There are two galaxies, WISEA J175425.16-020235.5 and WISEA J175423.40-020032.4, which lie within 3′ and 1,000 km s-1 of our target, PGC 166523. It is highly likely that the H i profile we measured at Nançay is contaminated by these two other galaxies.
A.1.58 PGC 2815809
The galaxy HIPASS J0756-26 is and 36 km s-1 from our target, PGC 2815809. As HIPASS J0756-26 is an H i detected galaxy only, with no optical counterpart (Doyle et al., 2005) it is likely that HIPASS J0756-26 and PGC 2815809 are the same source. However some observed H i properties of both sources differ significantly, as measured at Parkes by Meyer et al. (2004) and at Nançay and the GBT for this paper, with the HIPASS results having a 50% larger and 2 higher flux than measured by us (PGC 2815809: = 6645 km s-1, = 127km s-1, = 7.5; HIPASS J0756-26: = 6681 km s-1, = 166 km s-1, = 1.7 ). Follow-up observations to determine the true H i properties of this galaxy are needed - to determine if PGC 2815809 and HIPASS J0756-26 are in fact the same source and, if so, where its center lies.
Please note that an Effelsberg H i detection was reported at a much lower velocity of 241 km s-1 by (Huchtmeier et al., 2001a), with = 26 km s-1, and = 0.7 Jy km s-1. Our Nançay and GBT data show no sign of this profile, however, which should have been detected at the SNR = 10 level, if real. We therefore conclude the Effelsberg signal is due to Galactic H i. The Effelsberg velocity search range ends at 4000 km s-1, which excludes the profile we detected.
A.1.59 UGC 605
UGC 605 is among our most distant detections, at 19,53621 km s-1, which matches the optical value of 19,602 km s-1 reported by Wang et al. (2018). The H i velocity width and gas mass we measure towards UGC 605 are both well beyond what would be expected for an individual galaxy. The mean velocities of our Arecibo and GBT profiles are the same within the uncertainties, but the Arecibo linewidths and integrated line flux are significantly smaller than those measured with the GBT: = 723 and 916 km s-1, and = 2.3 and 7.5 Jy km s-1, respectively. Within the GBT and Arecibo beams there is another galaxy (MCG +04-03-027) which lies only away, at a photometric redshift of 26,490 km s-1 (Bilicki et al., 2014). As this is not a precise spectroscopic velocity, it is possible that gas from this object is also contained within the our H i spectra. However, a more likely scenario is that UGC 605 is part of a loose group of interacting galaxies, which includes at least MCG +04-03-027, and two other, previously unidentified LSB galaxies shown in Figure 23 (OVS 005846.3+222221 & OVS 005813.0+221827), and possibly even the more distant galaxies WISEA J005908.02+222556.6 (23,919 km s-1; distance to UGC 605 ), WISEA J005852.84+22005557.4 (17,691 km s-1; at ), and WISEA J005908.02+222556.6 (23,919 km s-1; at ) (Bilicki et al., 2014). This would also explain the notable difference in line widths and H i flux found between the GBT and Arecibo observations. As the Arecibo beam is the smallest, only its values are used in Table 2.
A.1.60 UGC 1127
We first observed UGC 1127 as part of the the UGC sample and did not detect it, to an r.m.s. of 2.7 km s-1. Deeper follow-up observations with the GBT found a clear line signal at 20,820 km s-1.
A.1.61 UGC 1145
Our original Nançay detection showed an H i velocity at 578413 km s-1, 108 km s-1 higher than the optical value of 567610 km s-1 (Huchra et al., 2012a). The Nançay detection shows a single, narrow peak around 5690 km s-1, somewhat off-center amidst an about 290 km s-1 wide, weaker plateau. The velocity of the peak corresponds well to the optical value. As the noise level of the Nançay detection was quite high, significantly more sensitive GBT observations were taken at a later date. The GBT data confirmed the narrow peak, albeit at a lower peak value, which lies at the optical velocity, but did not confirm the wide plateau. As a result, only the GBT data were used in Table 2, although both results are shown in Figure 1 and Table 3.
A.1.62 UGC 1216
UGC 1216 was detected twice at Nançay, in the velocity overlap region between our searches at low and high velocities. The difference in center velocity is 23 km s-1, or almost 4. The line widths and line fluxes are the same within the uncertainties. The two results are listed separately in Table 3.
A.1.63 UGC 1851
UGC 1851 was observed a total of four times – once (using Nançay) for the UGC survey (and not detected), once at Nançay for the HyperLeda sample, and then twice with the GBT. The second set of GBT observations was made due to discrepancies between the earlier Nançay detection and GBT observations. As the new GBT values lie in between the Nançay detection and previous GBT values, the thee individual detections were averaged for Table 2.
A.1.64 UGC 1927
UGC 1927 was part of the UGC sample but not detected at Nançay. Follow-up observations with the GBT detected the object at 6280 km s-1.
A.1.65 UGC 2036
Our Nançay detection ( = 5021 km s-1, = 135 km s-1, = 3.6 Jy km s-1) may be confused by CGCG 539-044, a highly inclined = 15.2 galaxy s away from UGC 2036, with an optical velocity of 492033 km s-1 (Huchra et al., 1999).
A.1.66 UGC 2068
Our Nançay detection is contaminated by other galaxies within the telescope beam. UGC 2068 was detected previously in H i at Nançay by Theureau et al. (1998) at = 5740 km s-1; it has no other published redshift. Our H i profile ( = 5628 km s-1, = 586 km s-1, = 7.7 Jy km s-1) is very wide and has a complex structure, due to the presence of other galaxies in the beam, notably NGC 980 and NGC 982. NGC 980 is a = 14.2 mag S0 galaxy at = 579642 km s-1, N of our target UGC 2068, and NGC 982 is a = 13.2 mag Sa galaxy at = 584558 km s-1, s from our target. The H i profiles of NGC 980 and NGC 982 measured with the Arecibo beam by Magri (1994) and Haynes et al. (1988) show = 57579 km s-1, = 702 km s-1 and = 8.1 Jy km s-1, and = 573711 km s-1, = 568 km s-1 and = 6.9 Jy km s-1, respectively. As the separation between the centers of NGC 980 and 982 is , all measured H i profiles are bound to be confused and therefore no conclusion can be drawn on the H i profile parameters of UGC 2068.
A.1.67 UGC 2113
UGC 2113 was part of the UGC sample but not detected at Nançay. Follow-up observations with the GBT detected the object at 12,831 km s-1.
A.1.68 UGC 2139
UGC 2139 was part of the UGC sample but not detected at Nançay. Follow-up observations with the GBT detected the object at 5113 km s-1.
A.1.69 UGC 2235
UGC 2235 was detected at Nançay in both surveys. Both sets of H i profile parameters are consistent within the uncertainties, but it is highly likely that (most of) the H i flux we detected towards UGC 2235 at 5583 km s-1 is associated with UGC 2234, which lies just within the Nançay HPBW. UGC 2235 has no optical velocity, whereas that of UGC 2234 is 556225 km s-1 (Huchra et al., 1999). A Nançay profile measured towards UGC 2234 by Theureau et al. (1998) shows = 5606 km s-1, = 267 km s-1, and = 3.5 Jy km s-1. Follow-up observations with the GBT clearly detected UGC 2234 but not UGC 2235, to the 1.01 mJy r.m.s. level.
A.1.70 UGC 2301 & UGC 2305
Pointing towards UGC 2301, at Nançay we detected two galaxy H i profiles, centered at 1746 km s-1 and 5414 km s-1, respectively. We assume the former to be of our target UGC 2301 and the latter of nearby UGC 2305, a = 16.1 SBc spiral south of our target. Taking into account the beam attenuation, our profile parameters of UGC 2305 ( = 5414 km s-1, = 188 km s-1, and = 3.0 Jy km s-1) match the mean of those measured at Nançay by Theureau et al. (1998) and at Arecibo by Wegner et al. (1993): = 5409 km s-1, = 189 km s-1, = 4.7 Jy km s-1. Please note that our NRT spectrum of UGC 2305 is not shown in Figure 1
A.1.71 UGC 2480
The galaxy UGC 2472 lies (4.3 and 1.8 times the Arecibo and GBT beam radii, respectively) from our target UGC 2480 and has an H i velocity of 10,157 km s-1 (e.g. Haynes et al. 2018), 27 km s-1 higher than what we measured for our target, UGC 2480. The larger and values we found at the GBT, compared to Arecibo, makes it likely that our GBT data, at least, are affected by UGC 2472’s proximity. As a result, only the Arecibo data are used in Table 2.
A.1.72 UGC 2505
The galaxy 2MASX J03034116-0104249 is and 135 km s-1 from our target, UGC 2505. As no difference in flux is found between the Nançay and GBT observations, though, it is unlikely that flux from 2MASX J03034116-0104249 has contaminated the profile parameters we measured for UGC 2505. GBT follow-up observations were taken of UGC 2505 to confirm this, with the same result as the earlier observations.
A.1.73 UGC 2668
Albareti et al. (2017) gives UGC 2668 an optical velocity of 5450 km s-1, yet we see no hint of a galaxy at that velocity, to an r.m.s. of 2.8 mJy. Either the object is extremely lacking in H i gas or the optical velocity is incorrect.
A.1.74 UGC 2749
Our Nançay H i spectrum of UGC 2749, with = 4207 km s-1, is very probably confused by that of the Sc type galaxy CGCG 541-011, to the North, which has = 425343 km s-1.
A.1.75 UGC 2876
UGC 2876 has no published optical velocity but it has a published Arecibo H i detection, with = 5475 km s-1, = 200 km s-1 and = 1.9 Jy km s-1 (Monnier Ragaigne et al., 2003a). However, upon inspection of the published spectrum we estimate its central peak velocity to be 5305 km s-1. This matches the other values, which were obtained with both Nançay and the GBT (with two separate GBT observations).
A.1.76 UGC 3041
Jones et al. (2009b) give an optical velocity of 4931 km s-1 for UGC 3041, yet we find no H i detection at that velocity to an r.m.s. of 0.81 mJy. Either this source has an extremely low H i mass or the optical velocity is incorrect.
A.1.77 UGC 3797
It is likely that nearby galaxy UGC 3789 has contributed flux to our measured Nançay H i spectrum. It lies from our target UGC 3797, and has an optical velocity of 324370 km s-1 (Focardi et al., 1986), 162 km s-1 lower than that of our target (340515 km s-1 Rines et al. 2000). We observed UGC 3797 at Nançay and measured = 3399 km s-1, = 163 km s-1, and = 2.9 Jy km s-1, whereas UGC 3798 was observed at Nançay by Theureau et al. (1998), who reported = 3325 km s-1, = 389 km s-1, and = 1.7 Jy km s-1. The separation between both objects is 2.5 times the beam radius.
A.1.78 UGC 3963
UGC 3963 was originally observed at Nançay as part of the UGC sample. Subsequently an optical redshift of 20,236 km s-1 was reported (Huchra et al., 2012b) which places it outside our Nançay search range. However, follow-up observations with the GBT which included the optical velocity still did not detect the galaxy. Only the GBT r.m.s. is listed in Table 4.
A.1.79 UGC 5071
A.1.80 UGC 5127
Our Arecibo spectrum shows two detections, at 4521 km s-1 and 5892 km s-1. The former is of our target UGC 5127, with = 4508 km s-1 (Ann et al., 2015), whereas the latter detection appears to be of SDSS J093743.77+370631.3, from our target with = 5894 km s-1 (Ann et al., 2015). The data we used are for the lower velocity detection.
A.1.81 UGC 5293
We detected UGC 5293 at Nançay and twice with the GBT, and found = 4986 km s-1, = 198 km s-1, and = 2.4 Jy km s-1. The galaxy WISEA J095234.27+412207.1 lies (1.6 times the GBT beam size) away and has a velocity of 5019 km s-1 based on spectroscopic measurements by York et al. (2000), 33 km s-1 higher than our H i detections. It is possible, then, that UGC 5293 and 095234.27+412207.1 are interacting companions.
A.1.82 UGC 5412
The intent of this survey was to detect our target, UGC 5410. A photometric redshift of 35,120km s-1 was reported subsequently (e.g., Albareti et al., 2017) for our target, well outside our H i search range. However, the GBT and Nançay beams also readily covered nearby UGC 5412, whose optical spectroscopic velocity of 9610 km s-1 (Alam et al., 2015) corresponds to our H i detection, and the results of this spurious detection are given in Tables 2 and 3.
A.1.83 UGC 5613
Due to residual RFI centered on its optical velocity of 9656 km s-1 (Ann et al., 2015) we are unable to draw any conclusions regarding the H i line signal of this galaxy.
A.1.84 UGC 5983
It is highly likely that most, or all, of our measured H i flux is from nearby NGC 3432, a much larger galaxy whose center lies from the position of our target, UGC 5983. The H i profiles we measured towards UGC 5983 with the GBT and NRT are significantly different. Both telescope beams include a significant portion of NGC 3432, especially at the GBT. An Arecibo measurement of NGC 3432 by Hewitt et al. (1983) shows = 608 km s-1, = 248 km s-1, and = 138 Jy km s-1. We measured an of 78 and 32 Jy km s-1 at the GBT and NRT, respectively. Please note that the Nançay spectrum of this galaxy is not shown in Figure 1
A.1.85 UGC 6005
UGC 6005 was not detected in H i by Schneider et al. (1990a) with an r.m.s. noise level of 8.7 mJy, which is consistent with the average line flux density level of our detection of / = 15.5 mJy.
A.1.86 UGC 6179
The original GBT observation, pointed at the galaxy center, showed a huge profile width ( = 913 km s-1) and total H i mass (log(/) = 10.81), and = 13,155 km s-1 in agreement with its optical spectroscopic velocity of 13,145 km s-1 Albareti et al. (2017). Confirmation observations with the GBT on a grid surrounding the galaxy indicate the detected H i mass is confined within the original GBT beam (Figure 24). A literature search shows only one other galaxy, WISEA J110756.84+635233.2, which lies within the central GBT beam and has a velocity similar to that of UGC 6179 ( = 13,173 km s-1). However, two more galaxies, WISEA J110655.38+635302.7 and WISEA J110729.12+635037.3, lie just outside the GBT beam at very similar velocities ( = 13,061 & 13,117 km s-1, respectively). Additionally, though, inspection of images from the SDSS (Alam et al., 2015) indicates there are a number of previously unidentified galaxies within the beam. One of these, shown in Figure 24, appears to be a blue LSB galaxy which is likely also part of the galaxy group surrounding UGC 6179. As the Nançay spectrum for this galaxy has RFI in the middle of the measured spectrum, only the GBT data are used for determining the line parameters of UGC 6179.
A.1.87 UGC 6369
There are at least five other galaxies within and 1,000 km s-1 of UGC 6369, see Table 12 for a list of its known neighbors. It is therefore highly likely that our Nançay H i profile of UGC 6369 is confused.
A.1.88 UGC 6489
A.1.89 UGC 6812
Alam et al. (2015) gives an optical spectroscopic velocity for UGC 6812 of 6785 km s-1, yet there is no H i detected at that velocity to a 1 limit of 1.7 mJy. Either the reported velocity is incorrect or UGC 6182 has a very low H i mass.
A.1.90 UGC 7146
The SDSS DR12 (Ann et al., 2015) lists an optical velocity of 19,3916 km s-1 for UGC 7146, significantly different from earlier SDSS values, e.g. 1060 km s-1 (DR5), and the 1060 km s-1 we found in H i at the GBT and NRT. However numerous other H i studies have found velocities similar to ours, giving significant confidence in our results (e.g. Pak et al., 2014; Wolfinger et al., 2013; van Driel et al., 2016). Our target UGC 7146, is listed as a member of galaxy group [RPG97] 186 (Ramella et al., 1997), whose center position lies 11′ and 216 km s-1 from our target, but all 18 objects within 12′ distance with known redshifts are much more distant (at 20,000-50,000 km s-1) than our nearby (1060 km s-1) target. It therefore seems unlikely that other group members have contaminated our GBT or Nançay spectra of UGC 7146.
A.1.91 UGC 7553
UGC 7553 has an optical spectroscopic velocity of 8733 km s-1 (Colless et al., 2001). Our H i detection at Nançay, and another by Matthews & van Driel (2000), both measured a 90 km s-1 higher H i velocity of 8823 km s-1. Both H i spectra may be confused by nearby CGCG 014-041, a = 14.8 mag galaxy to the North, at = 880635 km s-1, although it is not expected to be H i-rich given its S0 classification.
A.1.92 UGC 7953
We detected UGC 7953 at 17,211 km s-1 with the GBT, whereas the SDSS DR12 (Alam et al., 2015) reported an optical velocity of 109314 km s-1. However, as the SDSS classified the spectrum as ”star F9” and it shows no emission lines, it is likely that the reported velocity is erroneous. Furthermore, our GBT and Arecibo observations did not detect H i at the 1093 km s-1velocity.
A.1.93 UGC 8107
Using the GBT, Masters et al. (2014) measured = 747 km s-1 towards UGC 8107, significantly larger than the 60234 km s-1 we found at Nançay. Our follow-up GBT observations, though, gave an even higher value, of = 988km s-1. The measured H i line fluxes of all three measurement are consistent. As the signal-to-noise ratios for the two GBT measurements are significantly higher than for the Nançay measurement, the GBT value is more reliable, but the measured error is high. The average of the measured values if given here.
A.1.94 UGC 8222
The detection of UGC 8222 is marginal, with our confidence in the detection due to Alam et al. (2015)’s earlier determination of the galaxy’s spectroscopic velocity.
A.1.95 UGC 8659
Given its much higher H i velocity of 5001 km s-1, UGC 8659 is clearly not a member of the M101 group (mean velocity 240 km s-1), as was considered a possibility by Bremnes et al. (1999). Surface photometry in the and bands (Bremnes et al., 1999) shows it has an Im morphology, an extrapolated = 16.16 mag, a central blue disk surface brightness 23.2 mag arcsec-2, a blue disk scalelength of and an increasingly blue color with radius.
A.1.96 UGC 8802
UGC 8802 has two nearby galaxies, WISEA J135337.14+354117.7 at and 400 km s-1 away from it, and CGCG 191-005 at and 329 km s-1 away. However, as both the Nançay and Arecibo spectra look similar it is unlikely that either galaxy has contributed to the measured H i flux of UGC 8802.
A.1.97 UGC 9783
The SDSS optical value of 11,1686 km s-1 (Albareti et al., 2017) of UGC 9783 corresponds exactly to the 11,16810 km s-1 we measured in our GBT follow-up observations. Our Nançay profile is quite different (see Table 3), but as it was detected near the edge of the NRT bandpass and the rms of our GBT spectrum is five times smaller, only the GBT results are reported in Table 2.
A.1.98 UGC 10666, UGC 10668
Our Arecibo data show two separated profiles, centered at 9809 and 10,101 km s-1 respectively. Our target galaxy UGC 10666, has a 2MASS photometric redshift of 16,047 km s-1 (Bilicki et al., 2014) whereas UGC 10668, at separation, has an optical spectroscopic velocity of 10,16245 km s-1 (Huchra et al., 2012a). UGC 10668’s optical velocity corresponds to the higher-velocity H i detection, although as UGC 10668 lies on the edge of the telescope beam its flux is likely underestimated by a factor of 2 or so. It is also likely that the lower measured H i velocity corresponds to UGC 10666. Our Nançay observations were not sensitive enough (r.m.s. 3.2 mJy) to detect the profiles.
A.1.99 UGC 11900
UGC 11900 has one neighbor, LEDA 167572, which lies and 405 km s-1 away. The standard, double-horned shape of the UGC 11900 H i profile combined with the difference in velocities of the two galaxies makes it highly unlikely that its H i profile is contaminated by its neighbor.
| Name | RA | Dec | Morph. | D25 | b/a | Opt. ref. | H i ref. | |||
|---|---|---|---|---|---|---|---|---|---|---|
| (J2000.0) | (J2000.0) | (mag) | (′) | (km s-1) | (km s-1) | |||||
| H I Detections | ||||||||||
| ESO 300-020 | 03 14 07.0 | -37 59 29 | (dIAB(s)m?) | 17.27 | 0.50 | 0.54 | ||||
| ESO 338-020 | 19 41 17.0 | -38 12 49 | Sbc | 17.08 | 0.62 | 0.45 | ||||
| ESO 346-034 | 23 10 00.0 | -37 20 01 | (dwarf) | 16.42 | 0.69 | 0.49 | ||||
| ESO 359-009 | 03 54 59.0 | -35 47 21 | Sbc | 16.52 | 0.79 | 0.48 | ||||
| ESO 368-004 | 07 32 54.0 | -35 29 19 | I | 16.49 | 0.91 | 0.63 | 1397 | Sta16 | ||
| ESO 371-004 | 08 40 14.0 | -32 55 49 | Sbc | 16.18 | 0.56 | 0.49 | ||||
| ESO 371-007 | 08 41 16.0 | -33 15 53 | Sbc | 16.09 | 0.42 | 0.56 | ||||
| ESO 371-017 | 08 48 16.0 | -33 49 16 | SBm | 16.11 | 0.63 | 0.34 | ||||
| ESO 377-005 | 11 05 37.0 | -36 33 39 | SBbc | 16.12 | 0.55 | 0.60 | ||||
| ESO 377-045 | 11 25 46.0 | -36 48 36 | Sbc | 16.77 | 0.63 | 0.65 | 3087 | Mat96 | ||
| ESO 385-016 | 14 23 02.0 | -36 46 17 | Sbc | 16.77 | 0.69 | 0.52 | ||||
| ESO 396-006 | 18 50 30.0 | -34 10 04 | SABb | 0.30 | 0.79 | |||||
| ESO 398-011 | 19 34 52.0 | -34 13 55 | Sbc | 16.26 | 1.05 | 0.35 | ||||
| ESO 424-009 | 05 42 03.0 | -30 42 12 | Sbc | 16.22 | 0.26 | 0.51 | ||||
| ESO 424-031 | 05 51 45.0 | -30 08 15 | Sbc | 17.02 | 0.85 | 0.34 | ||||
| ESO 427-009 | 06 49 39.0 | -32 24 01 | Sbc | 16.69 | 0.89 | 0.39 | ||||
| ESO 433-013 | 09 18 50.0 | +32 26 34 | (dwarf) | 17.19 | 0.72 | 0.55 | ||||
| ESO 435-002 | 09 50 35.0 | -28 35 46 | Sbc | 16.33 | 0.69 | 0.56 | ||||
| ESO 436-021 | 14 18 44.0 | -27 56 17 | (dS) | 16.59 | 0.76 | 0.54 | ||||
| ESO 451-006 | 16 01 20.0 | -30 55 46 | Sbc | 16.76 | 0.91 | 0.42 | ||||
| ESO 463-005 | 20 34 22.0 | -32 15 53 | SBcd | 16.25 | 0.51 | 0.49 | 3031 | 6dF | ||
| ESO 482-024 | 03 38 59.0 | -22 35 03 | Sc | 16.40 | 0.76 | 0.50 | 4343 | Spr05 | ||
| ESO 484-018 | 04 26 56.0 | -25 39 13 | Scd | 16.86 | 0.62 | 0.39 | ||||
| ESO 487-033 | 05 41 28.0 | -27 13 40 | Sc | 15.75 | 0.51 | 0.23 | ||||
| ESO 490-040 | 06 46 23.0 | -24 28 12 | Sbc | 17.44 | 0.52 | 0.47 | ||||
| ESO 491-003 | 06 52 02.0 | -23 09 50 | Sc | 16.44 | 0.51 | 0.71 | ||||
| ESO 492-001 | 07 11 32.0 | -25 10 30 | Sc | 16.64 | 0.78 | 0.24 | ||||
| ESO 493-006 | 07 44 02.0 | -27 21 45 | I | 17.62 | 0.50 | 0.63 | ||||
| ESO 500-014 | 10 13 48.0 | -27 31 49 | Sbc | 16.68 | 0.74 | 0.40 | ||||
| ESO 501-029 | 10 36 09.0 | -24 48 51 | S? | 15.71 | 0.71 | 0.71 | ||||
| ESO 501-093 | 10 46 29.0 | -25 33 07 | Sbc | 17.07 | 0.55 | 0.43 | ||||
| ESO 510-062 | 14 05 32.0 | -27 37 19 | Sbc | 17.49 | 0.30 | 0.65 | ||||
| ESO 513-023 | 15 12 01.0 | -24 42 39 | Sbc | 16.36 | 0.78 | 0.41 | ||||
| ESO 515-002 | 15 38 40.0 | -23 29 57 | Sbc | 16.70 | 0.83 | 0.45 | 6901 | 6dF | ||
| ESO 525-005 | 19 26 45.0 | -27 25 14 | I | 16.50 | 0.38 | 0.50 | 1946 | Mey04 | ||
| ESO 527-003 | 20 03 19.0 | -25 01 07 | Sc | 16.69 | 0.71 | 0.72 | 5963 | Mey04 | ||
| ESO 540-032 | 00 50 24.0 | -19 54 22 | IAB | 16.61 | 1.23 | 0.81 | 228 | Bou09 | ||
| ESO 549-047 | 04 01 14.0 | -18 04 30 | I | 16.15 | 0.95 | 0.66 | 4227 | Spr05 | ||
| ESO 552-002 | 04 45 50.0 | -22 08 42 | Sbc | 16.58 | 0.76 | 0.44 | ||||
| ESO 568-015 | 10 31 42.0 | -22 15 00 | I | 16.45 | 0.81 | 0.52 | 990 | Huc01 | ||
| ESO 569-018 | 10 53 57.0 | -20 38 32 | SBbc | 16.80 | 0.87 | 0.29 | ||||
| ESO 571-013 | 11 39 06.0 | -19 36 45 | Sbc | 16.73 | 0.71 | 0.48 | ||||
| ESO 579-013 | 14 18 04.0 | -20 57 18 | Sbc | 17.12 | 0.54 | 0.62 | ||||
| ESO 580-048 | 14 52 56.0 | -21 46 10 | Sbc | 16.22 | 0.85 | 0.42 | 4239 | Mey04 | ||
| IC 3004 | 12 07 10.0 | +13 14 52 | SBc | 15.77 | 0.62 | 0.66 | 6353 | Spr05 | ||
| IC 3852 | 12 53 03.0 | +35 46 24 | Scd | 16.00 | 1.10 | 0.39 | 4378 | Hay18 | ||
| PGC 538 | 00 06 58.0 | -06 57 18 | SABd | 16.47 | 1.02 | 0.49 | 3885 | Mey04 | ||
| PGC 1303 | 00 20 24.0 | -14 01 57 | SBm | 17.58 | 0.49 | 0.54 | 3522 | 6dF | ||
| PGC 1940 | 00 31 49.0 | -02 31 53 | SBcd | 15.70 | 0.76 | 0.46 | 6224 | Mey04 | ||
| PGC 2582 | 00 43 17.0 | -09 13 06 | 16.00 | 1.41 | 0.40 | |||||
| PGC 3843 | 01 04 53.0 | -11 11 36 | Sd | 17.46 | 0.59 | 0.62 | ||||
| PGC 4099 | 01 08 59.0 | -05 31 04 | IB | 16.15 | 0.91 | 0.54 | 2263 | Mey04 | ||
| PGC 6960 | 01 52 41.0 | -13 13 57 | SBm | 16.22 | 0.85 | 0.63 | ||||
| PGC 7225 | 01 56 06.0 | +04 59 48 | Sc | 17.42 | 0.55 | 0.35 | 5071 | Zab98 | ||
| PGC 7981 | 02 05 33.0 | +28 36 38 | SBbc | 16.83 | 0.78 | 0.46 | 5312 | Hay18 | ||
| PGC 15169 | 04 27 55.0 | -29 32 39 | SABm | 18.58 | 0.41 | 0.85 | ||||
| PGC 15921 | 04 44 43.0 | -02 50 09 | IB | 16.83 | 0.63 | 0.78 | 3622 | Mey04 | ||
| PGC 15936 | 04 45 16.0 | -02 49 10 | Sc | 17.41 | 0.47 | 0.58 | ||||
| PGC 16370 | 04 56 26.0 | +45 55 42 | Sbc | 17.57 | 0.54 | 0.55 | 6901 | Ram16 | ||
| PGC 16496 | 04 59 27.0 | +42 23 34 | 17.78 | 0.52 | 0.43 | |||||
| PGC 17124 | 05 20 24.0 | +76 12 35 | Sd | 0.48 | 1.00 | |||||
| PGC 17868 | 05 48 09.0 | +42 27 57 | 16.86 | 0.85 | 0.44 | |||||
| PGC 20434 | 07 13 35.0 | +73 34 55 | Sd | 16.72 | 0.79 | 0.56 | ||||
| PGC 21133 | 07 29 40.0 | +50 20 01 | Sb | 17.40 | 0.72 | 0.43 | ||||
| PGC 21529 | 07 40 10.0 | +32 12 22 | Sc | 15.86 | 0.85 | 0.40 | 4059 | DR13 | 4074 | Hay18 |
| PGC 21597 | 07 41 52.0 | +75 00 08 | Sc | 17.59 | 0.58 | 0.40 | ||||
| PGC 23116 | 08 14 47.0 | +24 45 13 | Sc | 16.67 | 0.50 | 0.55 | 8575 | DR13 | 8572 | Hay18 |
| PGC 23328 | 08 19 11.0 | +25 31 53 | Sc | 16.94 | 0.54 | 0.40 | 5825 | DR13 | 5815 | Hay18 |
| PGC 23879 | 08 30 40.0 | +43 47 58 | Sbc | 17.11 | 0.59 | 0.52 | 16472 | DR13 | ||
| PGC 23958 | 08 32 29.0 | +44 11 08 | Sc | 16.31 | 0.89 | 0.45 | 13431 | DR13 | ||
| PGC 24439 | 08 32 29.0 | +44 11 07 | 17.06 | 0.78 | 0.59 | |||||
| PGC 25010 | 08 54 26.0 | +54 18 18 | SABc | 16.96 | 0.60 | 0.47 | 7760 | DR13 | ||
| PGC 25621 | 09 07 17.0 | +37 30 10 | Sc | 16.71 | 0.63 | 0.40 | 9083 | DR13 | ||
| PGC 26708 | 09 25 18.0 | -34 06 13 | Sbc | 17.98 | 1.35 | 0.49 | 1150 | 6dF | ||
| PGC 26936 | 09 29 38.0 | +35 20 25 | I | 15.97 | 0.87 | 0.37 | 4353 | DR13 | 4350 | Hay18 |
| PGC 27485 | 09 38 32.0 | +37 11 29 | Sc | 15.86 | 0.74 | 0.76 | 4400 | DR13 | ||
| PGC 27849 | 09 43 49.0 | +28 43 21 | Sbc | 16.60 | 0.76 | 0.63 | 9472 | DR13 | 9460 | Hay18 |
| PGC 28799 | 09 58 14.0 | -38 13 57 | 15.37 | 0.66 | 0.34 | |||||
| PGC 29681 | 10 11 46.0 | +65 13 40 | Sb | 17.00 | 0.71 | 0.52 | ||||
| PGC 29916 | 10 14 57.0 | +35 24 44 | SBc | 16.63 | 0.54 | 0.62 | 11849 | DR13 | 11838 | Hay18 |
| PGC 30113 | 10 18 47.0 | +53 42 29 | SBb | 17.13 | 0.55 | 0.98 | 13491 | DR13 | ||
| PGC 30572 | 10 25 23.0 | +45 43 30 | S? | 16.33 | 0.54 | 0.58 | 7456 | DR4 | ||
| PGC 32862 | 10 56 18.0 | +57 31 23 | Sab | 16.57 | 0.93 | 0.36 | 13973 | DR13 | ||
| PGC 34377 | 11 16 12.0 | +30 36 33 | Sc | 16.89 | 0.55 | 0.60 | 12794 | DR13 | 12840 | Hay18 |
| PGC 34409 | 11 16 39.0 | +31 51 32 | Sc | 16.89 | 0.55 | 0.43 | 8699 | DR13 | 8702 | Hay18 |
| PGC 34673 | 11 20 05.0 | +58 06 22 | S? | 17.06 | 0.55 | 0.35 | 5351 | DR13 | ||
| PGC 34959 | 11 23 09.0 | +35 41 08 | SBc | 16.21 | 0.69 | 0.69 | 7420 | DR13 | 7419 | Hay18 |
| PGC 35231 | 11 27 21.0 | +50 16 44 | I | 17.92 | 0.65 | 0.37 | ||||
| PGC 36429 | 11 43 30.0 | +53 11 14 | IAB | 17.75 | 0.50 | 0.59 | ||||
| PGC 36715 | 11 46 24.0 | +35 43 42 | Sbc | 16.20 | 0.83 | 0.43 | 10770 | DR13 | 10778 | Hay18 |
| PGC 37416 | 11 55 22.0 | +28 20 30 | Sm | 16.11 | 0.79 | 0.44 | 558 | Hay18 | ||
| PGC 38080 | 12 03 21.0 | +23 17 06 | SBc | 16.72 | 0.51 | 0.56 | 6881 | Hay18 | ||
| PGC 38264 | 12 05 07.0 | +53 53 51 | Sc | 17.46 | 0.58 | 0.39 | 3782 | DR13 | ||
| PGC 38333 | 12 05 47.0 | +20 19 37 | SBc | 16.49 | 0.68 | 0.40 | 6960 | Hay18 | ||
| PGC 38698 | 12 10 04.0 | +42 17 19 | Scd | 16.49 | 0.91 | 0.36 | ||||
| PGC 38958 | 12 12 58.0 | +14 06 32 | 18.14 | 0.54 | 0.44 | 5909 | Hay18 | |||
| PGC 39438 | 12 17 42.0 | +28 12 05 | SABd | 16.16 | 0.51 | 0.71 | 2547 | Hay18 | ||
| PGC 39701 | 12 19 43.0 | +12 16 45 | Sm | 17.49 | 0.66 | 0.72 | ||||
| PGC 40740 | 12 26 42.0 | +59 31 40 | E | 16.26 | 0.76 | 0.51 | ||||
| PGC 41127 | 12 29 10.0 | +16 41 37 | Sm | 17.90 | 0.63 | 0.63 | ||||
| PGC 41765 | 12 34 01.0 | +46 59 18 | Sc | 16.78 | 0.78 | 0.59 | 5630 | DR13 | ||
| PGC 43042 | 12 45 56.0 | +34 56 52 | Sbc | 16.76 | 0.66 | 0.47 | 11649 | DR13 | 11664 | Hay18 |
| PGC 43880 | 12 54 07.0 | +48 15 39 | SABc | 15.87 | 0.78 | 0.66 | 8992 | DR13 | ||
| PGC 47926 | 13 35 35.0 | +51 11 00 | Sc | 16.58 | 0.69 | 0.50 | 4579 | DR13 | ||
| PGC 49014 | 13 49 02.0 | +49 24 36 | Sbc | 16.41 | 0.65 | 0.47 | 8429 | DR13 | ||
| PGC 51872 | 14 31 03.0 | +35 31 11 | Sc | 16.69 | 0.79 | 0.35 | 4073 | Hay18 | ||
| PGC 56738 | 16 01 45.0 | +21 11 47 | Sbc | 17.06 | 0.32 | 0.89 | 9900 | DR13 | ||
| PGC 59812 | 17 12 01.0 | +72 38 51 | Sab | 17.54 | 1.20 | 0.79 | ||||
| PGC 60396 | 17 29 44.0 | +42 28 02 | 17.21 | 0.87 | 0.66 | |||||
| PGC 67570 | 21 53 05.0 | -16 53 37 | Scd | 15.62 | 1.00 | 0.43 | 10100 | 6dF | ||
| PGC 72721 | 23 52 46.0 | +32 02 45 | Sc | 17.77 | 0.49 | 0.48 | 8357 | Hay18 | ||
| PGC 73236 | 00 05 58.0 | +08 50 05 | Sc | 17.52 | 0.58 | 0.43 | 5166 | Hay18 | ||
| PGC 74070 | 02 03 38.0 | +32 13 21 | Sc | 17.01 | 0.66 | 0.44 | 4737 | Hay18 | ||
| PGC 76261 | 06 55 15.0 | -14 28 29 | Sc | 18.03 | 0.58 | 0.42 | 6270 | The05 | ||
| PGC 77473 | 07 30 45.0 | -28 23 58 | Sa | 17.27 | 0.66 | 0.59 | 8084 | Sta16 | ||
| PGC 79026 | 07 55 51.0 | +36 18 57 | Scd | 16.57 | 0.63 | 0.54 | 5990 | DR13 | ||
| PGC 80280 | 08 11 26.0 | -17 56 35 | Sbc | 17.59 | 0.76 | 0.56 | ||||
| PGC 80973 | 08 20 19.0 | -23 02 44 | Sbc | 17.55 | 0.59 | 0.41 | ||||
| PGC 82372 | 09 21 07.0 | +33 29 19 | Sc | 16.64 | 0.76 | 0.52 | 12730 | DR13 | ||
| PGC 82395 | 09 26 21.0 | +32 59 26 | Sc | 17.23 | 0.48 | 0.58 | 13520 | DR13 | 13517 | Hay18 |
| PGC 82550 | 09 51 52.0 | +36 53 48 | Sc | 16.54 | 0.78 | 0.60 | 6519 | DR13 | ||
| PGC 85418 | 23 19 23.0 | +17 38 55 | Sc | 17.30 | 0.58 | 0.44 | 11933 | Hay18 | ||
| PGC 85851 | 23 51 54.0 | +13 43 46 | Sc | 17.21 | 0.59 | 0.44 | 8008 | DR13 | 7967 | Hay18 |
| PGC 85903 | 23 56 50.0 | +09 15 10 | Sc | 16.98 | 0.66 | 0.48 | 11775 | Hay18 | ||
| PGC 86344 | 07 06 52.0 | +44 16 27 | Sc | 16.70 | 0.76 | 0.40 | ||||
| PGC 86432 | 12 47 12.0 | +22 29 04 | Sc | 16.50 | 0.50 | 0.43 | 10426 | DR13 | 10436 | Hay18 |
| PGC 86623 | 10 29 53.0 | +20 48 05 | Scd | 16.40 | 0.72 | 0.40 | 2978 | DR13 | 2901 | Hay18 |
| PGC 86863 | 08 50 55.0 | +33 45 51 | Scd | 16.57 | 0.76 | 0.24 | 8128 | DR13 | ||
| PGC 86903 | 10 12 11.0 | +34 46 44 | Sc | 17.13 | 0.98 | 0.62 | 11536 | DR13 | 11538 | Hay18 |
| PGC 86979 | 10 34 38.0 | +34 35 05 | Sbc | 16.62 | 0.55 | 0.45 | 13966 | DR13 | ||
| PGC 87248 | 04 19 01.0 | +14 49 40 | Sc | 17.50 | 0.63 | 0.45 | ||||
| PGC 89535 | 06 29 06.0 | +79 23 34 | Sc | 16.71 | 0.79 | 0.46 | ||||
| PGC 89614 | 12 30 36.0 | +24 34 49 | Sbc | 17.02 | 0.54 | 0.44 | ||||
| PGC 89704 | 12 27 20.0 | +18 42 56 | SBc | 16.02 | 0.71 | 0.46 | 7034 | DR13 | 7017 | Hay18 |
| PGC 89735 | 12 40 11.0 | +18 03 42 | Sc | 16.73 | 0.59 | 0.55 | 7919 | DR13 | 7936 | Hay18 |
| PGC 91042 | 10 42 29.0 | +72 16 00 | Sc | 17.38 | 0.62 | 0.48 | ||||
| PGC 91045 | 10 43 43.0 | +72 13 25 | Sc | 17.16 | 0.69 | 0.42 | ||||
| PGC 91198 | 12 25 33.0 | +36 08 57 | Sc | 16.86 | 0.68 | 0.41 | 10138 | Hay18 | ||
| PGC 91391 | 14 49 16.0 | +31 54 27 | Sc | 17.18 | 0.69 | 0.42 | 8978 | DR13 | 8968 | Hay18 |
| PGC 91549 | 16 44 18.0 | +30 51 37 | Sc | 17.43 | 0.59 | 0.47 | 17611 | DR13 | ||
| PGC 95595 | 06 17 35.0 | +74 48 46 | 18.00 | 0.58 | 0.51 | |||||
| PGC 95598 | 06 46 39.0 | +60 08 44 | S? | 16.70 | 1.07 | 0.81 | ||||
| PGC 97032 | 04 07 55.0 | +45 49 40 | Sbc | 17.05 | 0.69 | 0.42 | 4470 | Pat03 | ||
| PGC 135624 | 01 07 23.0 | +01 00 11 | Sm | 17.37 | 0.78 | 0.79 | ||||
| PGC 135658 | 02 40 56.0 | +00 14 45 | Sc | 17.27 | 0.59 | 0.42 | ||||
| PGC 135712 | 04 09 41.0 | +02 17 02 | Sd | 17.80 | 0.56 | 0.63 | ||||
| PGC 135894 | 23 34 00.0 | +00 12 52 | SBm | 17.42 | 0.62 | 0.52 | 10471 | Hay18 | ||
| PGC 137640 | 01 11 37.0 | +52 48 15 | Sc | 17.74 | 0.54 | 0.41 | ||||
| PGC 166470 | 03 29 20.0 | +66 01 39 | Sc | 17.47 | 0.65 | 0.48 | 2111 | Mas14 | ||
| PGC 166523 | 17 54 25.0 | -02 02 31 | E? | 17.63 | 0.51 | 0.59 | ||||
| PGC 200944 | 17 50 59.0 | +07 14 25 | Sc | 17.96 | 0.58 | 0.40 | ||||
| PGC 2815800 | 02 14 55.0 | -32 12 34 | I | 18.00 | 0.52 | 0.85 | ||||
| PGC 2815805 | 05 32 23.0 | -17 41 48 | I | 17.80 | 0.47 | 0.52 | 3421 | Huc01 | ||
| PGC 2815809 | 07 56 38.0 | -26 15 07 | I | 17.70 | 0.33 | 0.78 | 6681 | Mey04 | ||
| PGC 2815811 | 08 46 53.0 | -21 47 46 | I | 17.40 | 0.52 | 0.72 | ||||
| PGC 2815828 | 16 47 15.0 | -27 10 36 | Sc | 17.50 | 0.52 | 0.72 | ||||
| PGC 2815830 | 17 03 33.0 | -18 52 24 | I | 17.70 | 0.47 | 1.00 | ||||
| PGC 2815836 | 20 20 17.0 | -21 54 17 | I | 18.20 | 0.33 | 0.89 | ||||
| UGC 2 | 00 02 26.1 | +44 55 14 | Sdm: | 17.00 | 0.80 | 0.23 | ||||
| UGC 263 | 00 27 16.0 | +44 03 13 | Im | 16.50 | 1.30 | 0.22 | 16718 | Huc12 | ||
| UGC 605 | 00 58 34.0 | +22 19 10 | SABb | 16.00 | 0.87 | 0.39 | ||||
| UGC 778 | 01 14 22.4 | +50 13 39 | Sdm: | 17.00 | 0.90 | 0.17 | 6299 | Huc12 | ||
| UGC 825 | 01 17 36.9 | +49 00 37 | Sdm: | 17.00 | 0.90 | 0.19 | 5354 | Mak97 | 5338 | Mat00 |
| UGC 854 | 01 19 31.0 | +03 54 31 | Sc | 16.50 | 0.81 | 0.40 | 5054 | Spr05 | ||
| UGC 856 | 01 19 28.9 | -01 42 05 | SB(s)m | 16.50 | 1.10 | 0.81 | 4787 | Rin03 | 4781 | Spr05 |
| UGC 1127 | 01 34 58.0 | +39 55 31 | SAdm | 16.50 | 0.50 | 0.81 | ||||
| UGC 1134 | 01 35 22.1 | +36 19 06 | Sm: | 17.00 | 0.80 | 0.45 | ||||
| UGC 1136 | 01 35 33.9 | +41 31 51 | Im: | 17.00 | 1.20 | 0.95 | ||||
| UGC 1145 | 01 36 32.0 | +39 55 22 | SBb | 15.20 | 0.90 | 0.56 | 5676 | Huc83 | ||
| UGC 1216 | 01 44 23.9 | +40 41 11 | dwS | 18.00 | 0.80 | 0.87 | ||||
| UGC 1442 | 01 57 33.9 | -02 06 07 | Sdm | 15.60 | 0.80 | 0.46 | 4940 | Jon09 | ||
| UGC 1603 | 02 06 42.5 | -00 51 37 | Sadm: | 15.40 | 0.90 | 0.72 | 5984 | DR12 | ||
| UGC 1615 | 02 08 01.9 | +41 19 18 | SB(s)dm: | 17.00 | 0.90 | 0.81 | ||||
| UGC 1740 | 02 16 05.0 | +43 29 21 | dw | 17.00 | 0.90 | 0.89 | ||||
| UGC 1779 | 02 18 49.0 | +38 41 06 | Sd | 17.00 | 0.52 | 0.78 | ||||
| UGC 1783 | 02 19 20.0 | +44 06 45 | Im: | 17.00 | 1.30 | 0.78 | ||||
| UGC 1851 | 02 24 27.0 | +49 29 19 | Sd | 17.00 | 0.49 | 0.81 | ||||
| UGC 1874 | 02 25 28.5 | +40 42 21 | SABd: | 17.00 | 1.00 | 0.72 | ||||
| UGC 1927 | 02 28 12.0 | +43 35 25 | Sdm: | 17.00 | 0.90 | 0.17 | ||||
| UGC 1941 | 02 28 35.0 | +37 57 08 | 16.27 | 1.38 | 0.93 | |||||
| UGC 1949 | 02 28 18.7 | -00 36 25 | IAB(s)m: | 18.00 | 1.00 | 0.78 | 1464 | Imp01 | ||
| UGC 1953 | 02 29 05.0 | +45 03 28 | Sc | 16.50 | 1.00 | 0.87 | ||||
| UGC 2036 | 02 33 54.3 | +41 28 40 | 17.00 | 0.40 | 0.42 | |||||
| UGC 2068 | 02 35 26.6 | +40 53 40 | Sdm: | 17.00 | 0.60 | 0.25 | 5740 | The98 | ||
| UGC 2113 | 02 37 52.0 | -01 39 57 | SBdm | 16.50 | 0.80 | 0.26 | 12857 | Geh17 | ||
| UGC 2139 | 02 39 22.0 | +36 23 53 | dw | 18.00 | 0.90 | 1.00 | ||||
| UGC 2172 | 02 42 11.1 | +43 21 18 | Irr | 14.50 | 1.50 | 0.60 | 544 | Huc99 | 565 | Bra03 |
| UGC 2224 | 02 45 27.0 | +45 58 06 | Sbc | 16.67 | 0.89 | 0.63 | 11218 | Huc12 | ||
| UGC 2235 | 02 46 29.0 | +45 12 13 | Sm | 17.00 | 0.65 | 0.56 | ||||
| UGC 2250 | 02 47 22.0 | +46 19 19 | Im: | 18.00 | 1.00 | 1.00 | ||||
| UGC 2269 | 02 48 15.8 | +44 39 33 | Im: | 18.00 | 1.30 | 0.81 | ||||
| UGC 2284 | 02 48 31.4 | -02 05 32 | Sdm | 17.00 | 0.90 | 0.65 | 7433 | Jon09 | 7433 | Spr05 |
| UGC 2301 | 02 49 37.9 | +38 15 41 | dw | 18.00 | 0.90 | 0.42 | ||||
| UGC 2361 | 02 53 34.7 | +41 53 09 | SAB(s)b | 14.40 | 0.90 | 0.78 | 7298 | Huc12 | ||
| UGC 2479 | 03 00 40.2 | +00 01 14 | Sdm: | 15.90 | 1.00 | 0.28 | 2843 | DR12 | 2841 | Hay18 |
| UGC 2480 | 03 01 04.0 | +23 17 35 | 16.50 | 0.93 | 0.62 | |||||
| UGC 2484 | 03 01 47.0 | +42 06 29 | Sc | 17.00 | 0.66 | 0.56 | ||||
| UGC 2496 | 03 02 33.4 | +46 26 17 | Sdm: | 18.00 | 1.00 | 0.10 | 6780 | Mat00 | ||
| UGC 2572 | 03 10 45.0 | +44 11 40 | Sbc | 16.50 | 0.89 | 0.85 | 9496 | Huc12 | ||
| UGC 2681 | 03 20 51.8 | +39 05 44 | Sdm: | 17.00 | 0.50 | 0.46 | ||||
| UGC 2723 | 03 25 15.0 | +42 40 23 | SBc | 16.50 | 1.00 | 0.60 | 8792 | Huc12 | ||
| UGC 2724 | 03 25 25.5 | +40 46 23 | Sdm: | 16.00 | 0.60 | 0.56 | ||||
| UGC 2749 | 03 28 31.1 | +40 03 28 | Sdm: | 16.00 | 0.50 | 0.46 | ||||
| UGC 2777 | 03 32 37.8 | +40 19 15 | Sdm: | 16.50 | 1.00 | 0.22 | ||||
| UGC 2832 | 03 42 12.4 | -00 21 15 | Sc-Irr | 16.30 | 0.80 | 0.25 | 7531 | DR12 | 7593 | Spr05 |
| UGC 2834 | 03 43 24.1 | +42 46 11 | dwIrr | 18.00 | 0.20 | 0.89 | ||||
| UGC 2876 | 03 50 53.0 | +37 36 37 | Sbc | 17.00 | 0.69 | 0.56 | ||||
| UGC 3297 | 05 24 59.0 | +73 18 30 | (multiple) | 16.50 | 0.85 | 0.66 | ||||
| UGC 3389 | 06 03 46.0 | +66 16 44 | Sc | 17.00 | 0.43 | 0.47 | ||||
| UGC 3424 | 06 13 40.7 | +53 06 20 | Im? | 17.00 | 1.10 | 0.43 | ||||
| UGC 3443 | 06 19 59.7 | +51 25 39 | Im? | 17.00 | 0.70 | 0.46 | ||||
| UGC 3527 | 06 48 05.0 | +72 45 17 | Sbc | 16.05 | 0.81 | 0.56 | ||||
| UGC 3773 | 07 16 27.2 | +39 46 59 | Im: | 17.00 | 0.80 | 0.32 | ||||
| UGC 3797 | 07 20 03.0 | +59 22 42 | Sc | 16.00 | 0.76 | 0.58 | 3405 | Rin00 | ||
| UGC 4081 | 07 54 23.9 | +38 40 16 | Im | 16.70 | 0.40 | 0.50 | 5949 | DR12 | ||
| UGC 4360 | 08 26 50.5 | +78 13 42 | Sdm: | 16.50 | 0.80 | 0.30 | ||||
| UGC 4377 | 08 25 02.0 | +67 19 01 | SABc | 16.50 | 0.87 | 0.51 | ||||
| UGC 4476 | 08 35 52.8 | +67 19 05 | dw? | 18.00 | 0.90 | 0.79 | ||||
| UGC 4618 | 08 51 10.0 | +66 16 24 | Sm | 16.50 | 0.78 | 0.66 | ||||
| UGC 4808 | 09 10 14.0 | +59 57 15 | Sc | 15.60 | 1.00 | 0.49 | 1322 | DR13 | ||
| UGC 4976 | 09 22 34.3 | +46 39 26 | SABd: | 16.20 | 0.80 | 0.60 | 4315 | DR12 | ||
| UGC 4979 | 09 22 39.1 | +36 41 15 | Im: | 16.90 | 0.90 | 0.74 | 7971 | DR12 | ||
| UGC 4982 | 09 23 03.0 | +44 33 16 | Sdm: | 14.10 | 1.10 | 0.33 | 2658 | DR12 | 2659 | Van16 |
| UGC 4984 | 09 23 39.7 | +54 29 00 | Sm? | 16.40 | 1.00 | 0.69 | 3448 | DR12 | ||
| UGC 5036 | 09 27 28.8 | +40 49 46 | Sdm: | 16.20 | 0.90 | 0.42 | 4289 | DR12 | ||
| UGC 5047 | 09 28 49.8 | +51 33 37 | Sdm: | 16.20 | 1.40 | 0.25 | 502 | DR12 | 507 | Mat00 |
| UGC 5085 | 09 33 15.8 | +42 20 18 | dw | 17.40 | 0.70 | 0.78 | 8296 | DR12 | ||
| UGC 5091 | 09 33 50.6 | +44 15 23 | Sdm: | 15.10 | 0.80 | 0.39 | 3396 | DR12 | ||
| UGC 5127 | 09 37 45.0 | +37 05 19 | SABc | 15.96 | 0.98 | 0.46 | 4506 | DR13 | ||
| UGC 5169 | 09 41 46.4 | +46 58 26 | S | 15.40 | 1.00 | 0.00 | 7674 | DR12 | ||
| UGC 5293 | 09 52 14.0 | +41 15 34 | SABc | 16.50 | 0.87 | 0.55 | ||||
| UGC 5348 | 09 58 01.1 | +47 19 27 | Sdm: | 16.00 | 1.00 | 0.30 | 489 | DR12 | ||
| UGC 5429 | 10 04 46.1 | +44 42 19 | Sdm: | 16.30 | 0.90 | 0.87 | 6927 | DR12 | ||
| UGC 5496 | 10 12 08.4 | +46 17 37 | Sdm: | 15.30 | 1.20 | 0.32 | 7274 | DR12 | ||
| UGC 5754 | 10 36 12.0 | +42 39 30 | SBc | 16.32 | 0.74 | 0.55 | 3219 | DR13 | ||
| UGC 5876 | 10 46 36.0 | +52 08 58 | Sc | 15.74 | 0.98 | 0.54 | 6547 | DR13 | ||
| UGC 5983 | 10 52 16.0 | +36 35 39 | I | 16.53 | 1.00 | 0.23 | 699 | DR13 | ||
| UGC 6005 | 10 53 27.9 | +46 01 09 | 16.80 | 0.90 | 0.72 | 722 | DR12 | |||
| UGC 6032 | 10 56 09.0 | +72 53 42 | SABc | 16.50 | 1.20 | 0.41 | ||||
| UGC 6039 | 10 56 20.0 | +56 45 34 | SBcd | 16.23 | 1.00 | 0.42 | 1844 | DR13 | ||
| UGC 6179 | 11 07 58.0 | +63 55 34 | Sab | 15.96 | 1.48 | 0.45 | 13145 | DR13 | ||
| UGC 6369 | 11 21 27.6 | +57 46 04 | dwS | 16.70 | 0.90 | 0.93 | 1918 | DR12 | ||
| UGC 6381 | 11 22 16.5 | +69 07 15 | Sm: | 17.00 | 1.30 | 0.78 | ||||
| UGC 6455 | 11 27 21.0 | +40 00 47 | SBb | 15.44 | 1.55 | 0.42 | 2013 | DR13 | ||
| UGC 6489 | 11 29 11.0 | +42 31 33 | SBb | 15.70 | 1.32 | 0.54 | 13316 | DR13 | ||
| UGC 6919 | 11 56 37.5 | +55 37 57 | Sdm: | 15.20 | 1.60 | 0.30 | 1290 | DR12 | 1309 | Van16 |
| UGC 6988 | 11 59 51.6 | +55 39 56 | Im: | 16.20 | 1.30 | 0.32 | 732 | DR12 | ||
| UGC 6992 | 12 00 18.9 | +50 39 11 | Sdm: | 14.80 | 1.30 | 0.46 | 742 | DR12 | ||
| UGC 6999 | 12 01 01.4 | +49 54 46 | Im: | 18.20 | 1.00 | 0.40 | 912 | DR12 | ||
| UGC 7146 | 12 09 49.0 | +43 14 02 | I | 16.35 | 1.05 | 0.74 | 1065 | DR5 | 1059 | Van16 |
| UGC 7553 | 12 27 03.6 | -01 30 59 | Sdpec | 16.60 | 0.90 | 0.17 | 8814 | DR13 | ||
| UGC 7945 | 12 47 01.0 | -01 34 40 | SA(s)m? | 15.10 | 1.10 | 0.60 | 2712 | DR12 | ||
| UGC 7953 | 12 10 10.0 | +49 17 10 | Sc | 16.20 | 0.81 | 0.42 | 1093 | DR13 | ||
| UGC 8107 | 12 59 39.0 | +53 20 26 | Ibm: | 14.60 | 2.30 | 0.43 | 8294 | DR12 | 8302 | Mas14 |
| UGC 8123 | 13 00 34.6 | +37 04 18 | Sc-Irr | 16.50 | 1.00 | 0.30 | 4647 | DR12 | ||
| UGC 8198 | 13 06 24.5 | +48 57 44 | Sdm: | 16.40 | 0.60 | 0.76 | 10279 | DR12 | ||
| UGC 8222 | 13 08 17.6 | +52 00 26 | 16.00 | 0.90 | 0.69 | 4640 | DR12 | |||
| UGC 8274 | 13 11 41.2 | +50 14 48 | SBdm | 17.00 | 1.10 | 0.46 | 4761 | DR12 | ||
| UGC 8430 | 13 24 12.0 | +41 49 10 | SBcd | 15.71 | 0.98 | 0.66 | 7235 | DR13 | ||
| UGC 8491 | 13 29 31.6 | +62 49 34 | Irr | 16.40 | 1.00 | 0.22 | 2792 | DR12 | ||
| UGC 8509 | 13 28 19.5 | +67 37 57 | Im: | 16.70 | 1.00 | 0.56 | 1004 | DR12 | ||
| UGC 8542 | 13 33 31.8 | +38 36 20 | 15.80 | 0.70 | 0.81 | 1190 | DR12 | 1188 | Van16 | |
| UGC 8601 | 13 36 31.3 | +47 44 13 | dwS | 16.70 | 1.00 | 0.81 | 2283 | DR12 | ||
| UGC 8644 | 13 40 01.0 | +07 22 02 | Sd | 15.96 | 0.71 | 0.66 | 6984 | DR13 | 6984 | Hay18 |
| UGC 8659 | 13 40 34.4 | +55 25 44 | Im: | 16.70 | 0.80 | 0.91 | 5006 | DR12 | ||
| UGC 8743 | 13 49 18.0 | +58 39 54 | SBcd | 15.86 | 0.81 | 0.39 | 1752 | DR13 | 1752 | Van16 |
| UGC 8802 | 13 53 08.0 | +35 42 50 | Scd | 16.50 | 0.91 | 0.46 | 12330 | DR13 | 12340 | Hay18 |
| UGC 8858 | 13 56 04.3 | +38 18 15 | Sdm: | 15.20 | 0.90 | 0.59 | 5616 | DR12 | ||
| UGC 8970 | 14 02 48.0 | +57 58 29 | SABd | 15.80 | 1.10 | 0.65 | 1798 | DR13 | ||
| UGC 8985 | 14 03 08.9 | +59 26 00 | SABdm: | 16.10 | 1.20 | 0.32 | 3010 | DR12 | ||
| UGC 9028 | 14 06 06.0 | +67 29 06 | SABd | 16.50 | 0.71 | 0.66 | ||||
| UGC 9051 | 14 08 26.7 | +54 54 31 | 16.20 | 0.70 | 0.47 | 1441 | DR12 | |||
| UGC 9272 | 14 26 53.0 | +61 11 40 | Sc | 16.07 | 0.76 | 0.43 | 6696 | DR13 | ||
| UGC 9446 | 14 39 09.0 | +38 15 49 | SBcd | 16.56 | 0.68 | 0.52 | 3796 | DR13 | ||
| UGC 9551 | 14 50 41.6 | -01 46 37 | Sd: | 15.60 | 0.70 | 0.76 | 7884 | DR12 | ||
| UGC 9783 | 15 14 16.0 | +46 20 20 | 16.40 | 0.90 | 0.44 | 11168 | DR13 | |||
| UGC 10570 | 16 48 34.0 | +59 29 47 | SABc | 16.00 | 0.55 | 0.49 | ||||
| UGC 10594 | 16 52 48.6 | +51 03 39 | 15.30 | 1.00 | 0.26 | 8919 | DR12 | 8849 | Mas14 | |
| UGC 10666 | 17 02 13.0 | +30 44 19 | Sb | 16.44 | 0.51 | 0.72 | ||||
| UGC 10668 | 17 02 13.0 | +30 44 19 | S0 | 15.08 | 0.72 | 0.76 | 10162 | Mar96 | ||
| UGC 10794 | 17 17 42.1 | +40 26 49 | Sdm: | 16.30 | 1.00 | 0.27 | ||||
| UGC 11032 | 17 53 18.0 | +51 27 21 | Sm | 17.00 | 0.43 | 0.65 | ||||
| UGC 11054 | 17 53 35.0 | +71 32 54 | 16.50 | 0.60 | 0.39 | |||||
| UGC 11383 | 18 55 59.0 | +59 07 31 | Scd | 16.50 | 0.91 | 0.66 | ||||
| UGC 11476 | 19 45 58.0 | +67 59 15 | Sbc | 15.53 | 1.29 | 0.47 | ||||
| UGC 11665 | 21 02 17.0 | +07 25 54 | Sbc | 16.00 | 1.00 | 0.42 | 5953 | Spr05 | ||
| UGC 11900 | 22 04 58.0 | +44 03 33 | Scd | 17.00 | 0.79 | 0.43 | 9403 | Huc12 | ||
| UGC 11960 | 22 14 37.0 | +41 26 23 | SABc | 16.50 | 0.76 | 0.63 | ||||
| UGC 12568 | 23 22 57.0 | +42 41 03 | Sd | 17.00 | 0.60 | 0.63 | ||||
| UGC 12797 | 23 49 33.0 | +46 06 52 | (SBc) | 16.50 | 0.66 | 0.32 | ||||
| Spurious H I Detections | ||||||||||
| CGMW 1-0409 | 06 49 39.0 | -14 24 36 | 0.41 | 1.00 | 2802 | Rya02 | ||||
| PGC 3995805 | 07 49 33.0 | +39 44 24 | I | 17.38 | 0.54 | 0.78 | 2943 | DR13 | ||
| UGC 2305 | 02 49 37.9 | +38 15 41 | dw | 18.00 | 0.90 | 0.42 | ||||
| UGC 5412 | 10 03 51.0 | +50 20 53 | 15.95 | 0.95 | 0.45 | 9610 | DR13 | |||
| H I Non-detections | ||||||||||
| ESO 366-014 | 06 43 53.0 | -37 07 46 | Sa | 15.53 | 1.00 | 0.26 | 9229 | Huc12 | ||
| ESO 435-001 | 09 50 05.0 | -29 25 30 | (N) | 14.88 | 0.51 | 0.54 | 1164 | 6dF | ||
| ESO 491-002 | 06 50 37.0 | -23 22 47 | Sbc | 16.31 | 1.07 | 0.38 | ||||
| ESO 527-015 | 20 13 40.0 | -27 05 52 | Sbc | 18.08 | 0.45 | 0.47 | ||||
| ESO 540-030 | 00 49 21.0 | -18 04 33 | SABm | 16.45 | 0.66 | 0.71 | 224 | Bou09 | ||
| ESO 582-010 | 15 24 03.0 | -18 40 57 | I | 17.45 | 0.55 | 0.63 | ||||
| ESO 598-019 | 21 03 32.0 | -20 09 15 | Sbc | 17.15 | 0.71 | 0.47 | ||||
| PGC 4620 | 01 16 57.0 | +43 37 17 | Sbc | 15.65 | 0.76 | 0.39 | ||||
| PGC 6166 | 01 40 01.0 | +33 04 15 | 18.03 | 0.35 | 0.46 | |||||
| PGC 13131 | 03 32 29.0 | -36 05 16 | IB | 17.13 | 0.95 | 0.85 | ||||
| PGC 18942 | 06 23 35.0 | -10 12 58 | IB | 17.49 | 0.49 | 0.65 | ||||
| PGC 21302 | 07 34 11.0 | +66 52 47 | I | 15.65 | 2.95 | 0.65 | ||||
| PGC 21907 | 07 49 39.0 | +39 43 08 | Sc | 17.06 | 0.44 | 0.41 | ||||
| PGC 22928 | 08 10 23.0 | +42 16 25 | E-S0 | 15.68 | 1.26 | 0.54 | 19037 | DR13 | ||
| PGC 30860 | 10 28 57.0 | -35 48 15 | IAB | 17.80 | 1.35 | 0.72 | ||||
| PGC 39076 | 12 14 11.0 | +15 58 01 | I | 17.20 | 0.93 | 0.89 | ||||
| PGC 40135 | 12 22 47.0 | +11 20 58 | S? | 17.19 | 1.02 | 0.66 | ||||
| PGC 40267 | 12 23 46.0 | +16 47 28 | Sm | 16.98 | 0.89 | 0.60 | ||||
| PGC 52168 | 14 35 25.0 | +73 22 28 | 0.60 | 0.89 | 11482 | Kaz02 | ||||
| PGC 60361 | 17 28 40.0 | +52 45 24 | 17.53 | 0.60 | 0.42 | |||||
| PGC 70074 | 22 56 38.0 | -17 16 59 | 20.34 | 0.34 | 0.60 | |||||
| PGC 75981 | 06 43 27.0 | -06 43 36 | I | 17.63 | 0.52 | 0.50 | ||||
| PGC 77140 | 07 23 16.0 | -06 05 05 | 17.10 | 0.79 | 0.39 | |||||
| PGC 79534 | 08 03 28.0 | -18 26 14 | Sbc | 17.18 | 0.65 | 0.40 | ||||
| PGC 83540 | 12 15 27.0 | +37 07 17 | Sc | 16.89 | 0.55 | 0.50 | 18786 | DR13 | ||
| PGC 87255 | 10 18 35.0 | +14 51 06 | S0-a | 16.33 | 1.00 | 0.49 | 21465 | DR13 | ||
| PGC 91383 | 14 41 57.0 | +28 25 54 | Sc | 17.58 | 0.56 | 0.41 | 25970 | DR13 | ||
| PGC 2815827 | 15 59 50.0 | -31 17 12 | I | 16.00 | 1.66 | 0.55 | ||||
| UGC 45 | 00 06 13.5 | +54 31 55 | Sdm | 15.45 | 0.90 | 0.34 | 5588 | Huc12 | ||
| UGC 190 | 00 20 11.0 | +42 34 16 | Sd-dm | 16.50 | 0.60 | 0.54 | ||||
| UGC 239 | 00 29 29.0 | +26 22 39 | ?? | 17.12 | 0.65 | 0.43 | 23225 | DR13 | ||
| UGC 502 | 00 49 03.0 | +46 09 26 | Sm | 18.00 | 0.32 | 0.87 | ||||
| UGC 1800 | 02 20 29.0 | +35 12 18 | Sbc | 15.77 | 1.48 | 0.50 | 11378 | Huc12 | ||
| UGC 1836 | 02 22 52.1 | +38 04 12 | Im? | 18.00 | 0.40 | 0.74 | ||||
| UGC 2314 | 02 50 19.5 | +47 30 40 | Im: | 18.00 | 1.30 | 1.00 | ||||
| UGC 2436 | 02 58 15.7 | +36 29 58 | Sdm: | 17.00 | 1.10 | 0.28 | ||||
| UGC 2668 | 03 19 45.0 | +40 28 32 | I | 16.50 | 1.15 | 1.00 | 5459 | DR13 | ||
| UGC 3041 | 04 25 43.0 | +00 35 28 | Sc | 16.50 | 0.83 | 0.37 | 4930 | 6dF | ||
| UGC 3566 | 06 51 33.3 | +41 46 16 | dwS | 18.00 | 0.70 | 1.00 | ||||
| UGC 3814 | 07 22 25.2 | +49 16 40 | Sc-Irr | 17.00 | 1.00 | 0.31 | ||||
| UGC 3963 | 07 41 32.2 | +51 41 18 | Sdm: | 16.50 | 1.30 | 0.21 | 20236 | Huc12 | ||
| UGC 4194 | 08 05 51.3 | +72 31 19 | Sdm: | 16.50 | 0.80 | 0.72 | ||||
| UGC 5071 | 09 31 21.5 | +42 22 10 | dw? | 18.00 | 0.30 | 0.55 | ||||
| UGC 5613 | 10 23 32.6 | +52 20 31 | Sdm: | 15.00 | 0.90 | 0.46 | 9656 | DR12 | ||
| UGC 6812 | 11 50 35.3 | +50 34 46 | Sdm: | 16.90 | 0.40 | 0.58 | 6785 | DR12 | ||
| UGC 7110 | 12 07 26.2 | +65 24 42 | Sm: | 16.60 | 1.00 | 0.83 | 1427 | DR12 | ||
| UGC 8176 | 13 05 14.6 | -00 22 23 | 17.00 | 1.10 | 0.19 | 6803 | DR12 | |||
| UGC 10704 | 17 01 49.0 | +79 02 15 | Sbc | 15.74 | 1.02 | 0.54 | 19303 | Ber02 | ||
| UGC 11207 | 18 20 21.0 | +47 53 59 | Sbc | 16.62 | 0.91 | 0.89 | ||||
| Target galaxies outside the H I search range | ||||||||||
| UGC 4879 | 09 16 03.3 | +52 50 29 | Iam | 13.80 | 2.10 | 0.62 | -25 | Bel11b | -86 | Bel11b |
| UGC 5442 | 10 07 01.7 | +67 49 37 | Im: | 16.70 | 1.70 | 0.89 | -17 | Sim02 | ||
| UGC 5692 | 10 30 34.6 | +70 37 13 | Sm: | 11.60 | 3.50 | 0.85 | 56 | Mak03 | ||
| UGC 6757 | 11 46 59.1 | +61 20 10 | dw | 19.00 | 0.90 | 0.55 | 81 | DR12 | ||
| UGC 8245 | 13 08 34.5 | +78 56 11 | Im | 14.62 | 1.40 | 0.40 | -25 | Bra17 | ||
| UGC 9749 | 15 09 11.3 | +67 12 46 | E | 15.27 | 0.60 | 0.55 | -255 | Ste84 | ||
| UGC 10642 | 16 59 51.1 | -00 32 00 | dw | 15.68 | 0.60 | 0.66 | 32 | NED | ||
| UGC 10822 | 17 20 12.3 | +57 54 55 | Epec | 12.25 | 37.20 | 0.79 | -296 | Ste84 | ||
Note. — Velocity references: 6dF – Jones et al. (2009b); Bel11a – Bellazzini et al. (2011b); Bel11b – Bellazzini et al. (2011a); Ber02 – Berrington et al. (2002) Bil14 – Bilicki et al. (2014); Bou09 – Bouchard et al. (2009); Bra03 – Braun et al. (2003); Bra17 – Bralts-Kelly et al. (2017); Dab16 – Dabringhausen & Fellhauer (2016); Col01 – Colless et al. (2001); Cou09 – Courtois et al. (2009); DR4 – Abazajian et al. (2004); DR5 – Adelman-McCarthy et al. (2007); DR7 – Ann et al. (2015); DR9 – Ahn et al. (2012); DR12 – Alam et al. (2015); DR13 – Albareti et al. (2017); Fal99 – Falco et al. (1999); Geh17 – Geha et al. (2017); Hay18 – Haynes et al. (2018); Huc01 – Huchtmeier et al. (2001b); Huc12 – Huchra et al. (2012a); Huc83 – Huchra et al. (1983); Huc99 – Huchra et al. (1999); Imp96 – Impey et al. (1996); Imp01 – Impey et al. (2001); Jon05 – Jones et al. (2005); Jon09 – Jones et al. (2009a); Kar13 – Karachentsev et al. (2013); Kar84 – Karachentsev & Karachentseva (1984); Kaz02 – Kazarian & Karapetian (2002); Kou17 – Kourkchi & Tully (2017); Mak01 – Makarov et al. (2001); Mak03 – Makarov et al. (2003); Mak97 – Makarov et al. (1997); Mar96 – Marzke et al. (1996); Mas14 – Masters et al. (2014); Mat00 – Matthews & van Driel (2000); Mat96 – Matthews & Gallagher (1996); Mey04 – Meyer et al. (2004); Mon03 – Monnier Ragaigne et al. (2003a); NED – Ned Team (1992); Pat03 – Paturel et al. (2003); Pro08 – Proctor et al. (2008); Ram16 – Ramatsoku et al. (2016); Rin00 – Rines et al. (2000); Rin03 – Rines et al. (2003); Rin16 – Rines et al. (2016); Rya02 – Ryan-Weber et al. (2002); Sim02 – Simien & Prugniel (2002); Spr05 – Springob et al. (2005); Ste84 – Stetson (1984); Sta16 – Staveley-Smith et al. (2016); Str88 – Strauss & Davis (1988); The05 – Theureau et al. (2005); The98 – Theureau et al. (1998); Van16 – van Driel et al. (2016); Ver06 – Véron-Cetty et al. (2006); War07 – Warren et al. (2007); Zab98 – Zabludoff & Mulchaey (1998);
| Name | Sample | Notes | Conf. | error | r.m.s. | flux | error | log(/) | error | Tel. | ||||
|---|---|---|---|---|---|---|---|---|---|---|---|---|---|---|
| (km s-1) | (km s-1) | mJy | (Jy km s-1) | |||||||||||
| CGMW1-0409 | HLS | Y | 1 | 2805 | 1 | 132 | 177 | 147 | 1.70 | 8.59 | 0.19 | 9.51 | 0.01 | G |
| ESO 300-020 | HL | N | 1 | 13256 | 5 | 81 | 110 | 85 | 1.46 | 0.22 | 0.10 | 9.27 | 0.20 | G |
| ESO 338-020 | HL | Y | 3 | 6377 | 6 | 379 | 438 | 396 | 4.11 | 3.88 | 0.76 | 9.88 | 0.09 | N |
| ESO 346-034 | HL | N | 1 | 1805 | 14 | 58 | 80 | 107 | 1.60 | 0.89 | 0.16 | 8.12 | 0.08 | G |
| ESO 359-009 | HL | N | 1 | 5850 | 7 | 221 | 265 | 247 | 4.08 | 3.24 | 0.44 | 9.72 | 0.06 | N |
| ESO 368-004 | HL | Y | 1 | 1397 | 2 | 77 | 114 | 95 | 4.08 | 13.98 | 0.12 | 9.07 | 0.00 | NGG |
| ESO 371-004 | HL | N | 1 | 1393 | 4 | 74 | 98 | 102 | 4.11 | 3.18 | 0.29 | 8.43 | 0.04 | N |
| ESO 371-007 | HL | N | 1 | 2454 | 3 | 132 | 173 | 150 | 4.16 | 3.28 | 0.35 | 8.98 | 0.05 | N |
| ESO 371-017 | HL | N | 1 | 1604 | 5 | 175 | 200 | 189 | 1.86 | 0.83 | 0.24 | 7.98 | 0.12 | N |
| ESO 377-005 | HL | N | 1 | 2519 | 5 | 45 | 70 | 65 | 4.96 | 1.29 | 0.28 | 8.57 | 0.09 | N |
| ESO 377-045 | HL | Y | 1 | 3125 | 16 | 108 | 156 | 171 | 4.48 | 2.44 | 0.41 | 9.05 | 0.07 | N |
| ESO 385-016 | HL | N | 1 | 8283 | 32 | 139 | 176 | 214 | 3.63 | 1.61 | 0.49 | 9.72 | 0.13 | N |
| ESO 396-006 | HL | N | 1 | 5851 | 4 | 157 | 270 | 179 | 2.39 | 2.46 | 0.22 | 9.60 | 0.04 | N |
| ESO 398-011 | HL | Y | 2 | 5518 | 10 | 175 | 200 | 211 | 3.31 | 2.31 | 0.33 | 9.52 | 0.06 | N |
| ESO 424-009 | HL | N | 1 | 4057 | 4 | 146 | 184 | 169 | 1.00 | 3.25 | 0.23 | 9.39 | 0.03 | NG |
| ESO 424-031 | HL | N | 1 | 3720 | 2 | 144 | 167 | 158 | 2.10 | 3.10 | 0.18 | 9.31 | 0.03 | N |
| ESO 427-009 | HL | N | 1 | 2711 | 2 | 149 | 175 | 161 | 2.41 | 3.79 | 0.21 | 9.11 | 0.02 | N |
| ESO 433-013 | HL | N | 1 | 8644 | 8 | 315 | 391 | 342 | 1.40 | 2.30 | 0.24 | 9.91 | 0.05 | G |
| ESO 435-002 | HL | N | 1 | 2703 | 1 | 118 | 156 | 132 | 2.44 | 3.35 | 0.19 | 9.06 | 0.02 | N |
| ESO 436-021 | HL | N | 1 | 3696 | 12 | 111 | 145 | 149 | 2.00 | 1.40 | 0.24 | 8.95 | 0.07 | G |
| ESO 451-006 | HL | N | 1 | 4260 | 2 | 176 | 207 | 185 | 2.60 | 2.40 | 0.25 | 9.31 | 0.05 | N |
| ESO 463-005 | HL | Y | 2 | 3014 | 7 | 159 | 196 | 191 | 1.41 | 3.26 | 0.17 | 9.15 | 0.02 | NG |
| ESO 482-024 | HL | Y | 3 | 4337 | 3 | 154 | 191 | 175 | 2.60 | 3.02 | 0.24 | 9.42 | 0.03 | N |
| ESO 484-018 | HL | N | 1 | 2122 | 2 | 50 | 68 | 75 | 2.08 | 2.21 | 0.12 | 8.67 | 0.02 | N |
| ESO 487-033 | HL | N | 1 | 21065 | 15 | 156 | 190 | 184 | 0.82 | 1.22 | 0.10 | 10.41 | 0.04 | G |
| ESO 490-040 | HL | N | 1 | 7794 | 2 | 184 | 275 | 188 | 1.50 | 0.71 | 0.20 | 9.31 | 0.12 | G |
| ESO 491-003 | HL | Y | 1 | 7167 | 13 | 202 | 222 | 221 | 0.80 | 1.94 | 0.11 | 9.68 | 0.02 | NG |
| ESO 492-001 | HL | Y | 1 | 6595 | 16 | 179 | 244 | 250 | 0.80 | 3.86 | 0.57 | 9.90 | 0.06 | NGG |
| ESO 493-006 | HL | N | 1 | 7948 | 45 | 411 | 462 | 531 | 2.43 | 3.04 | 0.52 | 9.96 | 0.07 | N |
| ESO 500-014 | HL | N | 1 | 2604 | 7 | 145 | 219 | 168 | 4.03 | 2.14 | 0.36 | 8.84 | 0.07 | N |
| ESO 501-029 | HL | Y | 3 | 1016 | 1 | 83 | 105 | 100 | 1.40 | 3.91 | 0.16 | 8.26 | 0.02 | G |
| ESO 501-093 | HL | N | 1 | 3595 | 15 | 166 | 232 | 180 | 1.03 | 1.36 | 0.12 | 8.92 | 0.04 | G |
| ESO 510-062 | HL | N | 1 | 6236 | 6 | 135 | 162 | 146 | 3.32 | 0.57 | 0.37 | 9.03 | 0.28 | N |
| ESO 513-023 | HL | N | 1 | 6442 | 4 | 280 | 327 | 292 | 0.28 | 2.06 | 1.70 | 9.61 | 0.36 | G |
| ESO 515-002 | HL | N | 1 | 6933 | 9 | 329 | 393 | 345 | 2.96 | 1.45 | 0.38 | 9.52 | 0.11 | N |
| ESO 525-005 | HL | N | 1 | 1949 | 2 | 71 | 116 | 90 | 2.97 | 2.51 | 0.20 | 8.63 | 0.03 | N |
| ESO 527-003 | HL | N | 1 | 5956 | 2 | 101 | 186 | 117 | 2.27 | 3.15 | 0.17 | 9.73 | 0.02 | N |
| ESO 540-032 | HL | N | 1 | 228 | 3 | 31 | 55 | 43 | 2.13 | 0.31 | 0.13 | 5.82 | 0.18 | N |
| ESO 549-047 | HL | N | 1 | 4223 | 3 | 147 | 177 | 164 | 2.56 | 2.31 | 0.23 | 9.29 | 0.04 | N |
| ESO 552-002 | HL | N | 1 | 8435 | 22 | 207 | 256 | 282 | 1.00 | 1.45 | 0.16 | 9.69 | 0.05 | G |
| ESO 568-015 | HL | N | 1 | 992 | 2 | 57 | 73 | 77 | 2.85 | 2.07 | 0.17 | 7.98 | 0.04 | N |
| ESO 569-018 | HL | N | 1 | 3888 | 8 | 147 | 181 | 183 | 5.84 | 5.05 | 0.55 | 9.56 | 0.05 | N |
| ESO 571-013 | HL | N | 1 | 6782 | 18 | 219 | 293 | 272 | 2.59 | 1.84 | 0.40 | 9.60 | 0.09 | N |
| ESO 579-013 | HL | N | 1 | 6358 | 5 | 104 | 128 | 116 | 2.19 | 0.42 | 0.22 | 8.90 | 0.23 | N |
| ESO 580-048 | HL | N | 1 | 4229 | 3 | 132 | 189 | 155 | 2.88 | 4.83 | 0.25 | 9.61 | 0.02 | N |
| IC 3004 | HL | N | 1 | 6341 | 3 | 175 | 204 | 191 | 0.29 | 1.89 | 0.14 | 9.55 | 0.03 | NA |
| IC 3852 | HL | Y | 1 | 4370 | 7 | 239 | 288 | 219 | 0.29 | 3.10 | 0.33 | 9.45 | 0.05 | GAG |
| PGC 000538 | HL | N | 1 | 3890 | 1 | 93 | 124 | 111 | 2.40 | 6.98 | 0.18 | 9.70 | 0.01 | N |
| PGC 001303 | HL | N | 1 | 3566 | 3 | 121 | 150 | 140 | 2.31 | 1.98 | 0.19 | 9.07 | 0.04 | N |
| PGC 001940 | HL | N | 1 | 6215 | 3 | 247 | 283 | 271 | 2.55 | 5.35 | 0.29 | 9.99 | 0.02 | N |
| PGC 002582 | HL | Y | 3 | 15050 | 2 | 384 | 503 | 387 | 1.20 | 1.07 | 0.23 | 10.07 | 0.09 | G |
| PGC 003843 | HL | Y | 1 | 14367 | 10 | 403 | 492 | 456 | 1.00 | 3.56 | 0.21 | 10.55 | 0.03 | G |
| PGC 004099 | HL | N | 1 | 2266 | 1 | 144 | 199 | 163 | 1.95 | 4.99 | 0.17 | 9.08 | 0.01 | N |
| PGC 006960 | HL | N | 1 | 1657 | 4 | 46 | 63 | 68 | 1.95 | 1.01 | 0.11 | 8.10 | 0.05 | N |
| PGC 007225 | HL | Y | 1 | 5193 | 6 | 173 | 208 | 197 | 0.37 | 0.40 | 0.12 | 8.71 | 0.14 | GA |
| PGC 007981 | HL | N | 1 | 5325 | 2 | 181 | 358 | 199 | 0.70 | 2.43 | 0.14 | 9.52 | 0.03 | NA |
| PGC 015169 | HL | N | 1 | 6125 | 7 | 66 | 119 | 103 | 2.88 | 1.41 | 0.20 | 9.40 | 0.06 | N |
| PGC 015921 | HL | N | 1 | 3615 | 2 | 67 | 96 | 90 | 3.14 | 3.13 | 0.21 | 9.28 | 0.03 | N |
| PGC 015936 | HL | N | 1 | 4416 | 3 | 207 | 261 | 228 | 1.70 | 4.81 | 0.25 | 9.65 | 0.02 | G |
| PGC 016370 | HL | Y | 1 | 7082 | 9 | 566 | 1146 | 584 | 0.88 | 3.28 | 0.18 | 9.90 | 0.02 | NG |
| PGC 016496 | HL | N | 1 | 6752 | 15 | 360 | 414 | 430 | 1.09 | 2.04 | 0.20 | 9.65 | 0.04 | G |
| PGC 017124 | HL | Y | 2 | 2449 | 8 | 328 | 409 | 377 | 1.60 | 3.81 | 0.21 | 9.01 | 0.02 | NG |
| PGC 017868 | HL | N | 1 | 3769 | 7 | 219 | 256 | 256 | 2.00 | 4.05 | 0.31 | 9.43 | 0.03 | G |
| PGC 020434 | HL | N | 1 | 6909 | 6 | 421 | 473 | 432 | 4.74 | 3.95 | 0.68 | 9.95 | 0.07 | N |
| PGC 021133 | HL | Y | 1 | 5748 | 17 | 148 | 175 | 195 | 1.20 | 1.47 | 0.28 | 9.36 | 0.08 | NG |
| PGC 021529 | HL | Y | 2 | 4050 | 10 | 170 | 217 | 183 | 0.71 | 3.49 | 0.21 | 9.43 | 0.03 | NGA |
| PGC 021597 | HL | N | 1 | 422 | 10 | 67 | 87 | 104 | 1.40 | 0.74 | 0.21 | 6.80 | 0.13 | NG |
| PGC 023116 | HL | N | 1 | 8552 | 2 | 231 | 276 | 241 | 0.40 | 0.68 | 0.10 | 9.37 | 0.06 | GA |
| PGC 023328 | HL | Y | 2 | 5806 | 22 | 211 | 244 | 277 | 0.41 | 1.04 | 0.21 | 9.22 | 0.09 | NGA |
| PGC 023879 | HL | Y | 2 | 16442 | 15 | 319 | 379 | 351 | 0.83 | 1.14 | 0.14 | 10.17 | 0.05 | G |
| PGC 023958 | HL | N | 1 | 13413 | 15 | 437 | 482 | 449 | 0.82 | 1.84 | 0.16 | 10.20 | 0.04 | G |
| PGC 024439 | HL | N | 1 | 13429 | 30 | 449 | 497 | 526 | 1.22 | 1.93 | 0.25 | 10.22 | 0.06 | G |
| PGC 025010 | HL | N | 1 | 7766 | 2 | 210 | 337 | 216 | 0.70 | 0.75 | 0.10 | 9.33 | 0.06 | G |
| PGC 025621 | HL | N | 1 | 9064 | 5 | 206 | 279 | 229 | 0.60 | 0.62 | 0.08 | 9.38 | 0.06 | A |
| PGC 026708 | HL | Y | 3 | 1169 | 1 | 170 | 194 | 189 | 4.20 | 32.26 | 0.40 | 9.29 | 0.01 | N |
| PGC 026936 | HL | Y | 1 | 4323 | 10 | 146 | 185 | 197 | 0.49 | 1.51 | 0.17 | 9.12 | 0.05 | NA |
| PGC 027485 | HL | Y | 1 | 4394 | 6 | 205 | 275 | 225 | 0.59 | 5.52 | 0.15 | 9.70 | 0.01 | NGA |
| PGC 027849 | HL | Y | 1 | 9425 | 10 | 271 | 557 | 302 | 0.59 | 1.67 | 0.22 | 9.85 | 0.06 | NGAG |
| PGC 028799 | HL | Y | 2 | 4526 | 5 | 184 | 239 | 230 | 1.90 | 0.61 | 0.14 | 8.77 | 0.10 | G |
| PGC 029681 | HL | Y | 2 | 6005 | 10 | 207 | 272 | 254 | 2.97 | 3.09 | 0.44 | 9.72 | 0.06 | N |
| PGC 029916 | HL | N | 1 | 11822 | 3 | 250 | 290 | 273 | 0.49 | 0.70 | 0.07 | 9.67 | 0.04 | A |
| PGC 030113 | HL | Y | 3 | 13402 | 3 | 60 | 78 | 65 | 1.20 | 0.15 | 0.15 | 9.11 | 0.43 | G |
| PGC 030572 | HL | N | 1 | 7463 | 16 | 159 | 233 | 225 | 1.60 | 2.27 | 0.23 | 9.78 | 0.04 | G |
| PGC 032862 | HL | Y | 3 | 13969 | 20 | 380 | 423 | 423 | 1.30 | 1.80 | 0.26 | 10.22 | 0.06 | G |
| PGC 034377 | HL | Y | 2 | 12781 | 4 | 211 | 275 | 231 | 0.37 | 0.47 | 0.05 | 9.56 | 0.05 | A |
| PGC 034409 | HL | N | 1 | 8686 | 9 | 220 | 258 | 252 | 0.45 | 1.03 | 0.20 | 9.57 | 0.09 | NA |
| PGC 034673 | HL | N | 1 | 5368 | 4 | 167 | 199 | 191 | 1.40 | 2.58 | 0.19 | 9.54 | 0.03 | G |
| PGC 034959 | HL | N | 1 | 7404 | 8 | 156 | 202 | 186 | 0.52 | 1.24 | 0.23 | 9.51 | 0.08 | NA |
| PGC 035231 | HL | N | 1 | 1673 | 12 | 94 | 116 | 142 | 1.70 | 1.47 | 0.19 | 8.26 | 0.06 | G |
| PGC 036429 | HL | N | 1 | 1283 | 5 | 35 | 52 | 56 | 4.02 | 0.89 | 0.21 | 7.83 | 0.10 | N |
| PGC 036715 | HL | Y | 3 | 10760 | 5 | 214 | 243 | 254 | 0.57 | 1.07 | 0.08 | 9.77 | 0.03 | A |
| PGC 037416 | HL | N | 1 | 541 | 3 | 81 | 104 | 101 | 0.38 | 0.90 | 0.11 | 7.01 | 0.05 | NA |
| PGC 038080 | HL | N | 1 | 6849 | 24 | 190 | 283 | 277 | 0.38 | 1.23 | 0.21 | 9.43 | 0.08 | NA |
| PGC 038264 | HL | N | 1 | 3772 | 9 | 194 | 239 | 231 | 1.10 | 1.91 | 0.38 | 9.10 | 0.09 | NG |
| PGC 038333 | HL | Y | 3 | 6947 | 17 | 216 | 281 | 233 | 0.28 | 1.01 | 0.04 | 9.37 | 0.02 | NA |
| PGC 038698 | HL | Y | 2 | 6794 | 6 | 124 | 154 | 148 | 5.10 | 2.97 | 0.46 | 9.82 | 0.07 | NG |
| PGC 038958 | HL | Y | 1 | 818 | 5 | 79 | 119 | 109 | 0.08 | 0.73 | 0.80 | 7.31 | 0.48 | G |
| PGC 039438 | HL | N | 1 | 2524 | 1 | 64 | 86 | 81 | 0.46 | 1.53 | 0.04 | 8.67 | 0.01 | A |
| PGC 039701 | HL | Y | 2 | 18768 | 15 | 260 | 291 | 284 | 1.18 | 0.89 | 0.19 | 10.18 | 0.09 | G |
| PGC 040740 | HL | N | 1 | 1853 | 2 | 139 | 292 | 149 | 2.00 | 2.97 | 0.24 | 8.67 | 0.04 | G |
| PGC 041127 | HL | N | 1 | 18959 | 15 | 401 | 668 | 413 | 0.74 | 0.90 | 0.14 | 10.19 | 0.07 | G |
| PGC 041765 | HL | N | 1 | 5616 | 5 | 171 | 208 | 195 | 2.00 | 2.89 | 0.27 | 9.64 | 0.04 | G |
| PGC 043042 | HL | N | 1 | 11647 | 1 | 311 | 358 | 327 | 0.46 | 1.41 | 0.07 | 9.96 | 0.02 | A |
| PGC 043880 | HL | Y | 2 | 9004 | 5 | 235 | 275 | 264 | 2.87 | 2.87 | 0.21 | 10.04 | 0.03 | G |
| PGC 047926 | HL | N | 1 | 4568 | 10 | 86 | 108 | 96 | 1.40 | 0.32 | 0.07 | 8.50 | 0.10 | G |
| PGC 049014 | HL | N | 1 | 8416 | 25 | 292 | 375 | 309 | 0.68 | 0.62 | 0.14 | 9.32 | 0.10 | G |
| PGC 051872 | HL | Y | 2 | 4063 | 5 | 88 | 118 | 127 | 0.35 | 1.39 | 0.17 | 9.04 | 0.05 | NA |
| PGC 056738 | HL | Y | 2 | 9875 | 19 | 199 | 254 | 222 | 0.27 | 0.64 | 0.14 | 9.48 | 0.10 | NA |
| PGC 059812 | HL | N | 1 | 915 | 6 | 116 | 141 | 134 | 1.40 | 0.42 | 0.14 | 7.22 | 0.14 | G |
| PGC 060396 | HL | Y | 2 | 7915 | 15 | 271 | 331 | 294 | 0.86 | 1.57 | 0.13 | 9.67 | 0.04 | G |
| PGC 067570 | HL | Y | 2 | 10110 | 15 | 218 | 281 | 235 | 0.92 | 0.81 | 0.13 | 9.60 | 0.07 | G |
| PGC 072721 | HL | N | 1 | 8371 | 7 | 129 | 175 | 151 | 3.20 | 1.74 | 0.37 | 9.76 | 0.09 | N |
| PGC 073236 | HL | N | 1 | 5183 | 7 | 190 | 225 | 213 | 0.41 | 0.70 | 0.12 | 8.95 | 0.08 | NA |
| PGC 074070 | HL | Y | 2 | 4747 | 5 | 193 | 228 | 222 | 0.80 | 2.42 | 0.23 | 9.41 | 0.04 | NA |
| PGC 076261 | HL | N | 1 | 6270 | 3 | 320 | 378 | 336 | 1.40 | 3.58 | 0.25 | 9.82 | 0.03 | G |
| PGC 077473 | HL | Y | 1 | 8085 | 1 | 304 | 345 | 324 | 1.85 | 7.13 | 0.31 | 10.35 | 0.02 | N |
| PGC 079026 | HL | N | 1 | 6013 | 3 | 190 | 224 | 209 | 0.45 | 1.74 | 0.16 | 9.47 | 0.04 | NA |
| PGC 080280 | HL | N | 1 | 4723 | 1 | 122 | 147 | 134 | 1.20 | 3.27 | 0.13 | 9.54 | 0.02 | G |
| PGC 080973 | HL | N | 1 | 7377 | 4 | 183 | 203 | 196 | 1.30 | 1.83 | 0.24 | 9.68 | 0.06 | NG |
| PGC 082372 | HL | N | 1 | 12731 | 5 | 336 | 442 | 361 | 0.37 | 0.52 | 0.06 | 9.60 | 0.05 | A |
| PGC 082395 | HL | Y | 2 | 13506 | 3 | 251 | 295 | 274 | 0.42 | 0.63 | 0.06 | 9.74 | 0.04 | A |
| PGC 082550 | HL | Y | 1 | 6517 | 14 | 140 | 170 | 186 | 0.68 | 1.52 | 0.29 | 9.49 | 0.08 | NA |
| PGC 085418 | HL | N | 1 | 11907 | 5 | 278 | 327 | 302 | 0.70 | 0.88 | 0.10 | 9.78 | 0.05 | A |
| PGC 085851 | HL | Y | 3 | 8012 | 2 | 151 | 182 | 199 | 0.36 | 1.73 | 0.04 | 9.72 | 0.01 | A |
| PGC 085903 | HL | N | 1 | 11808 | 3 | 297 | 348 | 321 | 0.39 | 1.03 | 0.06 | 9.83 | 0.03 | A |
| PGC 086344 | HL | N | 1 | 5842 | 3 | 220 | 277 | 248 | 1.59 | 4.26 | 0.17 | 9.84 | 0.02 | N |
| PGC 086432 | HL | N | 1 | 10415 | 4 | 249 | 288 | 275 | 0.37 | 0.75 | 0.05 | 9.59 | 0.03 | A |
| PGC 086623 | HL | N | 1 | 2891 | 3 | 141 | 169 | 163 | 0.42 | 1.95 | 0.14 | 8.89 | 0.03 | NA |
| PGC 086863 | HL | Y | 1 | 8118 | 3 | 352 | 401 | 375 | 0.41 | 1.31 | 0.07 | 9.61 | 0.02 | NA |
| PGC 086903 | HL | Y | 1 | 11521 | 2 | 244 | 290 | 261 | 0.55 | 0.93 | 0.07 | 9.77 | 0.03 | A |
| PGC 086979 | HL | N | 1 | 13942 | 8 | 324 | 390 | 365 | 0.37 | 0.71 | 0.06 | 9.82 | 0.04 | A |
| PGC 087248 | HL | N | 1 | 16502 | 4 | 467 | 810 | 492 | 0.43 | 1.14 | 0.08 | 10.17 | 0.03 | A |
| PGC 089535 | HL | Y | 1 | 13387 | 2 | 414 | 470 | 420 | 1.00 | 1.89 | 0.20 | 10.21 | 0.05 | G |
| PGC 089614 | HL | Y | 3 | 20075 | 2 | 395 | 658 | 412 | 0.31 | 0.94 | 0.05 | 10.26 | 0.02 | A |
| PGC 089704 | HL | N | 1 | 6994 | 1 | 208 | 243 | 225 | 0.22 | 1.65 | 0.03 | 9.58 | 0.01 | A |
| PGC 089735 | HL | N | 1 | 7920 | 4 | 219 | 296 | 247 | 0.27 | 0.62 | 0.04 | 9.27 | 0.03 | A |
| PGC 091042 | HL | N | 1 | 21017 | 15 | 281 | 342 | 313 | 1.41 | 0.32 | 0.18 | 9.83 | 0.24 | G |
| PGC 091045 | HL | N | 1 | 15166 | 11 | 394 | 445 | 402 | 1.00 | 0.87 | 0.19 | 9.98 | 0.09 | G |
| PGC 091198 | HL | Y | 2 | 10138 | 2 | 370 | 435 | 393 | 0.39 | 1.45 | 0.07 | 9.85 | 0.02 | A |
| PGC 091391 | HL | N | 1 | 8968 | 9 | 281 | 362 | 313 | 0.27 | 1.48 | 0.21 | 9.75 | 0.06 | NA |
| PGC 091549 | HL | Y | 2 | 17597 | 4 | 496 | 555 | 530 | 0.19 | 0.85 | 0.04 | 10.10 | 0.02 | A |
| PGC 095595 | HL | N | 1 | 1210 | 1 | 97 | 198 | 97 | 1.40 | 1.62 | 0.14 | 8.04 | 0.04 | G |
| PGC 095598 | HL | Y | 2 | 1793 | 1 | 48 | 70 | 60 | 1.10 | 5.19 | 0.08 | 8.88 | 0.01 | G |
| PGC 097032 | HL | N | 1 | 4463 | 2 | 271 | 447 | 304 | 2.57 | 11.44 | 0.42 | 10.03 | 0.02 | N |
| PGC 135624 | HL | Y | 3 | 5382 | 4 | 95 | 150 | 108 | 1.73 | 0.61 | 0.12 | 8.92 | 0.09 | N |
| PGC 135658 | HL | N | 1 | 7971 | 5 | 189 | 286 | 202 | 0.66 | 0.50 | 0.08 | 9.18 | 0.07 | A |
| PGC 135712 | HL | N | 1 | 12113 | 2 | 323 | 660 | 333 | 0.46 | 0.58 | 0.07 | 9.61 | 0.05 | A |
| PGC 135894 | HL | Y | 3 | 10489 | 10 | 182 | 201 | 220 | 0.68 | 2.07 | 0.15 | 10.03 | 0.03 | NGA |
| PGC 137640 | HL | N | 1 | 5048 | 2 | 175 | 193 | 198 | 1.28 | 1.10 | 0.16 | 9.13 | 0.06 | G |
| PGC 166470 | HL | N | 1 | 2096 | 21 | 345 | 388 | 396 | 4.80 | 3.47 | 0.66 | 8.84 | 0.08 | N |
| PGC 166523 | HL | Y | 3 | 7537 | 14 | 218 | 251 | 271 | 2.60 | 2.39 | 0.30 | 9.81 | 0.05 | N |
| PGC 200944 | HL | N | 1 | 6071 | 3 | 133 | 240 | 149 | 0.26 | 1.03 | 0.10 | 9.26 | 0.04 | NA |
| PGC 2815800 | HL | N | 1 | 3541 | 11 | 36 | 57 | 83 | 3.27 | 0.91 | 0.21 | 8.73 | 0.10 | N |
| PGC 2815805 | HL | N | 1 | 3413 | 3 | 39 | 92 | 61 | 3.50 | 1.88 | 0.21 | 9.01 | 0.05 | N |
| PGC 2815809 | HL | Y | 1 | 6645 | 10 | 127 | 216 | 156 | 0.78 | 3.54 | 0.14 | 9.87 | 0.02 | NG |
| PGC 2815811 | HL | N | 1 | 4625 | 6 | 119 | 204 | 160 | 2.65 | 3.50 | 0.23 | 9.55 | 0.03 | N |
| PGC 2815828 | HL | N | 1 | 7833 | 5 | 238 | 419 | 255 | 2.80 | 2.13 | 0.41 | 9.79 | 0.08 | N |
| PGC 2815830 | HL | N | 1 | 6116 | 5 | 97 | 112 | 122 | 1.94 | 2.17 | 0.21 | 9.59 | 0.04 | N |
| PGC 2815836 | HL | N | 1 | 5900 | 15 | 111 | 236 | 141 | 1.10 | 0.34 | 0.11 | 8.75 | 0.14 | G |
| PGC 3995805 | HLS | N | 1 | 2940 | 3 | 90 | 143 | 95 | 3.20 | 0.18 | 0.30 | 7.87 | 0.72 | G |
| UGC 00002 | UGC | N | 1 | 13159 | 15 | 477 | 968 | 522 | 0.69 | 3.26 | 0.14 | 10.43 | 0.02 | G |
| UGC 00263 | UGC | N | 1 | 16853 | 15 | 559 | 592 | 574 | 0.93 | 1.97 | 0.21 | 10.43 | 0.05 | G |
| UGC 00605 | HL | Y | 3 | 19538 | 6 | 722 | 1459 | 749 | 0.45 | 2.33 | 0.11 | 10.63 | 0.02 | GA |
| UGC 00778 | UGC | N | 1 | 6289 | 4 | 349 | 250 | 360 | 4.00 | 3.50 | 0.70 | 9.82 | 0.09 | N-lo/hi |
| UGC 00825 | UGC | N | 1 | 5342 | 4 | 304 | 224 | 328 | 2.30 | 3.20 | 0.40 | 9.64 | 0.05 | N-lo |
| UGC 00854 | HL | N | 1 | 5063 | 6 | 224 | 302 | 267 | 0.44 | 0.80 | 0.06 | 8.99 | 0.03 | A |
| UGC 00856 | UGC | N | 1 | 4772 | 4 | 124 | 132 | 147 | 3.80 | 4.10 | 0.40 | 9.65 | 0.04 | N-lo |
| UGC 01127 | UGC | Y | 1 | 20820 | 15 | 218 | 277 | 263 | 1.19 | 2.41 | 0.18 | 10.70 | 0.03 | G |
| UGC 01134 | UGC | N | 1 | 5404 | 2 | 133 | 125 | 141 | 2.10 | 1.00 | 0.20 | 9.15 | 0.09 | N-lo/hi |
| UGC 01136 | UGC | N | 1 | 6244 | 2 | 60 | 72 | 82 | 1.50 | 1.40 | 0.10 | 9.42 | 0.03 | N-lo/hi |
| UGC 01145 | UGC/HL | Y | 1 | 5809 | 15 | 101 | 216 | 103 | 1.19 | 0.19 | 0.06 | 8.48 | 0.14 | G,N-lo/h |
| UGC 01216 | UGC | Y | 1 | 10741 | 7 | 56 | 68 | 84 | 2.35 | 0.95 | 0.20 | 9.72 | 0.09 | N-lo/hi |
| UGC 01442 | UGC | N | 1 | 4896 | 3 | 180 | 165 | 204 | 3.10 | 4.10 | 0.40 | 9.67 | 0.04 | N-lo |
| UGC 01603 | UGC | N | 1 | 5989 | 2 | 179 | 180 | 195 | 3.60 | 5.50 | 0.50 | 9.98 | 0.04 | N-lo |
| UGC 01615 | UGC | N | 1 | 5743 | 2 | 188 | 193 | 195 | 3.00 | 2.80 | 0.40 | 9.65 | 0.06 | N-lo |
| UGC 01740 | UGC | N | 1 | 6251 | 15 | 178 | 240 | 208 | 1.08 | 1.40 | 0.12 | 9.42 | 0.04 | G |
| UGC 01779 | UGC/HL | N | 1 | 4524 | 4 | 185 | 237 | 202 | 1.08 | 2.79 | 0.30 | 9.43 | 0.05 | NG,N-lo |
| UGC 01783 | UGC | N | 1 | 5167 | 15 | 193 | 277 | 209 | 0.84 | 1.28 | 0.10 | 9.20 | 0.03 | G |
| UGC 01851 | UGC/HL | Y | 1 | 7663 | 9 | 175 | 346 | 192 | 0.84 | 0.93 | 0.04 | 9.41 | 0.02 | NGG |
| UGC 01874 | UGC | N | 1 | 5637 | 3 | 176 | 177 | 189 | 1.60 | 1.10 | 0.20 | 9.22 | 0.08 | N-lo |
| UGC 01927 | UGC | Y | 1 | 6280 | 15 | 278 | 327 | 299 | 0.82 | 1.83 | 0.13 | 9.53 | 0.03 | G |
| UGC 01941 | HL | N | 1 | 13743 | 4 | 361 | 384 | 375 | 1.10 | 1.93 | 0.20 | 10.24 | 0.05 | G |
| UGC 01949 | UGC | N | 1 | 1454 | 6 | 46 | 57 | 92 | 2.30 | 1.50 | 0.20 | 8.18 | 0.06 | N-lo |
| UGC 01953 | HL | N | 1 | 4894 | 13 | 132 | 173 | 162 | 1.20 | 0.89 | 0.26 | 9.00 | 0.12 | NG |
| UGC 02036 | UGC | Y | 2 | 5021 | 14 | 135 | 125 | 210 | 2.80 | 3.60 | 0.40 | 9.64 | 0.05 | N-lo |
| UGC 02068 | UGC | Y | 3 | 5736 | 3 | 609 | 462 | 623 | 2.80 | 7.70 | 0.60 | 10.08 | 0.03 | N-lo |
| UGC 02113 | UGC | Y | 1 | 12831 | 15 | 10 | 20 | 347 | 0.88 | 1.56 | 0.13 | 10.09 | 0.04 | G |
| UGC 02139 | UGC | Y | 1 | 5113 | 15 | 10 | 16 | 94 | 0.73 | 0.88 | 0.13 | 9.04 | 0.06 | G |
| UGC 02172 | UGC | N | 1 | 555 | 5 | 53 | 61 | 81 | 4.60 | 2.20 | 0.40 | 7.51 | 0.08 | N-lo |
| UGC 02224 | HL | N | 1 | 11217 | 21 | 475 | 540 | 523 | 1.40 | 2.49 | 0.31 | 10.18 | 0.05 | G |
| UGC 02235 | UGC/HL | Y | 3 | 5577 | 6 | 258 | 325 | 283 | 3.13 | 2.22 | 0.33 | 9.51 | 0.06 | N |
| UGC 02250 | UGC | N | 1 | 11409 | 5 | 56 | 82 | 88 | 1.32 | 1.10 | 0.13 | 9.83 | 0.05 | G |
| UGC 02269 | UGC | N | 1 | 10280 | 12 | 392 | 388 | 428 | 4.60 | 4.00 | 0.90 | 10.31 | 0.10 | N-lo |
| UGC 02284 | UGC | N | 1 | 7429 | 2 | 108 | 112 | 121 | 3.60 | 2.90 | 0.40 | 9.89 | 0.06 | N-lo |
| UGC 02301 | UGC | Y | 1 | 1746 | 16 | 82 | 81 | 149 | 3.50 | 1.90 | 0.40 | 8.44 | 0.09 | N-lo |
| UGC 02305 | UGCS | Y | 1 | 5414 | 10 | 188 | 169 | 222 | 4.10 | 3.00 | 0.60 | 9.63 | 0.09 | N-lo |
| UGC 02361 | UGC | N | 1 | 7356 | 4 | 315 | 312 | 325 | 3.50 | 1.80 | 0.60 | 9.67 | 0.14 | N-lo |
| UGC 02479 | UGC | N | 1 | 2844 | 2 | 203 | 167 | 218 | 2.30 | 5.30 | 0.30 | 9.31 | 0.02 | N-lo |
| UGC 02480 | HL | Y | 2 | 10140 | 6 | 241 | 266 | 263 | 0.77 | 0.85 | 0.11 | 9.62 | 0.06 | GA |
| UGC 02484 | HL | N | 1 | 8981 | 4 | 273 | 331 | 291 | 2.63 | 3.26 | 0.31 | 10.10 | 0.04 | N |
| UGC 02496 | UGC | N | 1 | 6773 | 4 | 333 | 214 | 350 | 2.90 | 2.20 | 0.50 | 9.68 | 0.10 | N-lo |
| UGC 02505 | UGC/HL | Y | 1 | 4073 | 7 | 193 | 232 | 206 | 2.63 | 1.07 | 0.10 | 8.93 | 0.04 | NGG |
| UGC 02572 | HL | N | 1 | 9508 | 8 | 427 | 525 | 469 | 0.80 | 2.86 | 0.17 | 10.09 | 0.03 | G |
| UGC 02681 | UGC | N | 1 | 5543 | 15 | 219 | 276 | 223 | 1.41 | 0.92 | 0.19 | 9.13 | 0.09 | G |
| UGC 02723 | HL | N | 1 | 8866 | 15 | 386 | 472 | 399 | 0.70 | 0.70 | 0.13 | 9.42 | 0.08 | G |
| UGC 02749 | UGC | Y | 3 | 4207 | 5 | 238 | 214 | 267 | 4.80 | 6.00 | 0.70 | 9.71 | 0.05 | N-lo |
| UGC 02777 | UGC | N | 1 | 4452 | 15 | 317 | 339 | 341 | 0.80 | 1.89 | 0.13 | 9.25 | 0.03 | G |
| UGC 02832 | UGC | N | 1 | 7602 | 7 | 251 | 199 | 275 | 2.90 | 2.90 | 0.40 | 9.91 | 0.06 | N-lo |
| UGC 02834 | UGC | N | 1 | 10330 | 3 | 137 | 146 | 149 | 2.90 | 1.30 | 0.30 | 9.82 | 0.10 | N-lo |
| UGC 02876 | UGC | N | 1 | 5309 | 7 | 216 | 250 | 228 | 1.64 | 1.86 | 0.24 | 9.39 | 0.06 | NG |
| UGC 03297 | HL | N | 1 | 4673 | 1 | 174 | 205 | 187 | 1.60 | 3.81 | 0.21 | 9.59 | 0.02 | G |
| UGC 03389 | HL | N | 1 | 6156 | 13 | 156 | 188 | 407 | 1.40 | 1.45 | 0.49 | 9.41 | 0.15 | NG |
| UGC 03424 | UGC | N | 1 | 5669 | 7 | 240 | 279 | 273 | 1.40 | 1.59 | 0.08 | 9.38 | 0.02 | GU |
| UGC 03443 | UGC | N | 1 | 10302 | 3 | 300 | 266 | 315 | 2.60 | 2.80 | 0.40 | 10.15 | 0.06 | N-lo |
| UGC 03527 | HL | N | 1 | 2676 | 4 | 179 | 202 | 192 | 6.22 | 3.46 | 0.60 | 9.07 | 0.08 | N |
| UGC 03773 | UGC | N | 1 | 5339 | 2 | 222 | 186 | 234 | 2.20 | 2.50 | 0.30 | 9.53 | 0.05 | N-lo |
| UGC 03797 | HL | Y | 3 | 3399 | 15 | 163 | 256 | 217 | 3.47 | 2.86 | 0.48 | 9.19 | 0.07 | N |
| UGC 04081 | UGC | N | 1 | 5956 | 3 | 229 | 210 | 249 | 2.60 | 4.20 | 0.40 | 9.85 | 0.04 | N-lo |
| UGC 04360 | UGC | N | 1 | 3940 | 15 | 201 | 291 | 217 | 0.86 | 1.43 | 0.11 | 9.02 | 0.03 | G |
| UGC 04377 | HL | N | 1 | 4436 | 16 | 402 | 459 | 482 | 1.00 | 3.17 | 0.20 | 9.47 | 0.03 | G |
| UGC 04476 | UGC | N | 1 | 6831 | 3 | 136 | 143 | 148 | 3.30 | 1.40 | 0.40 | 9.50 | 0.12 | N-lo |
| UGC 04618 | UGC | N | 1 | 7150 | 15 | 216 | 257 | 245 | 1.21 | 1.20 | 0.17 | 9.47 | 0.06 | G |
| UGC 04808 | HL | N | 1 | 1309 | 15 | 155 | 177 | 173 | 1.14 | 0.99 | 0.13 | 7.88 | 0.06 | G |
| UGC 04976 | UGC | N | 1 | 4350 | 3 | 233 | 222 | 255 | 3.20 | 6.10 | 0.50 | 9.74 | 0.04 | N-lo |
| UGC 04979 | UGC | N | 1 | 7967 | 5 | 192 | 193 | 210 | 2.20 | 1.80 | 0.30 | 9.74 | 0.07 | N-lo |
| UGC 04982 | UGC | N | 1 | 2661 | 7 | 274 | 228 | 315 | 1.90 | 2.30 | 0.30 | 8.89 | 0.06 | N-lo/hi |
| UGC 04984 | UGC | N | 1 | 3445 | 21 | 147 | 149 | 198 | 3.50 | 1.60 | 0.50 | 8.96 | 0.14 | N-lo/hi |
| UGC 05036 | UGC | N | 1 | 4260 | 2 | 220 | 195 | 238 | 3.20 | 5.80 | 0.50 | 9.70 | 0.04 | N-lo/hi |
| UGC 05047 | UGC | N | 1 | 509 | 14 | 39 | 42 | 103 | 2.70 | 1.00 | 0.20 | 7.09 | 0.09 | N-lo/hi |
| UGC 05085 | UGC | N | 1 | 8302 | 13 | 166 | 171 | 200 | 2.80 | 1.20 | 0.40 | 9.60 | 0.14 | N-lo |
| UGC 05091 | UGC | N | 1 | 3385 | 2 | 242 | 210 | 258 | 2.80 | 6.80 | 0.40 | 9.57 | 0.03 | N-lo |
| UGC 05127 | HL | Y | 1 | 4505 | 4 | 188 | 264 | 212 | 0.87 | 3.21 | 0.23 | 9.49 | 0.03 | NA |
| UGC 05169 | UGC | N | 1 | 7676 | 3 | 235 | 194 | 250 | 2.60 | 3.00 | 0.40 | 9.93 | 0.06 | N-lo |
| UGC 05293 | UGC/HL | Y | 2 | 4986 | 10 | 198 | 229 | 238 | 0.87 | 2.41 | 0.58 | 9.46 | 0.11 | NGG |
| UGC 05348 | UGC | N | 1 | 550 | 1 | 96 | 107 | 110 | 3.00 | 4.20 | 0.30 | 7.78 | 0.03 | N-lo |
| UGC 05412 | HLS | Y | 1 | 9634 | 4 | 307 | 628 | 326 | 1.70 | 4.04 | 0.30 | 10.25 | 0.03 | G |
| UGC 05429 | UGC | N | 1 | 6926 | 2 | 94 | 87 | 113 | 3.20 | 3.40 | 0.30 | 9.89 | 0.04 | N-lo |
| UGC 05496 | UGC | N | 1 | 7265 | 4 | 340 | 330 | 365 | 3.00 | 4.70 | 0.50 | 10.08 | 0.05 | N-lo |
| UGC 05754 | HL | N | 1 | 3220 | 6 | 73 | 96 | 98 | 2.68 | 1.21 | 0.25 | 8.78 | 0.09 | N |
| UGC 05876 | HL | N | 1 | 6554 | 5 | 288 | 392 | 314 | 1.40 | 3.67 | 0.27 | 9.87 | 0.03 | NG |
| UGC 05983 | UGC/HL | Y | 3 | 616 | 1 | 140 | 200 | 192 | 1.40 | 54.98 | 0.70 | 8.92 | 0.01 | NG,N-lo |
| UGC 06005 | UGC | Y | 1 | 719 | 3 | 101 | 97 | 114 | 2.90 | 1.60 | 0.30 | 7.60 | 0.08 | N-lo |
| UGC 06032 | HL | N | 1 | 2830 | 1 | 200 | 240 | 205 | 1.20 | 1.93 | 0.16 | 8.86 | 0.04 | G |
| UGC 06039 | UGC/HL | N | 1 | 1831 | 8 | 146 | 176 | 177 | 1.20 | 1.59 | 0.14 | 8.40 | 0.04 | G,N-lo |
| UGC 06179 | HL | Y | 3 | 13155 | 44 | 704 | 838 | 913 | 1.30 | 8.30 | 0.37 | 10.83 | 0.02 | G |
| UGC 06369 | UGC | Y | 3 | 1922 | 3 | 102 | 110 | 117 | 3.50 | 2.60 | 0.30 | 8.66 | 0.05 | N-lo |
| UGC 06381 | UGC | N | 1 | 1186 | 4 | 85 | 79 | 103 | 4.20 | 1.90 | 0.40 | 8.11 | 0.09 | N-lo |
| UGC 06455 | HL | N | 1 | 2022 | 12 | 184 | 218 | 227 | 2.81 | 1.82 | 0.29 | 8.53 | 0.07 | N |
| UGC 06489 | HL | Y | 2 | 133323 | 15 | 577 | 675 | 601 | 0.85 | 1.77 | 0.19 | 12.18 | 0.05 | G |
| UGC 06919 | UGC | N | 1 | 1339 | 4 | 105 | 102 | 116 | 2.90 | 0.80 | 0.30 | 7.84 | 0.16 | N-lo/hi |
| UGC 06988 | UGC | N | 1 | 736 | 15 | 135 | 208 | 149 | 0.92 | 1.47 | 0.10 | 7.54 | 0.03 | G |
| UGC 06992 | UGC | N | 1 | 750 | 6 | 104 | 99 | 120 | 3.50 | 1.10 | 0.40 | 7.47 | 0.16 | N-lo/hi |
| UGC 06999 | UGC | N | 1 | 944 | 4 | 61 | 71 | 81 | 4.00 | 1.70 | 0.30 | 7.86 | 0.08 | N-lo/hi |
| UGC 07146 | UGC/HL | Y | 1 | 1061 | 2 | 75 | 130 | 91 | 0.92 | 2.62 | 0.20 | 8.14 | 0.03 | NG,N-lo |
| UGC 07553 | UGC | Y | 2 | 8826 | 21 | 319 | 299 | 383 | 4.40 | 3.70 | 0.80 | 10.14 | 0.09 | N-lo |
| UGC 07945 | UGC | N | 1 | 2719 | 3 | 159 | 146 | 175 | 2.60 | 2.60 | 0.30 | 8.96 | 0.05 | N-lo |
| UGC 07953 | HL | Y | 1 | 17211 | 15 | 444 | 598 | 10 | 1.01 | 1.85 | 0.21 | 10.42 | 0.05 | G |
| UGC 08107 | UGC | Y | 1 | 8222 | 16 | 795 | 877 | 869 | 1.01 | 6.17 | 0.29 | 10.30 | 0.02 | GU |
| UGC 08123 | UGC | N | 1 | 4654 | 7 | 150 | 155 | 171 | 2.80 | 1.60 | 0.30 | 9.22 | 0.08 | N-lo |
| UGC 08198 | UGC | N | 1 | 10262 | 4 | 190 | 150 | 218 | 2.90 | 4.30 | 0.40 | 10.34 | 0.04 | N-lo |
| UGC 08222 | UGC | Y | 1 | 4663 | 15 | 255 | 342 | 278 | 1.45 | 0.81 | 0.12 | 8.92 | 0.06 | G |
| UGC 08274 | UGC | N | 1 | 4768 | 15 | 191 | 224 | 204 | 0.90 | 1.06 | 0.12 | 9.06 | 0.05 | G |
| UGC 08430 | HL | N | 1 | 7242 | 3 | 252 | 279 | 263 | 1.60 | 2.84 | 0.26 | 9.85 | 0.04 | G |
| UGC 08491 | UGC | N | 1 | 2807 | 4 | 139 | 136 | 151 | 4.10 | 1.50 | 0.50 | 8.75 | 0.14 | N-lo |
| UGC 08509 | UGC | N | 1 | 998 | 3 | 73 | 83 | 91 | 5.70 | 3.40 | 0.50 | 8.21 | 0.06 | N-lo |
| UGC 08542 | UGC | N | 1 | 1187 | 3 | 131 | 139 | 155 | 3.60 | 4.80 | 0.40 | 8.51 | 0.04 | N-lo |
| UGC 08601 | UGC | N | 1 | 2276 | 3 | 128 | 138 | 142 | 2.50 | 1.70 | 0.30 | 8.63 | 0.08 | N-lo |
| UGC 08644 | HL | N | 1 | 6959 | 1 | 145 | 304 | 162 | 0.33 | 1.76 | 0.04 | 9.61 | 0.01 | A |
| UGC 08659 | UGC | Y | 1 | 5001 | 8 | 128 | 127 | 167 | 4.70 | 3.50 | 0.60 | 9.62 | 0.07 | N-lo |
| UGC 08743 | HL | N | 1 | 1767 | 16 | 156 | 263 | 220 | 4.77 | 3.83 | 0.49 | 8.75 | 0.06 | N |
| UGC 08802 | HL | Y | 2 | 12327 | 4 | 366 | 424 | 389 | 0.48 | 3.21 | 0.29 | 10.37 | 0.04 | NA |
| UGC 08858 | UGC | N | 1 | 5625 | 7 | 315 | 300 | 341 | 3.20 | 3.20 | 0.40 | 9.69 | 0.05 | N-lo |
| UGC 08970 | UGC/HL | N | 1 | 1836 | 10 | 129 | 148 | 158 | 0.48 | 1.57 | 1.07 | 8.40 | 0.30 | N,N-lo/h |
| UGC 08985 | UGC | N | 1 | 2994 | 2 | 199 | 201 | 207 | 5.00 | 3.30 | 0.70 | 9.15 | 0.09 | N-lo/hi |
| UGC 09028 | UGC/HL | N | 1 | 3211 | 10 | 173 | 219 | 198 | 0.48 | 2.44 | 0.46 | 9.06 | 0.08 | NGG |
| UGC 09051 | UGC | N | 1 | 1431 | 15 | 158 | 176 | 168 | 0.66 | 0.49 | 0.08 | 7.66 | 0.07 | G |
| UGC 09272 | HL | N | 1 | 6705 | 10 | 249 | 283 | 278 | 3.27 | 2.99 | 0.51 | 9.80 | 0.07 | N |
| UGC 09446 | HL | N | 1 | 3770 | 6 | 183 | 221 | 204 | 2.67 | 1.95 | 0.35 | 9.11 | 0.08 | N |
| UGC 09551 | UGC | N | 1 | 7939 | 9 | 240 | 214 | 367 | 1.30 | 5.60 | 0.20 | 10.23 | 0.02 | N-lo |
| UGC 09783 | UGC | Y | 1 | 11168 | 13 | 359 | 523 | 498 | 2.67 | 2.64 | 0.11 | 10.20 | 0.02 | GU |
| UGC 10570 | HL | N | 1 | 9026 | 9 | 211 | 285 | 242 | 3.67 | 2.27 | 0.53 | 9.94 | 0.10 | N |
| UGC 10594 | UGC | N | 1 | 8844 | 4 | 437 | 341 | 463 | 2.00 | 4.60 | 0.40 | 10.24 | 0.04 | N-lo |
| UGC 10666 | HL | Y | 1 | 9809 | 2 | 289 | 341 | 315 | 0.29 | 0.25 | 0.04 | 9.06 | 0.07 | A |
| UGC 10668 | HLS | Y | 1 | 10101 | 6 | 184 | 213 | 208 | 0.29 | 1.00 | 0.04 | 9.69 | 0.02 | A |
| UGC 10794 | UGC | N | 1 | 6847 | 3 | 279 | 215 | 291 | 2.50 | 2.00 | 0.40 | 9.65 | 0.09 | N-lo |
| UGC 11032 | HL | N | 1 | 8990 | 13 | 51 | 71 | 115 | 2.66 | 1.22 | 0.27 | 9.67 | 0.10 | N |
| UGC 11054 | HL | N | 1 | 4327 | 1 | 209 | 410 | 216 | 0.60 | 2.16 | 0.09 | 9.28 | 0.02 | G |
| UGC 11383 | HL | N | 1 | 16923 | 15 | 395 | 451 | 449 | 1.17 | 2.03 | 0.22 | 10.44 | 0.05 | G |
| UGC 11476 | HL | N | 1 | 13111 | 15 | 394 | 532 | 457 | 0.77 | 1.40 | 0.10 | 10.06 | 0.03 | G |
| UGC 11665 | HL | N | 1 | 5922 | 13 | 117 | 142 | 157 | 0.44 | 0.36 | 0.09 | 8.78 | 0.11 | GA |
| UGC 11900 | HL | Y | 2 | 9493 | 15 | 431 | 581 | 441 | 1.32 | 1.84 | 0.25 | 9.90 | 0.06 | G |
| UGC 11960 | HL | N | 1 | 4329 | 4 | 210 | 263 | 233 | 2.50 | 3.38 | 0.26 | 9.47 | 0.03 | N |
| UGC 12568 | HL | N | 1 | 5206 | 15 | 198 | 245 | 230 | 0.81 | 0.77 | 0.11 | 9.00 | 0.06 | G |
| UGC 12797 | HL | N | 1 | 5369 | 18 | 55 | 75 | 232 | 3.01 | 4.38 | 0.32 | 9.77 | 0.03 | N |
| Name | Notes | Conf. | error | error | error | r.m.s. | flux | error | / | error | Tel. | |||
|---|---|---|---|---|---|---|---|---|---|---|---|---|---|---|
| (km s-1) | (km s-1) | (km s-1) | Jy | (Jy km s-1) | ||||||||||
| ESO 368-004 | Y | 1 | 1396 | 1 | 58 | 2 | 78 | 3 | 3.78 | 12.91 | 0.23 | 9.04 | 0.01 | N |
| ESO 368-004 | Y | 1 | 1397 | 1 | 86 | 1 | 101 | 1 | 1.50 | 14.51 | 0.14 | 9.09 | 0.00 | G |
| ESO 368-004 | Y | 1 | 1397 | 5 | 89 | 10 | 108 | 15 | 1.30 | 13.45 | 0.11 | 9.06 | 0.00 | G |
| ESO 424-009 | N | 1 | 4057 | 6 | 140 | 12 | 174 | 18 | 3.70 | 3.27 | 0.34 | 9.40 | 0.05 | N |
| ESO 424-009 | N | 1 | 4052 | 1 | 153 | 2 | 165 | 3 | 1.00 | 3.22 | 0.13 | 9.39 | 0.02 | G |
| ESO 463-005 | Y | 2 | 2809 | 3 | 519 | 6 | 552 | 9 | 2.80 | 11.70 | 0.46 | 9.64 | 0.02 | N |
| ESO 463-005 | Y | 2 | 3014 | 10 | 159 | 15 | 191 | 15 | 1.41 | 3.26 | 0.17 | 9.15 | 0.02 | G |
| ESO 491-003 | Y | 1 | 7166 | 11 | 154 | 22 | 221 | 34 | 2.77 | 2.22 | 0.26 | 9.73 | 0.05 | N |
| ESO 491-003 | Y | 1 | 7167 | 15 | 202 | 10 | 221 | 10 | 0.80 | 1.94 | 0.11 | 9.68 | 0.02 | G |
| ESO 492-001 | Y | 1 | 6599 | 7 | 124 | 14 | 171 | 21 | 3.08 | 3.52 | 0.28 | 9.86 | 0.03 | N |
| ESO 492-001 | Y | 1 | 6590 | 17 | 208 | 34 | 333 | 54 | 1.20 | 4.52 | 0.22 | 9.97 | 0.02 | G |
| ESO 492-001 | Y | 1 | 6597 | 15 | 206 | 30 | 246 | 46 | 1.15 | 3.54 | 0.16 | 9.87 | 0.02 | G |
| IC 3004 | N | 1 | 6351 | 4 | 171 | 8 | 187 | 12 | 2.52 | 2.17 | 0.24 | 9.62 | 0.05 | N |
| IC 3004 | N | 1 | 6331 | 1 | 179 | 15 | 196 | 15 | 0.29 | 1.60 | 0.03 | 9.48 | 0.01 | A |
| IC 3852 | Y | 1 | 4373 | 4 | 205 | 7 | 211 | 11 | 2.83 | 3.36 | 0.24 | 9.48 | 0.03 | G |
| IC 3852 | Y | 1 | 4359 | 2 | 203 | 15 | 224 | 15 | 0.72 | 2.72 | 0.09 | 9.39 | 0.01 | A |
| IC 3852 | Y | 1 | 4377 | 15 | 222 | 30 | 322 | 46 | 1.54 | 3.21 | 0.21 | 9.46 | 0.03 | G |
| PGC 7225 | Y | 1 | 5180 | 5 | 189 | 15 | 207 | 15 | 0.73 | 0.44 | 0.21 | 8.75 | 0.21 | G |
| PGC 7225 | Y | 1 | 5206 | 7 | 157 | 15 | 188 | 15 | 0.37 | 0.35 | 0.04 | 8.65 | 0.05 | A |
| PGC 7981 | N | 1 | 5320 | 3 | 179 | 6 | 196 | 9 | 2.19 | 2.70 | 0.21 | 9.56 | 0.03 | N |
| PGC 7981 | N | 1 | 5330 | 1 | 184 | 15 | 202 | 15 | 0.70 | 2.16 | 0.08 | 9.47 | 0.02 | A |
| PGC 16370 | Y | 1 | 6884 | 3 | 517 | 7 | 624 | 11 | 4.77 | 5.26 | 0.83 | 10.07 | 0.07 | N |
| PGC 16370 | Y | 1 | 7082 | 15 | 566 | 15 | 584 | 15 | 0.88 | 3.28 | 0.18 | 9.90 | 0.02 | G |
| PGC 17124 | Y | 2 | 2452 | 11 | 303 | 22 | 360 | 34 | 9.18 | 11.16 | 0.88 | 9.51 | 0.03 | N |
| PGC 17124 | Y | 2 | 2449 | 4 | 328 | 8 | 377 | 13 | 1.60 | 3.81 | 0.21 | 9.01 | 0.02 | G |
| PGC 21133 | Y | 1 | 5733 | 31 | 102 | 62 | 187 | 96 | 3.05 | 1.22 | 0.39 | 9.27 | 0.14 | N |
| PGC 21133 | Y | 1 | 5763 | 2 | 194 | 4 | 204 | 7 | 1.20 | 1.71 | 0.16 | 9.43 | 0.04 | G |
| PGC 21529 | Y | 2 | 3990 | 23 | 68 | 46 | 320 | 71 | 2.00 | 4.11 | 0.25 | 9.50 | 0.03 | N |
| PGC 21529 | Y | 2 | 3982 | 5 | 358 | 10 | 385 | 15 | 1.60 | 5.04 | 0.29 | 9.57 | 0.02 | G |
| PGC 21529 | Y | 2 | 4050 | 1 | 170 | 15 | 183 | 15 | 0.71 | 1.32 | 0.08 | 9.00 | 0.03 | A |
| PGC 21597 | N | 1 | 420 | 18 | 69 | 36 | 136 | 55 | 2.91 | 0.98 | 0.32 | 6.92 | 0.14 | N |
| PGC 21597 | N | 1 | 424 | 2 | 66 | 4 | 72 | 6 | 1.40 | 0.50 | 0.11 | 6.63 | 0.10 | G |
| PGC 23116 | N | 1 | 8560 | 2 | 235 | 4 | 239 | 6 | 1.00 | 0.61 | 0.14 | 9.33 | 0.10 | G |
| PGC 23116 | N | 1 | 8543 | 2 | 228 | 15 | 243 | 15 | 0.40 | 0.74 | 0.05 | 9.41 | 0.03 | A |
| PGC 23328 | Y | 2 | 5802 | 60 | 205 | 120 | 385 | 186 | 2.06 | 1.41 | 0.38 | 9.35 | 0.12 | N |
| PGC 23328 | Y | 2 | 5829 | 4 | 236 | 7 | 242 | 11 | 1.40 | 0.91 | 0.21 | 9.17 | 0.10 | G |
| PGC 23328 | Y | 2 | 5787 | 2 | 192 | 15 | 206 | 15 | 0.41 | 0.80 | 0.05 | 9.10 | 0.03 | A |
| PGC 26936 | Y | 1 | 4323 | 16 | 119 | 32 | 175 | 49 | 2.35 | 1.31 | 0.29 | 9.06 | 0.10 | N |
| PGC 26936 | Y | 1 | 4322 | 3 | 174 | 15 | 220 | 15 | 0.49 | 1.72 | 0.06 | 9.18 | 0.02 | A |
| PGC 27485 | Y | 1 | 4399 | 2 | 196 | 4 | 216 | 6 | 2.58 | 5.98 | 0.26 | 9.73 | 0.02 | N |
| PGC 27485 | Y | 1 | 4400 | 15 | 218 | 10 | 237 | 10 | 0.86 | 6.29 | 0.12 | 9.75 | 0.01 | G |
| PGC 27485 | Y | 1 | 4384 | 1 | 202 | 15 | 222 | 15 | 0.59 | 4.29 | 0.07 | 9.59 | 0.01 | A |
| PGC 27849 | Y | 1 | 9427 | 16 | 197 | 32 | 236 | 49 | 2.32 | 1.27 | 0.33 | 9.73 | 0.11 | N |
| PGC 27849 | Y | 1 | 9411 | 11 | 357 | 22 | 393 | 34 | 1.40 | 2.64 | 0.26 | 10.05 | 0.04 | G |
| PGC 27849 | Y | 1 | 9439 | 4 | 221 | 15 | 247 | 15 | 0.49 | 0.95 | 0.07 | 9.60 | 0.03 | A |
| PGC 27849 | Y | 1 | 9423 | 10 | 312 | 20 | 332 | 31 | 1.28 | 1.81 | 0.21 | 9.88 | 0.05 | G |
| PGC 34409 | N | 1 | 8698 | 15 | 225 | 30 | 261 | 46 | 2.33 | 1.15 | 0.35 | 9.62 | 0.13 | N |
| PGC 34409 | N | 1 | 8674 | 3 | 216 | 15 | 244 | 15 | 0.45 | 0.91 | 0.06 | 9.51 | 0.03 | A |
| PGC 34959 | N | 1 | 7408 | 13 | 142 | 26 | 172 | 40 | 3.34 | 1.23 | 0.41 | 9.50 | 0.14 | N |
| PGC 34959 | N | 1 | 7400 | 3 | 170 | 15 | 200 | 15 | 0.52 | 1.24 | 0.06 | 9.51 | 0.02 | A |
| PGC 37416 | N | 1 | 553 | 5 | 81 | 10 | 101 | 15 | 2.77 | 0.97 | 0.19 | 7.05 | 0.09 | N |
| PGC 37416 | N | 1 | 529 | 1 | 81 | 15 | 101 | 15 | 0.38 | 0.82 | 0.03 | 6.98 | 0.02 | A |
| PGC 38080 | N | 1 | 6831 | 46 | 189 | 92 | 347 | 142 | 2.20 | 1.45 | 0.38 | 9.51 | 0.11 | N |
| PGC 38080 | N | 1 | 6866 | 1 | 191 | 15 | 208 | 15 | 0.38 | 1.01 | 0.05 | 9.36 | 0.02 | A |
| PGC 38264 | N | 1 | 3772 | 5 | 170 | 10 | 187 | 15 | 3.01 | 1.91 | 0.38 | 9.10 | 0.09 | N |
| PGC 38264 | N | 1 | 3738 | 13 | 218 | 26 | 275 | 41 | 1.10 | 2.00 | 0.18 | 9.12 | 0.04 | G |
| PGC 38333 | Y | 3 | 6801 | 33 | 392 | 66 | 531 | 102 | 2.60 | 4.16 | 0.56 | 9.96 | 0.06 | N |
| PGC 38333 | Y | 3 | 6947 | 1 | 216 | 15 | 233 | 15 | 0.28 | 1.01 | 0.04 | 9.37 | 0.02 | A |
| PGC 38698 | Y | 2 | 6800 | 6 | 119 | 12 | 154 | 18 | 3.89 | 3.22 | 0.33 | 9.85 | 0.04 | N |
| PGC 38698 | Y | 2 | 6788 | 5 | 129 | 10 | 142 | 16 | 5.10 | 2.72 | 0.58 | 9.77 | 0.09 | G |
| PGC 51872 | Y | 2 | 4073 | 8 | 84 | 16 | 115 | 24 | 2.94 | 1.28 | 0.29 | 9.01 | 0.10 | N |
| PGC 51872 | Y | 2 | 4053 | 2 | 92 | 15 | 140 | 15 | 0.35 | 1.49 | 0.04 | 9.06 | 0.01 | A |
| PGC 56738 | Y | 2 | 9940 | 34 | 136 | 68 | 213 | 105 | 1.86 | 0.75 | 0.25 | 9.55 | 0.14 | N |
| PGC 56738 | Y | 2 | 9875 | 3 | 199 | 15 | 222 | 15 | 0.27 | 0.53 | 0.03 | 9.39 | 0.02 | A |
| PGC 73236 | N | 1 | 5175 | 13 | 173 | 26 | 203 | 40 | 1.53 | 0.41 | 0.20 | 8.71 | 0.21 | N |
| PGC 73236 | N | 1 | 5191 | 1 | 207 | 15 | 223 | 15 | 0.41 | 0.99 | 0.05 | 9.11 | 0.02 | A |
| PGC 74070 | Y | 2 | 4737 | 8 | 190 | 16 | 229 | 24 | 2.53 | 2.71 | 0.36 | 9.46 | 0.06 | N |
| PGC 74070 | Y | 2 | 4756 | 2 | 196 | 15 | 216 | 15 | 0.80 | 2.14 | 0.10 | 9.35 | 0.02 | A |
| PGC 79026 | N | 1 | 6023 | 4 | 177 | 8 | 197 | 12 | 2.00 | 1.94 | 0.26 | 9.53 | 0.06 | N |
| PGC 79026 | N | 1 | 6003 | 1 | 203 | 15 | 221 | 15 | 0.45 | 1.54 | 0.06 | 9.42 | 0.02 | A |
| PGC 80973 | N | 1 | 7368 | 6 | 177 | 12 | 197 | 18 | 2.36 | 1.94 | 0.31 | 9.70 | 0.07 | N |
| PGC 80973 | N | 1 | 7386 | 1 | 190 | 2 | 195 | 4 | 1.30 | 1.73 | 0.18 | 9.65 | 0.05 | G |
| PGC 82550 | Y | 1 | 6517 | 14 | 140 | 28 | 186 | 43 | 2.28 | 1.52 | 0.29 | 9.49 | 0.08 | N |
| PGC 82550 | Y | 1 | 6480 | 2 | 111 | 15 | 125 | 15 | 0.68 | 0.76 | 0.06 | 9.18 | 0.03 | A |
| PGC 86623 | N | 1 | 2901 | 4 | 137 | 8 | 162 | 12 | 1.94 | 2.04 | 0.23 | 8.91 | 0.05 | N |
| PGC 86623 | N | 1 | 2881 | 1 | 146 | 15 | 165 | 15 | 0.42 | 1.85 | 0.05 | 8.86 | 0.01 | A |
| PGC 86863 | Y | 1 | 8132 | 12 | 325 | 24 | 361 | 37 | 2.39 | 1.87 | 0.31 | 9.77 | 0.07 | N |
| PGC 86863 | Y | 1 | 8118 | 3 | 352 | 15 | 375 | 15 | 0.41 | 1.31 | 0.07 | 9.61 | 0.02 | A |
| PGC 91391 | N | 1 | 8985 | 17 | 260 | 34 | 304 | 52 | 2.32 | 1.53 | 0.38 | 9.77 | 0.11 | N |
| PGC 91391 | N | 1 | 8950 | 1 | 302 | 15 | 322 | 15 | 0.27 | 1.42 | 0.04 | 9.73 | 0.01 | A |
| PGC 135894 | Y | 3 | 10481 | 12 | 158 | 24 | 205 | 37 | 2.03 | 2.57 | 0.27 | 10.13 | 0.05 | N |
| PGC 135894 | Y | 3 | 10479 | 15 | 208 | 10 | 250 | 10 | 0.62 | 2.11 | 0.09 | 10.04 | 0.02 | G |
| PGC 135894 | Y | 3 | 10508 | 2 | 180 | 15 | 205 | 15 | 0.68 | 1.53 | 0.08 | 9.91 | 0.02 | A |
| PGC 200944 | N | 1 | 6081 | 4 | 123 | 8 | 140 | 12 | 2.03 | 1.14 | 0.17 | 9.30 | 0.06 | N |
| PGC 200944 | N | 1 | 6060 | 1 | 143 | 15 | 158 | 15 | 0.26 | 0.93 | 0.03 | 9.21 | 0.01 | A |
| PGC 2815809 | Y | 1 | 6643 | 4 | 102 | 8 | 138 | 12 | 2.33 | 3.31 | 0.19 | 9.84 | 0.02 | N |
| PGC 2815809 | Y | 1 | 6647 | 15 | 152 | 10 | 174 | 10 | 0.78 | 3.77 | 0.09 | 9.89 | 0.01 | G |
| UGC 605 | Y | 3 | 19534 | 35 | 916 | 70 | 1017 | 109 | 1.70 | 7.50 | 0.52 | 11.14 | 0.03 | G |
| UGC 605 | Y | 3 | 19538 | 6 | 722 | 4 | 749 | 15 | 0.45 | 2.33 | 0.11 | 10.63 | 0.02 | A |
| UGC 1145 | Y | 1 | 5809 | 15 | 101 | 10 | 103 | 10 | 0.69 | 0.19 | 0.06 | 8.48 | 0.14 | G |
| UGC 1145 | Y | 1 | 5784 | 13 | 42 | 26 | 91 | 40 | 2.10 | 1.10 | 0.20 | 9.24 | 0.08 | N |
| UGC 1779 | N | 1 | 4519 | 3 | 175 | 6 | 190 | 9 | 3.09 | 2.79 | 0.30 | 9.43 | 0.05 | N |
| UGC 1779 | N | 1 | 4529 | 6 | 191 | 13 | 217 | 20 | 2.20 | 2.78 | 0.31 | 9.43 | 0.05 | G |
| UGC 1779 | N | 1 | 4528 | 3 | 190 | 9 | 200 | 9 | 3.40 | 2.40 | 0.40 | 9.36 | 0.07 | N |
| UGC 1851 | Y | 1 | 7665 | 11 | 172 | 22 | 199 | 34 | 2.20 | 0.91 | 0.29 | 9.40 | 0.14 | N |
| UGC 1851 | Y | 1 | 7661 | 1 | 178 | 1 | 178 | 1 | 0.80 | 0.90 | 0.90 | 9.40 | 0.43 | G |
| UGC 1851 | Y | 1 | 7663 | 15 | 175 | 30 | 201 | 46 | 1.98 | 0.97 | 0.25 | 9.43 | 0.11 | G |
| UGC 1953 | N | 1 | 4906 | 23 | 132 | 46 | 186 | 71 | 2.94 | 1.02 | 0.37 | 9.07 | 0.16 | N |
| UGC 1953 | N | 1 | 4882 | 2 | 133 | 5 | 139 | 7 | 1.20 | 0.76 | 0.14 | 8.93 | 0.08 | G |
| UGC 2480 | Y | 2 | 10121 | 23 | 258 | 46 | 313 | 72 | 0.90 | 1.07 | 0.16 | 9.72 | 0.06 | G |
| UGC 2480 | Y | 2 | 10140 | 6 | 241 | 15 | 263 | 15 | 0.77 | 0.85 | 0.11 | 9.62 | 0.06 | A |
| UGC 2505 | Y | 1 | 4092 | 5 | 198 | 10 | 213 | 15 | 2.45 | 1.19 | 0.25 | 8.97 | 0.09 | N |
| UGC 2505 | Y | 1 | 4065 | 2 | 187 | 4 | 196 | 6 | 0.70 | 1.00 | 0.09 | 8.90 | 0.04 | G |
| UGC 2505 | Y | 1 | 4061 | 15 | 196 | 30 | 210 | 46 | 1.09 | 1.02 | 0.14 | 8.91 | 0.06 | G |
| UGC 2876 | N | 1 | 5311 | 7 | 215 | 14 | 230 | 21 | 2.39 | 1.82 | 0.26 | 9.38 | 0.06 | N |
| UGC 2876 | N | 1 | 5306 | 6 | 217 | 12 | 227 | 19 | 1.64 | 1.90 | 0.22 | 9.40 | 0.05 | G |
| UGC 3389 | N | 1 | 6138 | 24 | 171 | 48 | 666 | 74 | 3.40 | 1.21 | 0.82 | 9.33 | 0.29 | N |
| UGC 3389 | N | 1 | 6173 | 1 | 141 | 3 | 149 | 4 | 1.40 | 1.68 | 0.16 | 9.49 | 0.04 | G |
| UGC 3424 | N | 1 | 5664 | 15 | 259 | 10 | 269 | 10 | 1.53 | 1.53 | 0.23 | 9.36 | 0.07 | G |
| UGC 3424 | N | 1 | 5674 | 18 | 222 | 36 | 278 | 55 | 2.52 | 1.65 | 0.29 | 9.41 | 0.08 | N |
| UGC 5127 | Y | 1 | 4521 | 5 | 178 | 10 | 201 | 15 | 3.61 | 3.02 | 0.35 | 9.46 | 0.05 | N |
| UGC 5127 | Y | 1 | 4488 | 2 | 199 | 15 | 223 | 15 | 0.87 | 3.40 | 0.11 | 9.51 | 0.01 | A |
| UGC 5293 | Y | 2 | 4989 | 10 | 170 | 20 | 206 | 31 | 2.86 | 1.91 | 0.38 | 9.35 | 0.09 | N |
| UGC 5293 | Y | 2 | 4993 | 4 | 191 | 7 | 208 | 11 | 1.50 | 2.26 | 0.21 | 9.43 | 0.04 | G |
| UGC 5293 | Y | 2 | 4976 | 15 | 233 | 30 | 301 | 46 | 1.23 | 3.05 | 0.18 | 9.56 | 0.03 | G |
| UGC 5876 | N | 1 | 6543 | 2 | 273 | 4 | 287 | 6 | 2.56 | 3.43 | 0.30 | 9.84 | 0.04 | N |
| UGC 5876 | N | 1 | 6565 | 7 | 303 | 13 | 341 | 21 | 1.40 | 3.90 | 0.24 | 9.90 | 0.03 | G |
| UGC 5983 | Y | 3 | 698 | 1 | 81 | 2 | 153 | 3 | 3.17 | 31.94 | 1.14 | 8.78 | 0.02 | N |
| UGC 5983 | Y | 3 | 616 | 1 | 268 | 1 | 292 | 1 | 1.60 | 78.03 | 0.27 | 9.07 | 0.00 | G |
| UGC 5983 | Y | 3 | 700 | 1 | 72 | 2 | 132 | 3 | 3.90 | 33.73 | 93.09 | 8.90 | 1.20 | N |
| UGC 6039 | N | 1 | 1831 | 2 | 156 | 3 | 166 | 5 | 1.20 | 1.59 | 0.14 | 8.40 | 0.04 | G |
| UGC 6039 | N | 1 | 1805 | 14 | 137 | 28 | 189 | 43 | 2.80 | 2.00 | 0.40 | 8.47 | 0.09 | N |
| UGC 7146 | Y | 1 | 1059 | 3 | 67 | 6 | 81 | 9 | 5.32 | 2.41 | 0.33 | 8.11 | 0.06 | N |
| UGC 7146 | Y | 1 | 1063 | 1 | 86 | 1 | 98 | 2 | 0.90 | 2.83 | 0.08 | 8.18 | 0.01 | G |
| UGC 7146 | Y | 1 | 1063 | 2 | 74 | 4 | 95 | 6 | 3.10 | 3.20 | 0.30 | 8.23 | 0.04 | N |
| UGC 8107 | Y | 1 | 8222 | 15 | 988 | 20 | 1058 | 15 | 1.02 | 6.17 | 0.29 | 10.30 | 0.02 | G |
| UGC 8107 | Y | 1 | 8293 | 17 | 602 | 34 | 681 | 52 | 4.40 | 6.30 | 0.80 | 10.31 | 0.06 | N |
| UGC 8802 | Y | 2 | 12333 | 6 | 354 | 12 | 375 | 18 | 2.80 | 3.63 | 0.50 | 10.42 | 0.06 | N |
| UGC 8802 | Y | 2 | 12321 | 2 | 379 | 15 | 404 | 15 | 0.48 | 2.79 | 0.08 | 10.31 | 0.01 | A |
| UGC 8970 | N | 1 | 1836 | 17 | 136 | 34 | 177 | 52 | 3.67 | 1.44 | 0.45 | 8.36 | 0.14 | N |
| UGC 8970 | N | 1 | 1821 | 3 | 123 | 6 | 139 | 9 | 4.00 | 1.70 | 0.40 | 8.43 | 0.10 | N |
| UGC 9028 | N | 1 | 3217 | 12 | 171 | 24 | 208 | 37 | 5.50 | 2.67 | 0.74 | 9.10 | 0.12 | N |
| UGC 9028 | N | 1 | 3218 | 3 | 179 | 7 | 198 | 10 | 1.30 | 2.21 | 0.17 | 9.02 | 0.03 | G |
| UGC 9028 | N | 1 | 3198 | 15 | 169 | 30 | 189 | 46 | 0.95 | 2.03 | 0.11 | 8.98 | 0.02 | G |
| UGC 9783 | Y | 1 | 11168 | 15 | 359 | 15 | 498 | 15 | 0.56 | 2.64 | 0.11 | 10.20 | 0.02 | G |
| UGC 9783 | Y | 1 | 11076 | 11 | 90 | 22 | 132 | 34 | 2.73 | 1.23 | 0.22 | 9.86 | 0.08 | N |
| UGC 11665 | N | 1 | 5936 | 13 | 117 | 26 | 140 | 41 | 1.20 | 0.43 | 0.13 | 8.85 | 0.13 | G |
| UGC 11665 | N | 1 | 5907 | 12 | 117 | 15 | 175 | 15 | 0.44 | 0.30 | 0.05 | 8.70 | 0.07 | A |
| Name | Sample | Notes | Nançay | GBT | Arecibo | |
|---|---|---|---|---|---|---|
| low | high | |||||
| ESO 366-014 | HL | N | 2.61 | 1.11 | ||
| ESO 435-001 | HL | N | 0.95 | |||
| ESO 491-002 | HL | Y | 1.69 | |||
| ESO 527-015 | HL | N | 3.18 | |||
| ESO 540-030 | HL | Y | 2.58 | 1.84 | ||
| ESO 582-010 | HL | N | 1.62 | |||
| ESO 598-019 | HL | N | 1.45 | |||
| PGC 4620 | HL | N | 2.08 | |||
| PGC 6166 | HL | N | 0.79 | 0.52 | 0.74 | |
| PGC 13131 | HL | N | 3.63 | 0.98 | ||
| PGC 18942 | HL | N | 0.87 | |||
| PGC 21302 | HL | N | 4.57 | 0.91 | ||
| PGC 21907 | HL | N | 2.80 | |||
| PGC 22928 | HL | N | 0.88 | |||
| PGC 30860 | HL | N | 3.51 | |||
| PGC 39076 | HL | N | 3.47 | 1.03 | 0.23 | |
| PGC 40135 | HL | N | 1.58 | 0.35 | 0.58 | |
| PGC 40267 | HL | N | 0.24 | 0.35 | ||
| PGC 52168 | HL | N | 2.08 | |||
| PGC 60361 | HL | N | 1.08 | |||
| PGC 70074 | HL | N | 1.12 | |||
| PGC 75981 | HL | N | 1.68 | 1.56 | ||
| PGC 77140 | HL | N | 1.11 | |||
| PGC 79534 | HL | N | 3.61 | 0.93 | ||
| PGC 83540 | HL | N | 0.93 | 0.42 | ||
| PGC 87255 | HL | N | 0.87 | 0.52 | 0.68 | |
| PGC 91383 | HL | N | 0.18 | 0.29 | ||
| PGC 2815827 | HL | N | 2.66 | |||
| UGC 45 | UGC | N | 4.6 | |||
| UGC 190 | UGC | N | 2.7 | 0.90 | ||
| UGC 239 | UGC | N | 1.06 | |||
| UGC 293 | HL | N | 1.22 | 0.36 | 0.36 | |
| UGC 502 | HL/UGC | N | 2.27 | 0.54 | ||
| UGC 1800 | HL | N | 0.89 | 0.56 | 0.56 | |
| UGC 1836 | UGC | N | 3.3 | 0.92 | ||
| UGC 2314 | HL/UGC | N | 1.23 | |||
| UGC 2436 | UGC | N | 1.8 | 1.19 | ||
| UGC 2668 | HL/UGC | Y | 2.96 | 2.86 | ||
| UGC 2724 | UGC | N | 2.30 | |||
| UGC 3041 | HL | Y | 1.64 | 0.81 | ||
| UGC 3566 | UGC | N | 2.5 | |||
| UGC 3814 | UGC | N | 2.9 | |||
| UGC 3963 | UGC | Y | 1.93 | |||
| UGC 4194 | UGC | N | 6.3 | 1.04 | ||
| UGC 5071 | UGC | Y | 3.3/10.7 | 1.82 | ||
| UGC 5613 | UGC | Y | — | |||
| UGC 6812 | UGC | Y | 3 | 0.98 | ||
| UGC 7110 | UGC | N | 4.6 | 0.96 | ||
| UGC 8176 | UGC | N | 3.4 | |||
| UGC 10704 | HL | N | 0.92 | |||
| UGC 11207 | HL | N | 1.83 | 1.09 | ||
| Object | Confusion | Telescopes | Notes | |||
|---|---|---|---|---|---|---|
| (1-3) | (km s-1)) | (km s-1) | (Jy km s-1) | |||
| ESO 463-005 | 2 | -205 | 360 | 8.44 | Nançay-GBT | Nançay obs. confused |
| ESO 492-001 | 1 | 9, 2 | -84, -82 | -1.0, 0.0 | Nançay-GBT, Nançay-GBT2 | Nançay obs. low S/N |
| IC 3852 | 1 | 14, 18 | 3, 108 | 0.6, 0.5 | GBT-AO, GBT2-AO | |
| PGC 16370 | 1 | -198 | -49 | 2.0 | Nançay-GBT2 | Nançay obs.low S/N |
| PGC 17124 | 2 | 3 | -25 | 7.4 | Nançay-GBT2 | Nançay obs. confused |
| PGC 21133 | 1 | -30 | -92 | -0.5 | Nançay-GBT | Nançay obs have high error |
| PGC 21529 | 2 | 8, -60, -68 | -290, -102, 188 | -0.9, 2.8, 3.7 | Nançay-GBT, Nançay-AO, GBT-AO | Nançay & GBT obs. confused |
| PGC 27849 | 1 | 16, 4, -12 | -160, -115, -24 | -1.4, 0.2, -0.5 | Nançay-GBT2, Nançay-GBT, Nançay-AO | Nançay obs. confused |
| PGC 38333 | 3 | -146 | 176 | 3.2 | Nançay-AO | Nançay obs. confused |
| PGC 56738 | 2 | 65 | -63 | 0.2 | Nançay-AO | Nançay obs. confused |
| UGC 605 | 3 | -4 | 194 | 5.17 | GBT-AO | GBT obs. confused |
| UGC 5983 | 3 | 82, 84 | -187, 196 | -46, -44 | Nançay-GBT, Nançay-GBT | All obs. confused |
| UGC 8107 | 1 | 71 | -386 | 0.1 | Nançay-GBT |
| Object | Note | ||
|---|---|---|---|
| v | (km s-1)) | (km s-1) | |
| PGC 7225 | 5193 | 507180 | 1 |
| UGC 263 | 16,853 | 16,718105 | 2 |
| UGC 1145 | 5809 | 567613 | 3 |
| Object | Velocity | GBT Det? | GBT r.m.s. | Vel. Ref. |
|---|---|---|---|---|
| (km s-1) | (Y/N) | (mJy) | ||
| SDSS J074933.51+394424.3 | 2943 | Y | 3.2 | 5,7,8,9,10 |
| KUG 0746+398A | 12,420 | Y | 2.2 | 2 |
| PGC 21907 | 22,2104500 | N | 1.8 | 1 |
| SDSS J074939.55+394316.7 | 12,536 | N | 2.2 | 3,4,5,6 |
| WISEA J074940.39+394604.7 | 28,603 | N | N/A | 2,5,6,10 |
| WISEA J074945.78+394354.4 | 46,750 | N | N/A | 5,6,10 |
| WISEA J074949.97+393945.9 | 151,577 | N | N/A | 10 |
| WISEA J074951.56+393934.9 | 150,496 | N | N/A | 10 |
| Object | Velocity | Vel. Ref. |
|---|---|---|
| (km s-1) | ||
| PGC 30113 | 13,491 | 1,2,3,4, 5 |
| 2MASX J10183425+5352576 | 13,607 | 1,2,4,5 |
| WISEA J101844.05+534359.6 | 14,159 | 1,4,5 |
| WISEA J101937.54+534202.5 | 14,169 | 1,4,5 |
| WISEA J101955.44+534201.9 | 14,269 | 1,2,5 |
| 2MASX J10190350+5334445 | 15,137 | 1,4,5 |
| Object | Velocity |
|---|---|
| (km s-1) | |
| PGC 32862 | 13,973 |
| SDSS J105505.99+573901.8 | 13,839 |
| WISEA J105636.94+573449.3 | 13,968 |
| WISEA J105649.85+572445.4 | 14,031 |
Note. — Velocity reference: Albareti et al. (2017)
| Object | Velocity | Vel. Ref. |
|---|---|---|
| (km s-1) | ||
| GALEXMSC J143103.29+353112.0 | 3897 | 1 |
| WISEA J143104.15+353132.1 | 3897 | 2 |
| SDSS J143103.66+353115.8 | 4067 | 3 |
| SDSS J143102.07+353058.6 | 4117 | 4 |
| SSTSL2 J143101.52+353105.9 | 3298 | 5 |
| SDSS J143103.06+353049.7 | 4179 | 5 |
| SDWFS J143101.34+353104.7 | 4197 | 1 |
Fig. Set1. H i Spectra