Rumor Detection with Diverse Counterfactual Evidence
Abstract.
The growth in social media has exacerbated the threat of fake news to individuals and communities. This draws increasing attention to developing efficient and timely rumor detection methods. The prevailing approaches resort to graph neural networks (GNNs) to exploit the post-propagation patterns of the rumor-spreading process. However, these methods lack inherent interpretation of rumor detection due to the black-box nature of GNNs. Moreover, these methods suffer from less robust results as they employ all the propagation patterns for rumor detection. In this paper, we address the above issues with the proposed Diverse Counterfactual Evidence framework for Rumor Detection (DCE-RD). Our intuition is to exploit the diverse counterfactual evidence of an event graph to serve as multi-view interpretations, which are further aggregated for robust rumor detection results. Specifically, our method first designs a subgraph generation strategy to efficiently generate different subgraphs of the event graph. We constrain the removal of these subgraphs to cause the change in rumor detection results. Thus, these subgraphs naturally serve as counterfactual evidence for rumor detection. To achieve multi-view interpretation, we design a diversity loss inspired by Determinantal Point Processes (DPP) to encourage diversity among the counterfactual evidence. A GNN-based rumor detection model further aggregates the diverse counterfactual evidence discovered by the proposed DCE-RD to achieve interpretable and robust rumor detection results. Extensive experiments on two real-world datasets show the superior performance of our method. Our code is available at https://github.com/Vicinity111/DCE-RD.
1. Introduction
The popularization of the Internet has dramatically changed the way in which people access news. The Internet has also become a huge melting pot of information. A large amount of unreliable information can quickly spread among people, which is prone to social chaos and disordering people’s normal life. Rumor detection has gradually become a challenging task, especially in the face of public emergencies, widespread rumors can be extremely threatening and even cause death (Roozenbeek and Van der Linden, 2019). Meanwhile, due to the deliberate fabrication of rumor content and the complex propagation mode of rumors (Cheng et al., 2021), it is difficult for people to intercept rumors.
Rumor detection is a subtask of text classification in natural language processing, which aims to identify the news texts without any structural rules and discriminate the rumors. However, only utilizing the textual content and ignoring structural information in post-propagation networks lead to the limitation of rumor detection models. Experiments conducted by (Kwon et al., 2017; Wu et al., 2015; Chang et al., 2016; Liu and Wu, 2018a; Li et al., 2019; Huang et al., 2021)show that models employing propagation networks perform better than those using textual-content-based features. Existing deep learning methods are proposed to model the propagation network by means of neural networks such as Graph Neural Networks (GNNs) (Bian et al., 2020; Ma et al., 2017; Yuan et al., 2019; Min et al., 2022; Nguyen et al., 2022; Tian et al., 2022). These works have applied the GNN model for rumor detection to obtain the structures of post propagation networks. However, these methods have overlooked the interpretation of models, making the model performance improvement with limited space due to the black-box nature of GNNs. Unlike large Language models (LLMs), which have large model capacity and are trained with thousands of training data collected from various resources, most rumor detection models have less model capacity than LLMs and are trained with limited training data. Thus, the models are sensitive to the noise data and spurious patterns due to low model capacity and limited training data. This leads to degraded results and less robust performances. Besides, the studies of human cognition have also found that misinformation continues to spread even when it is discovered as people are more willing to believe debunked lies (Lewandowsky et al., 2012). Therefore, it is important to provide great insights for understanding the spread of rumors (Roozenbeek and Van der Linden, 2019). Few works have developed the inherent interpretation of rumor detection models.
If we assume that evidence is something that shows something else exists or is true, counterfactual explanations (Moraffah et al., 2020) are in the form of “If X had not occurred, Y would not have occurred” (Molnar, 2020). Counterfactual evidence is the principled way to answer questions such as ”if a particular part of an input graph is removed whether the prediction of the GNN model would change” and thus is highly desirable for GNNs. In the context of GNNs, removing a small fraction of nodes of the input graph identified by explanations can significantly change the predictions made by the GNNs. Counterfactual evidence is often concise and understandable (Moraffah et al., 2020; Chang et al., 2023) since they are matched with human intuitions of described causal situations (Molnar, 2020). To make explanations more robust and trustworthy, the counterfactual evidence should be diverse. Previous works (Wachter et al., 2017; Mothilal et al., 2020) have presented a compelling argument highlighting the significance of diverse counterfactuals in informing a non-expert audience about the decisions that have been made. They stated that relying on a single explanation is limiting, as it only demonstrates how a decision was based on specific data that was both accurate and unchangeable by the decision-maker before future decisions, even if there exist other data that could be modified to achieve more favorable outcomes. Existing rumor detection models focused on generating subgraphs that are relevant for a particular prediction to explain the predictions made by GNNs. Few previous studies utilize counterfactual evidence for rumor detection. Given a prediction, the counterfactual evidence assists people in understanding how the prediction can be changed to achieve an alternative outcome(Lucic et al., 2022).
In all, there are two main challenges for rumor detection.
(1) Propagation networks often contain numerous nodes and edges that are irrelevant to the task, e.g., posts that do not discuss the authenticity of news events. When applying graph neural networks on such structures, task-irrelevant information will be mixed into the neighborhood of nodes, which is known to reduce the generalization ability of subsequent classifiers (Zheng et al., 2020). Exploiting key subgraphs for rumor detection alleviates this issue and improves the interpretation and performance of graph-based rumor detection by removing task-irrelevant nodes and edges.
(2) How to generate diverse counterfactual evidence for rumor detection is a novel issue that has not been researched before. As discussed in Section 2, most GNN explanation methods are not counterfactual. These methods mainly focus on identifying subgraphs that are highly correlated with prediction results, which can not help identify the change required such that the prediction is changed.
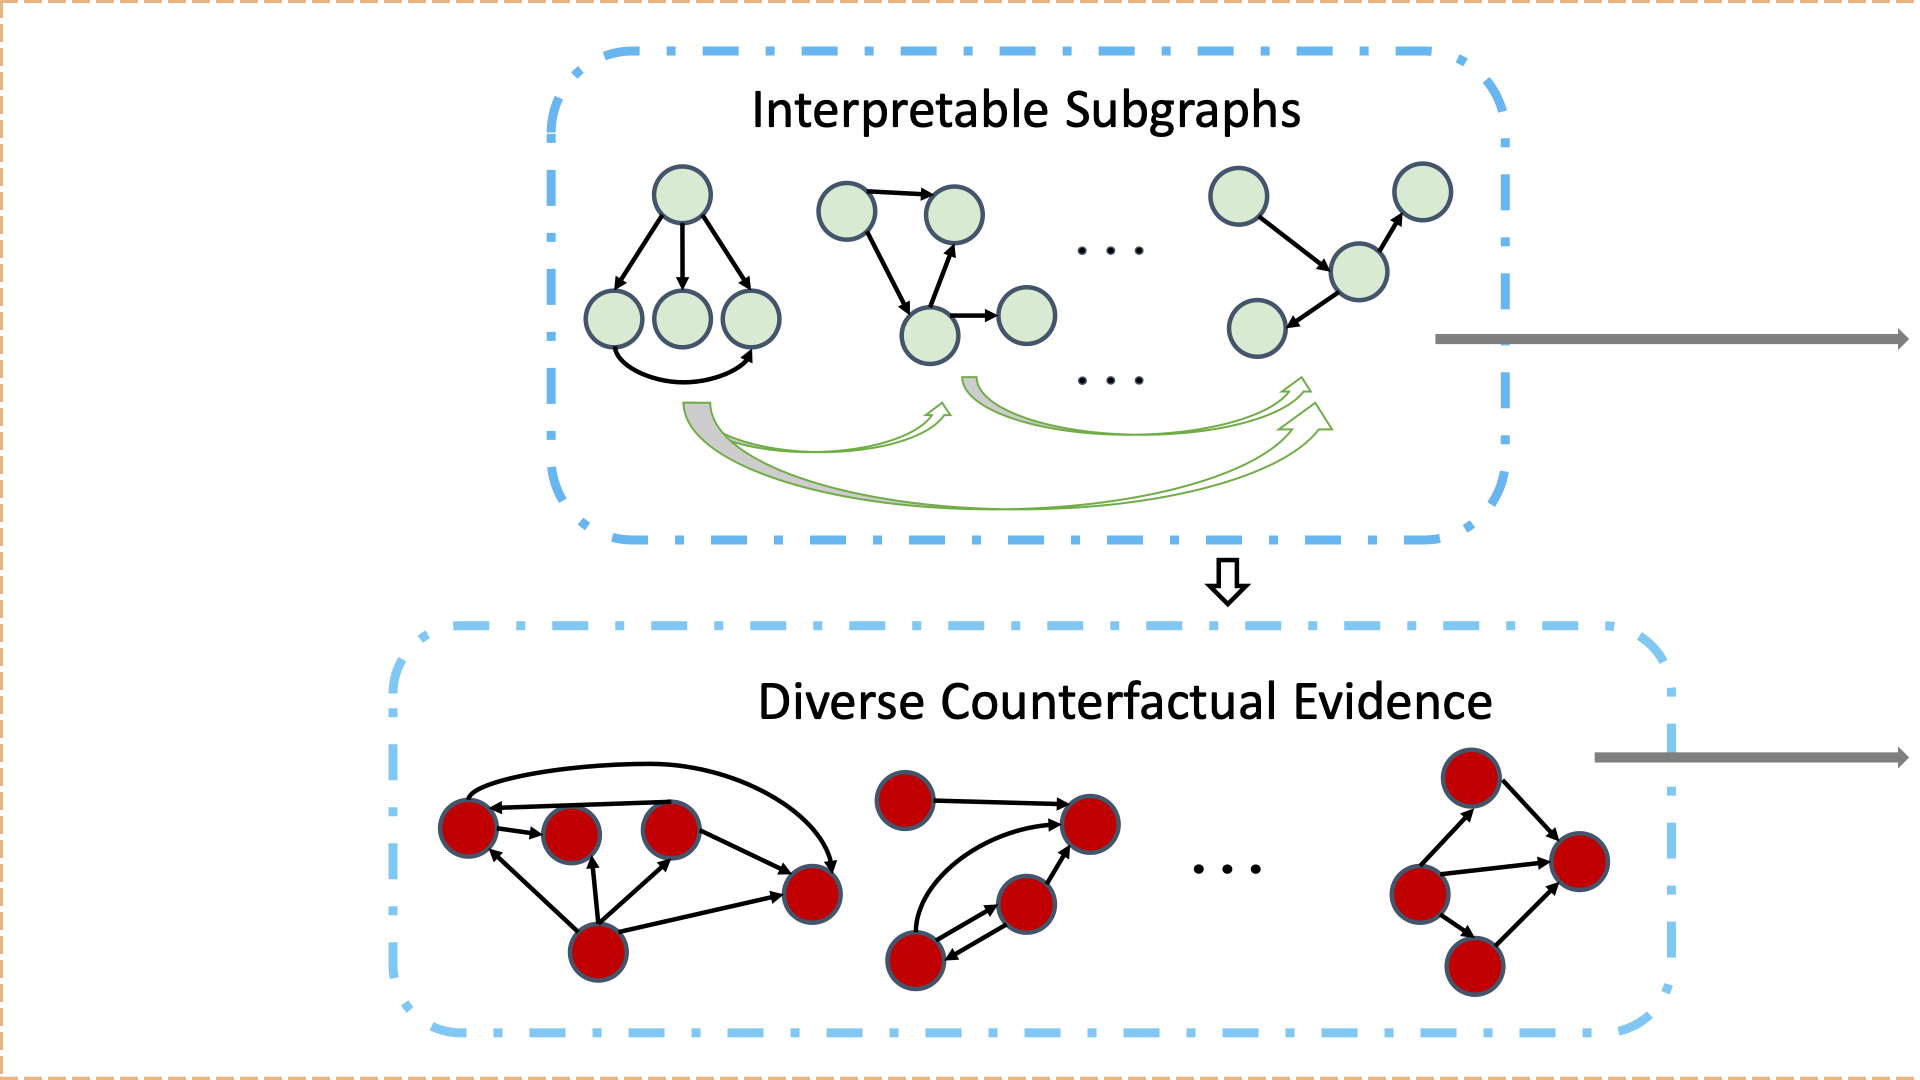
Our work resolves these challenges by developing a diverse counterfactual evidence framework (DCE-RD) for rumor detection. To be specific, we first design a subgraph generation strategy to generate explanations on each event graph, which aims to remove label-irrelevant information. We then discover diverse counterfactual evidence in rumor propagation graph, i.e. counterfactual subgraphs by removing the set of nodes included in the explanation of each event graph. Thus, these subgraphs naturally serve as counterfactual evidence for rumor detection. To achieve multi-view interpretation, we formulate a diversity loss inspired by Determinantal Point Processes (DPP) to encourage diversity among the counterfactual evidence. And DCE-RD further aggregates the diverse counterfactual evidence to achieve interpretable and robust rumor detection results. In this manner, our model can achieve good performance and achieve interpretation by revealing important counterfactual evidence for rumor detection.
In summary, our contributions are as follows:
-
•
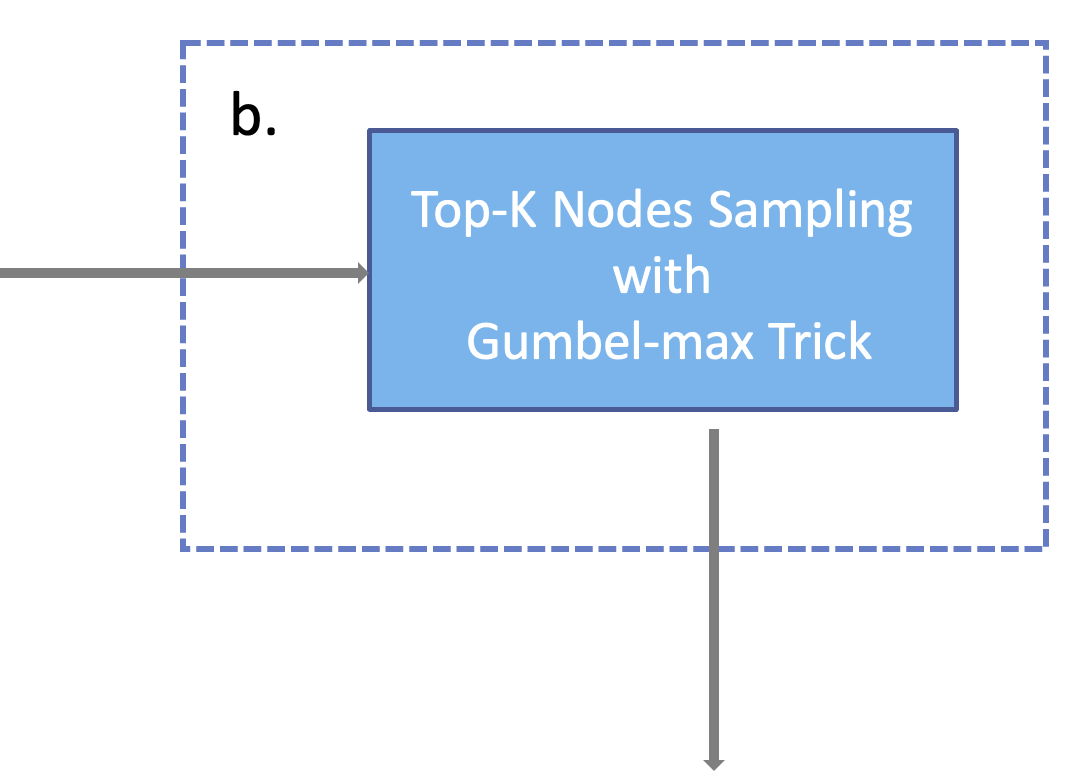
A Diverse Counterfactual Evidence framework for Rumor Detection (DCE-RD) is proposed for rumor detection. Specifically, a subgraph generation strategy based on Top-K Nodes Sampling is proposed to efficiently produce subgraphs of the event graph. Then, counterfactual evidence is discovered by constraining the removal of these subgraphs to cause the change in rumor detection results.
-
•
A diversity loss inspired by determinantal point processes (DPP) is proposed to ensure the model extracts diverse substructures of post propagation networks. By promoting diversity of the counterfactual evidence, our model can leverage different critical substructures of rumor propagation to achieve multi-view interpretation of graph-based rumor detection. DCE-RD further aggregates the diverse counterfactual evidence to achieve interpretable and robust rumor detection results.
-
•
Experimental results including comparison experiments, robustness evaluation and early rumor detection on two real-world datasets demonstrate the effectiveness and robustness of DCE-RD.
2. related works
In recent years, there has been an increasing amount of literature on rumor detection. It can be divided into two categories according to the information used for rumor detection: textual-content-based and propagation-network-based. Textual-content-based methods, which utilize the source post and all user replies, explore the stance and opinion of users towards rumors. Deceptive events usually have a different content style from the truth, often using exaggerated emotional expressions to deceive readers. Castillo et al. (Castillo et al., 2011) used many text features in their model, such as the fraction of tweets with and crafted features. These features and other additional text features are also used in (Liu et al., 2015; Enayet and El-Beltagy, 2017; Li et al., 2019). Chua and Banerjee (Chua and Banerjee, 2016) analyzed six groups of features: comprehensibility, sentiment, time-orientation, quantitative details, writing style, and topic. Ma et al. (Ma et al., 2015) considered the variation of these social context features during the message propagation over time. These approaches use statistical models or deep learning models of events and tweet content, sometimes added with detailed user profiles, to classify rumors as true or false. However, only considering the textual content leads to the ignorance of propagation structure in social networks, which could limit the detection performance of models. Propagation-network-based methods construct flexible networks to capture structural information about rumor propagation and utilize the path of re-shares and other propagation dynamics for rumor detection. There are many works exploiting various mechanisms to model the rumor propagation pattern and combining textual-content data with structural information. Gupta et al. (Gupta et al., 2012) constructed a multi-typed network consisting of events, tweets, and users. Jin et al. (Jin et al., 2014) proposed a hierarchical credibility network consisting of an event, sub-events and messages for revealing vital information for rumor detection, and they further developed credibility network with conflicting relations (Jin et al., 2016). Kernel methods are designed to evaluate the similarity between two events. Wu et al. (Wu et al., 2015) proposed a random walk graph kernel to model the similarity of propagation trees. Ma et al. (Ma et al., 2017) proposed a Propagation Tree Kernel (PTK) to differentiate false and true rumors by evaluating the similarities between their propagation tree structures, as tree kernel is specifically well-suited for structured data. Rosenfeld et al. (Rosenfeld et al., 2020) presented an efficient implementation of the Weisfeiler-Lehman graph kernel and explored whether only focusing on topological information can be predictive of veracity. Deep learning approaches including user-attention-based convolutional neural network model (Ma et al., 2018), RNN-based method (Liu and Wu, 2018b), LSTM-based model (Zubiaga et al., 2018), and GAN-style approach (Ma et al., 2019) achieve good predictive performance on rumor datasets. With the significant advancement of graph neural networks (GNNs), most existing methods have attempted to integrate GNNs with rumor detection to explore the post propagation pattern such as (Bian et al., 2020; Ma et al., 2017; Yuan et al., 2019; Min et al., 2022; Nguyen et al., 2022; Tian et al., 2022). However, these works overlooked the interpretation of the graph-based models. Our work focuses on improving the interpretation of graph-based model for rumor detection.
Interpretation in graph learning is in need as explaining predictions made by GNNs helps collect insights from graph-structured data (Wu et al., 2022; Zhang et al., 2022). Recently, an increasing number of approaches have been proposed to provide interpretation for GNNs. Chang et al. (Chang et al., 2020b) proposed a game-theoretic invariant rationalization criterion to identify a small subset of input features as best explains or supports the prediction. Yu et. al. (Yu et al., 2021a, b) proposed a Graph Information Bottleneck (GIB) framework to recognize the maximally informative yet compressive subgraphs for graph interpretation. To address the training inefficiency and instability of GIB, VGIB (Yu et al., 2022) and GSAT (Miao et al., 2022) employ the variational inference to leverage the reduction of stochasticity to select label-relevant subgraphs for graph interpretation. Chen et. al. (Chen et al., 2022b) and Yu. et al. (Yu et al., 2023) further enhance the generalization performance of GNNs by improving graph interpretation.
Inspired by methods that achieve better performance by improving graph interpretation, most approaches for rumor detection focus on identifying subgraphs as explanations for prediction. Yang et al. (Yang et al., 2022) proposed a reinforced subgraph generation method, and perform finegrained modeling on the generated subgraphs. Yet these methods are generally not Counterfactual in nature: Given a prediction, a small part of perturbation to the input graph could change the prediction (Lucic et al., 2022). Counterfactual evidence is often concise and easy to understand (Moraffah et al., 2020), as it aligns with human intuitions of causal situations. Mothilal et al. (Molnar, 2020) developed a novel method to provide post-hoc explanations of machine learning models utilizing counterfactual explanations. Our approach aims to extend an intriguing class of explanations through counterfactual evidence for graph-based models and applies to the task of rumor detection. And previous works (Wachter et al., 2017; Molnar, 2020) have presented the significance of diverse counterfactuals in informing a non-expert audience about the decisions that have been made. Relying on a single explanation is limiting as there may exist other data that could be changed to achieve a more favorable outcome. To address the aforementioned issues, we comprehensively utilize both textual content and propagation structure for rumor detection. Additionally, our work focuses on discovering diverse counterfactual evidence by recognizing multiple counterfactual subgraphs in the rumor propagation graph. By promoting diversity of the counterfactual evidence, our model can leverage different important substructures of rumor propagation to achieve multi-view interpretation of graph-based rumor detection.
3. method
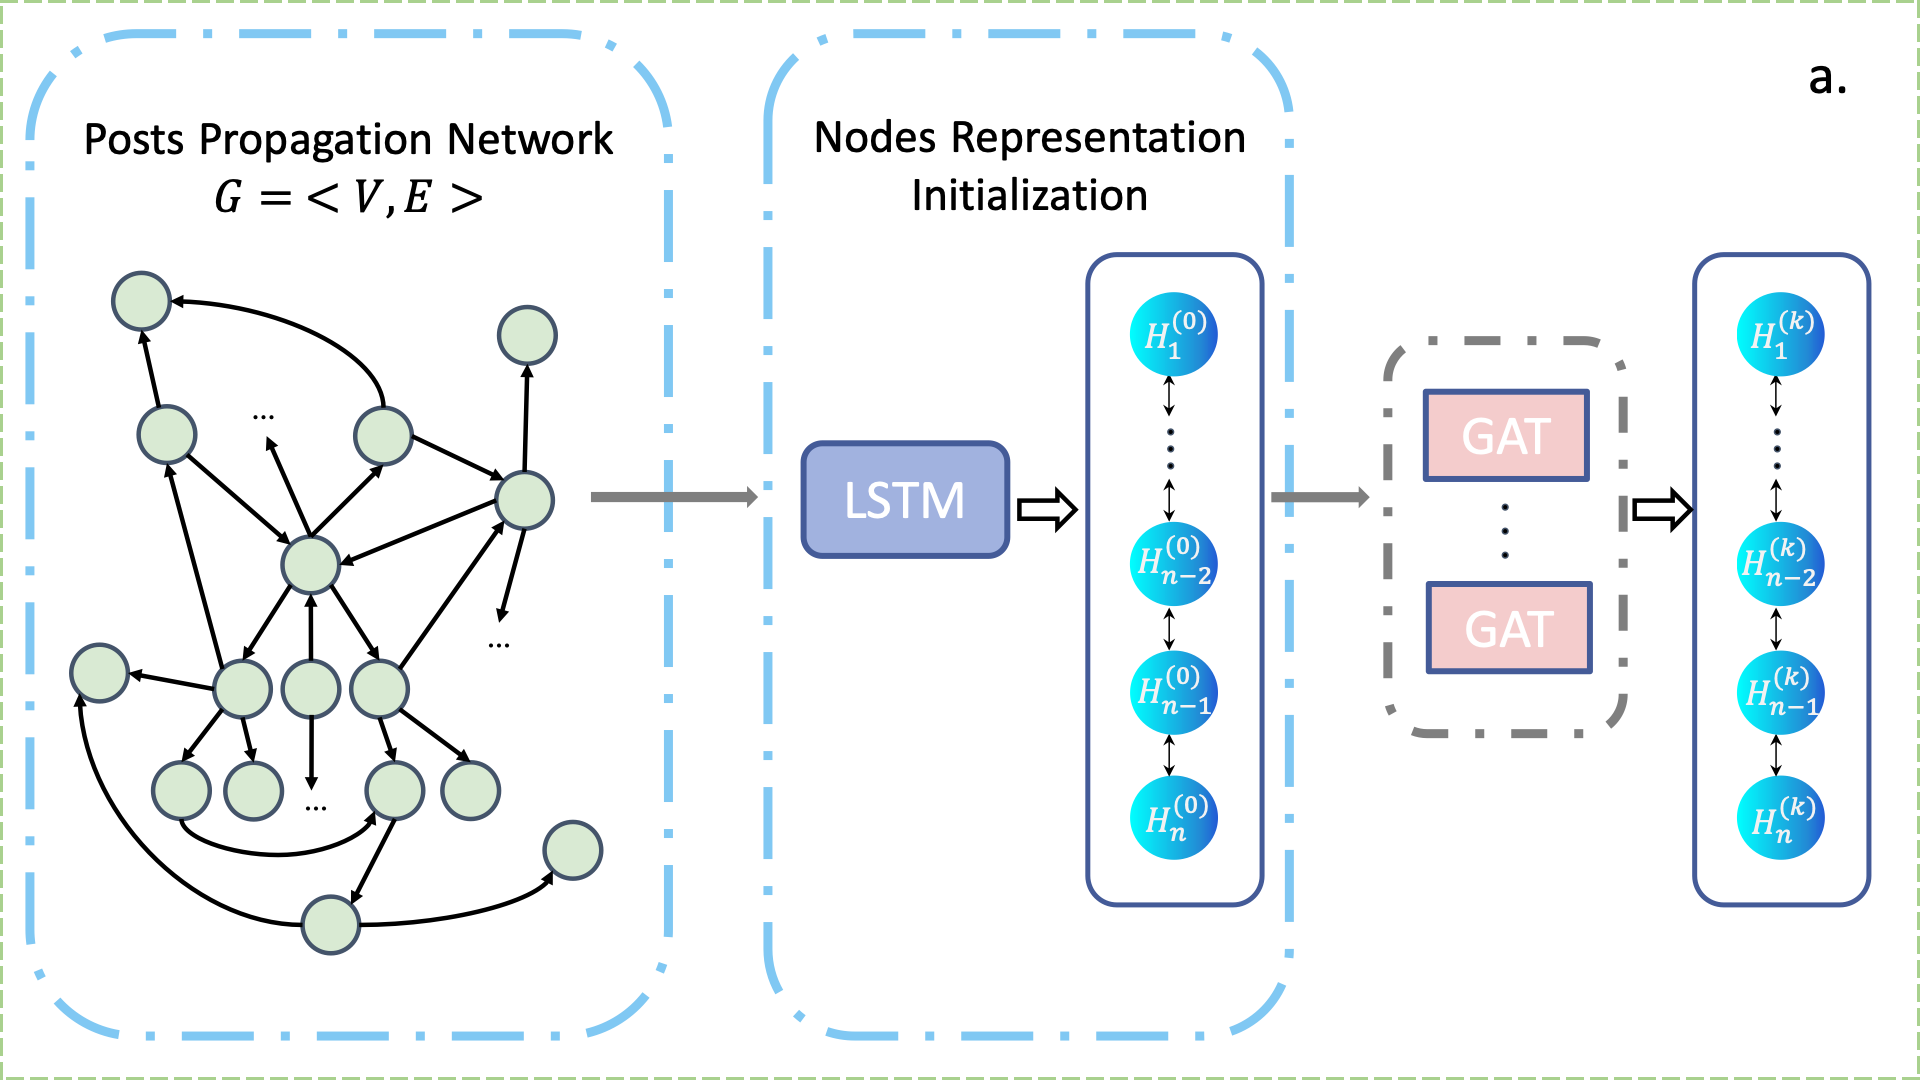
In this section, we introduce a Diverse Counterfactual Evidence framework for Rumor Detection, named as DCE-RD. The core idea of DCE-RD is to generate diverse subgraphs and counterfactual evidence based on Top-K node sampling with Gumbel-max Trick for rumor detection. Additionally, we formulate a novel loss function based on Determinantal Point Processes (DPP) as a form of robust optimization. The architecture of our method is shown in Figure 1.
3.1. Problem Formulation
Let be a rumor dataset, where is the th rumor event and is the total count of rumor events. We define , where refers to the set of posts related to the event and is the total count of posts, represents the posts propagation structure network, refers to the set of diverse subgraphs. Then removing the set of nodes identified by the from the to generate the corresponding set of counterfactual evidence . Specifically, is defined as a graph, where represents the posts contained in the event and refers to the edges from the source post to the responsive post , i.e., retweeted post or reply post (Wu et al., 2015; Ma et al., 2016). For example, if retweeted , there will be an directed edge , i.e., . If replied the , there will be an directed edge , i.e., . For each rumor event , there is a label related to its veracity, i.e., represents True Rumor and represents False Rumor (Ma et al., 2017; Zubiaga et al., 2018). The model of rumor detection is to calculate the final probability prediction .
Thus, the goal of rumor detection is achieved by minimizing the cross-entropy loss:
| (1) |
Definition 1. Counterfactual Evidence. Given a rumor propagation network of a rumor event, the set of sampled subgraphs , and its label . The Counterfactual evidence seeks for the maximum drop in the confidence of the original prediction.
The set of sampled subgraphs is formed through selecting the important nodes based on Nodes Sampling with Gumbel-max Trick, each element in the set is a connected subgraph which serves as the reason for predicting the label . Counterfactual evidence is generated by removing the set of nodes in from individually, which causes the maximum drop in the confidence of the original prediction. Similarly, counterfactual evidence serves as the reason for changing the label. We focus on optimizing the counterfactual property of evidence along with the association between the evidence and the prediction. Thus, both and are critical for rumor detection. The details are shown in Sec 3.2.
3.2. Counterfactual Evidence Generation
This section is the answer to the question how to generate interpretable subgraphs and counterfactual evidence for rumor detection.
3.2.1. Node Representation Initialization
Textual content is a strong indicator used to spot potential deception. Rumors usually gain public attention through malicious guidance or exaggerated emotional expression (Min et al., 2022). Thus, the emotional tendency, bot-like flag or political stance of posts could also imply the veracity of posts. There are many deep learning networks to represent textual content in natural language processing, such as LSTM (Shi et al., 2015), GRU (Cho et al., 2014), Transformer (Vaswani et al., 2017), Bert (Kenton and Toutanova, 2019) and GPT (Radford et al., 2018). In our work, the representation of each node is initialized by using its textual embedding and we apply LSTM (Long-Short Term Memory) (Shi et al., 2015) as textual feature extractor to obtain joint features of text and social context, which shows the best performance in our experiment. We then obtain the event text embedding matrix for any event , where is the hidden states at the last layer of LSTM for -th post.
3.2.2. Top-K Nodes Sampling
Inspired by Top-K sampling (Xie and Ermon, 2019), we present Top-K Nodes Sampling to sample nodes from a graph of nodes. We consider finite and only produce samples after processing the entire graph. In sampling, each node is associated with a weight . In our experiment, we regard the attention score matrix as a weight matrix. Let and . Let be a one-hot vector, i.e., if one nonzero element at index in a vector, . Let , a length sequence of one-hot vectors, where represents selecting in the th sample. We wish to sample from
| (2) |
which corresponds to sampling without replacement with probabilities proportional to item weights. Each node is given a random key where is drawn from a uniform distribution between . Let the top keys over the nodes be and is associated with the top keys. The output of sampling is distributed according to (Efraimidis and Spirakis, 2006). We define the function - as the Top-K Nodes Sampling.
Gumbel-max Trick The Gumbel-max trick (Yellott Jr, 1977) generates random keys by perturbing logits with Gumbel noise , then taking such that as a sample. These samples are distributed based on . The Gumbel-softmax trick makes training with backpropagation possible (Maddison et al., 2016; Jang et al., 2016) by reparameterizing the sample as a deterministic transformation of the parameters and some independent noise and relaxing the deterministic transformation (from max to softmax). The sampling details are shown in Algorithm 1.
3.2.3. Counterfactual Evidence Generation
We propose a subgraph generation strategy based on Top-K nodes sampling to allow label-relevant information kept in subgraphs and further generate counterfactual evidence, which significantly improves interpretation of the model.
Node-level attention Given an event graph of posts, the adjacent matrix and the post feature matrix , our method computes the attention score of each node through combining its textual content and topological information. Specifically, the attention score between th node and th node can be formulated as:
| (3) |
| (4) |
where is a parameter vector, a learnable parameter matrix to project nodes representation, and are unnormalized and normalized attention between the adjacent nodes and . After computing the attention scores for all neighbor nodes, the central node’s representation is updated by aggregating features weighted by the attention scores:
| (5) |
where is a nonlinear function and is a learnable update matrix parameter. Here, we adopt ReLU function as the activation function. Dropout (Srivastava et al., 2014) is applied on GraphConv Layers to avoid over-fitting. However, the update process can cause long-distance dependency. In our method, we add residual networks to update the equation:
| (6) |
Here, we adopt a modified Graph Attention Network (a.k.a GATv2) (Brody et al., 2021) as our backbone to compute the representation of the graph, which fixes the static attention problem of the standard Graph Attention Network (Veličković et al., 2017) and show more robust performance. Then, we obtain after layers of GATv2 representation.
Subgraph Generation After iterations of Top-K Nodes sampling, we obtain a set of subgraphs , where is formed from - in the th iteration. Analogously, the set of counterfactual evidence is formed as:
| (7) |
where represents the complement subgraph of all nodes which are not in the subgraph . Note that the source post is always included in the . And we only consider connected subgraphs in our experiment. Then we could obtain the embedding of subgraph , referred to .
3.3. Diversity of Evidence
Previous work (Wachter et al., 2017) has presented a compelling argument highlighting the significance of diverse counterfactuals in informing a non-expert audience about the decisions that have been made. Relying on a single explanation is limiting, as it only demonstrates how a decision was based on specific data that was both accurate and unchangeable by the decision-maker before future decisions, even if there exist other data that could be modified to achieve a more favorable outcome. Our experimental results (Tables 3 and 4) also show that diverse counterfactual evidence is better than single one. In this section, the question how to ensure the diversity of multiple counterfactuals so that they provide multi-view interpretation is to be answered.
3.3.1. Determinantal Point Processes (DPP)
For a given set , DPP is a probability measure defined over all subsets of that set. For example, a set containing elements , there are possible sub-sets and DPP defines a probability measure over subsets . DPP converts the complex probability calculation in the Discrete Point Processes problem into a simple determinant calculation, and calculates the probability of each subset through the determinant of the kernel matrix (Borodin, 2009; Kulesza et al., 2012).
For example, there is a real type, PSD (positive semi-definite) matrix , for any subset of the set , the probability of occurrence of is proportional to the determinant of matrix :
| (8) |
where, the number of rows and columns of the matrix are the number of elements of the set , the matrix can be indexed by the elements of , and the matrix is the matrix obtained by indexing the matrix through the elements of the subset . The condition of PSD (positive semidefinite) guarantees that the determinants of all submatrices of the kernel matrix are non-negative (Chen et al., 2018; Kulesza et al., 2012).
Our diversity loss encourages the sampler to generate diverse subgraphs which keep the label-relevant information and critical substructure of the input graph. However, merely increasing the similarity between generated subgraphs and input graph will lead to counterfactuals that are too close in the representation field. Instead, we are interested in increasing diversity within generated subgraphs for generating diverse counterfactual evidence. Therefore, we build a DPP kernel for each subgraph during every iteration of the training process. To simplify learning a kernel, we match the eigenvalues and eigenvectors of a subgraph DPP kernel with the other one until the end of total enumeration. The eigenvalues and vectors capture the manifold structure of subgraphs, thus making optimization more feasible.
We use Determinantal Point Processes (DPP) kernel to evaluate the diversity between subgraphs. Based on DPP-inspired loss, we extend a method to define diversity loss for subgraphs:
| (9) |
where and are the th eigenvalues of and respectively. Similarly, and are the th eigenvectors of and respectively.
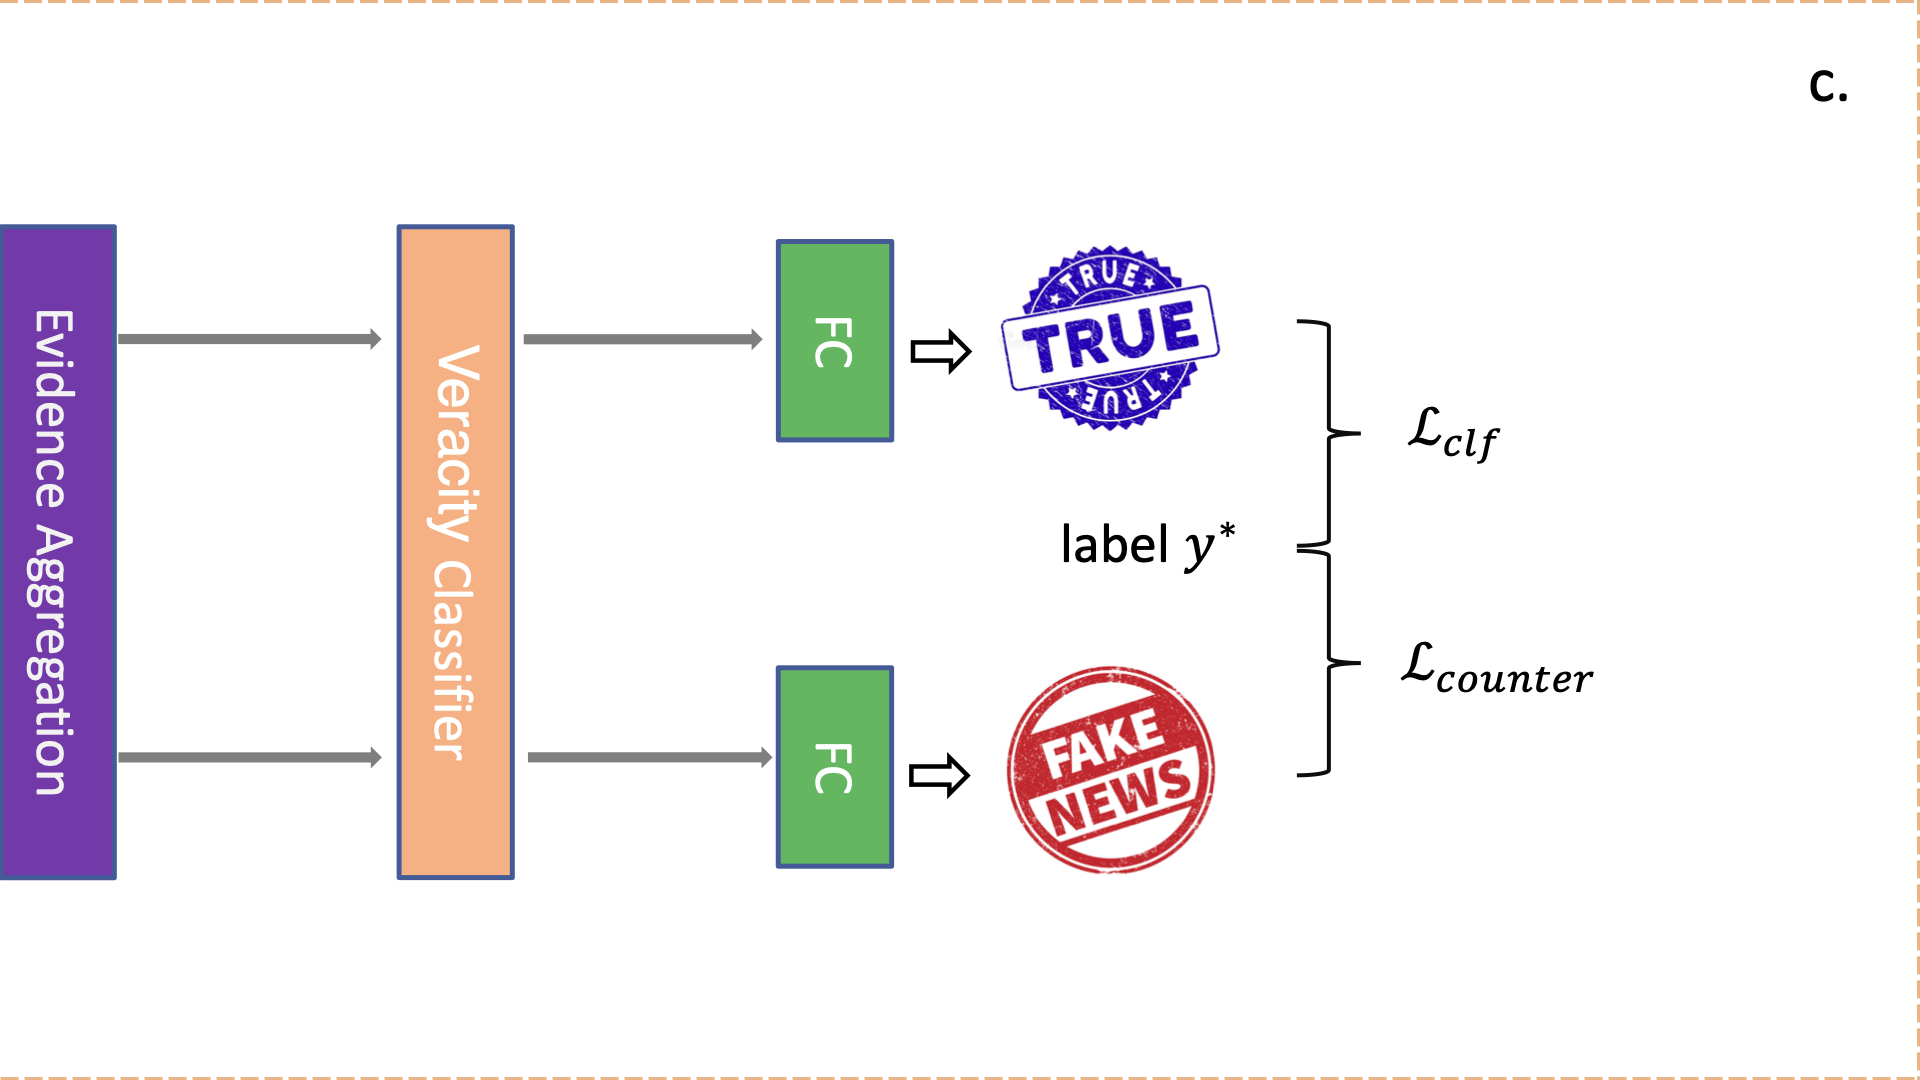
3.4. Rumor Detection with Aggregated Evidence
Given diverse interpretable evidence, we aggregate evidence for rumor detection with the classification weight matrix calculated by the embedding of each evidence. Specifically, we weighted the influence of each evidence on the prediction. Thus the label for the event could be predicted using aggregated evidence. The details are shown in Algorithm 2.
3.4.1. Evidence Aggregation
We propose a method for aggregating evidence, which also applies to counterfactuals aggregation. For any pair of subgraphs , the distance matrix of their embeddings is formed as:
| (10) |
where refers to Euclidean norm (2-norm). And,
| (11) |
where is the sum distance matrix of subgraph . And we define , is the result of summing each column of the input tensor. Then, we calculate the classification weight matrix which represents the influence of each evidence on the prediction.
| (12) |
3.4.2. Classification
Our model evaluates the probability of each class and selects the label with the highest probability as the final prediction result. We define the classification probability matrix as follows:
| (13) |
where , and are learnable parameters during training. Here we adopt ReLU function as the activation function. Dropout (Srivastava et al., 2014) is applied to avoid over-fitting.
3.4.3. Model Optimization
The total loss is divided into diversity loss, classifier loss, and counterfactual loss. Diversity loss has been introduced in Sec3.3. Classifier loss and counterfactual loss are introduced in this section.
Classifier Loss The aim of our sampler with parameter is to extract predictive subgraphs. blocks the label-irrelevant information while allowing the label-relevant information kept in subgraphs to make predictions. We define classifier loss via cross-entropy loss:
| (14) |
where is the ground-truth label of the event and .
Counterfactual Loss Similarly, we define counterfactual loss via cross-entropy loss:
| (15) |
where is the opposite of ground-truth label of the event, which refers to the change of the prediction.
Finally, we obtain the total loss:
| (16) |
where are hyper-parameters. Generally, take .
DCE-RD provides interpretable explanations for predictions by sampling nodes to form connected subgraphs in order to remove redundant information and retain information related to prediction in subgraphs. Additionally, DCE-RD focuses on discovering diverse counterfactual evidence by recognizing multiple counterfactual subgraphs in the rumor propagation graph. During training, the proposed loss function promotes the diversity among counterfactual evidence and further improves the performance of classifier. Promoting diversity of the counterfactual evidence can leverage different important substructures of rumor propagation to achieve multi-view interpretation of graph-based rumor detection.
4. experiments and results
In this section, we first compare with several baseline models to evaluate the performance of our proposed method DCE-RD. Then, Gaussian noise is added to node feature to investigate the robustness of our method. Finally, we examine the capability of early rumor detection for both DCE-RD and the compared methods.
| Labels | True Rumors | False Rumors |
|---|---|---|
| Events Count | 3381 | 4966 |
| Connections Count | 686,700 | 849,362 |
| Users Count | 849,305 | 1,165,510 |
| Tweet Count | 991,764 | 1,348,868 |
| Retweet Count | 442,863 | 580,810 |
| Reply Count | 292,272 | 317,655 |
| Avg. # of Tweet Count / event | 293 | 272 |
| Avg. # of Retweet Count / event | 131 | 117 |
| Avg. # of Reply Count / event | 86 | 64 |
| Events Count | 4664 |
|---|---|
| True Rumors | 2351 |
| False Rumors | 2313 |
| Connections Count | 3,805,656 |
| Users Count | 2,746,818 |
| Avg. # of Posts Count / event | 816 |
| Max. # of Posts Count / event | 59,318 |
| Min. # of Posts Count / event | 10 |
4.1. Datasets
Weibo and Twitter are the most popular social media in China and the U.S., respectively. We evaluate our proposed model on two real-world datasets: Weibo (Ma et al., 2016) and MC-Fake (Min et al., 2022). The MC-Fake dataset is a recently proposed dataset with more abundant news events (28334 events) compared to Twitter15 (Liu et al., 2015; Ma et al., 2016) and Twitter16 (Ma et al., 2017), including corresponding social contexts (tweets, retweets, replies, retweet_relations, replying_relations) and diverse topics (Politics, Entertainment, Health, Covid-19, Syria War) collected from Twitter via Twitter API 111https://developer.twitter.com/en. This dataset has more recent data with the emergence of topics like Covid-19. Thus, we employ MC-fake dataset for evaluation. However, MC-Fake contains huge blank data, i.e., disconnected graph, thus we further refined it. To refine MC-Fake, we first extracted the data items relevant to our experiment (tweets, retweets, replies, retweet relations, and replying relations). Then we removed events with only a single post since they cannot be connected into graphs or sampled to form subgraphs and these single-post events were in the minority of the dataset. Instead, we utilized the majority of events collected from Twitter which have a significant amount of interaction. In these two datasets, nodes refer to posts, edges represent retweet or reply relationships between two nodes. Both Weibo and MC-Fake contain two binary labels: False Rumor (F) and True Rumor (T). The label of each event in Weibo is annotated according to Sina community management center, which reports various misinformation (Ma et al., 2016). And the label of each event in MC-Fake is annotated according to the veracity tag of the article in rumor debunking websites 222e.g., snopes.com, emergent.info, etc (Ma et al., 2017). The statistics of the MC-Fake and the Weibo are shown in Table 1 and Table 2, respectively.
4.2. Baselines
We compare the proposed model DCE-RD with some state-of-the-art baselines, including:
-
•
DTC (Castillo et al., 2011): A rumor detection method using a Decision Tree classifier based on various handcrafted features to obtain information credibility.
-
•
SVM-RBF (Yang et al., 2012): A SVM-based model with Radial basis function (RBF) kernel, using handcrafted features based on the overall statistics of the posts.
-
•
SVM-TS (Ma et al., 2015): A linear SVM classifier that leverages handcrafted features to construct time-series model.
-
•
PPC_RNN+CNN (Liu and Wu, 2018b): A rumor detection model based on RNN and CNN, which learns the rumor representations through the characteristics of users in the rumor propagation path.
-
•
GLAN (Yuan et al., 2019): A global-local attention network for rumor detection, which jointly utilizes the local semantic and global structural information. To make a fair comparison, we only focus on the post propagation network yet user social network.
-
•
SureFact (Yang et al., 2022): A reinforced subgraph generation framework, which develops a hierarchical path-aware kernel graph attention network to perform fine-grained modeling on the generated subgraphs.
-
•
PSIN (Min et al., 2022): A fake news detection model, which adopts a divide-and-conquer strategy to model the post-post, user-user and post-user interactions in social context. We also focus on the post-post interactions so as to make a fair comparison.
-
•
UPFD-GCN (Kipf and Welling, 2016): A scalable approach for semi-supervised learning on graph-structured data that is based on an efficient variant of convolutional neural networks which operates directly on graphs.
-
•
GCNFN (Monti et al., 2019): A novel automatic fake news detection model based on geometric deep learning. The core algorithms are a generalization of classical convolutional neural networks to graphs, allowing the fusion of heterogeneous data.
-
•
DCE-RD (): Our proposal DCE-RD without diversity loss.
-
•
DCE-RD (): Our proposal DCE-RD with only one evidence for prediction.
4.3. Experiment Settings
We implement DTC and SVM-based models with scikit-learn 333https://scikit-learn.org/stable/. And PPC_RNN+CNN, GLAN, SureFact, PSIN, UPFD-GCN, GCNFN, and our method are implemented with Pytorch 444https://pytorch.org/. To ensure a stable and comprehensive evaluation, we adopt a five-fold cross-validation strategy. The dataset was split into 5 folds, we pick 4 folds for training, and 1 fold for testing. We evaluate the Accuracy (Acc.), F1 measure (F1), AUC (Fawcett, 2006) over the two categories and Precision (Prec.), Recall (Rec.), F1 measure (F1) on each class.
The parameters of our method are updated using mini-batch gradient descent, and we optimize the model by Adam algorithm (Kingma and Ba, 2014). The batch size is . The dimension of each node’s hidden state is . The number of neural network layers for each part is selected from . The rate of dropout is . The learning rate is selected from . The process of training is iterated upon epochs. We select nodes from a graph to form a subgraph, refers to the ratio of the number of nodes in a subgraph to the total number of nodes in the original graph. Typically, is selected from to . After iterations of the above process, subgraphs are generated to represent the diverse evidence. And is usually selected from . Hyper-parameters is selected from to . Early stopping (Yao et al., 2007) is applied when the test loss stops decreasing by epochs.
| Method | ACC | F1 | AUC | Prec | Rec | F1 | ||||
| T | F | T | F | T | F | |||||
| M1 | DTC | 0.7552 | 0.7611 | 0.8033 | 0.7451 | 0.7600 | 0.5965 | 0.8623 | 0.6626 | 0.8079 |
| SVM-RBF | 0.8482 | 0.8527 | 0.8992 | 0.9076 | 0.8218 | 0.6939 | 0.7865 | 0.8822 | ||
| SVM-TS | 0.8216 | 0.8241 | 0.8829 | 0.8210 | 0.8220 | 0.7127 | 0.8951 | 0.7630 | 0.8570 | |
| PPC_RNN+CNN | 0.6970 | 0.7349 | 0.7701 | 0.7428 | 0.7091 | 0.4572 | 0.8931 | 0.5660 | 0.7905 | |
| M2 | GLAN | 0.8546 | 0.8612 | 0.9451 | 0.8501 | 0.8831 | 0.8820 | 0.8328 | 0.8637 | 0.8536 |
| SureFact | 0.8629 | 0.8631 | 0.9344 | 0.8397 | 0.8830 | 0.8994 | 0.8396 | 0.8632 | 0.8547 | |
| PSIN | 0.8601 | 0.8577 | 0.9405 | 0.9240 | 0.7942 | 0.7933 | 0.9337 | 0.8526 | 0.8547 | |
| UPFD-GCN | 0.8700 | 0.8752 | 0.9242 | 0.8270 | 0.8180 | 0.9379 | 0.8692 | 0.8782 | ||
| GCNFN | 0.8767 | 0.8729 | 0.9478 | 0.8785 | 0.8621 | 0.8505 | 0.9076 | 0.8552 | 0.8803 | |
| Ours | DCE-RD () | 0.8855 | 0.8751 | 0.9493 | 0.9001 | 0.8412 | 0.8008 | 0.9323 | 0.8523 | 0.8864 |
| DCE-RD () | 0.8899 | 0.9021 | 0.9579 | 0.9030 | 0.9042 | 0.9034 | 0.8990 | 0.9025 | 0.9007 | |
| DCE-RD | 0.9140 | 0.9147 | ||||||||
| Method | ACC | F1 | AUC | Prec | Rec | F1 | ||||
| T | F | T | F | T | F | |||||
| M1 | DTC | 0.8136 | 0.8132 | 0.8687 | 0.7751 | 0.8501 | 0.8306 | 0.7995 | 0.8019 | 0.8240 |
| SVM-RBF | 0.8861 | 0.8861 | 0.9457 | 0.8710 | 0.8989 | 0.8795 | 0.8916 | 0.8752 | 0.8952 | |
| SVM-TS | 0.8802 | 0.8801 | 0.9338 | 0.8576 | 0.9000 | 0.8827 | 0.8780 | 0.8700 | 0.8889 | |
| PPC_RNN+CNN | 0.5237 | 0.7090 | 0.6698 | 0.6177 | 0.5813 | 0.6654 | 0.7902 | 0.5399 | 0.7892 | |
| M2 | GLAN | 0.9216 | 0.9245 | 0.9648 | 0.9146 | 0.9325 | 0.9154 | 0.9137 | 0.9293 | |
| SureFact | 0.9167 | 0.9162 | 0.9678 | 0.8945 | 0.9392 | 0.8945 | 0.9150 | 0.9140 | ||
| PSIN | 0.9038 | 0.9076 | 0.9616 | 0.8492 | 0.9198 | 0.8632 | 0.9061 | 0.8528 | 0.9107 | |
| UPFD-GCN | 0.9032 | 0.9033 | 0.9655 | 0.9208 | 0.8855 | 0.8837 | 0.9237 | 0.8981 | 0.8998 | |
| GCNFN | 0.8790 | 0.8803 | 0.9512 | 0.8921 | 0.8675 | 0.8711 | 0.8935 | 0.8773 | 0.8774 | |
| Ours | DCE-RD () | 0.9167 | 0.9182 | 0.9616 | 0.9073 | 0.9220 | 0.9351 | 0.9123 | 0.9180 | 0.9136 |
| DCE-RD () | 0.9274 | 0.9238 | 0.9678 | 0.9356 | 0.9064 | 0.9261 | 0.9237 | 0.9215 | 0.9231 | |
| DCE-RD | 0.9225 | 0.9201 | ||||||||
4.4. Overall Performance
Tables 3 and 4 show the performance of DCE-RD and all the compared baselines on the MC-Fake and Weibo dataset, respectively. From the results, we can make the following observations:
-
•
Deep learning methods perform significantly better than DTC and SVM-based models with hand-crafted features. It is reasonable as deep learning methods are capable to learn high-level representations of event graphs.
-
•
GLAN, SureFact, PSIN, UPFD-GCN, GCNFN and our method have better performance than PPC_RNN+CNN in all settings. This is because PPC_RNN+CNN only utilizes sequential information, while GLAN, SureFact, PSIN, UPFD-GCN, GCNFN and our method make use of propagation structure and base on graph neural networks.
-
•
DCE-RD tends to have better performance than the previous methods. Table 3 and 4 show that our method significantly outperforms all baselines (p-value ) in terms of six evaluation criteria on both benchmark datasets. For example, our method improves accuracy by on MC-Fake and on Ma-Weibo over the most competitive baselines. This shows that our proposal can effectively improve the interpretation and detection ability of the graph-based model. Since DCE-RD not only effectively utilizes the textual content of posts and propagation structures but also focuses on discovering diverse counterfactual evidence by recognizing multiple counterfactual subgraphs in the rumor propagation graph. As diverse counterfactual evidence helps leverage different important substructures of rumor propagation to improve multi-view interpretation, which further improves the performance of graph-based rumor detection.
-
•
Experimental results given in the row of DCE-RD () demonstrate that model with multiple counterfactuals outperforms the model with only one counterfactual. Relying on a single explanation is limiting if there exist other data that could be modified to achieve a more favorable outcome. Other results given in the row of DCE-RD () demonstrate that the proposed diversity loss is critical for rumor detection as it could ensure the diversity of counterfactual evidence, which significantly improves the detection ability of DCE-RD by leveraging multi-view interpretation.
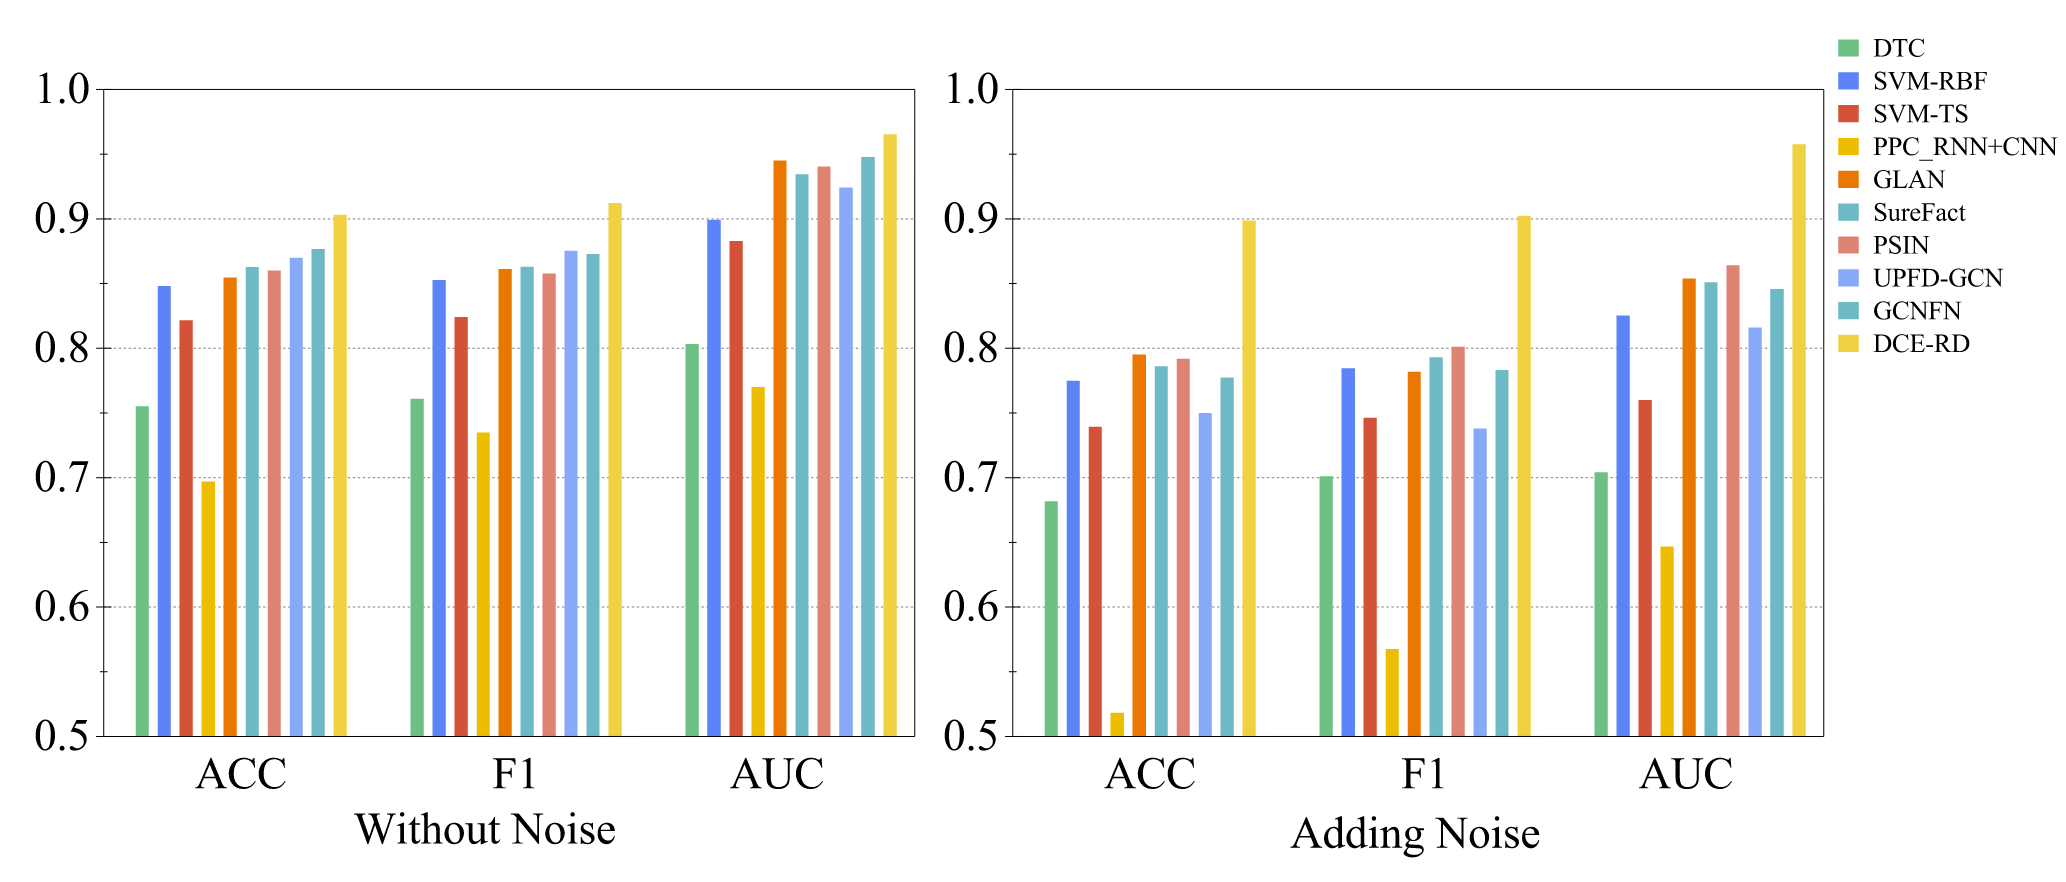
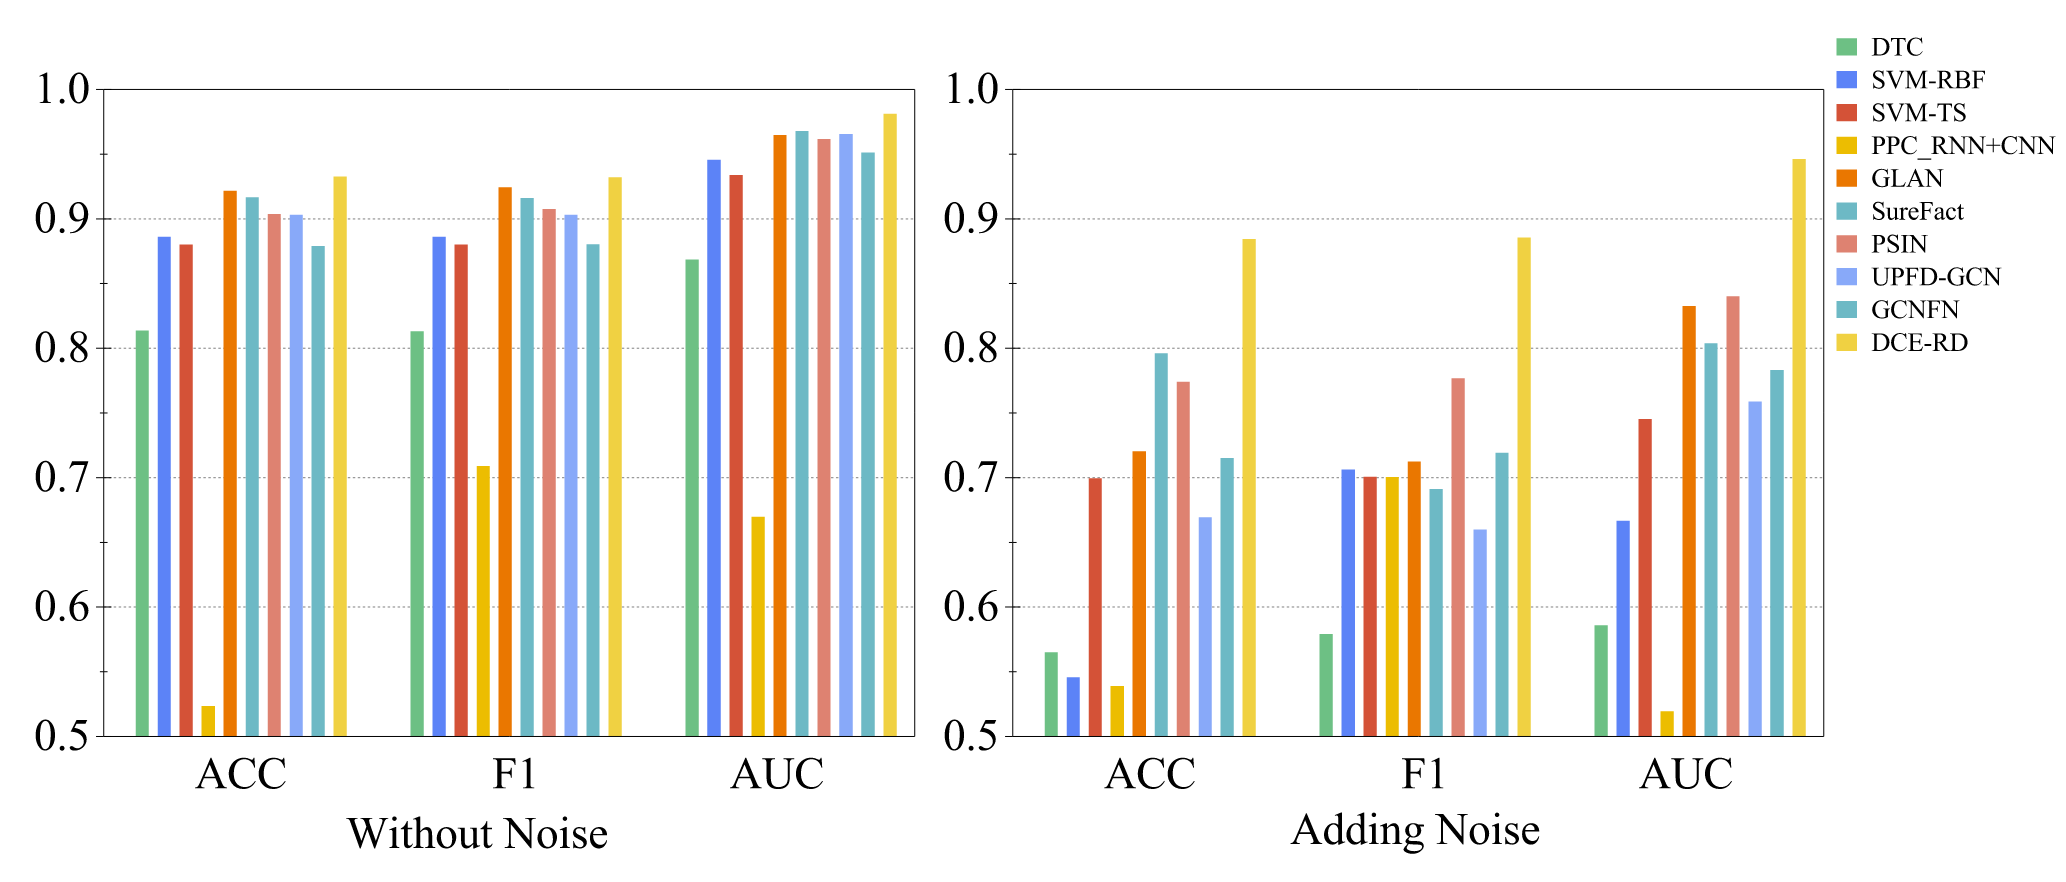
4.5. Robustness
Enhancing the robustness of the proposed method is important since GNNs usually suffer from random noise and adversarial attacks (Chang et al., 2020a; Xie et al., 2023; Gu et al., 2020; Chen et al., 2022a). Thus, we add Gaussian noise (Chen et al., 2015) to the node features to investigate the robustness of our model under the noisy node features. Investigating the model robustness to noisy node features is important as many previous works (Zheng et al., 2016; Yukawa et al., 2022; Franceschi et al., [n. d.]) have done. Thus, we conduct the experiments under noisy node features to evaluate the robustness of our model. Gaussian noise refers to a type of noise whose probability density function obeys a Gaussian distribution (normal distribution) . Specifically, we evaluate the robustness of all methods by quantifying the change in subgraphs after adding noise to the input graph. For an input graph and the set of sampled subgraphs , we generate a perturbed graph by adding random noise to the node features and randomly adding or removing some edges of the input graph such that the predictions for are consistent with . Using the same method, we get the set of subgraphs sampled on . We then compute ACC, F1 and AUC on all compared baselines and our model DCE-RD, respectively. By observing the experimental results given in Figure 2, we find that the evaluation metrics of compared baselines dropped sharply after adding noise, but DCE-RD still presents a stable result. This indicates that DCE-RD is more robust and stable under noisy node features compared with the best baseline, which demonstrates that diverse counterfactual evidence not only improves the model performance but also guarantees the robustness of model.
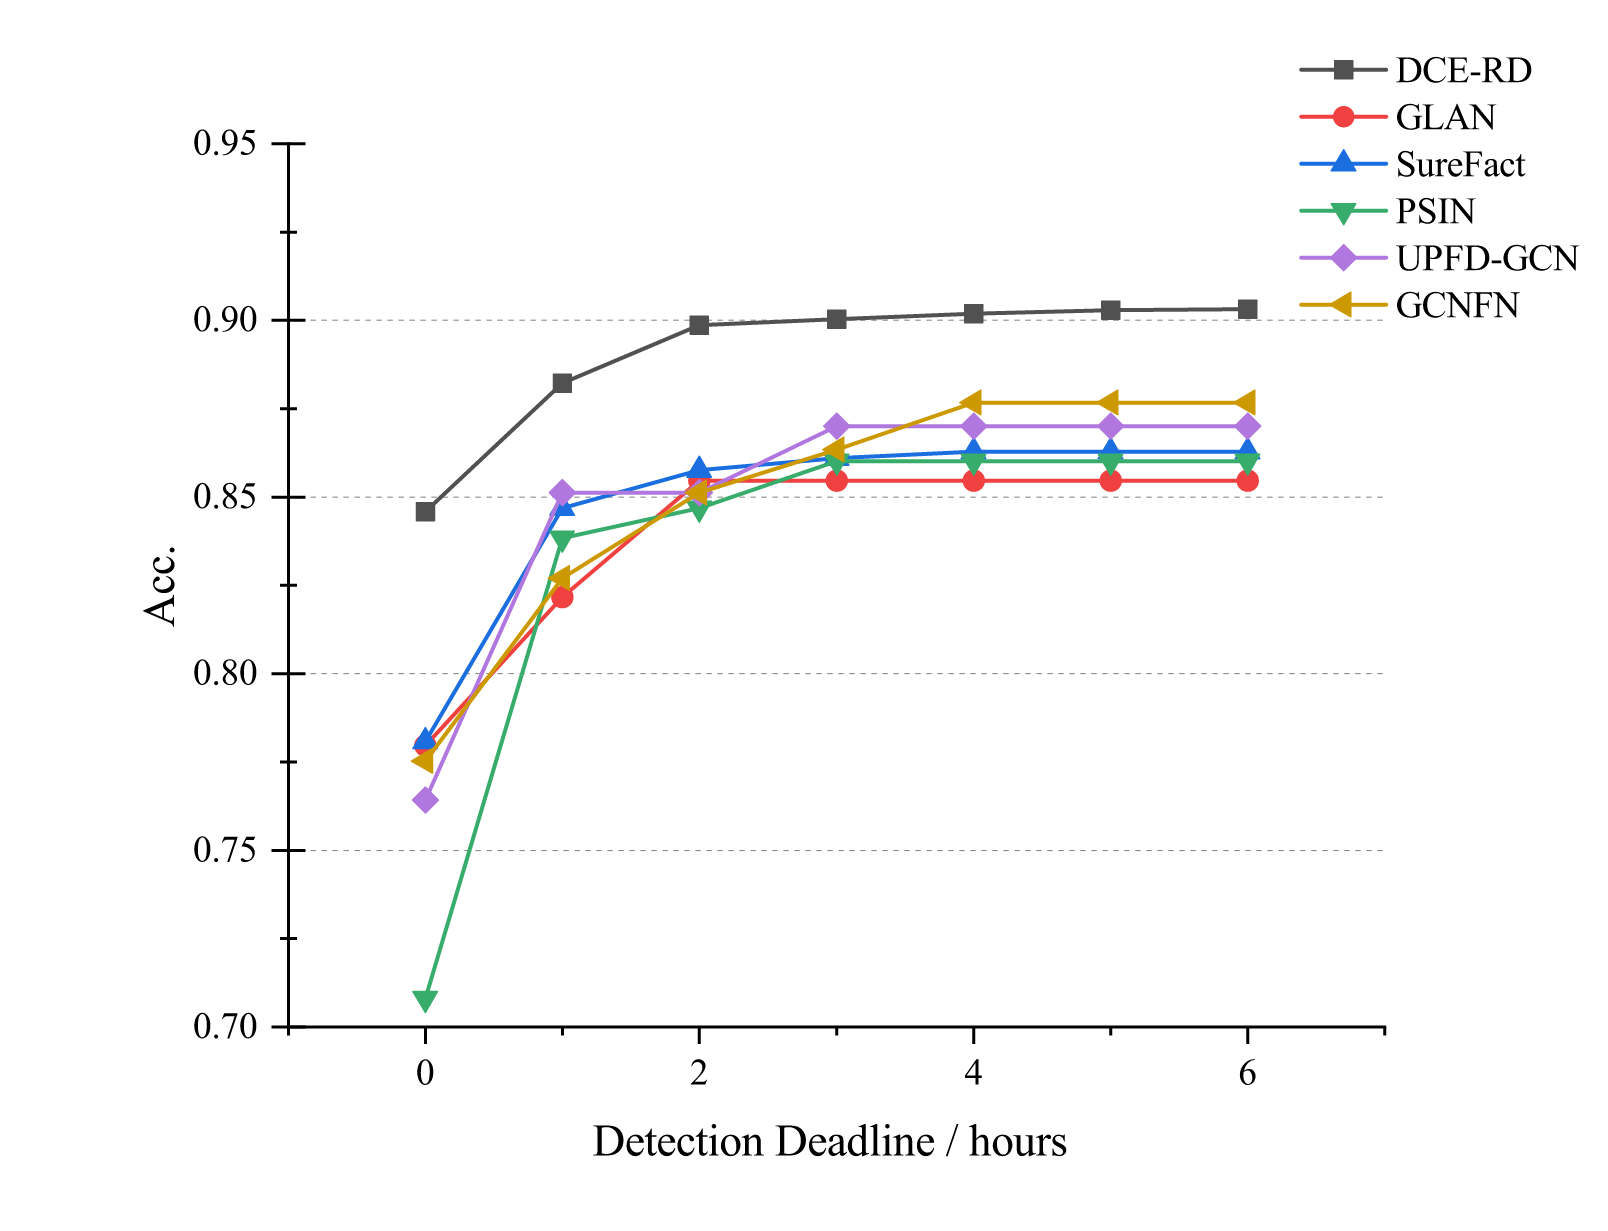
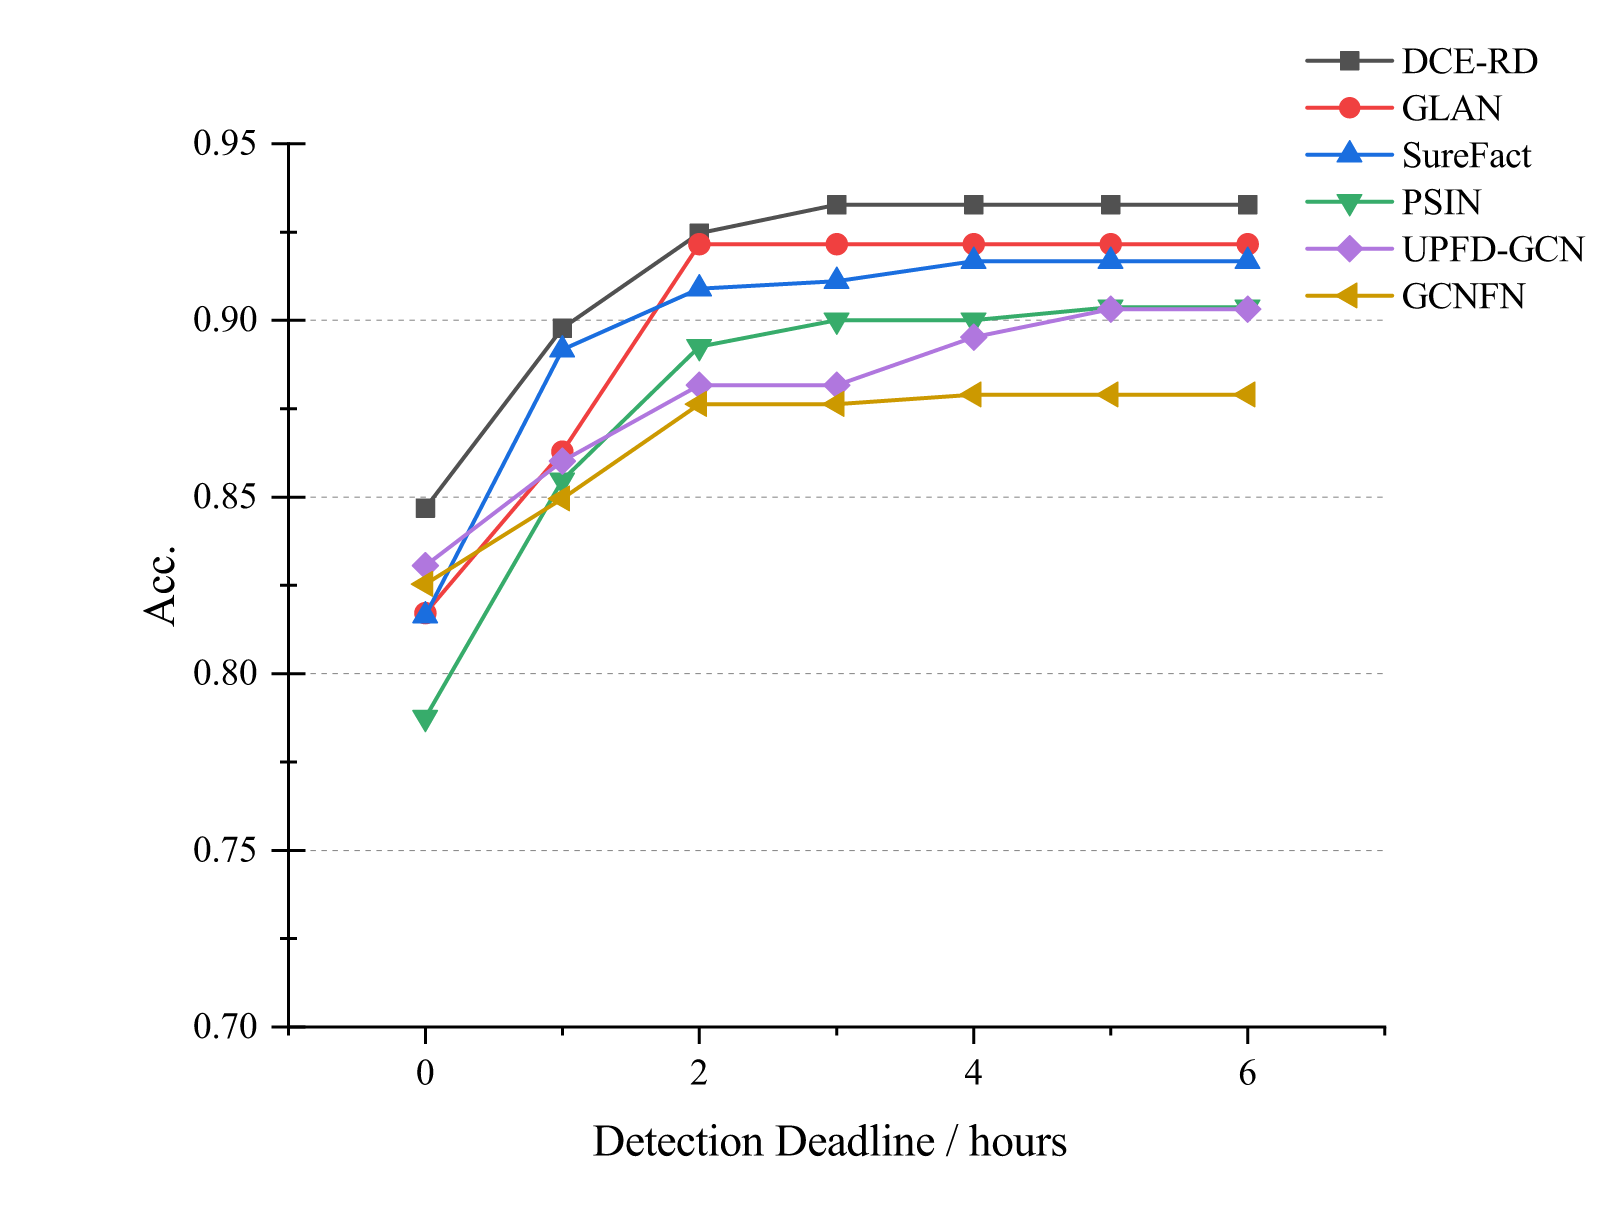
4.6. Early Rumor Detection
Early rumor detection is another important metric to evaluate the quality of the model, which aims to detect rumors at the early stage of propagation (Liu and Wu, 2018b). To establish an early detection task, we first set up a series of detection deadlines, such as hours. We then focus on evaluating the accuracy (ACC.) of DCE-RD and compared baselines only utilizing the posts released prior to the deadlines. Figure 3 shows the performances of DCE-RD versus GLAN, SureFact, PSIN, UPFD-GCN, GCNFN at various deadlines on the datasets MC-Fake and Weibo. According to the results, it can be seen that DCE-RD achieves relatively high accuracy at a very early period after the initial broadcast of source post. Besides, DCE-RD remarkably outperforms other models at every deadline, indicating that providing interpretable explanations and diverse counterfactual evidence is beneficial not only for long-term rumor detection but also for early detection.
5. conclusion
In this paper, we introduce DCE-RD, a diverse counterfactual evidence framework for rumor detection. We propose a subgraph generation strategy to discover different substructures of the event graph. Specifically, DCE-RD performs Top-K Nodes Sampling with Gumbel-max Trick on the event graph to generate a set of nodes that keeps prediction-relevant information. And our focus is on exploiting the diverse counterfactual evidence of an event graph to serve as multi-view interpretations, which is generated by constraining the removal of these subgraphs to cause the change in rumor detection results. To further achieve interpretable and robust results, we formulate a diversity loss inspired by Determinantal Point Processes to ensure the diversity of counterfactuals, which are further aggregated for robust rumor detection results. Experiments including overall detection performance, robustness evaluation and early detection verify the effectiveness and superiority of DCE-RD compared with the state-of-the-art approaches.
Acknowledgements.
This work was supported by the National Natural Science Foundation of China (NSFC) (Grant U2003111).References
- (1)
- Bian et al. (2020) Tian Bian, Xi Xiao, Tingyang Xu, Peilin Zhao, Wenbing Huang, Yu Rong, and Junzhou Huang. 2020. Rumor detection on social media with bi-directional graph convolutional networks. In Proceedings of the AAAI conference on artificial intelligence, Vol. 34. 549–556.
- Borodin (2009) Alexei Borodin. 2009. Determinantal point processes. arXiv preprint arXiv:0911.1153 (2009).
- Brody et al. (2021) Shaked Brody, Uri Alon, and Eran Yahav. 2021. How attentive are graph attention networks? arXiv preprint arXiv:2105.14491 (2021).
- Castillo et al. (2011) Carlos Castillo, Marcelo Mendoza, and Barbara Poblete. 2011. Information credibility on twitter. In Proceedings of the 20th international conference on World wide web. 675–684.
- Chang et al. (2016) Cheng Chang, Yihong Zhang, Claudia Szabo, and Quan Sheng. 2016. Extreme User and Political Rumor Detection on Twitter. 751–763. https://doi.org/10.1007/978-3-319-49586-6_54
- Chang et al. (2023) Heng Chang, Jie Cai, and Jia Li. 2023. Knowledge Graph Completion with Counterfactual Augmentation. In Proceedings of the ACM Web Conference 2023. 2611–2620.
- Chang et al. (2020a) Heng Chang, Yu Rong, Tingyang Xu, Wenbing Huang, Honglei Zhang, Peng Cui, Wenwu Zhu, and Junzhou Huang. 2020a. A restricted black-box adversarial framework towards attacking graph embedding models. In Proceedings of the AAAI Conference on Artificial Intelligence, Vol. 34. 3389–3396.
- Chang et al. (2020b) Shiyu Chang, Yang Zhang, Mo Yu, and Tommi S Jaakkola. 2020b. Invariant Rationalization. arXiv preprint arXiv:2003.09772 (2020).
- Chen et al. (2015) Guangyong Chen, Fengyuan Zhu, and Pheng Ann Heng. 2015. An efficient statistical method for image noise level estimation. In Proceedings of the IEEE International Conference on Computer Vision. 477–485.
- Chen et al. (2018) Laming Chen, Guoxin Zhang, and Eric Zhou. 2018. Fast greedy map inference for determinantal point process to improve recommendation diversity. Advances in Neural Information Processing Systems 31 (2018).
- Chen et al. (2022a) Yongqiang Chen, Han Yang, Yonggang Zhang, Kaili Ma, Tongliang Liu, Bo Han, and James Cheng. 2022a. Understanding and improving graph injection attack by promoting unnoticeability. arXiv preprint arXiv:2202.08057 (2022).
- Chen et al. (2022b) Yongqiang Chen, Yonggang Zhang, Yatao Bian, Han Yang, MA Kaili, Binghui Xie, Tongliang Liu, Bo Han, and James Cheng. 2022b. Learning causally invariant representations for out-of-distribution generalization on graphs. Advances in Neural Information Processing Systems 35 (2022), 22131–22148.
- Cheng et al. (2021) Lu Cheng, Ruocheng Guo, Kai Shu, and Huan Liu. 2021. Causal understanding of fake news dissemination on social media. In Proceedings of the 27th ACM SIGKDD Conference on Knowledge Discovery & Data Mining. 148–157.
- Cho et al. (2014) Kyunghyun Cho, Bart Van Merriënboer, Caglar Gulcehre, Dzmitry Bahdanau, Fethi Bougares, Holger Schwenk, and Yoshua Bengio. 2014. Learning phrase representations using RNN encoder-decoder for statistical machine translation. arXiv preprint arXiv:1406.1078 (2014).
- Chua and Banerjee (2016) Alton YK Chua and Snehasish Banerjee. 2016. Linguistic predictors of rumor veracity on the internet. In Proceedings of the International MultiConference of Engineers and Computer Scientists, Vol. 1. Nanyang Technological University Singapore, 387.
- Efraimidis and Spirakis (2006) Pavlos S Efraimidis and Paul G Spirakis. 2006. Weighted random sampling with a reservoir. Information processing letters 97, 5 (2006), 181–185.
- Enayet and El-Beltagy (2017) Omar Enayet and Samhaa R. El-Beltagy. 2017. NileTMRG at SemEval-2017 Task 8: Determining Rumour and Veracity Support for Rumours on Twitter.. In Proceedings of the 11th International Workshop on Semantic Evaluation (SemEval-2017). Association for Computational Linguistics, Vancouver, Canada, 470–474. https://doi.org/10.18653/v1/S17-2082
- Fawcett (2006) Tom Fawcett. 2006. An introduction to ROC analysis. Pattern recognition letters 27, 8 (2006), 861–874.
- Franceschi et al. ([n. d.]) Jean-Yves Franceschi, Alhussein Fawzi, and Omar Fawzi. [n. d.]. Robustness of classifiers to uniform lp and Gaussian noise Supplementary material. ([n. d.]).
- Gu et al. (2020) Fangda Gu, Heng Chang, Wenwu Zhu, Somayeh Sojoudi, and Laurent El Ghaoui. 2020. Implicit Graph Neural Networks. In Advances in Neural Information Processing Systems, Vol. 33. 11984–11995.
- Gupta et al. (2012) Manish Gupta, Peixiang Zhao, and Jiawei Han. 2012. Evaluating event credibility on twitter. In Proceedings of the 2012 SIAM international conference on data mining. SIAM, 153–164.
- Huang et al. (2021) Tinglin Huang, Yuxiao Dong, Ming Ding, Zhen Yang, Wenzheng Feng, Xinyu Wang, and Jie Tang. 2021. Mixgcf: An improved training method for graph neural network-based recommender systems. In Proceedings of the 27th ACM SIGKDD Conference on Knowledge Discovery & Data Mining. 665–674.
- Jang et al. (2016) Eric Jang, Shixiang Gu, and Ben Poole. 2016. Categorical reparameterization with gumbel-softmax. arXiv preprint arXiv:1611.01144 (2016).
- Jin et al. (2014) Zhiwei Jin, Juan Cao, Yu-Gang Jiang, and Yongdong Zhang. 2014. News Credibility Evaluation on Microblog with a Hierarchical Propagation Model. In 2014 IEEE International Conference on Data Mining. 230–239. https://doi.org/10.1109/ICDM.2014.91
- Jin et al. (2016) Zhiwei Jin, Juan Cao, Yongdong Zhang, and Jiebo Luo. 2016. News verification by exploiting conflicting social viewpoints in microblogs. In Proceedings of the AAAI conference on artificial intelligence, Vol. 30.
- Kenton and Toutanova (2019) Jacob Devlin Ming-Wei Chang Kenton and Lee Kristina Toutanova. 2019. Bert: Pre-training of deep bidirectional transformers for language understanding. In Proceedings of naacL-HLT, Vol. 1. 2.
- Kingma and Ba (2014) Diederik P Kingma and Jimmy Ba. 2014. Adam: A method for stochastic optimization. arXiv preprint arXiv:1412.6980 (2014).
- Kipf and Welling (2016) Thomas N Kipf and Max Welling. 2016. Semi-supervised classification with graph convolutional networks. arXiv preprint arXiv:1609.02907 (2016).
- Kulesza et al. (2012) Alex Kulesza, Ben Taskar, et al. 2012. Determinantal point processes for machine learning. Foundations and Trends® in Machine Learning 5, 2–3 (2012), 123–286.
- Kwon et al. (2017) Sejeong Kwon, Meeyoung Cha, and Kyomin Jung. 2017. Rumor detection over varying time windows. PloS one 12, 1 (2017), e0168344.
- Lewandowsky et al. (2012) Stephan Lewandowsky, Ullrich KH Ecker, Colleen M Seifert, Norbert Schwarz, and John Cook. 2012. Misinformation and its correction: Continued influence and successful debiasing. Psychological science in the public interest 13, 3 (2012), 106–131.
- Li et al. (2019) Quanzhi Li, Qiong Zhang, and Luo Si. 2019. Rumor Detection by Exploiting User Credibility Information, Attention and Multi-task Learning. In Proceedings of the 57th Annual Meeting of the Association for Computational Linguistics. Association for Computational Linguistics, Florence, Italy, 1173–1179. https://doi.org/10.18653/v1/P19-1113
- Liu et al. (2015) Xiaomo Liu, Armineh Nourbakhsh, Quanzhi Li, Rui Fang, and Sameena Shah. 2015. Real-Time Rumor Debunking on Twitter. In Proceedings of the 24th ACM International on Conference on Information and Knowledge Management (Melbourne, Australia) (CIKM ’15). Association for Computing Machinery, New York, NY, USA, 1867–1870. https://doi.org/10.1145/2806416.2806651
- Liu and Wu (2018a) Yang Liu and Yi-fang Brook Wu. 2018a. Early Detection of Fake News on Social Media Through Propagation Path Classification with Recurrent and Convolutional Networks. In Proceedings of the Thirty-Second AAAI Conference on Artificial Intelligence, (AAAI-18), the 30th innovative Applications of Artificial Intelligence (IAAI-18), and the 8th AAAI Symposium on Educational Advances in Artificial Intelligence (EAAI-18), New Orleans, Louisiana, USA, February 2-7, 2018, Sheila A. McIlraith and Kilian Q. Weinberger (Eds.). AAAI Press, 354–361. https://www.aaai.org/ocs/index.php/AAAI/AAAI18/paper/view/16826
- Liu and Wu (2018b) Yang Liu and Yi-Fang Wu. 2018b. Early detection of fake news on social media through propagation path classification with recurrent and convolutional networks. In Proceedings of the AAAI conference on artificial intelligence, Vol. 32.
- Lucic et al. (2022) Ana Lucic, Maartje A Ter Hoeve, Gabriele Tolomei, Maarten De Rijke, and Fabrizio Silvestri. 2022. Cf-gnnexplainer: Counterfactual explanations for graph neural networks. In International Conference on Artificial Intelligence and Statistics. PMLR, 4499–4511.
- Ma et al. (2016) Jing Ma, Wei Gao, Prasenjit Mitra, Sejeong Kwon, Bernard J. Jansen, Kam-Fai Wong, and Meeyoung Cha. 2016. Detecting Rumors from Microblogs with Recurrent Neural Networks. In Proceedings of the Twenty-Fifth International Joint Conference on Artificial Intelligence (New York, New York, USA) (IJCAI’16). AAAI Press, 3818–3824.
- Ma et al. (2015) Jing Ma, Wei Gao, Zhongyu Wei, Yueming Lu, and Kam-Fai Wong. 2015. Detect rumors using time series of social context information on microblogging websites. In Proceedings of the 24th ACM international on conference on information and knowledge management. 1751–1754.
- Ma et al. (2017) Jing Ma, Wei Gao, and Kam-Fai Wong. 2017. Detect rumors in microblog posts using propagation structure via kernel learning. Association for Computational Linguistics.
- Ma et al. (2018) Jing Ma, Wei Gao, and Kam-Fai Wong. 2018. Rumor detection on twitter with tree-structured recursive neural networks. Association for Computational Linguistics.
- Ma et al. (2019) Jing Ma, Wei Gao, and Kam-Fai Wong. 2019. Detect rumors on twitter by promoting information campaigns with generative adversarial learning. In The world wide Web conference. 3049–3055.
- Maddison et al. (2016) Chris J Maddison, Andriy Mnih, and Yee Whye Teh. 2016. The concrete distribution: A continuous relaxation of discrete random variables. arXiv preprint arXiv:1611.00712 (2016).
- Miao et al. (2022) Siqi Miao, Mia Liu, and Pan Li. 2022. Interpretable and generalizable graph learning via stochastic attention mechanism. In International Conference on Machine Learning. PMLR, 15524–15543.
- Min et al. (2022) Erxue Min, Yu Rong, Yatao Bian, Tingyang Xu, Peilin Zhao, Junzhou Huang, and Sophia Ananiadou. 2022. Divide-and-Conquer: Post-User Interaction Network for Fake News Detection on Social Media. In Proceedings of the ACM Web Conference 2022 (Virtual Event, Lyon, France) (WWW ’22). Association for Computing Machinery, New York, NY, USA, 1148–1158. https://doi.org/10.1145/3485447.3512163
- Molnar (2020) Christoph Molnar. 2020. Interpretable machine learning. Lulu. com.
- Monti et al. (2019) Federico Monti, Fabrizio Frasca, Davide Eynard, Damon Mannion, and Michael M Bronstein. 2019. Fake news detection on social media using geometric deep learning. arXiv preprint arXiv:1902.06673 (2019).
- Moraffah et al. (2020) Raha Moraffah, Mansooreh Karami, Ruocheng Guo, Adrienne Raglin, and Huan Liu. 2020. Causal Interpretability for Machine Learning - Problems, Methods and Evaluation. SIGKDD Explor. Newsl. 22, 1 (may 2020), 18–33. https://doi.org/10.1145/3400051.3400058
- Mothilal et al. (2020) Ramaravind K Mothilal, Amit Sharma, and Chenhao Tan. 2020. Explaining machine learning classifiers through diverse counterfactual explanations. In Proceedings of the 2020 conference on fairness, accountability, and transparency. 607–617.
- Nguyen et al. (2022) Van-Hoang Nguyen, Kazunari Sugiyama, Preslav Nakov, and Min-Yen Kan. 2022. FANG: Leveraging Social Context for Fake News Detection Using Graph Representation. Commun. ACM 65, 4 (mar 2022), 124–132. https://doi.org/10.1145/3517214
- Radford et al. (2018) Alec Radford, Karthik Narasimhan, Tim Salimans, Ilya Sutskever, et al. 2018. Improving language understanding by generative pre-training. (2018).
- Roozenbeek and Van der Linden (2019) Jon Roozenbeek and Sander Van der Linden. 2019. Fake news game confers psychological resistance against online misinformation. Palgrave Communications 5, 1 (2019), 1–10.
- Rosenfeld et al. (2020) Nir Rosenfeld, Aron Szanto, and David C. Parkes. 2020. A Kernel of Truth: Determining Rumor Veracity on Twitter by Diffusion Pattern Alone (WWW ’20). Association for Computing Machinery, New York, NY, USA, 1018–1028. https://doi.org/10.1145/3366423.3380180
- Shi et al. (2015) Xingjian Shi, Zhourong Chen, Hao Wang, Dit-Yan Yeung, Wai-Kin Wong, and Wang-chun Woo. 2015. Convolutional LSTM network: A machine learning approach for precipitation nowcasting. Advances in neural information processing systems 28 (2015).
- Srivastava et al. (2014) Nitish Srivastava, Geoffrey Hinton, Alex Krizhevsky, Ilya Sutskever, and Ruslan Salakhutdinov. 2014. Dropout: a simple way to prevent neural networks from overfitting. The journal of machine learning research 15, 1 (2014), 1929–1958.
- Tian et al. (2022) Lin Tian, Xiuzhen Zhang, and Jey Han Lau. 2022. DUCK: Rumour Detection on Social Media by Modelling User and Comment Propagation Networks. In Proceedings of the 2022 Conference of the North American Chapter of the Association for Computational Linguistics: Human Language Technologies. Association for Computational Linguistics, Seattle, United States, 4939–4949. https://doi.org/10.18653/v1/2022.naacl-main.364
- Vaswani et al. (2017) Ashish Vaswani, Noam Shazeer, Niki Parmar, Jakob Uszkoreit, Llion Jones, Aidan N Gomez, Łukasz Kaiser, and Illia Polosukhin. 2017. Attention is all you need. Advances in neural information processing systems 30 (2017).
- Veličković et al. (2017) Petar Veličković, Guillem Cucurull, Arantxa Casanova, Adriana Romero, Pietro Lio, and Yoshua Bengio. 2017. Graph attention networks. arXiv preprint arXiv:1710.10903 (2017).
- Wachter et al. (2017) Sandra Wachter, Brent Mittelstadt, and Chris Russell. 2017. Counterfactual explanations without opening the black box: Automated decisions and the GDPR. Harv. JL & Tech. 31 (2017), 841.
- Wu et al. (2022) Bingzhe Wu, Jintang Li, Junchi Yu, Yatao Bian, Hengtong Zhang, CHaochao Chen, Chengbin Hou, Guoji Fu, Liang Chen, Tingyang Xu, et al. 2022. A survey of trustworthy graph learning: Reliability, explainability, and privacy protection. arXiv preprint arXiv:2205.10014 (2022).
- Wu et al. (2015) Ke Wu, Song Yang, and Kenny Q Zhu. 2015. False rumors detection on sina weibo by propagation structures. In 2015 IEEE 31st international conference on data engineering. IEEE, 651–662.
- Xie et al. (2023) Beini Xie, Heng Chang, Ziwei Zhang, Xin Wang, Daixin Wang, Zhiqiang Zhang, Rex Ying, and Wenwu Zhu. 2023. Adversarially Robust Neural Architecture Search for Graph Neural Networks. In Proceedings of the IEEE/CVF Conference on Computer Vision and Pattern Recognition. 8143–8152.
- Xie and Ermon (2019) Sang Michael Xie and Stefano Ermon. 2019. Reparameterizable Subset Sampling via Continuous Relaxations. In Proceedings of the 28th International Joint Conference on Artificial Intelligence (Macao, China) (IJCAI’19). AAAI Press, 3919–3925.
- Yang et al. (2012) Fan Yang, Yang Liu, Xiaohui Yu, and Min Yang. 2012. Automatic detection of rumor on sina weibo. In Proceedings of the ACM SIGKDD workshop on mining data semantics. 1–7.
- Yang et al. (2022) Ruichao Yang, Xiting Wang, Yiqiao Jin, Chaozhuo Li, Jianxun Lian, and Xing Xie. 2022. Reinforcement subgraph reasoning for fake news detection. In Proceedings of the 28th ACM SIGKDD Conference on Knowledge Discovery and Data Mining. 2253–2262.
- Yao et al. (2007) Yuan Yao, Lorenzo Rosasco, and Andrea Caponnetto. 2007. On early stopping in gradient descent learning. Constructive Approximation 26, 2 (2007), 289–315.
- Yellott Jr (1977) John I Yellott Jr. 1977. The relationship between Luce’s choice axiom, Thurstone’s theory of comparative judgment, and the double exponential distribution. Journal of Mathematical Psychology 15, 2 (1977), 109–144.
- Yu et al. (2022) Junchi Yu, Jie Cao, and Ran He. 2022. Improving subgraph recognition with variational graph information bottleneck. In Proceedings of the IEEE/CVF Conference on Computer Vision and Pattern Recognition. 19396–19405.
- Yu et al. (2023) Junchi Yu, Jian Liang, and Ran He. 2023. Mind the Label Shift of Augmentation-based Graph OOD Generalization. In Proceedings of the IEEE/CVF Conference on Computer Vision and Pattern Recognition. 11620–11630.
- Yu et al. (2021a) Junchi Yu, Tingyang Xu, Yu Rong, Yatao Bian, Junzhou Huang, and Ran He. 2021a. Graph information bottleneck for subgraph recognition. ICLR (2021).
- Yu et al. (2021b) Junchi Yu, Tingyang Xu, Yu Rong, Yatao Bian, Junzhou Huang, and Ran He. 2021b. Recognizing predictive substructures with subgraph information bottleneck. IEEE Transactions on Pattern Analysis and Machine Intelligence (2021).
- Yuan et al. (2019) Chunyuan Yuan, Qianwen Ma, Wei Zhou, Jizhong Han, and Songlin Hu. 2019. Jointly embedding the local and global relations of heterogeneous graph for rumor detection. In The 19th IEEE International Conference on Data Mining. IEEE.
- Yukawa et al. (2022) Masahiro Yukawa, Kyohei Suzuki, and Isao Yamada. 2022. Stable robust regression under sparse outlier and Gaussian noise. In 2022 30th European Signal Processing Conference (EUSIPCO). IEEE, 2236–2240.
- Zhang et al. (2022) He Zhang, Bang Wu, Xingliang Yuan, Shirui Pan, Hanghang Tong, and Jian Pei. 2022. Trustworthy graph neural networks: Aspects, methods and trends. arXiv preprint arXiv:2205.07424 (2022).
- Zheng et al. (2020) Cheng Zheng, Bo Zong, Wei Cheng, Dongjin Song, Jingchao Ni, Wenchao Yu, Haifeng Chen, and Wei Wang. 2020. Robust graph representation learning via neural sparsification. In International Conference on Machine Learning. PMLR, 11458–11468.
- Zheng et al. (2016) Stephan Zheng, Yang Song, Thomas Leung, and Ian Goodfellow. 2016. Improving the robustness of deep neural networks via stability training. In Proceedings of the ieee conference on computer vision and pattern recognition. 4480–4488.
- Zubiaga et al. (2018) Arkaitz Zubiaga, Ahmet Aker, Kalina Bontcheva, Maria Liakata, and Rob Procter. 2018. Detection and resolution of rumours in social media: A survey. ACM Computing Surveys (CSUR) 51, 2 (2018), 1–36.