A Controlled Experiment on the Impact of Intrusion Detection False Alarm Rate on Analyst Performance
Department of Computer Science
University of North Carolina Wilmington
Wilmington, NC 28403
laymanl@uncw.edu
\AndWilliam Roden
Department of Computer Science
University of North Carolina Wilmington
Wilmington, NC 28403
will.roden@ncino.com
Abstract
Organizations use intrusion detection systems (IDSes) to identify harmful activity among millions of computer network events. Cybersecurity analysts review IDS alarms to verify whether malicious activity occurred and to take remedial action. However, IDS systems exhibit high false alarm rates. This study examines the impact of IDS false alarm rate on human analyst sensitivity (probability of detection), precision (positive predictive value), and time on task when evaluating IDS alarms. A controlled experiment was conducted with participants divided into two treatment groups, 50% IDS false alarm rate and 86% false alarm rate, who classified whether simulated IDS alarms were true or false alarms. Results show statistically significant differences in precision and time on task. The median values for the 86% false alarm rate group were 47% lower precision and 40% slower time on task than the 50% false alarm rate group. No significant difference in analyst sensitivity was observed.
1 Introduction
Computer network defense is a collaboration between human analysts and automated systems. Intrusion detection systems (IDSes) analyze network and system behavior and raise alarms to be investigated by security analysts. The analysts triage the alarm to decide if it warrants further investigation D’Amico et al. (2005). The data generated by IDSes can be intractable and contributes to security analyst burnout Durst et al. (1999); Sundaramurthy et al. (2015). False alarms are the source of much of this excess, and as many as 99% of IDS alarms are false alarms Julisch (2003). Escalated IDS alarms entail a non-trivial investigation cost Ryu and Rhee (2008), contributing to fatigue and frustration among security analysts Dykstra and Paul (2018).
Ergonomics research has shown the negative consequences of false alarms in human-machine pairings Bliss et al. (1995); Meyer (2001). False alarms may lead to distrust in a system Rice (2009), and an overabundance of alarms may lead an analyst to make incorrect decisions. Researchers observe that IDSes generate too much data for analysts to parse and argue that high IDS false alarm rates hurt analyst performance D’Amico et al. (2005); Axelsson (2000); Julisch (2003). However, these claims have not been investigated empirically.
The frequency of alarms depends on how the IDS is configured, i.e., which rules are set to trigger an alarm. In practice, most of the alarms raised by IDSes are false alarms; typical IDS false alarm rates are above 90% with many as high as 99% Julisch (2003); Manganaris et al. (2000). Axelsson (2000) raises the issue of the base rate fallacy, stating that the ratio of actual attacks to benign traffic is so low that IDSes must be extraordinarily accurate to have acceptable detection performance.
Operators’ perceptions of alarm system reliability impacts their behavior. Controlled experiments show that operators who are told that an alarm system is correct 25%, 50%, or 75% of the time will comply with the system’s alarms at a commensurate rate Bliss (2003); Gérard and Manzey (2010); Guenzler and Manzey (2013). Operators will also investigate or second-guess alarms more frequently when they know the system is unreliable Gérard and Manzey (2010); Guenzler and Manzey (2013). These findings hold whether the application is safety-critical or not. Further, studies show that unreliable systems yield slower response times to the alarms as operators must spend time verifying the accuracy of an alarm Bliss et al. (1995); Getty et al. (1995). If the system does not provide enough information to confirm the accuracy of the alarm, operators tend toward the extremes of either complying with or ignoring all alarms in order to perform efficiently rather than accurately Bliss (2003); Wiczorek and Manzey (2010).
A few studies have evaluated human analyst performance in cybersecurity tasks experimentally. Sawyer and Hancock (2018) examined how phishing detection accuracy and response time changed with varying signal probabilities. Their results suggest that as the ratio of malicious emails to benign emails becomes lower, the ability to detect malicious emails decays at a logarithmic rate. Ben-Asher and Gonzalez (2015) studied the role of domain knowledge in IDS alarm triage using a simulated IDS. Their results showed that while general expertise is helpful in attack detection, situational knowledge of the specific network was more impactful on decision accuracy. Dutt et al. (2012) conducted a controlled experiment wherein participants evaluated simulated IDS alarms to determine if the alarm represented a threat. Their results showed that participants trained in the higher base rate (52%) had higher hit rates and lower false alarm rates than participants trained in the lower base rate (12%) when identifying a set of alarms with a 32% true alarm rate.
1.1 Hypotheses
Identifying the relationship between analyst performance and IDS false alarm rate can help set benchmarks for IDS performance and help organizations understand the trade-off between high alarm rates and the ability to detect actual attacks. A true alarm is an alarm from the IDS that represents a malicious event, whereas a false alarm is an alarm from the IDS that represents a benign event. The independent variable is the false alarm rate: the ratio of false alarms to all alarms.
This study examines the following hypotheses:
-
•
H1: Analyst sensitivity (a.k.a. probability of detection) decreases as the IDS false alarm rate increases;
-
•
H2: Analyst precision (a.k.a. positive predictive value) decreases as the IDS false alarm rate increases;
-
•
H3: Analyst time on task (total time taken to triage all alarms) increases as the IDS false alarm rate increases.
2 Method
2.1 Participants
Fifty-two (52) voluntary participants were recruited via computing-related major email lists, the Information Technology security office, and from two computer security courses in the Fall of 2019 at the University of North Carolina Wilmington. Participants were entered into a gift card raffle or given course extra credit as compensation regardless of performance.
2.2 Materials
Participants were presented with the following scenario: ”You are a junior cyber security analyst at Company XYZ. Your job is to perform initial triage on a list of network events that your system’s IDS has deemed an alert. You must determine if the alert could be an attack against the network, requiring further investigation by a senior analyst, or is normal network activity that can be dismissed.”
The simulated IDS alarms shown in the experiment were based on impossible travel scenarios where a user authenticates from two geographic locations within a time period where physical travel between the locations would be impossible. The impossible travel scenario was chosen because of its intuitiveness and because it is a rule actively investigating by real IDS systems. The dataset and its evaluation are reported in Roden and Layman (2020). The dataset contains 30 true alarms and 43 false alarms. An example of an impossible travel alarm is shown in Table 1. False alarms in the data set are due to the use of a virtual private network (VPN), a mobile device, a cloud server, or borderline realistic travel times.
| City of Authentication | Seattle | Moscow |
| # Successful Logins | 4 | 11 |
| # Failed Logins | 1 | 3 |
| Source Provider | Telecom | Telecom |
| Time between Authentications | 1.75 | |
| VPN Confidence | 0% | |
Each alarm contains the following data:
-
1.
Cities of Authentication: the two geographic locations from which the IDS detected an authentication.
-
2.
Number of Successful Logins: the number of successful authentications from each location in the past 24 hours.
-
3.
Number of Failed Logins: the number of failed logins from each location in the past 24 hours.
-
4.
Source Provider: the type of internet provider the authorizations came from at each location. Possible values are: telecom internet provider, mobile/cellular, and cloud host.
-
5.
Time between Authentications: the shortest time in decimal hours between authentications from the two cities in the past 24 hours. This is the field that triggers an alarm in a real IDS.
-
6.
VPN Confidence: a percent likelihood that the user utilized a VPN.
The experiment was implemented in a custom web application Roden and Layman (2019a) similar to that of Ben-Asher and Gonzalez (2015). The web application displays sample alarms for training, a "Security Playbook" containing guidance on how to evaluate IDS alarms, and the main task of evaluating 52 alarms. For each training and main task alarm, participants select "Escalate" if the alarm should be sent to a senior analyst for investigation or "Don’t escalate" if the participant believes the alarm is a false alarm. Participants rate their level of confidence in their decision on a five point scale. Participants can also choose "I don’t know" for their decision in which case a confidence score is not required. The sample alarm training pages include a button to reveal the correct answer and supporting rationale. The "Security Playbook" contains heuristics for evaluating an alarm, a concern level (Low, Medium, High) for each geographic location in the dataset, and a table of typical travel times between the locations. This information enables participants to discern false alarms. The playbook can be viewed at any time in a pop-up window.
2.3 Procedure
Four separate sessions were conducted with different participants in on-campus computer labs with dual monitors. Each session was proctored by the second author and lasted approximately 60 minutes. Each session consisted of:
-
1.
completing informed consent and a background information form;
-
2.
training on the simulated IDS environment;
-
3.
the main task of IDS alarm evaluation;
-
4.
completing a post-questionnaire including the NASA Task Load Index (TLX) Hart and Staveland (1988) to evaluate task workload.
All participants completed the experiment in under an hour.
Participants were randomly assigned to two treatment groups and had no knowledge their treatment group. The 50% False Alarm Rate (FAR) group saw 25 true alarms ("Escalate" is correct) and 25 false alarms ("Don’t escalate" is correct), while the 86% FAR group saw seven true alarms and 43 false alarms. The false alarm rate of 50% is conservatively the upper threshold a human operator can tolerate before performance suffers Axelsson (2000), while 86% is closer to the false alarm rate of actual IDS systems Julisch (2003). The alarms for each treatment group were randomly sampled without replacement from the alarm data set. All participants within a group were presented with the same set of alarms in random order.
In the training phase, participants were introduced to the Security Playbook and evaluated five training alarms. The first two training alarms (one true and one false) presented analysis of the alarm information and rationale for the correct decision. The remaining three training alarms (two false and one true) were presented as in the main task except that participants could reveal the correct answer and its rationale. Training alarm evaluations were not analyzed.
In the main task, participants were shown a table of links to the 52 alarms and a banner indicating how many alarms remained to evaluate. The table also displayed the participant’s recorded decision for each alarm. Each alarm page displayed a table of information similar to Table 1 and a form to record the "Escalate/Don’t Escalate/I don’t know" decision and confidence rating. Once a decision was made, participants were automatically shown the next alarm in the table. Participants could use the table of links to visit the alarms in any sequence to review past decisions or to change their past responses if their evaluation schemas updated during the main task. Of the 52 participants and 2704 final alarm evaluations, only four participants changed their decision or confidence on a total of 10 alarms (0.4%). To help identify participants who were simply "clicking through" the main task to earn credit, two of the 52 alarms were "verification alarms" whose content gave specific instructions for which decision and confidence to select.
Participant decisions and confidence ratings for each alarm were recorded by the app. The time on task for each participant is measured from when the participants clicked a "Begin Experiment" button to initiate the main task to when they clicked a "Complete Experiment" button on the main task list page.
Participants were neither informed of the reliability of the IDS nor given feedback on the accuracy of their evaluations. The IDS’s reliability had to be estimated through comparing alarms to the Security Playbook. This lack of feedback reflects real cybersecurity analysis.
3 Results
Fifty-two (52) participants completed the experiment. One participant’s data from the 50% FAR group was discarded because they responded incorrectly to a verification alarm. The following analysis includes 25 participants in the 50% FAR group and 26 participants in the 86% FAR group. The data is not normally distributed, and the two-tailed Mann-Whitney test is used for hypotheses testing. Effect sizes () are computed as the rank-biserial coefficient of correlation Wendt (1972). The experiment data and analysis package are published online Roden and Layman (2019b).
The performance statistics are presented in Table 2, and box-and-whisker charts of the data are presented in Figures 1–3. Of the 2704 final alarm decisions, 25 (0.9%) "I don’t know" decisions were recorded and are excluded from analysis. The mean confidence for the alarm decisions was 3.84 for both groups ( = 331.0, = .917, = .019). The post-experiment NASA TLX scores across groups are shown in Table 3. No significant differences were found between groups for any dimension; a finding also of Sawyer and Hancock (2018).
| group | 50% FAR | 86% FAR | |
|---|---|---|---|
| n | 25 | 26 | |
| sensitivity | mean | 0.78 | 0.69 |
| median | 0.83 | 0.86 | |
| 0.19 | 0.25 | ||
| min | 0.31 | 0.29 | |
| max | 1.00 | 1.00 | |
| precision | mean | 0.80 | 0.42 |
| median | 0.80 | 0.33 | |
| 0.12 | 0.27 | ||
| min | 0.58 | 0.09 | |
| max | 1.00 | 1.00 | |
| time on task | mean | 13.95 | 19.25 |
| median | 13.44 | 18.76 | |
| 3.50 | 5.61 | ||
| min | 8.00 | 11.15 | |
| max | 21.79 | 31.14 | |
| correctness | mean | 0.75 | 0.76 |
| median | 0.74 | 0.76 | |
| 0.12 | 0.16 | ||
| min | 0.50 | 0.48 | |
| max | 0.92 | 0.98 |
| 50% FAR | 86% FAR | All | ||||
|---|---|---|---|---|---|---|
| med | mean | med | mean | med | mean | |
| mental | 6 | 5.6 | 6 | 5.7 | 6 | 5.7 |
| physical | 1 | 1.8 | 1 | 1.2 | 1 | 1.5 |
| temporal | 3 | 3.5 | 3 | 3.1 | 3 | 3.4 |
| performance | 5 | 5.3 | 5 | 4.7 | 5 | 4.9 |
| effort | 5 | 5.1 | 4.5 | 4.7 | 5 | 4.9 |
| frustration | 3 | 3.8 | 3 | 3.0 | 3 | 3.4 |
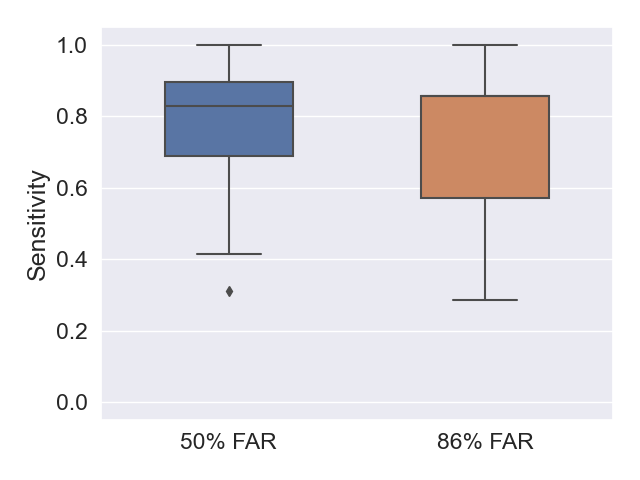
3.1 Sensitivity (Probability of Detection)
Sensitivity is the ratio of true alarms escalated to all true alarms, i.e., the percentage of all true alarms escalated by the analyst. The median sensitivity of both groups was around 85%, which indicates a good probability of detecting a true alarm, and the rank difference is not statistically significant ( = 412.5, = .098, = .269). The spread of both groups in Fig. 1 suggests meaningful variance in individual analysts’ abilities to recognize true alarms in this task.
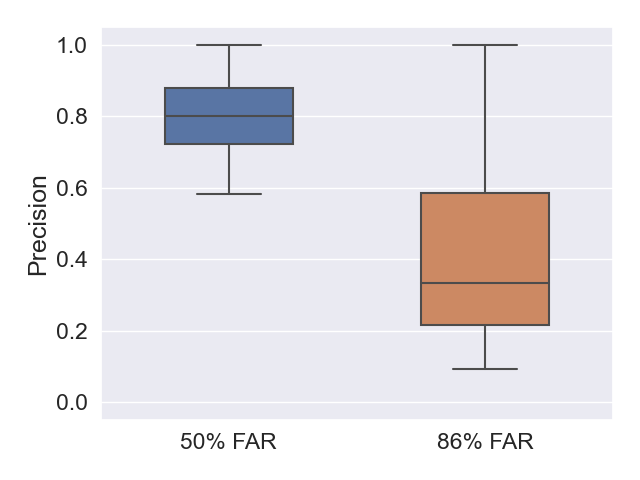
3.2 Precision (Positive Predictive Value)
Precision is the ratio of escalated true alarms to all escalated alarms, i.e., the percentage of alarm escalations that were correct. The 50% group’s median precision was 0.80, while the 86% group’s precision was much lower at 0.33. Fig. 2 visualizes the precision between groups, and the rank difference is statistically significant ( = 555.0, < .001, = .708). Combined with the previous results, the data suggest that both groups perform well in hit detection, whereas the 86% group tended to escalate more false alarms. In reality, escalating a false alarm is the safe option but incurs additional cost to investigate the alarm further.
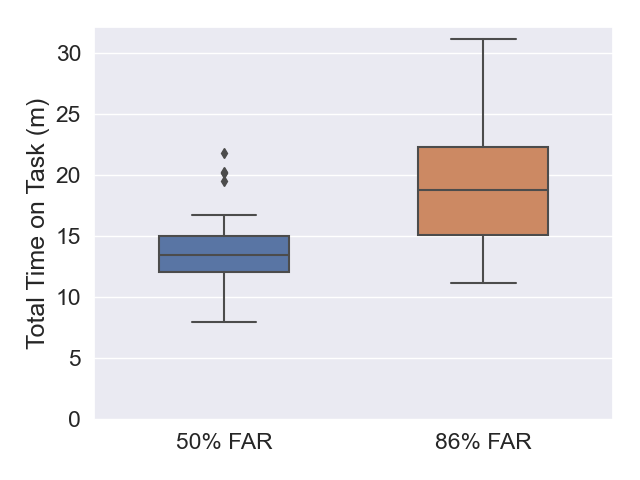
3.3 Time on Task
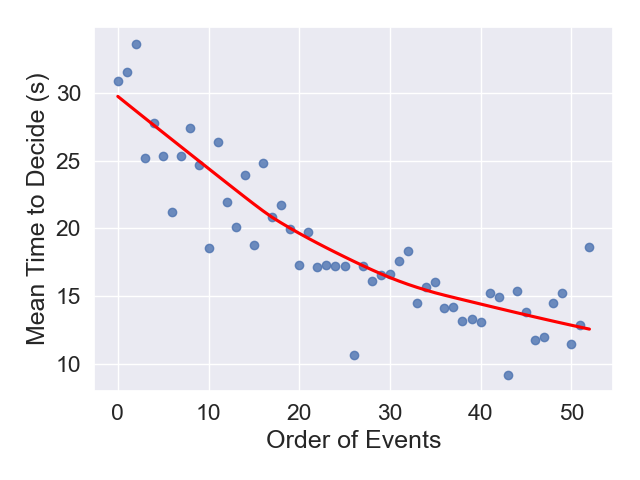
Fig. 3 shows that participants in the 86% Group took approximately 40% longer (median difference of 5.3 minutes) to complete the main task than the 50% Group. The rank difference is statistically significant ( = 143.0, < .001, = .560). The mean time to evaluate a single alarm was 15.6s for the 50% group and 21.4s for the 86% group, and that rank difference is also statistically significant ( = 147.0, < .001, = .548). Fig. 4 shows that the mean time to make a decision decreased as the experiment progressed, suggesting that participants quickly developed schemas for evaluating alarms or that they became fatigued.
4 Discussion
The results do not support Hypothesis 1 that analyst sensitivity decreases as false alarm rate increases, a finding somewhat contrary to Sawyer and Hancock (2018). One explanation for the different findings is that Sawyer and Hancock observed their effect only at a 99% false alarm rate. One interpretation is that significant differences in analyst sensitivity are more likely to occur when true alarms are rare. This would suggest that only severely overtuned IDS systems may decrease analyst’s ability to identify true attacks.
The results support Hypothesis 2 that analyst precision decreases as false alarm rate increases. One explanation for this finding can be derived from Dutt et al. (2012): the 50% Group became more accustomed to seeing alarms that needed to be escalated, thus they were better able to determine when an alarm did not need to be escalated. Another explanation for the finding is best summarized by feedback from a participant in the 86% Group, "I felt like there were only a few examples that seemed like they should definitely be escalated, but [I] escalated many more than that so that a threat would not go unnoticed." This mindset reflects the reality of cybersecurity practice: organizations place a priority on high sensitivity to intrusions at the expense of precision. The results suggest that an IDS with "only" a 50% false alarm rate, a rate unacceptable in many disciplines, would yield significant improvements in analyst accuracy.
The data support Hypothesis 3 that analyst time on task increases as false alarm rate increases. Getty et al. (1995) and Bliss et al. (1995) both suggest that increased time is due to increased effort to verify rather than trust results when working with an unreliable system. Participants in our study were not informed of the system’s reliability and had to form their own opinions based on the heuristics in the Security Playbook. Another explanation derived from Dutt et al. (2012) is that participants in the 86% group did not see enough true alarms to develop an accurate schema for recognizing true alarms, thus requiring them to spend more time reasoning about potential true alarms. More analysis is needed to compare decision times on true alarm vs. false alarms between groups.
While we strove to make the task reflective of real cybersecurity practice, replicating a real IDS environment is challenging and access to security professionals is limited. Performance on cyber analysis tasks is linked to domain knowledge Ben-Asher and Gonzalez (2015). However, our participants knowledge level may be closer to front-line IDS analysts per Zhong et al. (2018), who state that many cybersecurity novices are tasked with triaging alarms.
Our results suggest a few practical takeaways. First, a "reasonable" IDS false alarm rate of 50% yielded a substantial increase in precision over the higher false alarm rate without a reduction in sensitivity. Such an improvement in the human-IDS team’s ability to triage network activity accurately would reduce wasted investigation effort. Second, the time taken by the 50% group was on average 40% less than the 86% group while maintaining better performance, which would represent a substantial improvement in analyst efficiency if it scales. These results bear additional investigation with larger sample sizes, longer duration, varied alarm triage tasks, and populations that include a variety of cybersecurity expertise.
References
- D’Amico et al. [2005] Anita D’Amico, Kirsten Whitley, Daniel Tesone, Brianne O’Brien, and Emilie Roth. Achieving cyber defense situational awareness: A cognitive task analysis of information assurance analysts. Proceedings of the Human Factors and Ergonomics Society Annual Meeting, 49:229–233, 9 2005. ISSN 1541-9312. doi:10.1177/154193120504900304. URL http://journals.sagepub.com/doi/10.1177/154193120504900304.
- Durst et al. [1999] Robert Durst, Terrence Champion, Brian Witten, Luigi Spagnuolo, and Eric Miller. Testing and evaluating computer intrusion detection systems. Communications of the ACM, 42:53–61, 7 1999. ISSN 15577317. doi:10.1145/306549.306571. URL https://dl.acm.org/doi/10.1145/306549.306571.
- Sundaramurthy et al. [2015] Sathya Chandran Sundaramurthy, Alexandru G Bardas, Jacob Case, Xinming Ou, Michael Wesch, John McHugh, and S Raj Rajagopalan. A human capital model for mitigating security analyst burnout. pages 347–359. The USENIX Association, 2015. URL https://www.usenix.org/system/files/conference/soups2015/soups15-paper-sundaramurthy.pdf.
- Julisch [2003] Klaus Julisch. Clustering intrusion detection alarms to support root cause analysis. ACM Transactions on Information and System Security, 6:443–471, 2003. ISSN 10949224. doi:10.1145/950191.950192. URL http://citeseerx.ist.psu.edu/viewdoc/download?doi=10.1.1.136.1949&rep=rep1&type=pdf.
- Ryu and Rhee [2008] Young U. Ryu and Hyeun Suk Rhee. Evaluation of intrusion detection systems under a resource constraint. ACM Transactions on Information and System Security, 11:Article 20, 7 2008. ISSN 10949224. doi:10.1145/1380564.1380566. URL https://dl.acm.org/doi/10.1145/1380564.1380566.
- Dykstra and Paul [2018] Josiah Dykstra and Celeste Lyn Paul. Cyber operations stress survey (coss): Studying fatigue, frustration, and cognitive workload in cybersecurity operations. {USENIX} Association, 8 2018. URL https://www.usenix.org/conference/cset18/presentation/dykstra.
- Bliss et al. [1995] James P. Bliss, Richard D. Gilson, and John E. Deaton. Human probability matching behaviour in response to alarms of varying reliability. Ergonomics, 38:2300–2312, 11 1995. ISSN 0014-0139. doi:10.1080/00140139508925269. URL http://www.tandfonline.com/doi/abs/10.1080/00140139508925269.
- Meyer [2001] Joachim Meyer. Effects of warning validity and proximity on responses to warnings. Human Factors: The Journal of the Human Factors and Ergonomics Society, 43:563–572, 12 2001. ISSN 0018-7208. doi:10.1518/001872001775870395. URL http://journals.sagepub.com/doi/10.1518/001872001775870395.
- Rice [2009] Stephen Rice. Examining single- and multiple-process theories of trust in automation. Journal of General Psychology, 136:303–322, 7 2009. ISSN 00221309. doi:10.3200/GENP.136.3.303-322. URL https://www.tandfonline.com/doi/abs/10.3200/GENP.136.3.303-322.
- Axelsson [2000] Stefan Axelsson. The base-rate fallacy and the difficulty of intrusion detection. ACM Transactions on Information and System Security, 3(3):186–205, 8 2000. ISSN 10949224. doi:10.1145/357830.357849. URL http://portal.acm.org/citation.cfm?doid=357830.357849.
- Manganaris et al. [2000] Stefanos Manganaris, Marvin Christensen, Dan Zerkle, and Keith Hermiz. Data mining analysis of rtid alarms. Computer Networks, 34:571–577, 10 2000. ISSN 13891286. doi:10.1016/S1389-1286(00)00138-9.
- Bliss [2003] James P. Bliss. An investigation of extreme alarm response patterns in laboratory experiments. volume 47, pages 1683–1687. SAGE Publications, 10 2003. doi:10.1177/154193120304701319.
- Gérard and Manzey [2010] Nina Gérard and Dietrich Manzey. Are false alarms not as bad as supposed after all? a study investigating operators’ responses to imperfect alarms. pages 55–69. Shaker Publishing, 2010.
- Guenzler and Manzey [2013] Torsten Guenzler and Dietrich Manzey. Asymmetries in human tolerance of uncertainty in interaction with alarm systems: Effects of risk perception or evidence for a general commission bias? volume 57, pages 1362–1366. SAGE PublicationsSage CA: Los Angeles, CA, 9 2013. ISBN 9780945289432. doi:10.1177/1541931213571301. URL http://journals.sagepub.com/doi/10.1177/1541931213571301.
- Getty et al. [1995] David J. Getty, John A. Swets, Ronald M. Pickett, and David Gonthier. System operator response to warnings of danger: A laboratory investigation of the effects of the predictive value of a warning on human response time. Journal of Experimental Psychology: Applied, 1:19–33, 1995. ISSN 1076898X. doi:10.1037/1076-898X.1.1.19.
- Wiczorek and Manzey [2010] Rebecca Wiczorek and Dietrich Manzey. Is operators’ compliance with alarm systems a product of rational consideration? volume 54, pages 1722–1726. SAGE Publications, 9 2010. doi:10.1177/154193121005401976.
- Sawyer and Hancock [2018] Ben D. Sawyer and Peter A. Hancock. Hacking the human: The prevalence paradox in cybersecurity. Human Factors, 60:597–609, 8 2018. doi:10.1177/0018720818780472. URL http://journals.sagepub.com/doi/10.1177/0018720818780472.
- Ben-Asher and Gonzalez [2015] Noam Ben-Asher and Cleotilde Gonzalez. Effects of cyber security knowledge on attack detection. Computers in Human Behavior, 48:51–61, 7 2015. ISSN 07475632. doi:10.1016/j.chb.2015.01.039. URL https://www.sciencedirect.com/science/article/pii/S0747563215000539.
- Dutt et al. [2012] Varun Dutt, Young-Suk Ahn, Noam Ben-Asher, and Cleotilde Gonzalez. Modeling the effects of base-rates on cyber threat detection performance. pages 88–93. Universitätsverlag der TU, Berlin, 2012.
- Roden and Layman [2020] William Roden and Lucas Layman. Cry wolf: Toward an experimentation platform and dataset for human factors in cyber security analysis. pages 264–267. ACM, 2020. doi:10.1145/3374135.3385301. URL https://arxiv.org/abs/2002.10530.
- Roden and Layman [2019a] William Roden and Lucas Layman. The cry wolf ids simulator - an environment for conducting controlled experiments of cyber security analysis tasks, 2019a. URL https://uncw-hfcs.github.io/ids-simulator/.
- Hart and Staveland [1988] Sandra G. Hart and Lowell E. Staveland. Development of nasa-tlx (task load index): Results of empirical and theoretical research. Advances in Psychology, 52:139–183, 1 1988. ISSN 01664115. doi:10.1016/S0166-4115(08)62386-9.
- Wendt [1972] Hans W. Wendt. Dealing with a common problem in social science: A simplified rank-biserial coefficient of correlation based on the u statistic. European Journal of Social Psychology, 2:463–465, 1972. ISSN 10990992. doi:10.1002/EJSP.2420020412.
- Roden and Layman [2019b] Williams Roden and Lucas Layman. The cry wolf dataset - a repository of simulated ids alerts for experimentation, 2019b. URL https://uncw-hfcs.github.io/ids-simulator-analysis/.
- Zhong et al. [2018] Chen Zhong, Tao Lin, Peng Liu, John Yen, and Kai Chen. A cyber security data triage operation retrieval system. Computers and Security, 76:12–31, 7 2018. ISSN 0167-4048. doi:10.1016/J.COSE.2018.02.011. URL https://www.sciencedirect.com/science/article/pii/S0167404818301408.