axis electrical transport at the metamagnetic transition in the heavy-fermion superconductor UTe2 under pressure
Abstract
The electrical resistivity of the unconventional superconductor UTe2 shows very anisotropic behavior in the normal state depending on the current direction. In the present paper we show that the maximum in the resistivity for current applied along the axis at K follows the minimum in the thermal expansion along axis. Under a magnetic field applied along the axis, can be tracked up to the critical point of the first order metamagnetic transition, which is located near 6 K and 34.5 T. Surprisingly, at the metamagnetic field the resistivity shows a steplike decrease while the resistivities and , for current along the and axis, respsectively, show a steplike increase. Under hydrostatic pressure and decrease significantly up to the critical pressure at which superconductivity is suppressed and a long range antiferromagnetic order appears. We show that the phase diagram at different pressures can be scaled by in field and temperature suggesting that this temperature scale is governing the main interactions in the normal state.
pacs:
71.18.+y, 71.27.+a, 72.15.Jf, 74.70.TxI Introduction
The interplay between magnetic and/or charge fluctuations and the appearance of unconventional superconductivity is a central issue in condensed matter physics [1, 2, 3]. Uranium based heavy-fermion superconductors are of importance in this context as a rich variety of competing interactions occurs. Prominent examples are UPt3 [4, 5, 6] and U1-xThxBe13 [7, 8, 9], which are identified as odd parity superconductors with multiple superconducting phases, the hidden order state in URu2Si2, which coexists with a time reversal symmetry broken superconductivity [10, 11, 12], the coexistence of antiferromagnetism and superconductivity in UAl3 (Ni, Pd) [13, 14, 15], or of ferromagnetism and superconductivity in UGe2 [16], URhGe [17] and UCoGe [18, 19], to cite the most prominent examples.
The discovery of superconductivity in UTe2 has raised an intense research effort due to the possible spin-triplet pairing in this compound [20, 21, 22]. Indications for this rare pairing state are the strong enhancement of the superconducting upper critical field , which exceeds by far the Pauli limit of superconductivity for all three crystallographic axes, and the Knight shift measurements in magnetic resonance experiments (NMR), which are incompatible with a spin-singlet pairing [23, 24]. It has been shown that the pairing strength itself is sensitive to the magnetic field for all crystal axes [25]. For a field applied along the axis, superconductivity is limited by a metamagnetic transition at T [26, 27]. Surprisingly, for a field applied in the plane field-induced superconductivity occurs in the field polarized phase above [27, 28, 29, 30]. The first order metamagnetic transition is characterized by a large jump of the magnetization [31], a volume discontinuity [32], and a jump in the magnetoresistance [33]. It is accompanied by a strong increase of the Sommerfeld coefficient of the specific heat [34, 35, 25] and of the coefficent of the Fermi-liquid resistivity [33, 36]. An abrupt Fermi surface change at has been discussed from Hall effect measurements [37], but constitutes still an open question [30]. Superconductivity in UTe2 was claimed to be topological nontrivial following the detection of chiral-edge states in scanning-tunneling microscopy (STM) [38], and of broken time-reversal symmetry in Kerr effect studies[39]. However, these results are still discussed controversally and may depend on the sample quality [40].
Under hydrostatic pressure, two superconducting phases have been reported from ac calorimetry measurements above 0.3 GPa, indicating multiphase superconductivity at zero field [41]. This has been rapidly confirmed [42, 43] and the high-pressure phase diagram is now well established [44, 45, 46]. Multiphase superconductivity has also been observed at constant pressure as a function of magnetic field applied along the [47] and axes [42]. Recently, two different superconducting phases for field along the axis have also been found at zero pressure by specific heat [25], and independently by combined NMR and ac susceptibility measurements [48]. This indicates that the field reinforced high-field superconducting phase (HFSC) is a bulk superconducting phase which is seperated by a thermodynamic phase transition from the low-field phase (LFSC). The superconducting phases are suppressed at a critical pressure –1.7 GPa (depending on the pressure medium) and a magnetically ordered state occurs. Initially a ferromagnetic state has been expected [44], but there are now strong indications for antiferromagnetic order above . The magnetic anisotropy is reversed at [49, 50, 46, 51]. While at ambient pressure the axis is the easy magnetization axis, in the pressure induced magnetic phase it switches to the axis. The change in the magnetic anisotropy has also a feedback on the superconducting state under pressure. Close to , the upper critical field is highest for the axis, and even reentrant superconductivity occurs in this direction [45, 44, 52, 46].
Various electronic structure calculations have been performed to determine the Fermi surface of UTe2 [53, 54, 55, 56, 57, 58, 59]. Experimentally the Fermi surface of UTe2 is not fully determined, but angle resolved photoemission spectroscopy (ARPES) experiments [56] and quantum oscillations indicate quasi-two-dimensional Fermi-surface sheets along the axis [60, 61, 62, 63] in agreement with band structure calculations. Resistivity measurements with different current directions suggest that UTe2 is a three dimensional metal [64] indicating that either the cylinders are strongly corrugated or that a three-dimensional Fermi surface is missing in most calculations and quantum oscillation experiments. For current applied along the and axes the temperature dependence of the resistivity shows a broad maximum near 60 K and drops for lower temperatures, indicating the formation of coherent quasiparticle bands characteristic of a heavy-fermion state. Once a non-magnetic background of the scattering is subtracted, this maximum is shifted down to the temperature scale K, at which the susceptibility and the Hall effect for are maximum [46, 36, 37]. For current applied along the axis a distinct maximum of the resistivity appears only at K [64, 36]. Near this characteristic temperature several other quantities show anomalies: the electronic specific heat has a broad maximum [65], the thermal expansion coefficients along the and axes have a minimum [65, 43], the thermoelectric power has a minimum [66], and the axis susceptibility as well as the Knight shift gets constant to lower temperatures [67]. Inelastic neutron scattering experiments show the development of a magnetic excitation below K at the incommensurate wavevector which is maximal at the energy transfer 3-4 meV [68, 69, 70]. These result from low dimensional antiferromagnetic fluctuations which saturate below K [68, 69], and which are gapped in the superconducting state [71, 72]. The anomaly at corresponds to the crossover to a coherent low temperature regime [64, 70].
In the first part of the paper we will concentrate on the anisotropic transport at ambient pressure through the metamagnetic transition . We will show the temperature dependence of the resistivity with a current applied along the axis and also give evidence that the maximum of the axis resistivity connects to the metamagnetic transition. In the second part, we will present high pressure resistivity experiments with a current along the axis and determine the magnetic field – temperature phase diagrams for different pressures. Finally, we give further evidence that the order, which occurs above the critical pressure, is antiferromagnetic.
II Experimental methods
Single crystals of UTe2 have been grown by chemical vapor transport (CVT) using iodine as transport agent [73] and by the molten salt flux (MSF) method [74]. All single crystals studied in resistivity show a single sharp superconducting transition in the specific heat at K for the CVT grown samples and 2 K for the MSF sample. CVT grown samples have been cut from large crystals using a spark cutter after alignment of the crystal using a Laue photograph. The MSF sample had a naturally needlelike shape along the axis.
The high field transport measurements have been performed at the high magnetic field laboratory LNCMI in Grenoble using the resistive 36 T magnet M9. At ambient pressure the magnetoresistance with the current applied along the axis for different CVT grown samples (S1, S2) has been determined. The alignment of the contacts has not been perfectly done for the axis sample S1 at ambient pressure due to its irregular shape, and the absolute value of the resistivity is smaller than expected from literature [64]. In a second experiment a bar-shaped sample S2 for a current along the axis has been slightly misaligned with respect to the axis resulting in a higher value of the metamagnetic transition. The high pressure experiment has been performed on a bar-shaped sample prepared from the same parent crystal S1. A MP35N piston cylinder pressure cell has been used to apply pressures up to 1.61 GPa with Daphne 7373 oil as pressure medium. The outer diameter of the pressure cell is only 15 mm. The high pressure experiments have been performed up to a maximal field of 35 T. The lowest temperature with the pressure cell was K.
Thermal expansion measurements at zero pressure have been performed using a high resolution capacitive dilatometer [75] at the LNCMI Grenoble at the magnet M10 with a maximal field of 30 T in the temperature range from 2 to 25 K. The sample with K was already studied in Ref. [25] by magnetostriction experiment.
III Ambient pressure results
III.1 c axis transport and field dependence of
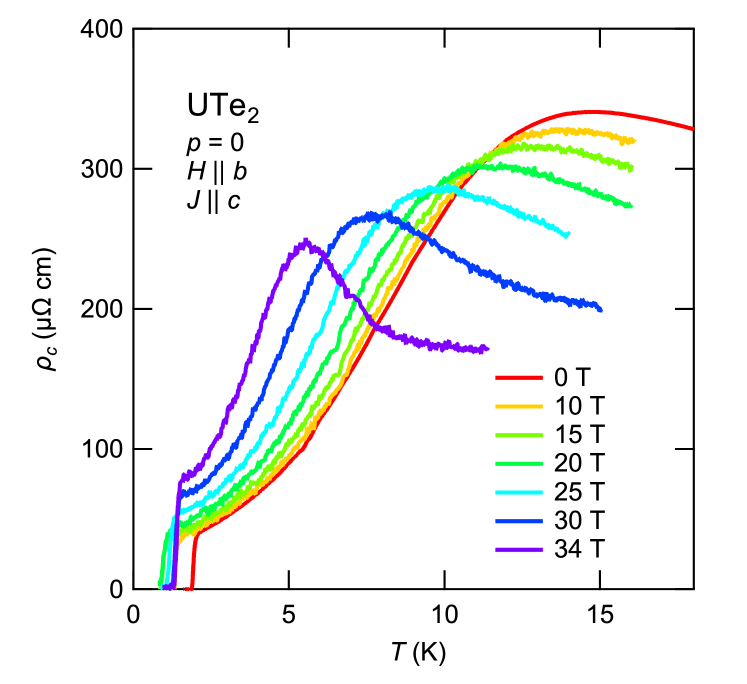
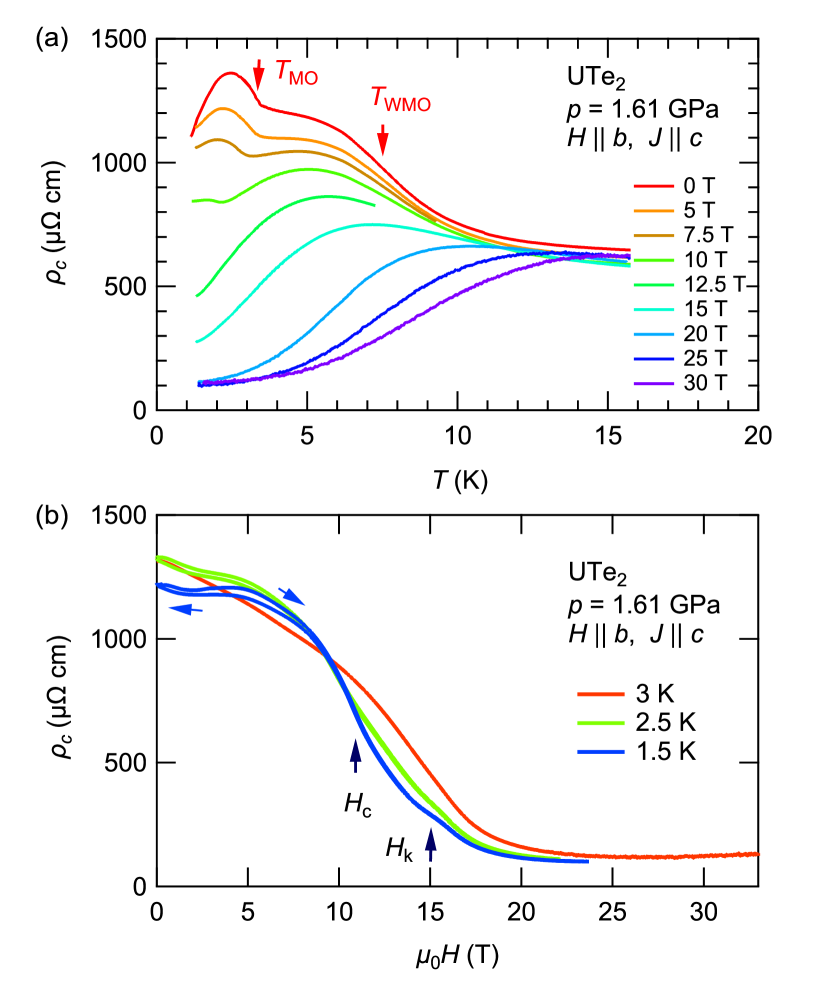
Figure 1 displays the temperature dependence of the axis resistivity for different magnetic fields applied along the axis below 20 K. A maximum of the resistivity at K occurs at . Under magnetic field shifts to a lower temperature and the maximum gets more pronounced. At the highest field of 34 T, just below the metamagnetic transition, K. This indicates that approaches to the critical point of the first order metamagnetic transition which is located near 6-7 K and 34.5 T . Superconductivity, defined by , occurs at zero field below K. The minimum of ( K) is found at . For higher fields the temperature of zero resistivity increases again and at 34 T, K. This behavior of is similar to that of previous reports [26, 27, 76]. The highest of HFSC phase is found just below .
In the normal state above the resistivity follows a Fermi-liquid temperature dependence , where is the residual resistivity and the coefficient of the electron-electron scattering term. In heavy-fermion systems the relation is often obeyed indicating that local fluctuations dominate [77]. In a simplified picture, the coefficient is proportional to the square of the effective mass of the charge carriers. The field dependence of and the residual resistivity will be discussed below.
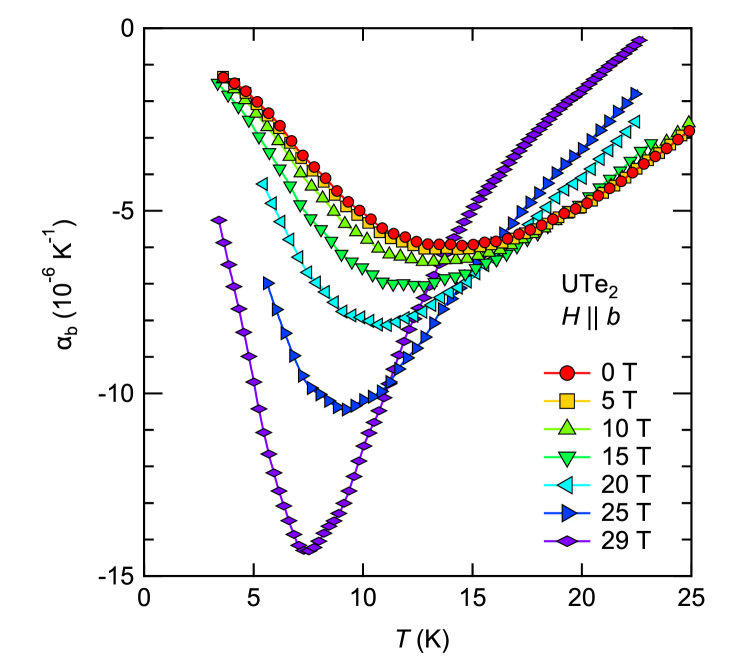
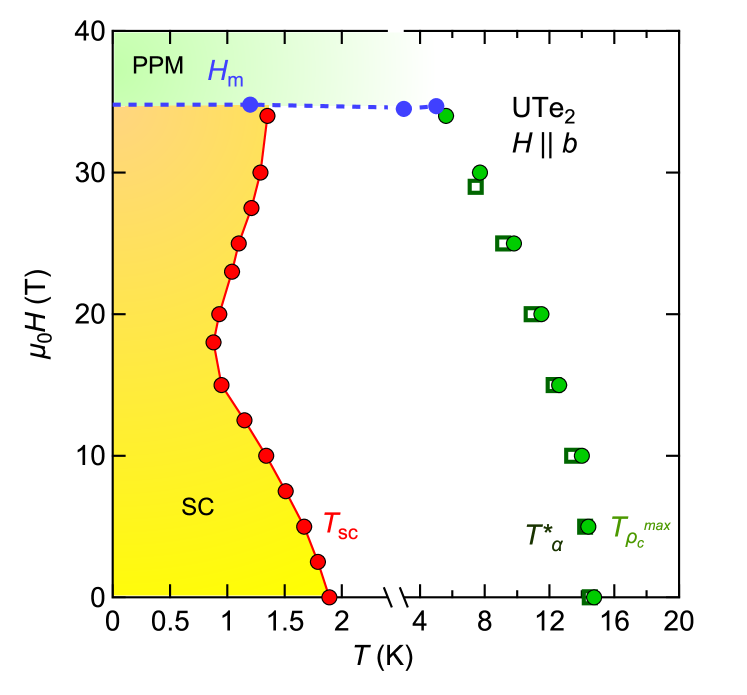
Figure 2 shows the longitudinal thermal expansion coefficient along the axis as a function of temperature at different magnetic fields. is negative and has a very broad minimum at K in zero field. A magnetic field applied along the axis shifts to lower temperatures and the minimum sharpens significantly. We can follow the minimum up to the highest field of 29 T and determined from thermal expansion is in excellent agreement with the maximum in the axis transport. Fig. 3 shows the phase diagram of UTe2 at ambient pressure determined from the axis transport and the thermal expansion. This shows that the thermodynamic anomaly detected at connects to the metamagnetic transition at . The is a signature of a crossover to the low temperature state. The microscopic origins of are given by the interplay of the onsite and intersite magnetic interactions, which result in the formation of the coherent heavy-fermion state on cooling and the accompanying development of magnetic fluctuations at finite wave vectors [69, 68, 70, 67, 64]. In addition to the magnetic fluctuations, the crystal field effects may also play a role in the anomaly [78].
III.2 Anisotropic transport at
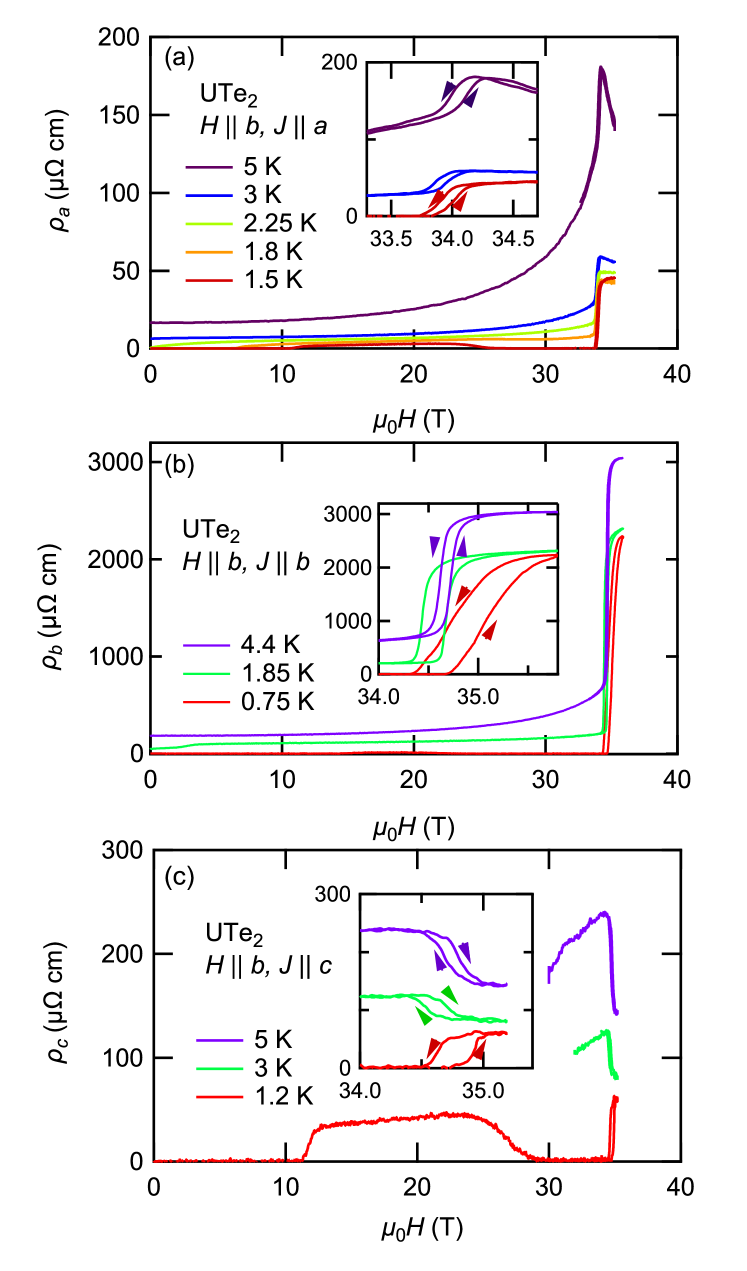
Previous magnetoresistivity measurements with a current applied along the axis showed that in the normal state just above increases abruptly at the metamagnetic transition by a factor of 4 [33, 28, 37]. It shows a hysteresis between field up and down sweeps of about 0.2 T indicating the first order nature of the transition. The transition is sharp up to a critical point of 6–7 K. At higher temperatures a broad crossover from a coherent correlated paramagnetic to an incoherent paramagnetic state occurs. A similar abrupt change in the Hall resistivity at together with a change of the main charge carriers is observed in thermoelectric power experiments [37] suggests that an abrupt change of the Fermi surface occurs at the metamagnetic transition . Figure 4 displays the magnetoresistivity with a current injection along the , , and axes as a function of the magnetic field applied along the axis. For the axis, we used a high quality MSF grown sample with a K. The samples used for the different current directions show up to zero resistivity at the lowest temperature. At higher temperatures, a field reentrance of superconductivity occurs as a function of field. In spite of the lower absolute resistivity than in previous experiments, shows a similar field dependence in the normal state as reported previously [33, 28].
For a current along the axis, shows an extremely large positive jump at , by a factor 8.5 at 2.25 K in the normal state, see Fig. 4(b). This jump is much stronger than that being observed for a current applied along the axis.
Astonishingly, for a current axis, the magnetoresistance drops at the metamagnetic transition as shown in the lower panel of Fig. 4(c); at 3 K the magnetoresistivity decreases by a factor of 1.45, i. e., the change of the magnetoresistivity at the metamagnetic transition is much smaller and opposite to that observed along the and directions, and just at the jump seems even to vanish. At higher temperatures the drop of the resistivity along becomes stronger and changes into a crossover above the critical point (see also Ref. [36]). These distinct differences between the magnetoresistivity measured for the different current directions is certainly due to the anisotropic Fermi surface of UTe2, but a detailed microscopic picture of the anisotropic scattering is still missing. In Ref. [64] within a simple two band model, it has been proposed that the conduction along the axis is dominated by the heavy pocket of the Fermi surface detected in ARPES measurements, while the conduction along the and -axis directions is dominated mainly by the cylindrical Fermi surfaces. Recent quantum oscillations experiments by the dHvA effect did not detect such a small Fermi surface pocket [60, 61, 63]. Nevertheless, a small 3D Fermi surface pocket has been claimed to be observed using a tunnel diode oscillator circuit (TDO) in Ref. 62, although it is not confirmed yet by other experiments.
An anisotropy of the transport properties at a metamagnetic transition has been also observed in other heavy-fermion compounds. In the paramagnetic and nearly antiferromagnetic CeRu2Si2, where the metamagnetic transition occurs for a field applied along the easy axis, the magnetoresitivity shows a positive jump in the transversal configutation , while a peak occurs for [79]. In the paramagnetic and nearly ferromagnetic UCoAl the magnetoresistance has a positive jump at T for , which is the easy magnetization axis, but a negative jump occurs in the transversale configuration [80]. Another example presents the antiferromagnetic UPd2Al3, where a sharp peak occurs at in the longitudinal configuration while a strong decrease of almost 50 % occurs in the transverse magnetoresistance [81]. In these examples, the metamagnetic transition is accompanied with a Fermi surface reconstruction, as proposed for UTe2.
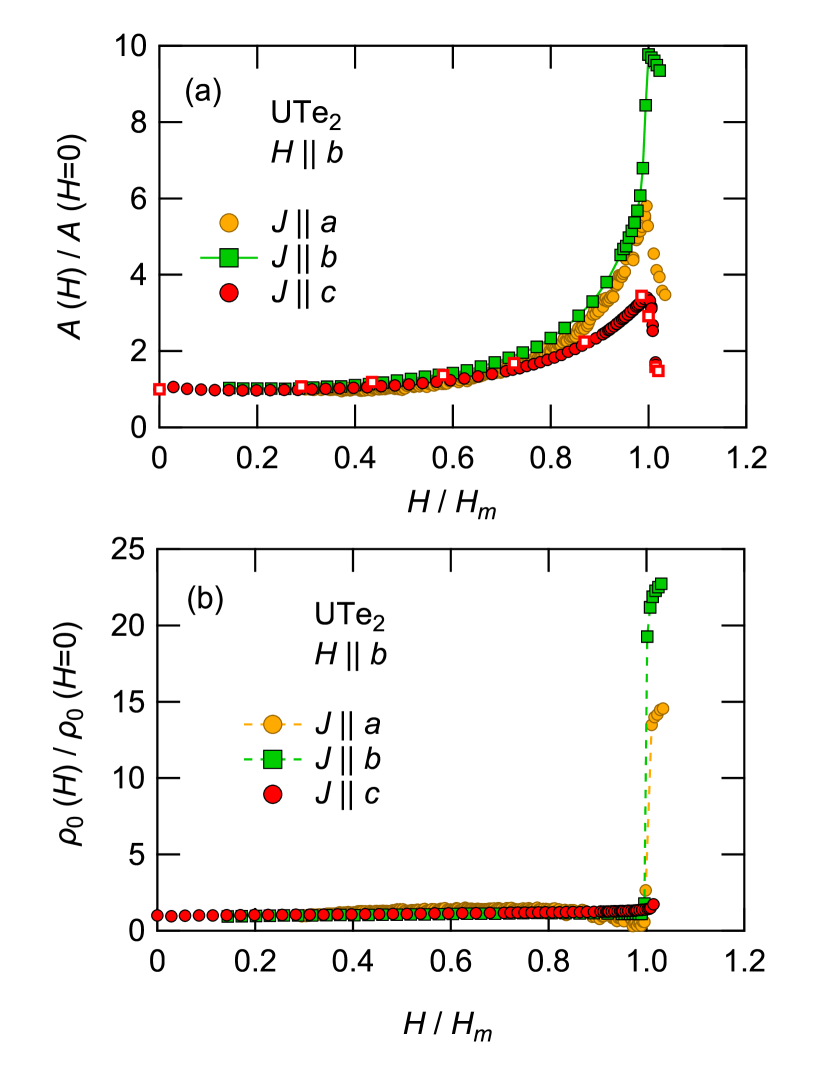
The field dependences of the normalized coefficient and of the residual resistivity extracted from the Fermi-liquid fit are shown in Fig. 5 as a function of . and were determined from the temperature dependent measurements (open squares for ) and from the field sweeps at constant temperature (full symbols). We compare for the different current directions in Fig. 5. The anisotropy of the coefficient at zero field is similar to that in Ref. [64]. The field dependence of for determined on the new MCF sample is in excellent agreement with those published in Ref. [33]. There are distinct differences in the field dependence of for the different directions.
For axis the absolute value of is the smallest and it increases from about at zero field to 4 at . Astonishingly, the field enhancement of is symmetric around , which seems difficult to associate with the first order character of the metamagnetic transition.
For current along the axis, the absolute value of equals at zero field. increases very strongly by a factor of 10, when the metamagnetic transition is approached. (The absolute value of for the -axis direction may be over estimated as it is only determined from the measured field dependences at different temperatures.)
In zero field, the value of is the highest for a current applied along the axis, with at zero field. However, on approaching the metamagnetic transition it increases only by a factor of 3.4 at for and decreases abruply just above the metamagnetic transition.
Assuming the Kadowaki Woods ration , the field dependence extracted from the coefficient of the resistivity is very similar to the field dependence of the measured directly [25]. at 1.8 K in the normal state leads to an increase of by a factor of 1.8 up to metamagnetic transition in excellent agreement with for and decreases abruptly at [25]. Thus, for seems a much better probe of than other directions. These anisotropic field-responses of indicate that the Kadowaki-Woods ratio has no universal value here. It is theoretically proposed that a generalized Kadowaki-Woods ratio is dependent on the orbital degeneracy [82]. Our results may be linked to an additional valence instability near .
Figure 5(b) shows the field dependence of the residual resistivity normalized to its value at zero field. We clearly see that for the and axes increases by a factor of at least 15 () and 20 (), while the change along is very small. In a simple picture this may also be an indication for a Fermi surface change at .
III.3 Comparison of the superconducting phase diagrams
In Fig. 6(a) we compare the superconducting upper critical field with for samples with different values of varying from 1.45 K to 2 K. All samples show field-reentrant superconductivity in fields above T. The thermodynamic phase diagram has been only determined in one of the samples ( K by specific heat measurements [25]). The exact field of the reinforcement is difficult to determine from the transport experiments and it does not coincide exactly with the bulk transition [25, 76]. As shown in Ref. 25, the anomaly in specific heat corresponding to the transition to the HFSC phase is extremely broad. However, this indicates that is roughly independent of the sample quality [76]. We also see that the value of the measured metamagnetic field varies from 33.8–34.75 T for the different samples. The lowest metamagnetic field has been found for the sample with the highest . However, a detailed analysis is difficult, as depends critically on the perfect orientation of field along . A small misalignment from the axis results in an increase of in the plane and a much stronger dependence in the plane [27, 30].
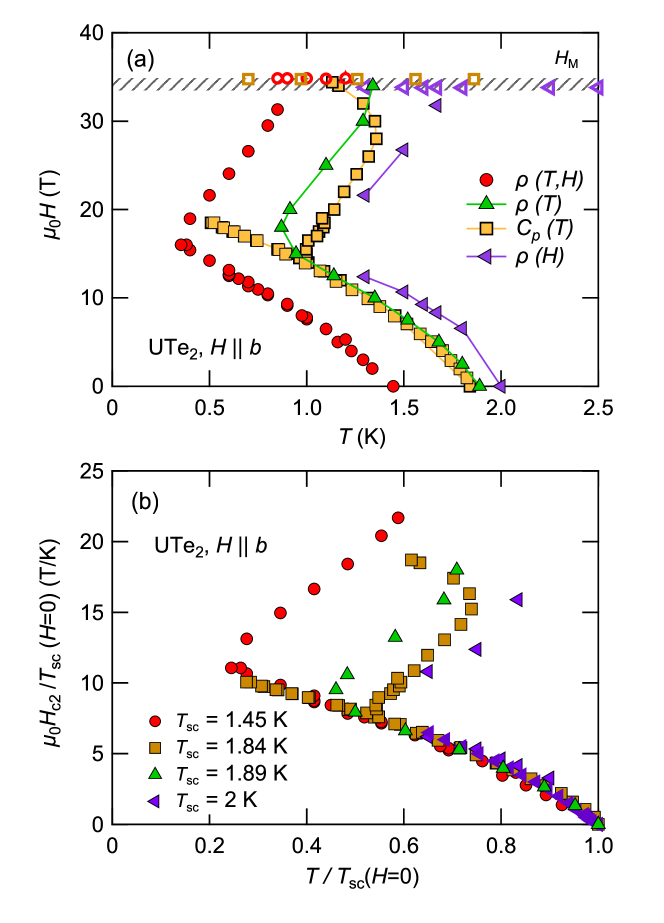
In Fig. 6(b) we plot normalized by as a function of . In this representation in the LFSC phase scale on a single curve for samples with different , while in the high field phase the critical field strong variations occurs. In the clean limit, the orbital critical field at zero temperature depends on the Fermi velocities perpendicular to and as . The scaling with a purely orbital limit vs is less good in the LFSC phase than that in Fig. 6(b). As discussed in Ref. [25] the upper critical field for is not described by a simple orbital limit. However, as shown in Fig. 6, the low LFSC and HFSC phases show very different behavior for the different sampes. While the bulk nature of the HFSC phase has been clearly shown by specific heat, thermal expansion and ac susceptibility [25, 48, 76], the transition itself is intrinsically very broad. The thermal expansion experiments clearly indicate that the vortex dynamics are different in the LFSC and HFSC phases. This is also supported by measurements of the critical current [83], indicating that this phase is strongly dependent on sample quality and impurities. At least the field domain of HFSC starts at lower fields when is highest while appears weakly dependent on the sample purity [43, 76].
IV axis electrical transport under pressure
IV.1 Comparison of axis and axis resistivity in zero field
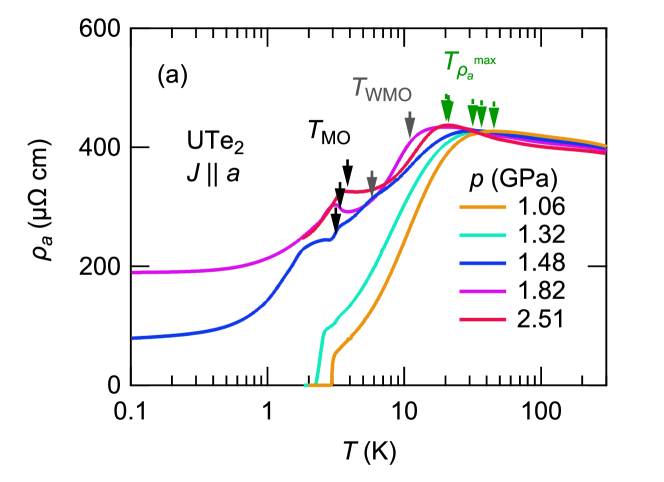
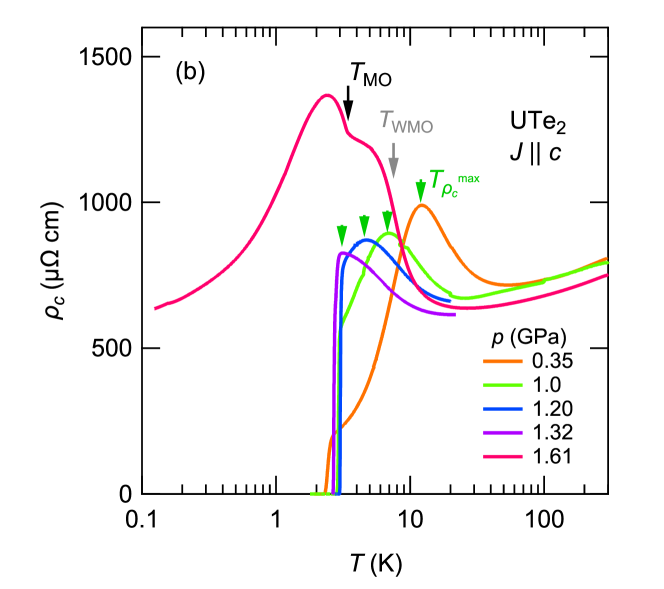
Figure 7 displays the temperature dependence of the resistivity with a current along the axis (, upper panel) and along the axis (, lower panel) for different pressures at zero magnetic field. For both current directions, the general behavior at high temperature is similar to that at ambient pressure. increases on cooling down to a temperature and decreases on cooling to lower temperatures. The temperature of the maximum in , , decreases with increasing pressure, and shows a small increase above the critical pressure GPa, where superconductivity is suppressed and the magnetically ordered ground state is formed (see Fig. 8). The exact position of the critical pressure depends on the pressure conditions. GPa has been reported in Refs. 41 or 46 using anvil pressure cells.
In the ordered state above 1.5 GPa, is almost independent of pressure. For we observe a kink for GPa near K and a second anomaly near K in agreement with the previous report of two magnetic anomalies above [50, 52, 49]. While at long range magnetic order appears, has been identified as a crossover to a weakly magnetically ordered state. With pressure shifts to higher temperature, gets less pronounced and cannot be resolved anymore above 2 GPa as it merges with . The lower anomaly at is almost pressure independent (Fig. 8). Very close to we observe at 1.48 GPa not only the magnetic anomaly, but also still an onset of a very broad superconducting anomaly. Similar coexistence has been observed in Ref. 50 by ac calorimetry. At the border of an antiferromagnetic instability, it is difficult to observe a magnetic transition inside the superconducting state (), whereas superconductivity occurs often inhomogeneously inside the magnetically ordered state when . A very well studied example for this competition of magnetic order and superconductivity is given by CeRhIn5 [84, Knebel2006] with the inhomegeneous appearance of superconductivity below its critical pressure ( ), followed by the rapid suppression of magnetic order above when .
As shown in Fig. 7(b), decreases with decreasing temperature for all pressures above 50 K. Similarly to the zero pressure data, at low temperatures a pronounced maximum occurs. This maximum shifts to lower temperatures with pressure up to 1.32 GPa. At this pressure, just below , it almost coincides with the onset of superconductivity. The maximum of K is observed at 1.2 GPa for both samples. The normal-state resistivity changes drastically above the critical pressure GPa. At GPa, increases strongly below 10 K by a factor of two, it shows a small plateau below 7 K and increases again below 3.45 K with a maximum at 2.4 K. The strong increase of the resistivity is attributed to a short range magnetic order at K and antiferromagnetic order below 3.5 K. A common feature between the and axis transport is the increase of the resistivity at the lower magnetic transition , which may indicate an opening of an electronic gap when entering in the magnetic state. The residual resistivity increases for both current directions strongly through , and the anisotropy of the residual resistivity is still of the order of three in the magnetically ordered state.
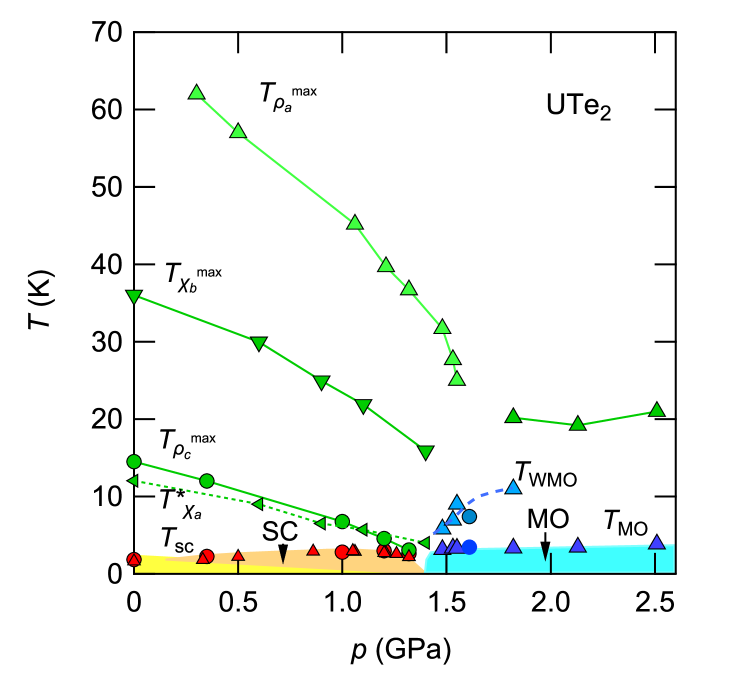
In Fig. 8 we summarize the pressure-temperature phase diagram of UTe2 from the present resistivity measurements combined with previous studies. The characteristic temperatures determined from the temperature dependence of the resistivity , , the maximum of the magnetic susceptibility measured along the axis, , and , which marks a broad shoulder in the susceptibility measured along the axis [49], decrease up to the critical pressure GPa. The follows roughly . Recently we have shown that scales with the maximum of the magnetic susceptibility [46, 36] as a function of magnetic field and pressure, when a background contribution to the resistivity is subtracted. The background corresponds to the resistivity in the high-field regime above , where the system is in a polarized state and magnetic fluctuations are strongly suppressed. The magnetic interactions change drastically at the critical pressure and for , the crystallographic axis becomes the axis of easy magnetization in the magnetic ordered state, while the axis is an intermediate axis [49, 51].
IV.2 axis transport under pressure and in magnetic field
Next we focus on the axis resistivity for field applied along the axis at different pressures.
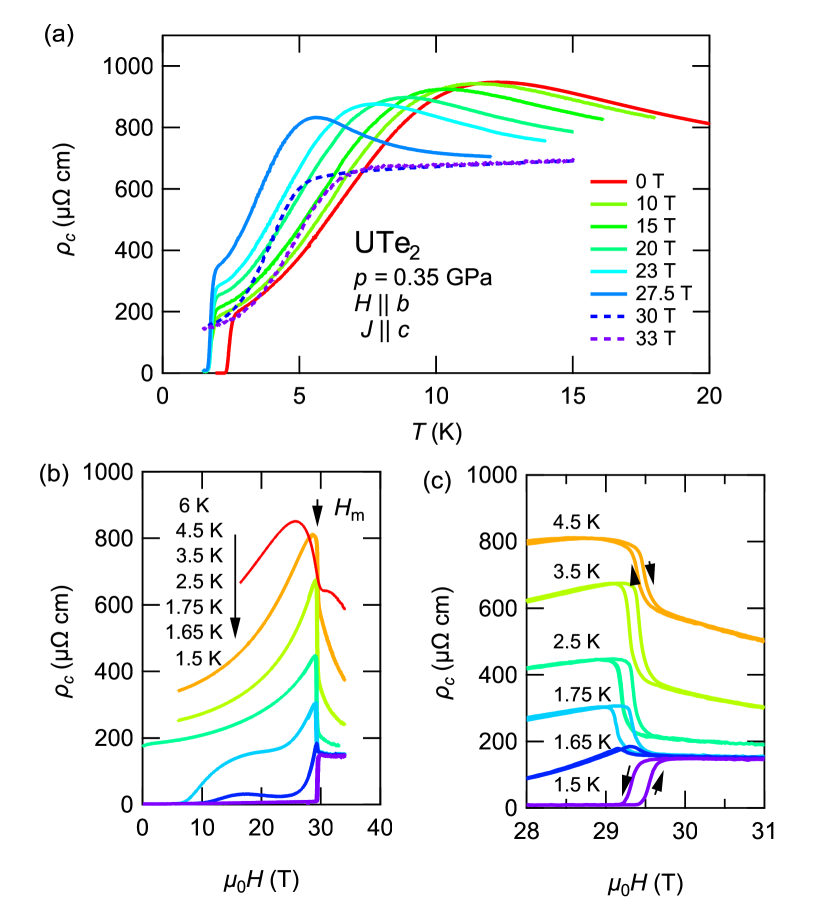
Figure 9(a) shows the temperature dependence of for different fields at 0.35 GPa. Near K the resistivity shows a maximum which is slightly lower than at ambient pressure. Under magnetic field like at (see Fig. 1) the maximum shifts to lower temperatures and, at 27.5 T, we find K. Above , at 30 T and for higher fields, the temperature dependence of changes significantly and instead of a maximum, a sharp drop of the resistivity is observed below 5 K. By further increasing the field, this anomaly is shifted to slightly higher temperatures. At low temperatures shows a temperature dependence (see below). Thus the system enters into a Fermi-liquid ground state, whatever the field. The superconducting transition temperature decreases almost linearly from K at zero field down to K at 15 T and is field-independent in higher fields up to 27.5 T. Thus the field enhancement of superconductivity is less pronounced compared to ambient pressure, but a phase line between the LFSC and HFSC phases still exists [42].
In Fig. 9(b) we show the field dependence up to 35 T for different temperatures at GPa. At the lowest temperature, superconductivity survives up to the metamagnetic transition, which occurs at 29.5 T. A large jump to the normal state resistivity occurs at . shows a hysteresis between the up and down sweeps of the field [see Fig. 9(c)] indicating the first order nature of the transition at . At 1.65 K, the signature of the first order metamagnetic transition is very weak. At higher temperatures we observe a marked hysteresis at the metamagnetic transition and the magnetoresistance decreases strongly. At 6 K no hysteresis is observed anymore, indicating that the critical point of the first order transition is located between 4.5–6 K, thus lower than at ambient pressure.
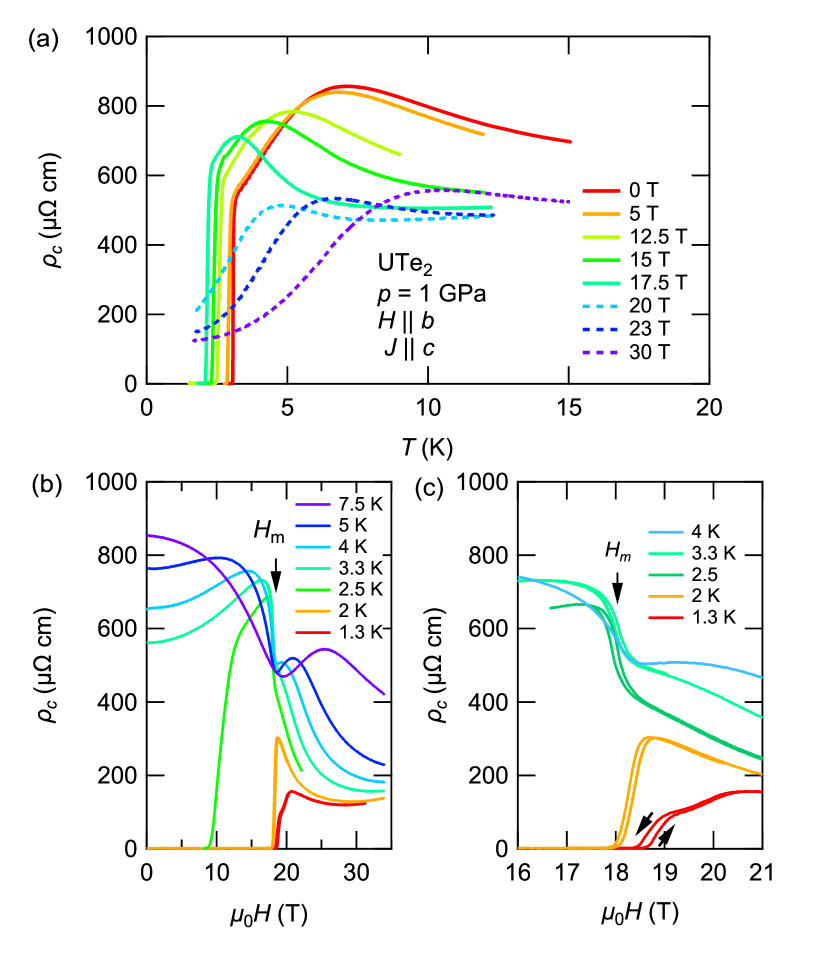
Figures 10 and 11 show the resistivity for higher pressures (1 GPa and 1.32 GPa respectively) approaching the critical pressure. From the magnetoresistance at 1 GPa we conclude that the metamagnetic transition field is further reduced down to T [see Fig.10 (b)]. The temperature dependence of the resistivity has changed slightly compared to lower pressures, and only the characteristic temperatures are lower. The maximum in decreases from K at to 3.24 K at T. For fields above the absolute value of the resistivity has decreased and a shallow maximum in the temperature dependence appears at 4.8 K at 20 T. Like at 0.35 GPa, it shifts to higher temperatures with increasing magnetic field. The superconducting transition is monotonously suppressed from 3.05 K at to 2.07 K at 17.5 T. Due to the high superconducting transition temperature and to the low , no temperature dependence is observed in the normal state above the superconducting transition. A Fermi liquid dependence is only recovered above the metamagnetic transition in the polarized phase for fields above . We observe zero resistivity up to at 1.3 and 2 K [see Fig. 10(b,c)]. We do not observe any signature of a reinforcement of superconductivity. This supports the proposal that the LFSC phase possibly appears only inside the HFSC phase. Thus in resistivity we only detect the transition from the normal to the HFSC state for all fields. Naturally resistivity cannot resolve any boundary between the HFSC and LFSC phases. Only the HFSC phase survives under pressure up to [42, 45]. In the normal state a maximum develops in the magnetoresistance at temperatures higher than the critical point, which is near 3.5 K and 17.5 T at 1 GPa. The maximum shifts to higher temperatures with increasing magnetic fields.
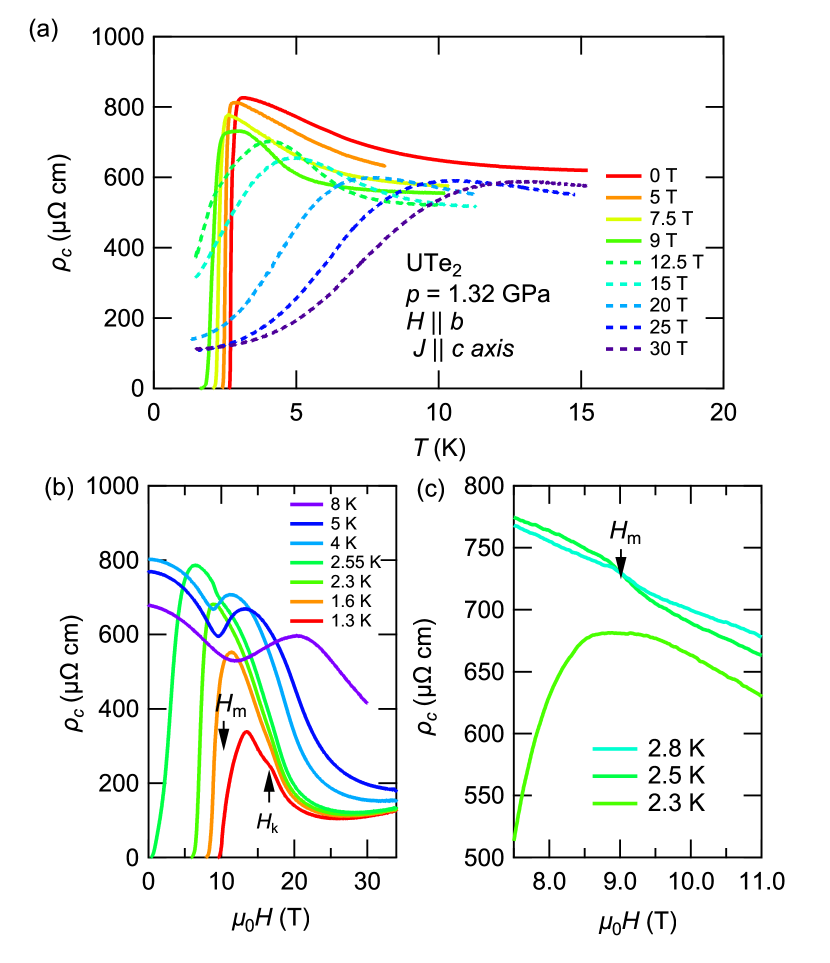
Figure 11 presents the temperature and field dependence of the axis resistivity close to the critical pressure at 1.32 GPa. At zero magnetic field the resistivity increases with decreasing temperature, superconductivity sets in near 3 K and zero resistivity is attained at 2.65 K. The shallow maximum near 3.05 K at zero field may already be a signature of the onset of superconductivity. The characteristic temperature seems to be lower or at most of the same order than . Under magnetic field up to 9 T a shallow maximum occurs just above the onset of superconductivity. Above a field T, close to , a broad maximum in occurs and is shifted to higher temperatures for higher magnetic fields. At low temperatures a Fermi-liquid regime occurs.
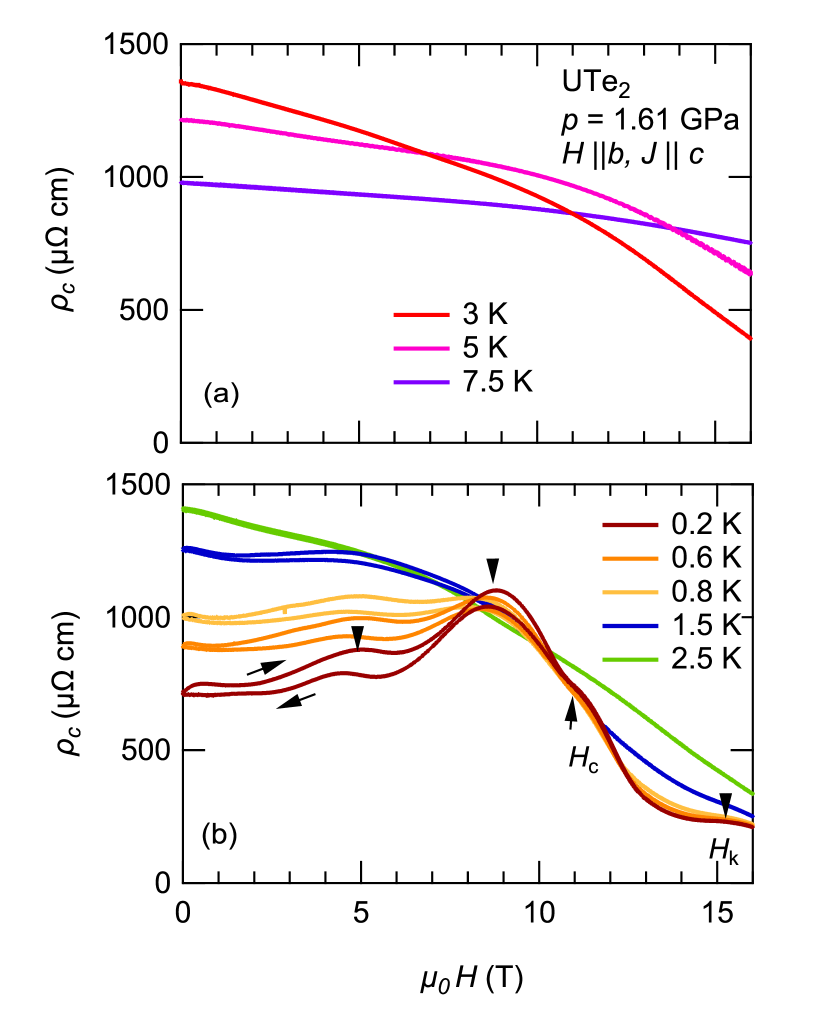
The field dependence is shown in Fig. 11(b) for different temperatures. Panel (c) displays the field range around the metamagnetic transition in an enlarged scale. We first discuss at the lowest temperature K [see Fig. 11(b)]. Zero resistivity is observed up to T in the field sweep with increasing field. For higher fields the resistivity increases sharply and has a change of slope as a function of field near 10.15 T. A clear signature of the metamagnetic transition is missing. By further increasing the field, at 1.3 K has a maximum at 13.3 T, which marks the onset of superconductivity near in the field sweep. A well defined kink in occurs at T in the normal state. For even higher fields the magnetoresistivity has a minimum around 26 T. With increasing temperature these features get broadened and the kink cannot be followed above 2 K. Figure 11(c) displays the anomaly of the metamagnetic transition on an enlarged scale. While at 2.3 K almost no anomaly at the metamagnetic transition occurs due to the closeness to the onset of superconductivity (at 8.7 T), at 2.5 and 2.8 K only a tiny kink indicates the metamagnetic transition; no jump or marked decrease in occurs anymore. Therefore the critical point of the first order transition cannot be resolved anymore due to superconductivity. For temperatures above 2.8 K no signature of is detected. At 4 K the magnetoresistivity shows a minimum at 9 T and a maximum at 11.4 T. This maximum shifts to higher fields with increasing temperature, similarly to the temperature of the maximum in at fixed field.
Finally, in Figs. 12 and 13 we show the temperature and field dependencies of axis resistivity at GPa. On cooling the resistivity shows a smooth increase at zero field below 10 K with an inflection point at K, and a sharp increase at K. Under field, increases in temperature and gets less pronounced, as the absolute value of the resistivity decreases. On the contrary decreases with increasing field, and its signature stays sharp under field up to 10 K.
The strong negative magnetoresistance up to fields of 30 T is shown in 12(b). It decreases by more than a factor 10 from zero field to 20 T indicating the suppression of the magnetic scattering related to the magnetic correlations established below the characteristic temperature . This strong magnetoresistance at low temperatures contrasts with the rather low variation of the magnetoresistance by only 2% at 15 K. For temperatures above the magnetoresistance does not show any hysteresis and decreases monotonously below 20 T. On the contrary, below the magnetoresistance shows a significant hysteresis for field up and field down sweeps. We define the field where the hysteresis disappears as the critical field of the magnetically ordered state. determined here from the field sweeps coincides with the temperature determined from the temperature sweeps. Inside the magnetically ordered state several additional anomalies occur. In the Figs. 12(b) and 13(b) maxima of the magnetoresistance are found in fields . These findings are similar to those reported in Refs. 42, 46. The observation of several clear anomalies in the magnetic ordered state is presumably a strong indication for reorientations of the magnetic moments inside the magnetic ordered state. Of course, thermodynamic measurements are needed to determine the phase lines inside the ordered state. For fields we observe at low temperatures an additional kink at in the magnetoresistance. A similar feature had been already observed at lower pressures in the polarized state at GPa. The signature of disappears for temperatures above 3 K. A comparable kink in the magnetoresistance has been observed for an angle of 25 deg from the toward the axis at about 21 T [85]. The origin of this anomaly is still an open question.
IV.3 Discussion of pressure dependence
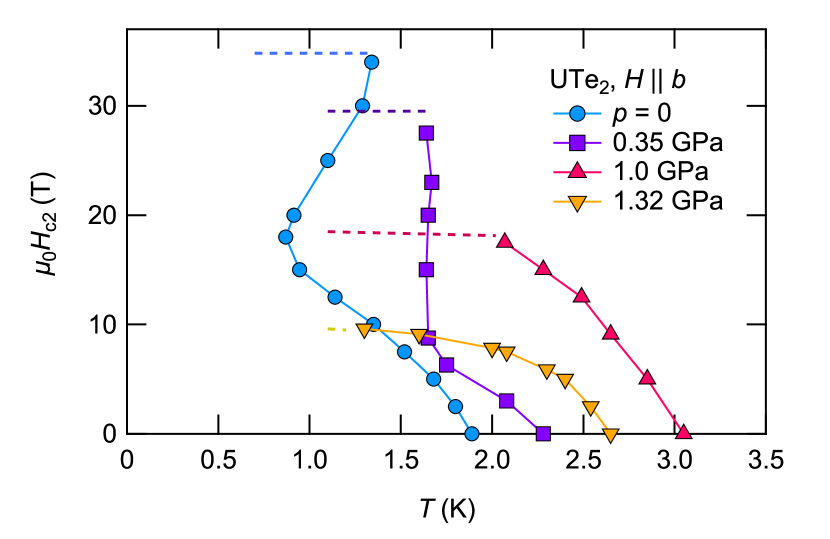
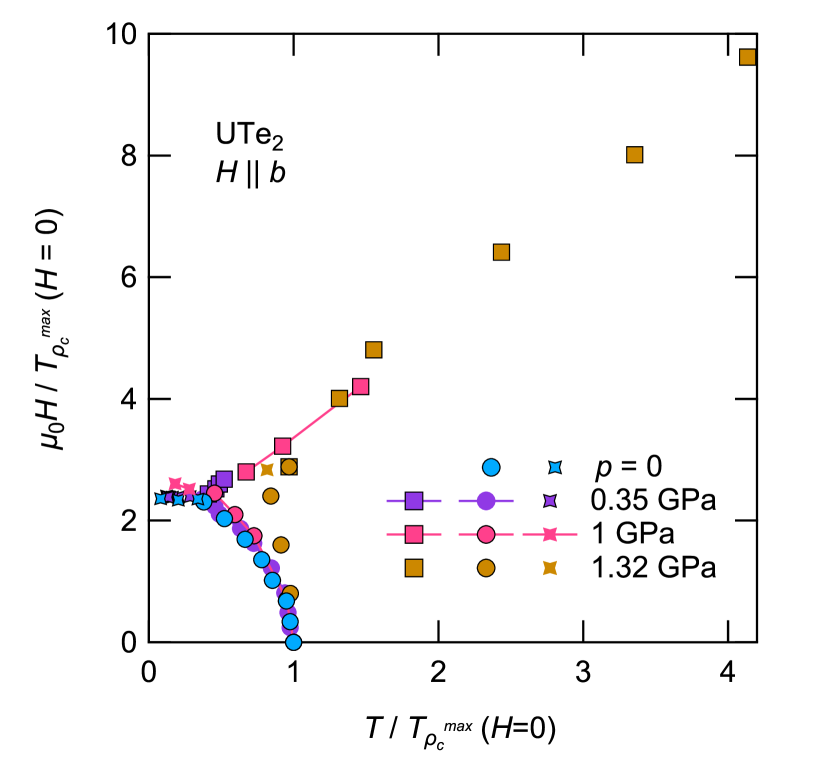
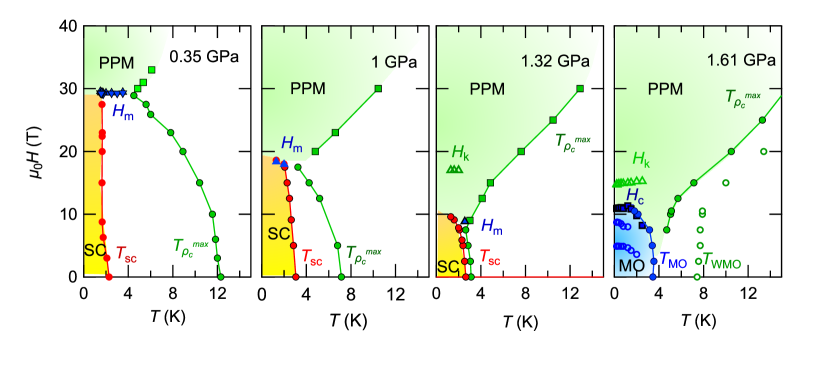
Figure 14 summarizes the phase diagrams at different pressures determined from the resistivity measurements with current and field . For all pressures below , is connected to the metamagnetic transition. Superconductivity is observed up to , which decreases with pressure. For fields higher than a crossover to a polarized regime occurs as a function of temperature. Close to the critical pressure an additional kink occurs in the polarized state at low temperatures in at , which persists also above . Above the critical pressure, at 1.61 GPa, two magnetic anomalies occur: the lower anomaly is a transition to a long range magnetically ordered state. Its antiferromagnetic nature is suggested by the different phase lines inside the ordered state. On the contrary, the presence of a true phase transition at is less clear. The field dependence resembles that of a ferromagnet under field applied along the easy magnetization axis, as the transition at smears out under a magnetic field and shifts to higher temperatures in a similar way as the maximum . We recall that the magnetic anisotropy changes at with being the easy and the hard magnetization axis [49]. The coexistence and competition of antiferromagnetic and ferromagnetic spin fluctuations has been suggested from NMR measurements [86].
The pressure evolution of the superconducting phase diagram is similar to those previously discussed in Ref. [45] and shown in more detail in Fig. 15. The superconducting transition temperature increases with applied pressure and superconductivity is stable under magnetic field up to the metamagnetic transition, but the temperature dependence of the upper critical field changes significantly under pressure. At low pressure (see at 0.35 GPa) the reinforcement of superconductivity can still be observed. The critical field of the upturn of is already strongly reduced from T at zero pressure to T at 0.35 GPa. In our resistivity measurement, it is not possible to discern different superconducting phases and the determined from transport is always that of the phase with the highest . The pressure 0.35 GPa is very close to the pressure, where ac calorimetry at zero field indicates two different superconducting phases [41, 47, 50]. Under pressure the low field LFSC is suppressed and embedded in the high field superconducting phase HFSC which survives at up to , as proposed in Ref. [42]. A more detailed studies of the phase line between the LFSC and HFSC phases for by thermodynamic probes are needed in future.
The temperature dependence of changes on approaching and the strong curvature of might indicate the increase of the paramagnetic limitation near for [45]. The pairing symmetry of the superconducting state near is still open. In Ref. 25 it has been proposed that the HFSC could be a singlet state and be driven by fluctuations which occur when approaching the metamagnetic transition. Under pressure, the HFSC state survives up to . As the magnetically ordered state MO is most probably antiferromagnetic, antiferromagnetic fluctuations may drive the HFSC superconductivity.
Next we will concentrate on the normal state properties. As shown in Fig. 14 the temperature of the maximum in the axis resistivity is decreasing with applied pressure. For all pressures below the field dependence of connects to the metamagnetic transition , where has its lowest value. For fields above , marks the crossover to a polarized paramagnetic regime. If we identify the minimum value of as the critical point of the first order metamagnetic transition, we determine that this critical point decreases almost linearly with pressure from about (5.6 K, 34 T) at zero pressure to (2.55 K, 8.85 T) at 1.32 GPa. At 1.32 GPa the signature of the metamagnetic transition is almost lost and only a tiny anomaly is visible.
In Fig. 16 we plot the phase diagram of the normal state scaled in field and temperature by the temperature . Importantly, the phase diagrams of the different pressures below scale almost perfectly. Only for GPa the scaling is less good, but this may be due to the difficulty to determine at low field correctly due to the high superconducting temperature, . Our thermal expansion measurements at zero pressure clearly show the correspondence K. This characteristic temperature scale connects to the metamagnetic transition at . The microscopic origin of is clearly related to the interplay of magnetic fluctuations and the formation of a coherent heavy-fermion state. This has been shown by different NMR and also inelastic neutron scattering experiments at ambient pressure, but also under high pressure. Inelastic neutron scattering showed the development of antiferromagnetic fluctuations at wave vector below 60 K which starts to saturate below 15 K [68, 69, 70]. The magnetic fluctuations in UTe2 depend strongly on the particular ladder like structure of the U atoms along the axis with the rung along axis. Two dimensional antiferromagnetic fluctuations originating from magnetic ladders coupled along were captured by inelastic neutron scattering and have a characteristic energy scale of 3-4 meV. The temperature dependence of these fluctuations is compatible with that from the NMR relaxation rate [87, 67]. Under pressure measured on the different Te-sites show also a constant behavior up to [86, 51] and from the NMR scales with determined from the resistivity. This seems to be the dominant energy scale which determines the pressure and field dependence of the phase diagram.
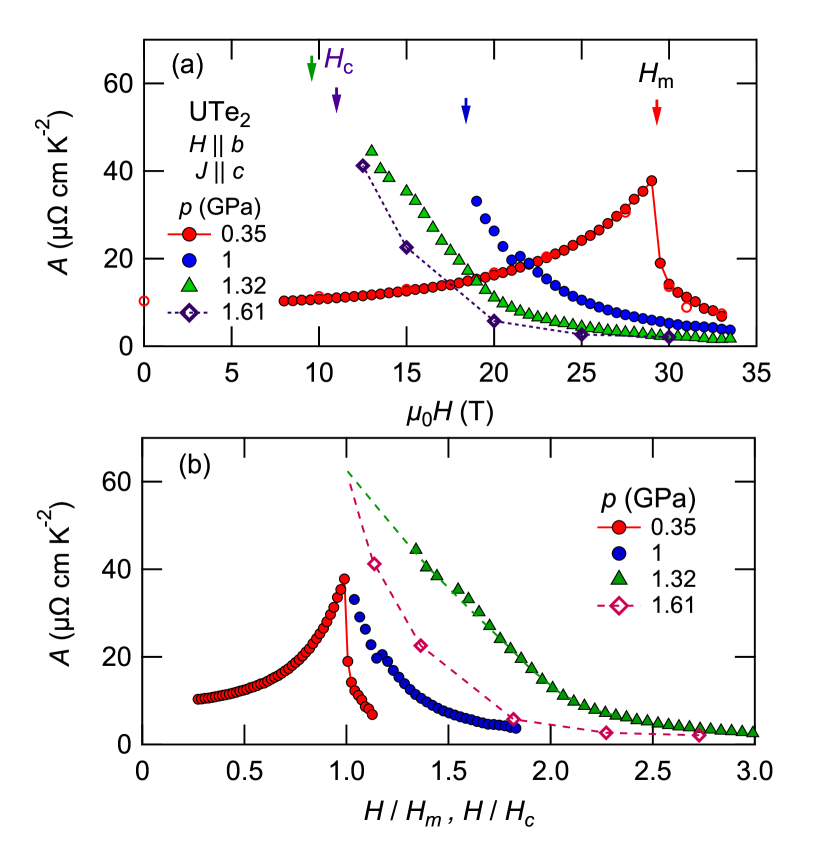
We emphasize that electronic correlations increase on approaching the critical pressure. The field dependence of the coefficient from our measurements with a current along the axis is shown in Fig. 17(a) as a function of the field and in (b) as a function of the normalized field () or (). At 0.35 GPa has still a similar field dependence as at ambient pressure and shows a steplike decrease just above the metamagnetic transition. For higher pressures, due to the lower , the onset of superconductivity prevents the determination of below the metamagnetic transition in . Thus has been only determined in the field range above . It shows a strong monotonous decrease. The coefficient at is larger close to the critical pressure. The enhancement of just below and above is very similar above and , respectively. This indicates that quantum criticality in UTe2 is important for the formation of the antiferromagnetic state. However, the transition from the superconducting ground state may be first order and connected to a strong change in the electronic structure. Indication for this is the abrupt increase in the residual resistivity through [52, 88]. Direct microscopic evidence for this is given by the abrupt change by 7 percent of the 5 count through towards the U4+ configuration [88]. As already mentionned, this change in the electronic structure goes along with a drastic change in the magnetic anisotropy. This leads to the enhancement of superconductivity under magnetic field close to the critical pressure and to the reentrant behavior of superconductivity along the axis [52, 46].
V Conclusions
We have shown that the resistivity in UTe2 depends strongly on the electrical current direction. The measurements with clearly reveal the important energy scales and other phenomena. In particular, at the metamagnetic transtion at T the resistivity strongly decreases for current applied along the axis, while and strongly increases (current along or axis respectively). The field dependence of the coefficient for seems to replicate the true compared to other current directions. The maximum in the temperature dependence of decreases on approaching the critical point of the first order metamagnetic transition line. coincides with the temperature of the minimum observed in the thermal expansion along the axis. Under hydrostatic pressure the and decreases up to the critical pressure . The phase diagram in the normal state below scales with , indicating the importance of this low energy scale: the coherence along the axis governs the low temperature behavior. Superconductivity is observed for all pressures up to . At zero pressure the low field superconducting phase LFSC scales with independently of the sample quality, while the high field superconducting phase strongly depends, another indication that these two phases emerge from different pairing mechanisms [25]. The LFSC phase is suppressed under pressure and close to only the HFSC phase is observed suggesting that the fluctuations responsible for the HFSC phase at zero pressure drive also superconductivity close to . However, the pressure and field relation between ferromagnetic and/or antiferromagnetic correlations and the U valence remains to be clarified. A main challenge is to precise the field and pressure dependence of the valence and spin correlations and their feedback on superconductivity.
VI Acknowledgments
We thank K. Ishida, Y. Yanase and M.E. Zhitomirsky for fruitful discussions. We received financial support from the French Research Agency ANR within the projects FRESCO No. ANR-20-CE30-0020 and FETTOM No. ANR-19-CE30-0037. Further finacial support has been provided by the JPSJ programs KAKENHI P22H04933, JP20K20889, JP20H00130, JP20KK0061. We acknowledge support of the LNCMI-CNRS, member of the European Magnetic Field Laboratory (EMFL) and from the Laboratorie d’excellence LANEF (ANR-10-LABEX-51-01).
References
- Monthoux et al. [2007] P. Monthoux, D. Pines, and G. G. Lonzarich, Nature 450, 1177 (2007).
- Flouquet [2006] J. Flouquet, Progress in low temperature physics (Elsevier, Amsterdam, 2006) p. 139.
- Pfleiderer [2009] C. Pfleiderer, Rev. Mod. Phys. 81, 1551 (2009).
- Fisher et al. [1989] R. A. Fisher, S. Kim, B. F. Woodfield, N. E. Phillips, L. Taillefer, K. Hasselbach, J. Flouquet, A. L. Giorgi, and J. L. Smith, Phys. Rev. Lett. 62, 1411 (1989).
- Hasselbach et al. [1989] K. Hasselbach, L. Taillefer, and J. Flouquet, Phys. Rev. Lett. 63, 93 (1989).
- Schemm et al. [2014] E. R. Schemm, W. J. Gannon, C. M. Wishne, W. P. Halperin, and A. Kapitulnik, Science 345, 190 (2014)
- Ott et al. [1984] H. R. Ott, H. Rudigier, T. M. Rice, K. Ueda, Z. Fisk, and J. L. Smith, Phys. Rev. Lett. 52, 1915 (1984).
- Ott et al. [1985] H. R. Ott, H. Rudigier, Z. Fisk, and J. L. Smith, Phys. Rev. B 31, 1651 (1985).
- Shimizu et al. [2019] Y. Shimizu, D. Braithwaite, D. Aoki, B. Salce, and J.-P. Brison, Phys. Rev. Lett. 122, 067001 (2019).
- Mydosh and Oppeneer [2014] J. Mydosh and P. Oppeneer, Philos. Mag. 94, 3642 (2014)
- Li et al. [2013] G. Li, Q. Zhang, D. Rhodes, B. Zeng, P. Goswami, R. E. Baumbach, P. H. Tobash, F. Ronning, J. D. Thompson, E. D. Bauer, and L. Balicas, Phys. Rev. B 88, 134517 (2013).
- Schemm et al. [2015] E. R. Schemm, R. E. Baumbach, P. H. Tobash, F. Ronning, E. D. Bauer, and A. Kapitulnik, Phys. Rev. B 91, 140506(R) (2015).
- Geibel et al. [1991] C. Geibel, C. Schank, S. Thies, H. Kitazawa, C. D. Bredl, A. Böhm, M. Rau, A. Grauel, R. Caspary, R. Helfrich, U. Ahlheim, G. Weber, and F. Steglich, Z. Physik B - Condensed Matter 84, 1 (1991).
- Jourdan et al. [1999] M. Jourdan, M. Huth, and H. Adrian, Nature 398, 47 (1999).
- Sato et al. [2001] N. K. Sato, N. Aso, K. Miyake, R. Shiina, P. Thalmeier, G. Varelogiannis, C. Geibel, F. Steglich, P. Fulde, and T. Komatsubara, Nature 410, 340 (2001).
- Saxena et al. [2000] S. S. Saxena, P. Agarwal, K. Ahilan, F. M. Grosche, R. K. W. Haselwimmer, M. J. Steiner, E. Pugh, I. R. Walker, S. R. Julian, P. Monthoux, G. G. Lonzarich, A. Huxley, I. Sheikin, D. Braithwaite, and J. Flouquet, Nature 406, 587 (2000).
- Aoki et al. [2001] D. Aoki, A. D. Huxley, E. Ressouche, D. Braithwaite, J. Flouquet, J. Brison, E. Lhotel, and C. Paulsen, Nature 413, 613 (2001).
- Huy et al. [2007] N. T. Huy, A. Gasparini, D. E. de Nijs, Y. Huang, J. C. P. Klaasse, T. Gortenmulder, A. de Visser, A. Hamann, T. Görlach, and H. v. Löhneysen, Phys. Rev. Lett. 99, 067006 (2007).
- Aoki et al. [2019a] D. Aoki, K. Ishida, and J. Flouquet, J. Phys. Soc. Jpn. 88, 022001 (2019a)
- Ran et al. [2019a] S. Ran, C. Eckberg, Q.-P. Ding, Y. Furukawa, T. Metz, S. R. Saha, I.-L. Liu, M. Zic, H. Kim, J. Paglione, and N. P. Butch, Science 365, 684 (2019a)
- Aoki et al. [2019b] D. Aoki, A. Nakamura, F. Honda, D. Li, Y. Homma, Y. Shimizu, Y. J. Sato, G. Knebel, J.-P. Brison, A. Pourret, D. Braithwaite, G. Lapertot, Q. Niu, M. Vališka, H. Harima, and J. Flouquet, J. Phys. Soc. Jpn. 88, 043702 (2019b)
- Aoki et al. [2022a] D. Aoki, J.-P. Brison, J. Flouquet, K. Ishida, G. Knebel, Y. Tokunaga, and Y. Yanase, J. Phys.: Condens. Matter 34, 243002 (2022a)
- Nakamine et al. [2021] G. Nakamine, K. Kinjo, S. Kitagawa, K. Ishida, Y. Tokunaga, H. Sakai, S. Kambe, A. Nakamura, Y. Shimizu, Y. Homma, D. Li, F. Honda, and D. Aoki, Phys. Rev. B 103, L100503 (2021).
- Fujibayashi et al. [2022] H. Fujibayashi, G. Nakamine, K. Kinjo, S. Kitagawa, K. Ishida, Y. Tokunaga, H. Sakai, S. Kambe, A. Nakamura, Y. Shimizu, Y. Homma, D. Li, F. Honda, and D. Aoki, J. Phys. Soc. Japan 91, 043705 (2022)
- Rosuel et al. [2023] A. Rosuel, C. Marcenat, G. Knebel, T. Klein, A. Pourret, N. Marquardt, Q. Niu, S. Rousseau, A. Demuer, G. Seyfarth, G. Lapertot, D. Aoki, D. Braithwaite, J. Flouquet, and J. P. Brison, Physical Review X 13, 011022 (2023)
- Knebel et al. [2019] G. Knebel, W. Knafo, A. Pourret, Q. Niu, M. Vališka, D. Braithwaite, G. Lapertot, M. Nardone, A. Zitouni, S. Mishra, I. Sheikin, G. Seyfarth, J.-P. Brison, D. Aoki, and J. Flouquet, J. Phys. Soc. Jpn. 88, 063707 (2019)
- Ran et al. [2019b] S. Ran, I.-L. Liu, Y. S. Eo, D. J. Campbell, P. M. Neves, W. T. Fuhrman, S. R. Saha, C. Eckberg, H. Kim, D. Graf, F. Balakirev, J. Singleton, J. Paglione, and N. P. Butch, Nat. Phys. 15, 1250 (2019b).
- Knafo et al. [2020] W. Knafo, M. Nardone, M. Valiska, A. Zitouni, G. Lapertot, D. Aoki, G. Knebel, and D. Braithwaite, Commun Phys 4, 40 (2020)
- Schönemann et al. [2022] R. Schönemann, P. F. S. Rosa, S. M. Thomas, Y. Lai, D. N. Nguyen, J. Singleton, E. L. Brosha, R. D. McDonald, V. Zapf, B. Maiorov, and M. Jaime, Thermodynamic evidence for high-field bulk superconductivity in ute2 (2022)
- Helm et al. [2023] T. Helm, M. Kimata, K. Sudo, A. Miyata, J. Stirnat, T. Förster, J. Hornung, M. König, I. Sheikin, A. Pourret, G. Lapertot, D. Aoki, G. Knebel, J. Wosnitza, and J.-P. Brison, (2023), arXiv:2207.08261 [cond-mat.supr-con] .
- Miyake et al. [2019] A. Miyake, Y. Shimizu, Y. J. Sato, D. Li, A. Nakamura, Y. Homma, F. Honda, J. Flouquet, M. Tokunaga, and D. Aoki, J. Phys. Soc. Jpn. 88, 063706 (2019)
- Miyake et al. [2022] A. Miyake, M. Gen, A. Ikeda, K. Miyake, Y. Shimizu, Y. J. Sato, D. Li, A. Nakamura, Y. Homma, F. Honda, J. Flouquet, M. Tokunaga, and D. Aoki, J. Phys. Soc. Jpn. 91, 063703 (2022)
- Knafo et al. [2019] W. Knafo, M. Vališka, D. Braithwaite, G. Lapertot, G. Knebel, A. Pourret, J.-P. Brison, J. Flouquet, and D. Aoki, J. Phys. Soc. Jpn. 88, 063705 (2019)
- Imajo et al. [2019] S. Imajo, Y. Kohama, A. Miyake, C. Dong, M. Tokunaga, J. Flouquet, K. Kindo, and D. Aoki, J. Phys. Soc. Jpn. 88, 083705 (2019)
- Miyake et al. [2021] A. Miyake, Y. Shimizu, Y. J. Sato, D. Li, A. Nakamura, Y. Homma, F. Honda, J. Flouquet, M. Tokunaga, and D. Aoki, J. Phys. Soc. Japan 90, 103702 (2021)
- Thebault et al. [2022] T. Thebault, M. Vališka, G. Lapertot, A. Pourret, D. Aoki, G. Knebel, D. Braithwaite, and W. Knafo, Phys. Rev. B 106, 144406 (2022).
- Niu et al. [2020a] Q. Niu, G. Knebel, D. Braithwaite, D. Aoki, G. Lapertot, M. Vališka, G. Seyfarth, W. Knafo, T. Helm, J.-P. Brison, J. Flouquet, and A. Pourret, Phys. Rev. Research 2, 033179 (2020a)
- Jiao et al. [2020] L. Jiao, S. Howard, S. Ran, Z. Wang, J. O. Rodriguez, M. Sigrist, Z. Wang, N. P. Butch, and V. Madhavan, Nature 579, 523 (2020).
- Hayes et al. [2021] I. M. Hayes, D. S. Wei, T. Metz, J. Zhang, Y. S. Eo, S. Ran, S. R. Saha, J. Collini, N. P. Butch, D. F. Agterberg, A. Kapitulnik, and J. Paglione, Science 373, 797 (2021).
- Ajeesh et al. [2023] M. O. Ajeesh, M. Bordelon, C. Girod, S. Mishra, F. Ronning, E. D. Bauer, B. Maiorov, J. D. Thompson, P. F. S. Rosa, and S. M. Thomas, , arXiv:2305.00589 [cond-mat.supr-con] .
- Braithwaite et al. [2019] D. Braithwaite, M. Vališka, G. Knebel, G. Lapertot, J. P. Brison, A. Pourret, M. E. Zhitomirsky, J. Flouquet, F. Honda, and D. Aoki, Commun Phys 2, 10.1038/s42005-019-0248-z (2019).
- Lin et al. [2020] W.-C. Lin, D. J. Campbell, S. Ran, I.-L. Liu, H. Kim, A. H. Nevidomskyy, D. Graf, N. P. Butch, and J. Paglione, npj Quantum Materials 5, 68 (2020)
- Thomas et al. [2021] S. M. Thomas, C. Stevens, F. B. Santos, S. S. Fender, E. D. Bauer, F. Ronning, J. D. Thompson, A. Huxley, and P. F. S. Rosa, Phys. Rev. B 104, 224501 (2021).
- Ran et al. [2020] S. Ran, H. Kim, I.-L. Liu, S. R. Saha, I. Hayes, T. Metz, Y. S. Eo, J. Paglione, and N. P. Butch, Phys. Rev. B 101, 140503 (2020).
- Knebel et al. [2020] G. Knebel, M. Kimata, M. Vališka, F. Honda, D. X. Li, D. Braithwaite, G. Lapertot, W. Knafo, A. Pourret, Y. J. Sato, Y. Shimizu, T. Kihara, J. P. Brison, J. Flouquet, and D. Aoki, J. Phys. Soc. Japan 89, 1 (2020)
- Vališka et al. [2021] M. Vališka, W. Knafo, G. Knebel, G. Lapertot, D. Aoki, and D. Braithwaite, Phys. Rev. B 104, 214507 (2021).
- Aoki et al. [2020a] D. Aoki, F. Honda, G. Knebel, D. Braithwaite, A. Nakamura, D. X. Li, Y. Homma, Y. Shimizu, Y. J. Sato, J. P. Brison, and J. Flouquet, J. Phys. Soc. Japan 89, 1 (2020a)
- Kinjo et al. [2022a] K. Kinjo, H. Fujibayashi, S. Kitagawa, K. Ishida, Y. Tokunaga, H. Sakai, S. Kambe, A. Nakamura, Y. Shimizu, Y. Homma, D. X. Li, F. Honda, D. Aoki, K. Hiraki, M. Kimata, and T. Sasaki, Magnetic field-induced transition with spin rotation in the superconducting phase of ute2 (2022a).
- Li et al. [2021] D. Li, A. Nakamura, F. Honda, Y. J. Sato, Y. Homma, Y. Shimizu, J. Ishizuka, Y. Yanase, G. Knebel, J. Flouquet, and D. Aoki, J. Phys. Soc. Japan 90, 073703 (2021)
- Thomas et al. [2020] S. M. Thomas, F. B. Santos, M. H. Christensen, T. Asaba, F. Ronning, J. D. Thompson, E. D. Bauer, R. M. Fernandes, G. Fabbris, and P. F. Rosa, Sci. Adv. 6 (2020).
- Kinjo et al. [2022b] K. Kinjo, H. Fujibayashi, G. Nakamine, S. Kitagawa, K. Ishida, Y. Tokunaga, H. Sakai, S. Kambe, A. Nakamura, Y. Shimizu, Y. Homma, D. Li, F. Honda, and D. Aoki, Phys. Rev. B 105, L140502 (2022b).
- Aoki et al. [2021] D. Aoki, M. Kimata, Y. J. Sato, G. Knebel, F. Honda, A. Nakamura, D. Li, Y. Homma, Y. Shimizu, W. Knafo, D. Braithwaite, M. Vališka, A. Pourret, J.-P. Brison, and J. Flouquet, J. Phys. Soc. Japan 90, 074705 (2021)
- Xu et al. [2019] Y. Xu, Y. Sheng, and Y.-f. Yang, Phys. Rev. Lett. 123, 217002 (2019)
- Ishizuka et al. [2019] J. Ishizuka, S. Sumita, A. Daido, and Y. Yanase, Phys. Rev. Lett. 123, 217001 (2019)
- Fujimori et al. [2019] S.-i. Fujimori, I. Kawasaki, Y. Takeda, H. Yamagami, A. Nakamura, Y. Homma, and D. Aoki, J. Phys. Soc. Japan 88, 103701 (2019)
- Miao et al. [2020] L. Miao, S. Liu, Y. Xu, E. C. Kotta, C.-J. Kang, S. Ran, J. Paglione, G. Kotliar, N. P. Butch, J. D. Denlinger, and L. A. Wray, Phys. Rev. Lett. 124, 076401 (2020).
- Shick et al. [2021] A. B. Shick, S.-i. Fujimori, and W. E. Pickett, Phys. Rev. B 103, 125136 (2021).
- Shishidou et al. [2021] T. Shishidou, H. G. Suh, P. M. R. Brydon, M. Weinert, and D. F. Agterberg, Phys. Rev. B 103, 104504 (2021).
- Choi et al. [2022] H. C. Choi, S. H. Lee, and B.-J. Yang, Correlated normal state fermiology and topological superconductivity in UTe2 (2022)
- Aoki et al. [2022b] D. Aoki, H. Sakai, P. Opletal, Y. Tokiwa, J. Ishizuka, Y. Yanase, H. Harima, A. Nakamura, D. Li, Y. Homma, Y. Shimizu, G. Knebel, J. Flouquet, and Y. Haga, J. Phys. Soc. Jpn. 91, 083704 (2022b)
- Eaton et al. [2023] A. G. Eaton, T. I. Weinberger, N. J. M. Popiel, Z. Wu, A. J. Hickey, A. Cabala, J. Pospisil, J. Prokleska, T. Haidamak, G. Bastien, P. Opletal, H. Sakai, Y. Haga, R. Nowell, S. M. Benjamin, V. Sechovsky, G. G. Lonzarich, F. M. Grosche, and M. Valiska, arXiv:2302.04758 [cond-mat.supr-con] .
- Broyles et al. [2023] C. Broyles, Z. Rehfuss, H. Siddiquee, K. Zheng, Y. Le, M. Nikolo, D. Graf, J. Singleton, and S. Ran, arXiv:2303.09050 [cond-mat.str-el] .
- Aoki et al. [2023] D. Aoki, I. Sheikin, A. McCollam, J. Ishizuka, Y. Yanase, G. Lapertot, J. Flouquet, and G. Knebel, J. Phys. Soc. Japan 92, 065002 (2023)
- Eo et al. [2022] Y. S. Eo, S. Liu, S. R. Saha, H. Kim, S. Ran, J. A. Horn, H. Hodovanets, J. Collini, T. Metz, W. T. Fuhrman, A. H. Nevidomskyy, J. D. Denlinger, N. P. Butch, M. S. Fuhrer, L. A. Wray, and J. Paglione, Phys. Rev. B 106, L060505 (2022).
- Willa et al. [2021] K. Willa, F. Hardy, D. Aoki, D. Li, P. Wiecki, G. Lapertot, and C. Meingast, Physical Review B 104, 205107 (2021).
- Niu et al. [2020b] Q. Niu, G. Knebel, D. Braithwaite, D. Aoki, G. Lapertot, G. Seyfarth, J.-P. Brison, J. Flouquet, and A. Pourret, Phys. Rev. Lett. 124, 086601 (2020b).
- Tokunaga et al. [2022] Y. Tokunaga, H. Sakai, S. Kambe, Y. Haga, Y. Tokiwa, P. Opletal, H. Fujibayashi, K. Kinjo, S. Kitagawa, K. Ishida, A. Nakamura, Y. Shimizu, Y. Homma, D. Li, F. Honda, and D. Aoki, J. Phys. Soc. Jpn. 91, 023707 (2022)
- Duan et al. [2020] C. Duan, K. Sasmal, M. B. Maple, A. Podlesnyak, J.-X. Zhu, Q. Si, and P. Dai, Phys. Rev. Lett. 125, 237003 (2020).
- Knafo et al. [2021] W. Knafo, G. Knebel, P. Steffens, K. Kaneko, A. Rosuel, J.-P. Brison, J. Flouquet, D. Aoki, G. Lapertot, and S. Raymond, Phys. Rev. B 104, L100409 (2021).
- Butch et al. [2022] N. P. Butch, S. Ran, S. R. Saha, P. M. Neves, M. P. Zic, J. Paglione, S. Gladchenko, Q. Ye, and J. A. Rodriguez-Rivera, npj Quantum Materials 7, 39 (2022).
- Duan et al. [2021] C. Duan, R. E. Baumbach, A. Podlesnyak, Y. Deng, C. Moir, A. J. Breindel, M. B. Maple, E. M. Nica, Q. Si, and P. Dai, Nature 600, 636 (2021).
- Raymond et al. [2021] S. Raymond, W. Knafo, G. Knebel, K. Kaneko, J.-P. Brison, J. Flouquet, D. Aoki, and G. Lapertot, J. Phys. Soc. Jpn. 90, 113706 (2021)
- Aoki et al. [2020b] D. Aoki, A. Nakamura, F. Honda, D. Li, Y. Homma, Y. Shimizu, Y. J. Sato, G. Knebel, J.-p. Brison, A. Pourret, D. Braithwaite, G. Lapertot, Q. Niu, M. Vališka, H. Harima, and J. Flouquet, in JPS Conference Proceedings 30, 011065 (2020)
- Sakai et al. [2022] H. Sakai, P. Opletal, Y. Tokiwa, E. Yamamoto, Y. Tokunaga, S. Kambe, and Y. Haga, Phys. Rev. Mater. 6, 073401 (2022).
- Küchler et al. [2012] R. Küchler, T. Bauer, M. Brando, and F. Steglich, Review of Scientific Instruments 83, 095102 (2012).
- Sakai et al. [2023] H. Sakai, Y. Tokiwa, P. Opletal, M. Kimata, S. Awaji, T. Sasaki, D. Aoki, S. Kambe, Y. Tokunaga, and Y. Haga, Phys. Rev. Lett. 130, 196002 (2023).
- Jacko et al. [2009] A. C. Jacko, J. O. Fjærestad, and B. J. Powell, Nat. Phys. 5, 422 (2009).
- Khmelevskyi et al. [2023] S. Khmelevskyi, L. V. Pourovskii, and E. A. Tereshina-Chitrova, Phys. Rev. B 107, 214501 (2023).
- Boukahil et al. [2014] M. Boukahil, A. Pourret, G. Knebel, D. Aoki, Y. Ōnuki, and J. Flouquet, Phys. Rev. B 90, 075127 (2014).
- Matsuda et al. [2000] T. D. Matsuda, H. Sugawara, Y. Aoki, H. Sato, A. V. Andreev, Y. Shiokawa, V. Sechovsky, and L. Havela, Phys. Rev. B 62, 13852 (2000).
- de Visser et al. [1993] A. de Visser, K. Bakker, L. Tai, A. Menovsky, S. Mentink, G. Nieuwenhuys, and J. Mydosh, Physica B: Condensed Matter 186-188, 291 (1993).
- Kontani [2004] H. Kontani, J. Phys. Soc. Jpn. 73, 515 (2004)
- Tokiwa et al. [2023] Y. Tokiwa, H. S. S. Kambe, P. Opletal, E. Yamamoto, M. Kimata, S. Awaji, T. Sasaki, Y. Yanase, Y. Haga, and Y. Tokunaga, arXiv:2305.17840 [cond-mat.str-el] .
- Park et al. [2006] T. Park, F. Ronning, H. Q. Yuan, M. B. Salamon, R. Movshovich, J. L. Sarrao, and J. D. Thompson, Nature 440, 65 (2006)
- Ran et al. [2021] S. Ran, S. R. Saha, I.-L. Liu, D. Graf, J. Paglione, and N. P. Butch, npj Quantum Materials 6, 75 (2021).
- Ambika et al. [2022] D. V. Ambika, Q.-P. Ding, K. Rana, C. E. Frank, E. L. Green, S. Ran, N. P. Butch, and Y. Furukawa, Phys. Rev. B 105, L220403 (2022).
- Tokunaga et al. [2019] Y. Tokunaga, H. Sakai, S. Kambe, T. Hattori, N. Higa, G. Nakamine, S. Kitagawa, K. Ishida, A. Nakamura, Y. Shimizu, Y. Homma, D. Li, F. Honda, and D. Aoki, J. Phys. Soc. Jpn. 88, 073701 (2019)
- Wilhelm et al. [2023] F. Wilhelm, J.-P. Sanchez, D. Braithwaite, G. Knebel, G. Lapertot, and A. Rogalev, Commun Phys 6, 96 (2023).