Early Planet Formation in Embedded Disks (eDisk) III: A first high-resolution view of sub-mm continuum and molecular line emission toward the Class 0 protostar L1527 IRS
Abstract
Studying the physical and chemical conditions of young embedded disks is crucial to constrain the initial conditions for planet formation. Here, we present Atacama Large Millimeter/submillimeter Array (ALMA) observations of dust continuum at 006 (8 au) resolution and molecular line emission at 017 (24 au) resolution toward the Class 0 protostar L1527 IRS from the Large Program eDisk (Early Planet Formation in Embedded Disks). The continuum emission is smooth without substructures, but asymmetric along both the major and minor axes of the disk as previously observed. The detected lines of 12CO, 13CO, C18O, H2CO, c-C3H2, SO, SiO, and DCN trace different components of the protostellar system, with a disk wind potentially visible in 12CO. The 13CO brightness temperature and the H2CO line ratio confirm that the disk is too warm for CO freeze out, with the snowline located at 350 au in the envelope. Both molecules show potential evidence of a temperature increase around the disk–envelope interface. SO seems to originate predominantly in UV-irradiated regions such as the disk surface and the outflow cavity walls rather than at the disk–envelope interface as previously suggested. Finally, the continuum asymmetry along the minor axis is consistent with the inclination derived from the large-scale (100′′ or 14,000 au) outflow, but opposite to that based on the molecular jet and envelope emission, suggesting a misalignment in the system. Overall, these results highlight the importance of observing multiple molecular species in multiple transitions to characterize the physical and chemical environment of young disks.
,
1 Introduction
Planets form in disks around young stars, starting with the growth of dust grains beyond interstellar medium sizes. Evidence for planet formation already being underway when the disk is still embedded in its natal envelope has been inferred from low dust opacity spectral indexes in Class 0 sources (Kwon et al., 2009; Shirley et al., 2011), dust polarization (e.g., Kataoka et al., 2015, 2016; Yang et al., 2016), decreasing dust masses derived from (sub-)millimeter observations for more evolved systems (e.g., Williams et al., 2019; Tychoniec et al., 2020), and the lack of CO isotopologue emission toward the protostellar position due to grain growth in the Class I system TMC1A (Harsono et al., 2018). In addition, rings in continuum emission, which could be a signpost of forming planets (e.g., Bryden et al., 1999; Zhu et al., 2014; Dong et al., 2018), are observed in disks as young as only 0.5 Myr (ALMA Partnership et al., 2015; Segura-Cox et al., 2020; Sheehan et al., 2020). Characterizing the physical and chemical conditions in young disks is thus crucial in understanding disk evolution and planet formation.
L1527 IRS (also known as IRAS 04368+2557) is the first Class 0 source toward which a Keplerian rotating disk was established (Tobin et al., 2012). This low-mass protostar is located in the L1527 dark cloud in the Taurus star-forming region and has been observed extensively from the near-infrared to centimeter wavelengths. Based on Gaia Data Release 2 (DR2), Luhman (2018) measured a distance of 139–141 pc for L1527, consistent with the analysis of Gaia DR2 and very long baseline interferometry (VLBI) data by Galli et al. (2019). Roccatagliata et al. (2020) group L1527 into the much larger Taurus B region with an average distance of 131.0 1.0 pc, but sources in L1527 have parallaxes closer to the lower end of the range for Taurus B (6.95 mas, corresponding to 143.9 pc). We therefore adopt a distance of 140 pc, which is also consistent with the distance used in earlier works by Kenyon et al. (1994) and Zucker et al. (2019).
| Species | Transition | Frequency | a | b | c | RMS d | Velocity range e |
|---|---|---|---|---|---|---|---|
| (GHz) | (K) | (s-1) | (km s-1) | (mJy beam-1) | (km s-1) | ||
| 12CO | 2–1 | 230.538000 | 16.6 | 6.910 | 0.635 | 0.95 | 11.30 – 1.13, 0.77 – 9.04 |
| 13CO | 2–1 | 220.398684 | 15.9 | 5.066 | 0.167 | 1.96 | 4.38 – 0.21, 0.46 – 3.97 |
| C18O | 2–1 | 219.560354 | 15.8 | 6.011 | 0.167 | 1.49 | 3.55 – 3.64 |
| DCN | 3–2 | 217.238538 | 20.9 | 4.575 | 1.340 | 0.55 | 3.84 – 1.53 g |
| SO | 65–54 | 219.949442 | 35.0 | 1.335 | 0.167 | 1.78 | 4.05 – 3.30 |
| SiO | 5–4 | 217.104980 | 31.3 | 5.196 | 1.340 | 0.58 | 13.45 – 1.30 |
| H2CO | 30,3–20,2 | 218.222192 | 21.0 | 2.818 | 1.340 | 0.51 | 3.84 – 2.87 |
| H2CO | 32,1–22,0 | 218.760066 | 68.1 | 1.577 | 0.167 | 1.42 | 3.05 – 3.14 |
| H2CO | 32,2–22,1 | 218.475632 | 68.1 | 1.571 | 1.340 | 0.48 | 2.50 – 2.87 |
| c-C3H2 | 60,6–51,5 f | 217.822148 | 38.6 | 5.396 | 1.340 | 0.54 | 1.16 – 1.53 |
| c-C3H2 | 61,6–50,5 f | 217.822148 | 38.6 | 5.396 | 1.340 | 0.54 | 1.16 – 1.53 |
| c-C3H2 | 51,4–42,3 | 217.940046 | 35.4 | 4.026 | 1.340 | 0.52 | 1.16 – 1.53 |
| c-C3H2 | 52,4–41,3 | 218.160456 | 35.4 | 4.041 | 1.340 | 0.50 | 1.16 – 1.53 |
| CH3OH | 42–31, E | 218.440063 | 45.6 | 4.686 | 1.340 | 0.49 | – |
L1527 IRS (hereafter L1527) is often classified as a borderline Class 0/I object, as classification is challenging due to the edge-on orientation. Its bolometric temperature and submillimeter luminosity to bolometric luminosity ratio are typical of a Class 0 source, but at a lower inclination it would be classified as a Class I object (Tobin et al., 2008). The large envelope mass and extended outflow cavities suggest that L1527 is younger than typical Class I sources, but it lacks the collimated outflow of typical Class 0 sources (see e.g., the discussion in Tobin et al. 2013). Recent re-analysis of the spectral energy distribution (SED) classified L1527 as a Class 0 source with a bolometric luminosity of 1.3 and a bolometric temperature of 41 K (Ohashi et al., 2022a).
Single-dish sub-millimeter observations of L1527 have identified a bipolar outflow in 12CO emission with an orientation almost perfectly in the plane of the sky (Tamura et al., 1996; Hogerheijde et al., 1998). Bright bipolar scattered light nebulae extending 10,000 au along the east–west outflow axis are visible in infrared observations with the Spitzer Space Telescope and ground-based telescopes (Tobin et al., 2008, 2010), as well as in the recently released JWST NIRCam image (release id 2022-055, PI: K. Pontoppidan111https://webbtelescope.org/contents/news-releases/2022/news- 2022-055). The eastern outflow lobe harbors a compact (1′′ long) radio continuum jet close to the protostellar position at centimeter wavelengths (Reipurth et al., 2004).
Ohashi et al. (1997) identified a flattened infalling and rotating envelope with a radius of 2000 au from 6′′ resolution C18O observations. The presence of a rotationally supported disk was initially inferred from 13CO observations with the Combined Array for Millimeter-wave Astronomy (CARMA; Tobin et al. 2012) that also resolved the continuum at 035 resolution, and was later confirmed by observations with the Atacama Large Millimeter/sub-millimeter Array (ALMA; Ohashi et al. 2014; Aso et al. 2017). High-resolution (015) continuum observations with ALMA have suggested that the disk is warped with the inner and outer disk boundary between 40 and 60 au (Sakai et al., 2019). Even higher resolution (008) observations with the Karl G. Jansky Very Large Array (VLA) initially revealed clumpy substructures in -band (Nakatani et al., 2020), but these structures were not confirmed in later observations with higher sensitivity (Sheehan et al., 2022).
Molecular line observations have shown that the disk is warm ( 20 K), based on the presence of CO gas out to at least 75 au (van ’t Hoff et al., 2018). The water snowline is suggested to be located between 2–4 au (van ’t Hoff et al., 2022), but only a tentative detection of a complex molecule (methanol, CH3OH) in the inner disk has been reported (Sakai et al., 2014a; van ’t Hoff et al., 2020). Observations by Sakai et al. (2014a, b) reveal different morphologies and kinematics for several molecular species, suggesting that they trace different components of the protostellar system. In particular, SO seems to be enhanced in a ring at the disk-envelope interface (see also Ohashi et al. 2014).
While L1527 has been studied at high resolution at multiple wavelengths in continuum emission (0045 at cm wavelengths and 008 at mm wavelengths; Sheehan et al. 2022; Ohashi et al. 2022b, respectively), molecular line observations have been limited to a resolution of 0.3–05. Here, we present high angular resolution 1.3 mm continuum (006) and molecular line images (017) obtained with the ALMA Large Program eDisk (Early Planet Formation in Embedded Disks). The molecular lines detected toward L1527 are 12CO, 13CO, C18O, H2CO, c-C3H2, SO, SiO and DCN. A notable nondetection is CH3OH. The observations are described in Sect. 2. The structure of the 1.3 mm continuum is presented in Sect. 3.1 and the morphology and spatial origin of the molecular lines in Sect. 3.2. The system’s inclination is discussed in Sect. 4.1, a dynamical estimate of the central mass is made in Sect. 4.2, and the temperature structure is described in Sect. 4.3. In Sect. 4.4 we discuss the physical and chemical reasons behind the different molecular distributions. Finally, our conclusions are summarized in Sect. 5.
2 Observations
L1527 has been observed as part of the ALMA Large Program eDisk (2019.1.00261.L; PI N. Ohashi) on 14 and 15 October 2022, sampling baselines between 91 and 11,469 m. Observations in a more compact configuration with the purpose of recovering larger spatial scales were carried out through a DDT program (2019.A.00034.S; PI J. Tobin) on 3 December 2021, 16 December 2021 and 3 July 2022. These observations used baselines between 15 and 2617 m. The correlator setup for both programs is centered around 225 GHz (1.3 mm) and includes 2 low spectral resolution windows at 976.56 kHz (1.34 km s-1) resolution, 1 spectral window at 488.28 kHz (0.635 km s-1) resolution, and 4 higher spectral resolution windows at 122.07 kHz (0.167 km s-1) resolution. More details about the observations are provided by Ohashi et al. (subm.), and an overview of the molecular lines discussed in this paper is provided in Table 1.
Standard calibration of the data was done using the ALMA Pipeline and a script developed for the eDisk Large Program, as described in Ohashi et al. (subm.) was used for subsequent data reduction and imaging. In short, the continuum emission peaks of all execution blocks were first aligned to a common phase center after which an amplitude rescaling was applied to the shifted visibilities. The amplitude calibration uncertainty is expected to be 5–10%. Two rounds of continuum self-calibration were then performed on the aggregate continuum data, first on the short-baseline data only and then on the short- and long-baseline data combined. For L1527, phase and amplitude self-calibration were performed on the short baseline data, while only phase self-calibration was used for the combined data set. The final gain tables were also applied to the line data.
The standard eDisk image products were created with tclean using a range of robust parameters (2.0, 1.0, 0.5, 0.0, 0.5, 1.0 and 2.0) for the continuum and robust = 0.5 for the line images. For L1527, line images were also created with a robust value of 2.0 to increase the signal-to-noise ratio, and those images are presented here. The resulting beam size for the line images is approximately 017 014 (PA = -20∘), and the noise levels for the different line cubes are listed in Table 1. Unless noted otherwise, we present the continuum image created with a robust value of 0.5 as a compromise between resolution and sensitivity. This image has a resolution of 0056 0029 (PA = 9.3∘), and an rms of 29 Jy beam-1. The full range of continuum images is presented in Fig. 17. An overview of the continuum and molecular line observations toward L1527 is presented in Fig. 1.
3 Results
3.1 Continuum
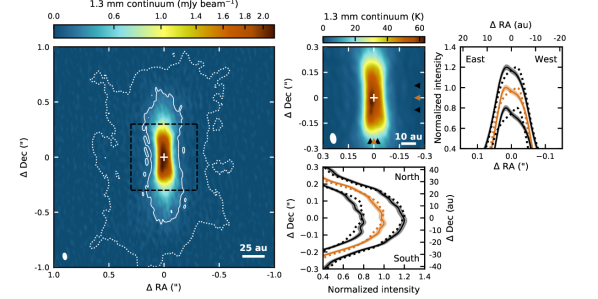
The 1.3 mm continuum image of L1527 obtained with a robust parameter of 0.5 is shown in Fig. 2, and a gallery of images made with different robust parameters is presented in Fig. 17. The continuum image displays an edge-on disk with the major axis along the north–south direction, as previously observed (e.g., Ohashi et al., 1997; Loinard et al., 2002; Tobin et al., 2008, 2010, 2012, 2013; Sakai et al., 2014b; Aso et al., 2017; Nakatani et al., 2020; Ohashi et al., 2022b; Sheehan et al., 2022). The flared nature of the disk inferred by radiative transfer modeling of multi-wavelength continuum emission (Tobin et al., 2013) is now clearly visible at this high resolution. The emission extends out to a radius of 05 (70 au) along the major axis, and in the east–west direction to 01 (14 au) above the midplane near the source position and up to 02 (28 au) at a radial offset of 03 (42 au). Fainter emission extending out to a radius of 1′′ (140 au) and to 05 (70 au) above the midplane is visible in the image obtained with a robust parameter of 2.0. This is most likely due to more faint envelope emission being picked up by the higher sensitivity of the robust = 2.0 image, because the vertical extent of the bright central region is not much more extended (Fig. 17). The brightness temperature for the majority of the disk is 40–60 K (for a robust parameter of 0.5), suggesting that the continuum may be optically thick.
The continuum emission appears smooth with no sign of substructures. However, an asymmetry between the north and south side, with the south side being brighter than the north side, is visible for all robust parameters (see radial cuts for a robust value of 0.5 in Fig. 2). At the highest resolutions (robust values 0.0 or beam sizes of 00620038 and smaller), an asymmetry between the east and west side becomes also clear, with the east side being brighter than the west side. The north–south asymmetry is then also more pronounced in the east. The east–west asymmetry is stronger in the south but visible along the entire major axis. The difference in maximum brightness temperature between the southeast and the northeast or southwest is about 10 K.
Because of the flared nature of the disk, a simple 2D Gaussian fit does not represent the emission morphology and total flux density. Therefore, we sum over all pixels with values , which yields a flux density of 192.57 0.05 mJy (compared to 139.04 0.73 mJy from the Gaussian fit). This is only 9% higher than the 1.3 mm flux reported by Aso et al. (2017) obtained within a 4′′ 4′′ box from 047 037 resolution observations. Using a similar aperture, we obtain a slightly lower flux density of 188.78 mJy, which is within 7% of the previously reported value.
For isothermal and optically thin emission, the continuum flux density, , can be converted into a dust mass using
| (1) |
where is the distance (140 pc), the dust opacity at the observed frequency, and the Planck function at the observed frequency for a dust temperature of . We adopt a dust opacity of 2.3 cm2 g-1 at the observed frequency of 225 GHz (Beckwith et al., 1990), and an average temperature of K = 46 K (with = 1.3 ; Ohashi et al. subm.), based on a suite of radiative transfer models by Tobin et al. (2020). This results in a dust mass of 41 . Adopting a temperature of 20 K, as typically done for Class II disks (e.g., Ansdell et al., 2016), results in a dust mass of 112 . For a gas-to-dust ratio of 100, the total disk mass is then 0.01–0.03 , consistent with previous estimates at different wavelengths given different choices for temperature and dust opacity (e.g. Tobin et al., 2013; Aso et al., 2017; Nakatani et al., 2020; Sheehan et al., 2022). The here derived mass is a lower limit because the continuum emission is likely optically thick.
3.2 Molecular lines
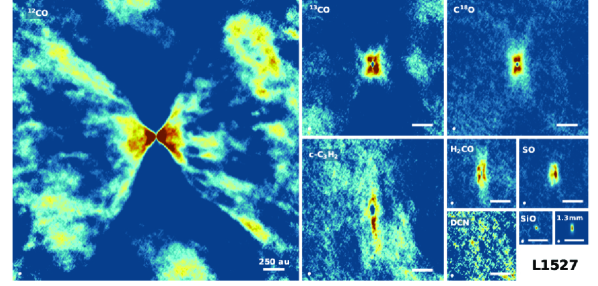
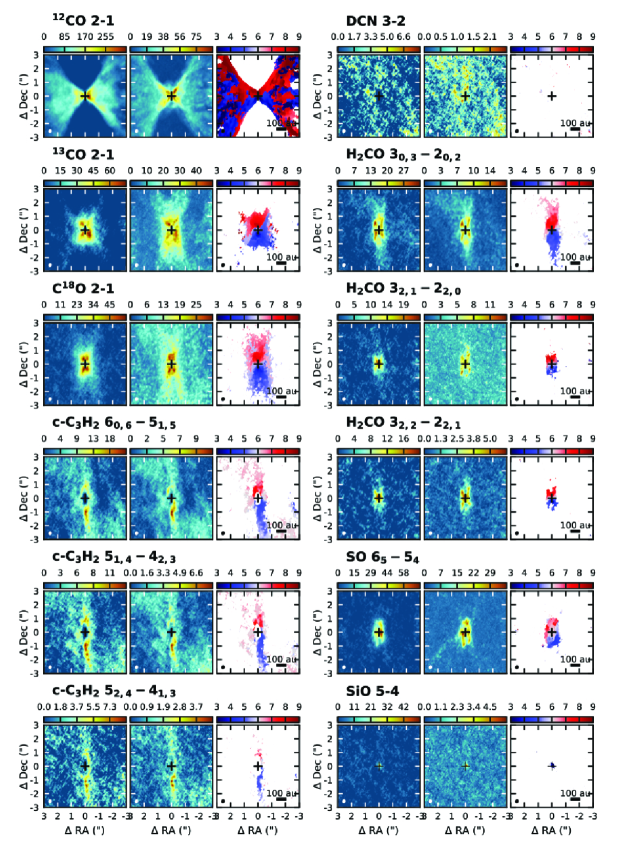
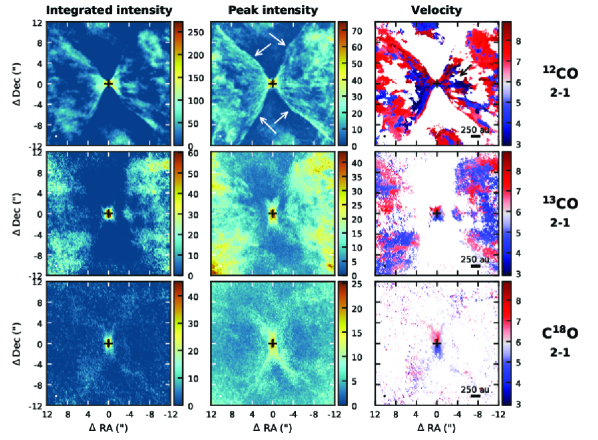
An overview of all molecular lines detected towards L1527 is listed in Table 1 and presented in Fig. 3. In addition to moment zero maps (integrated intensity), we show moment eight maps (peak intensity) and velocity maps (similar to moment nine maps) created with the quadratic method of the bettermoments package222https://github.com/richteague/bettermoments (Teague & Foreman-Mackey, 2018). It is evident from Fig. 3 that each molecular species and for H2CO, each transition, exhibits a different spatial and velocity distribution. Each species and its spatial origin (e.g., outflow, envelope, disk) is therefore discussed individually below (Sect. 3.2.1–3.2.6), before the full molecular structure and the underlying physical and/or chemical structure are discussed in Sects. 4.3 and 4.4.
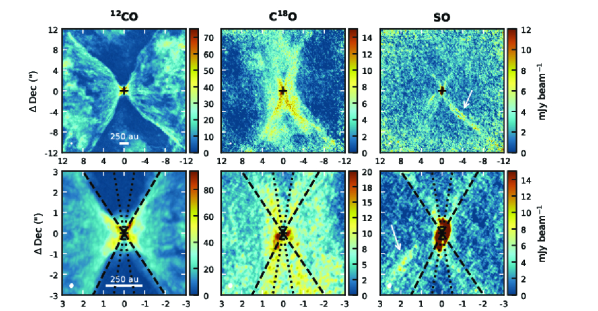
3.2.1 12CO, 13CO, C18O
In addition to the images on disk-scales shown in Fig. 3, moment zero, moment eight and velocity maps on larger scales are presented in Fig. 4 for the CO isotopologues. The large-scale 12CO emission displays an hour glass morphology, with emission originating along and inside the outflow cavity walls. The cavity walls deviate from a parabolic shape and display a kink (highlighted with white arrows in Fig. 4). This kink occurs at larger offsets from the source for the northwestern and southeastern cavity walls. The most prominent feature inside the cavity walls is visible 3–6′′ (420–840 au) west of the source position at blueshifted velocities (highlighted with an arrow in the velocity map in Fig. 4 and in the channel maps in Fig. 20).
12CO emission is detected over a velocity range of 11.3 – 1.13 and 0.77 – 9.04 km s-1 (with respect to the systemic velocity of 5.9 km s-1 Caselli et al. 2002; Tobin et al. 2011), while most of the emission is resolved out at velocities close to the systemic velocity. There is no clear velocity gradient visible in the outflow direction (east–west), but the southern outflow cavity walls are more pronounced at blueshifted velocities, while the northern cavity walls are stronger at redshifted velocities. This velocity pattern is more clearly visible at smaller scales (Fig. 3) and is similar to the rotation direction of the disk and inner envelope.
The 13CO and C18O emission are dominated by the disk and inner envelope (Fig. 3), but they also have a contribution from material inside and along the cavity walls. Emission inside the cavity walls is clearly visible in the 13CO images in Fig. 4 (at offsets larger than 4′′ in the east–west direction), while for C18O it is only visible in the individual velocity channels (see Fig. 22). Large-scale emission is seen out to velocity offsets of km s-1 in 12CO emission, while this is only visible out to km s-1 in 13CO and C18O, maybe due to the lower sensitivity at the higher velocity resolution. For both 13CO and C18O, there is a narrow arc of emission in both outflow cavities that moves outward with increasing velocity offsets (Figs. 21 and 22). A similar moving “front” of emission is also visible in a range of 12CO channels (Fig. 20), but at smaller spatial scales (2–3′′ off source, compared to 2–16′′ for 13CO and C18O) and higher velocity offsets ( km s-1, compared to km s-1 for 13CO and C18O). This differences between 12CO and 13CO/C18O is likely because most 12CO emission is resolved out at the velocities where the 13CO/C18O moving “front” is detected and the sensitivity is not high enough to detect 13CO/C18O emission at velocities as high as for 12CO.
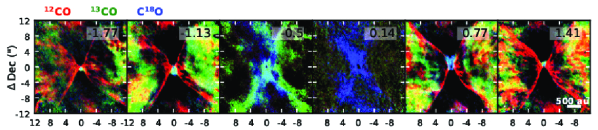
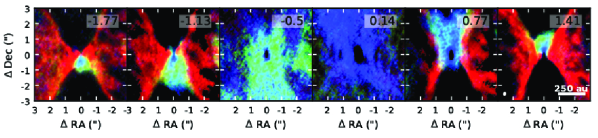
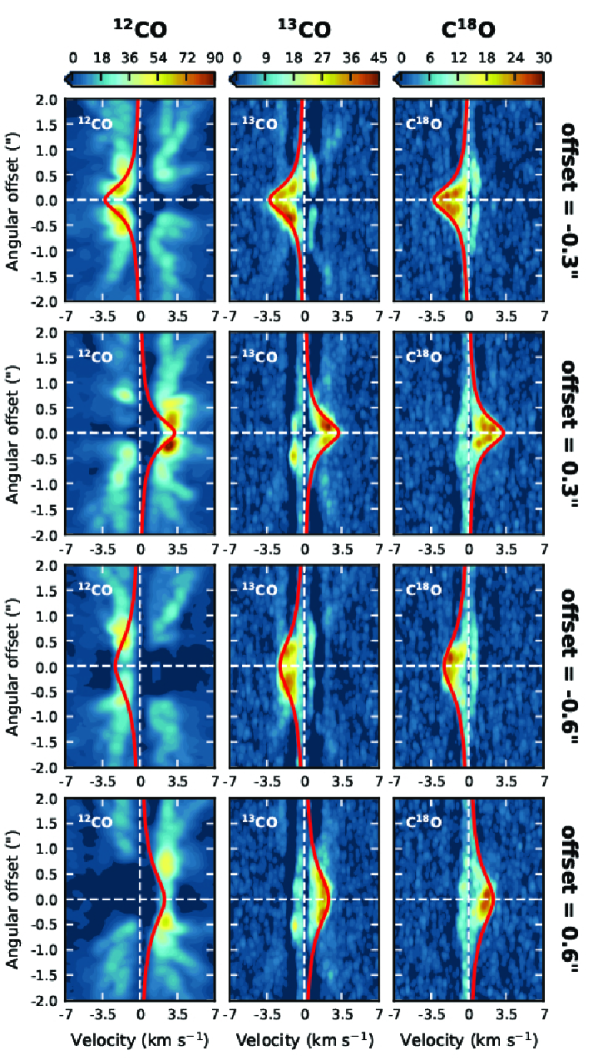
The large-scale C18O moment eight map (Fig. 4) displays X-shaped emission (8′′), while very faint and narrow X-shaped emission is visible in some 13CO velocity channels (Fig. 19) and very weakly in the moment zero map on smaller spatial scales (4′′). This structure was previously observed for 13CO emission (Ohashi et al., 1997). One of the reasons for the difference between the 13CO and C18O moment maps is that while 13CO (and 12CO) emission is resolved out near the systemic velocity, C18O is detected in all low-velocity channels. Therefore, to better compare the spatial origin of the emission from the different CO isotopologues, 13CO and C18O images are created at the same velocity resolution as the 12CO image, and velocity channels with emission from all three isotopologues overlaid are presented in Fig. 5. Channel maps for each individual isotopologue are shown in Fig. 19. The overlay in Fig. 5 reveals a layered structure, with 12CO tracing the surface layer of the cavity wall and 13CO and C18O tracing deeper and deeper into the envelope. The faint and narrow X-shaped emission visible in 13CO channels coincides with 12CO emission from the cavity wall (visible in yellow), while the broad X-shape in the C18O moment maps is caused by emission at velocities close to the systemic velocity. A similar structure is visible for 13CO at 0.5 km s-1, and this velocity channel clearly shows that the 13CO emission originates from layers closer to the outflow cavity. The emission from the inner envelope and disk, as traced by 13CO and C18O (1.77, 1.13, 0.77, 1.41 km s-1 in Fig. 5), is present in between the 12CO emission features. Here too, the 13CO emission is peaking in higher layers compared to C18O. The C18O channel maps at the original velocity resolution (Fig. 22) clearly show that the emission has a contribution from outflowing material as well as from the surface layer of the envelope or cavity wall. At velocities close to the systemic velocity ( 0.5 km s-1), these components start to overlap.
While both 13CO and C18O trace emission from the disk and inner envelope, the contributions from the different components are not exactly the same for both isotopologues. The difference in origin between 13CO and C18O emission becomes more clear from position-velocity (pv) diagrams, as presented in Fig. 6. Emission at angular offsets 2′′ as well as emission in the non-Keplerian quadrants (top left and bottom right) is relatively stronger for C18O than for 13CO. Together with the fact that 13CO emission is resolved out in the central channel while C18O emission is not, this suggests that C18O traces emission from the infalling envelope out to larger scales than 13CO emission. This is probably because 13CO becomes optically thick faster due to its higher abundance and hence gets resolved out more heavily near line center. Close to the central protostar, the C18O emission is concentrated on scales 1′′ and velocities 1 km s-1, while 13CO emission extends out to slightly larger scales and slightly lower velocities. This suggests that the contribution from the innermost envelope is stronger for 13CO than it is for C18O, likely due to the higher 13CO abundance. A similar conclusion can be drawn from the velocity maps (Fig. 3), where 13CO displays a stronger contribution from blueshifted envelope emission in the north and redshifted envelope emission in the south, that is, opposite to the disk velocity structure.
The intensity ratio between 13CO and C18O in channels with disk and inner envelope emission ( 1 km s-1) is 1–3 instead of the canonical ratio of 7 (Wilson & Rood, 1994). This suggests that 13CO is generally optically thick and that C18O is probably optically thick in the midplane region where the line ratio is lowest (1), consistent with earlier observations (van ’t Hoff et al., 2018). The central negative “gap” visible in the 13CO and C18O moment zero map (and low-velocity channels, e.g., Fig. 5 and most clearly visible in Fig. 19) is therefore likely the result of continuum oversubtraction from optically thick line emission, potentially in combination with absorption by cold outer envelope material that is being resolved out.
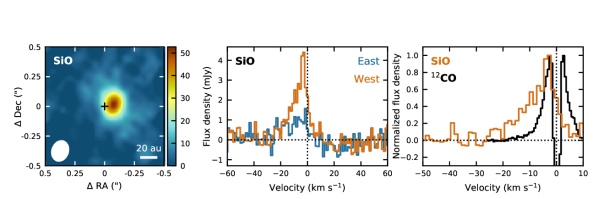
3.2.2 SiO
Very compact, mostly unresolved SiO emission is detected just west of the source position, peaking at an offset of 008 (11 au; Fig 7). The emission is predominantly blueshifted and is detected at velocities ranging between 13.45 and 1.30 km s-1 with respect to the systemic velocity, and peaks at 2.72 km s-1. This component is not seen in any of the other molecular lines. 12CO emission typically peaks towards the northwest or southwest, rather than directly west, and emission close to source is only detected out to 10.18 km s-1 in individual velocity channels (see also Fig. 7, right panel). SiO is a shock tracer and is typically observed in protostellar jets. A jet origin of the SiO emission observed toward L1527 is consistent with the high velocities of the emission.
3.2.3 c-C3H2
All four c-C3H2 transitions (two are blended, see Table 1) display strong emission features along the north–south direction out to offsets of 2′′ (280 au; Fig. 3), which is more extended than the bright components seen in 13CO and C18O (1′′). The blueshifted emission in the south is stronger than the redshifted emission in the north. In contrast, the total extent in the east–west direction is only 03, compared to 10 and 20 for C18O and 13CO, respectively. In addition, a weak large scale emission component is visible (most clearly seen in Fig. 1).
At the velocity resolution of 1.34 km s-1, the c-C3H2 transitions are detected in only three channels, spanning a velocity range of 1.16 – 1.53 km s-1, except for the blended and transitions that display weak (3–4) emission at 2.5 km s-1 (Fig. 23). The faint extended component is only visible in the central channel. The combination of emission morphology and narrow velocity range indicates that c-C3H2 is tracing envelope emission. A central absorption feature is only present in the central velocity channel and is likely due to absorption of the warm continuum emission by cold envelope material.
3.2.4 DCN
Very weak DCN emission is tentatively detected at the 3–4 level in the central velocity channel (Fig. 24). The emission is extended surrounding a central region with negative emission and bears the most resemblance to the faint large scale emission component seen in c-C3H2 (as shown in Fig. 1). There is a hint of a narrow emission feature north of the source extending in the north–south direction in the first redshifted channel (1.53 km s-1), but such a feature is absent in the south in the first blueshifted channel (-1.16 km s-1). This is reflected in the peak intensity map shown in Fig. 3. DCN is thus at least present in the envelope and the central absorption feature is likely due to absorption of the warm continuum.
3.2.5 H2CO
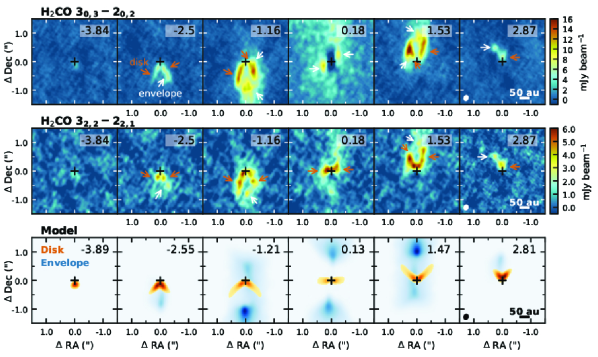
Three H2CO transitions are observed, with upper level energies of 21 K () and 68 K ( and ). The low-energy transition displays stronger and more extended emission than the higher energy transitions. All transitions display X-shaped emission, extending about 08 toward the north and south, and 04 toward the east and west (Fig. 3; most clearly visible in the peak intensity maps). The low-energy transition () shows an emission peak along the north–south axis at 1′′ offsets. This feature is smaller and less evident for the higher energy transitions. Only the transition displays weak extended emission in the north–south direction as well as inside the outflow cavity walls (8′′).
The difference in emission morphology between the H2CO transitions, as well as the origin of the emission can be more clearly seen in the individual velocity channels. In Fig. 8 we compare the and transitions because they are observed at the same low velocity resolution of 1.34 km s-1. In order to provide a qualitative description of the origin of the H2CO emission we also present velocity channel maps of a model with a Keplerian disk (125 au radius) embedded in a rotating and infalling envelope (CMU; Ulrich 1976; Cassen & Moosman 1981)333The CMU model describes the collapse of an isothermal, spherically symmetric, and uniformly rotating cloud. The assumption of free fall with each particle conserving angular momentum results in particles moving along parabolic paths. Details about the implementation can be found in Appendix C of van ’t Hoff et al. (2018).. The temperature and density structure are based on radiative transfer modeling of multi-wavelength continuum observations of L1527 by Tobin et al. (2013) and this model has been used by van ’t Hoff et al. (2018, 2020, 2022) to study molecular line observations toward L1527. The model images are created with the radiative transfer code LIME (Brinch & Hogerheijde, 2010). Our goal here is not to reproduce the observed emission exactly, but to illustrate the emission features expected for emission originating in different parts of the protostellar system. The model presented in Fig. 8 has emission originating in the inner 250 au of the envelope and in the surface layers of the disk.
The low-energy transition is detected over a velocity range of 3.84 – 2.87 km s-1, while the high-energy transition is only marginally detected at 3.84 km s-1 (Fig. 8). The transition is observed at a higher velocity resolution (0.167 km s-1) and emission is detected over a velocity range of 3.05 – 3.14 km s-1 (Fig. 25), suggesting that the asymmetry in velocity for the other transitions is likely due to the low spectral resolution. The V-shaped emission pattern responsible for the X-shape in the integrated intensity map (Fig. 3) is visible in all channels, except the central channel, and is characteristic of emission originating in the surface layers of the disk. In contrast, the emission features 1′′ north and south of the source position seen most strongly for are only present in the 1.16 and 1.53 km s-1 channels and not at higher velocities, and likely originate in the inner envelope. Both transitions differ in the central velocity channel; where the emission extends to the east and west in a bow-tie pattern, the transition shows absorption surrounded by compact emission features to the southeast and northwest. The bow-tie pattern of is indicative of disk emission, while the asymmetric features, as well as the more extended features at low velocities in the north and south of , are consistent with envelope emission. The bow-tie extends as far in the east and west direction as the emission features, so the absence of the bow-tie for the transition is not due to the central absorption. The warm transition thus originates predominantly in the disk surface layers, while the colder transition also has a strong contribution from the envelope. Absorption of continuum emission by the outer envelope is then the likely origin of the absorption in the central velocity channel of the transition.
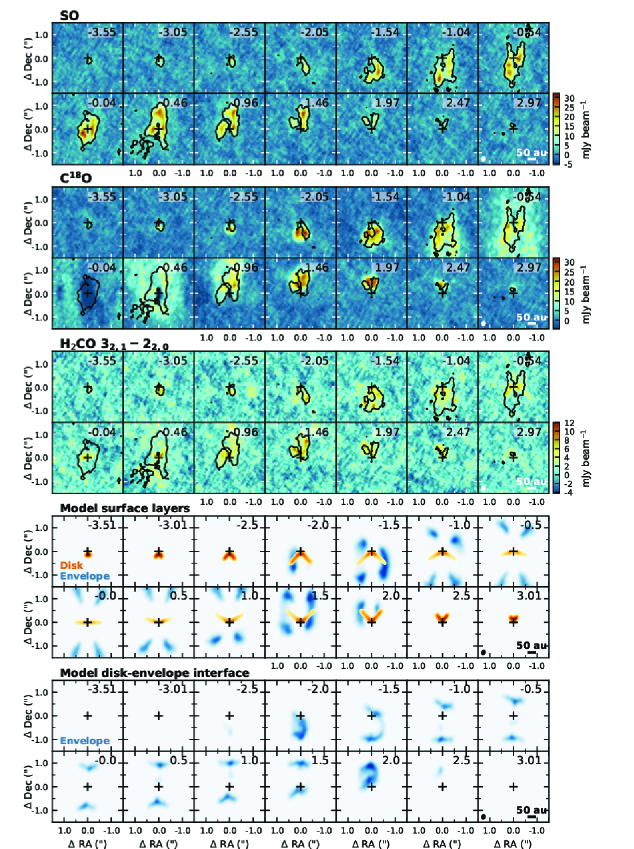
3.2.6 SO
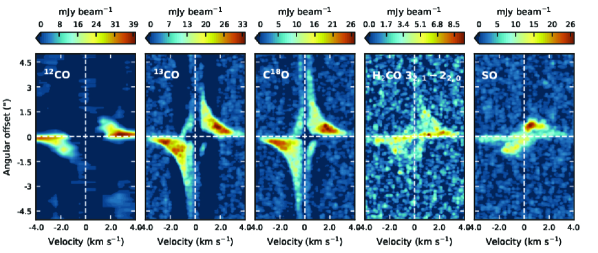
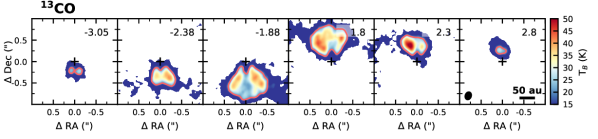
Emission from the SO transition ( = 35 K) is detected over a velocity range of 4.05 – 3.30 km s-1 (Fig. 26), and extends about 1′′ north and south of the source position in the integrated and peak intensity maps (Fig. 3). At low velocities (0.54 – 0.46 km s-1), weak more extended emission is visible (see Figs. 9 and 27). These narrow arc-like emission features extend predominantly towards the southwest and are blueshifted, but less extended (4′′) X-shaped emission is visible. This large scale emission overlaps with the surface layer of the envelope traced in C18O. However, the SO emission originates in a more narrow layer in individual velocity channels. Due to the rotating, infalling velocity profile of the envelope, emission from the surface layer has a slightly different spatial location at different velocities, resulting in the double layered feature in the southwest in the peak intensity map (Fig. 9, arrow in top right panel). The narrow SO emission feature visible in the southeastern outflow cavity in the peak intensity map (Fig. 9, arrow in bottom right panel) is not visible in the C18O map, but it is formed by small SO emission patches over a velocity range of 0.54 – 0.13 km s-1 that coincide with the outward moving emission front visible in 13CO and C18O channels (Figs. 22 and 21). Several more of such SO emission spots coinciding with the outflowing material traced in 13CO and C18O are visible at higher velocities and larger spatial offsets, especially in the western outflow cavity (Fig. 27).
The SO emission on 1′′ scales does not resemble the morphology of any of the other lines (Fig. 3). The north–south emission features east and west of the source position are more parallel to each other than the X-shape seen in H2CO and do not extend as far east–west as 13CO and C18O. In addition, the SO emission peaks directly east and west of the source in the integrated intensity map (with the west side being brighter), while 13CO and C18O clearly peak north and south of source with less emission originating directly to the east and west. From the pv-diagram (Fig. 6) it becomes clear that the redshifted emission is brighter than the blueshifted emission. Based on the channel maps (Fig. 10), this is most likely because there is redshifted emission present along the midplane at an offset of 1′′, while this is not the case at blueshifted velocities (e.g. 0.46 km s-1 versus -0.54 km s-1).
The velocity structure as shown in Fig. 3 deviates from pure Keplerian rotation with blueshifted velocities extending north of the source in the west and redshifted velocities extending south in the east. A similar pattern is seen for 13CO, C18O, c-C3H2, and H2CO and indicates the presence of envelope emission. The pv-diagrams (Fig. 6) show that this envelope component is less extended than for 13CO and C18O as the SO emission is confined to smaller angular offsets. The SO pv-diagram consists of two components, most clearly distinct at blueshifted velocities, that seem to anti-correlate with the C18O emission. The first component is a narrow feature at low spatial offsets ( 04) that extends over the entire detected velocity range. A similar, but stronger, feature is also visible for H2CO that originates predominantly in the disk surface layers, suggesting that this feature traces emission from the disk surface. The second feature is located at lower velocities ( 2 km s-1) and larger spatial offsets and is just offset from the region with bright C18O emission, suggesting that it originates in the inner envelope or outer disk.
To look at the spatial origin of the SO emission in more detail we present selected velocity channel maps in Fig. 10 (the full velocity range is presented in Fig. 26) and overlay the 3 contour of the SO emission on C18O and H2CO () channels. At high redshifted velocities (1.13 – 2.47 km s-1), the SO emission displays a V-shape resembling the H2CO emission and coinciding with the outermost layer of C18O emission. A similiar pattern is visible at blueshifted velocities (2.38 – 1.88 km s-1), although the emission is more asymmetric and dominated by the west side of the disk. This morphology is consistent with the conclusion drawn from the pv-diagrams that part of the SO emission originates in the disk surface layers.
At lower velocities the emission is predominantly located in two narrow bands extending north–south both east and west of source. Similar features are present in C18O channels on top of more extended emission. Only at low redshifted velocities (0.29 – 0.69 km s-1) SO emission is visible along the midplane between 05–10 north of source, coinciding with the low energy H2CO () transition. A model with emission originating solely in the surface layers of both the disk and envelope can explain the vertical emission bands at intermediate velocity offsets (e.g., 1.54 and 1.46 km s-1), but not at velocities close to the systemic velocity (Fig. 10). This could be because there is a disconnect at the disk–envelope interface between the velocity structure in a model with a pure Keplerian disk and CMU envelope. Figure 10 also shows results for a model with emission arising solely from the disk–envelope interface. In this scenario, the majority of the emission is expected along the major axis of the system, which does not resemble the observed emission morphology. Overall, the SO emission thus seems to originate in the disk and inner envelope, and in both components the emission seems to originate predominantly in the surface layers.
4 Analysis and discussion
4.1 Continuum sub-structures and inclination
The L1527 disk displays smooth, but asymmetric continuum emission, with the southern side brighter than the northern side along the major axis, and the eastern side brighter than the western side. The image does not show the clumps previously reported in 7 mm VLA images (Nakatani et al., 2020), consistent with more recent higher signal-to-noise VLA images at the same wavelength and spatial resolution (Sheehan et al., 2022).
The north–south asymmetry was previously observed at 7 mm and 1.3 cm with the VLA, and confirmed through analytic modeling (Sheehan et al., 2022). As discussed by those authors, determining the underlying physical nature of this asymmetry is difficult due to the edge-on nature of the disk, and could depend on where the emission at different wavelengths becomes optically thick. Detailed modeling of multi-wavelength data is therefore required to assess whether there is an enhancement in surface density in the southern part of the disk and if so, whether this is related to for example a vortex, spiral or pressure bump. The east–west asymmetry was not visible in the VLA data, even though they have comparable spatial resolution, potentially because at these longer wavelengths the vertical extent of the disk is smaller and the emission is less optically thick.
Both asymmetries were recently observed with ALMA in Band 7 (0.87 mm) and Band 3 (3.3 mm), although with the western side brighter in Band 3 (Ohashi et al., 2022b). The same Band 3 data was presented by Nakatani et al. (2020), but they show that the brightness temperature peaks slightly southeast of the source position. We therefore re-imaged the archival Band 3 data with the eDisk data reduction and imaging scripts, which results in an image with the eastern side brighter than the western side (Fig. 18), similar to the Band 6 and 7 images. For a near-edge on disk like L1527, the disk can either be orientated such that eastern side faces us, in which case the emission east of source traces the back side of the disk, that is, the half of the disk furthest away from us along our line of sight, or such that the western side faces us, in which case the emission west of source traces the back or far side of the disk (see e.g., Fig. 6 in Oya et al. 2015). An asymmetry along the minor axis of a near-edge on disk can be explained by a vertically extended optically thick dust disk. In this scenario, warmer material is observed toward the back side of the disk because the emission would get optically thick already in the colder outer disk on the near side (e.g., Ohashi et al. 2022b and Fig. 3 therein, Lin et al. subm., Takakuwa et al. in prep.). The north–south asymmetry appears stronger at 3.3 mm, especially in the east, while the east–west asymmetry is less pronounced at longer wavelengths and only visible in the south. A stronger east–west asymmetry at shorter wavelengths hints that it is indeed due to optically thick emission, as the disk becomes less optically thick at longer wavelengths. However, the resolution of the Band 3 data is slightly lower than the here presented Band 6 data (0086 0043 versus 0056 0029) and detailed modeling of the continuum emission at multiple wavelengths in the visibility plane is required to confirm the origin of east–west asymmetry. Nonetheless, the images presented here suggest that the continuum presents a coherent picture at different ALMA wavelengths, implying that the eastern side is the back side of the disk under the assumption of optically thick emission.
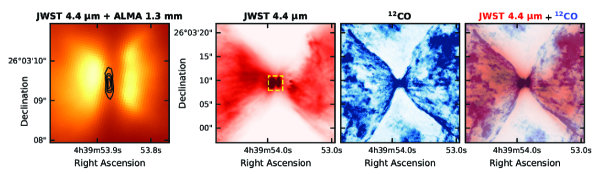
The brightness asymmetry of the disk previously observed in the Gemini L′ (3.8 m) scattered light image, with the eastern side nearly twice as bright as the western side, also suggests that the eastern side is the side facing us (Tobin et al., 2010). Deconvolution of the Spitzer IRAC image (3.6 m) results in the western side being brighter (Velusamy et al., 2014), but the brightness of the cavities in scattered light has been shown to be variable over time (Tobin et al., 2008; Cook et al., 2019). The recently released JWST NIRCam image (release id 2022-055, proposal id 2739, PI: K. Pontoppidan444https://webbtelescope.org/contents/news-releases/2022/news-2022-055) also suggests that the eastern side is facing us. The JWST 4.4 m image (Fig. 11) is consistent with the Gemini image555The ALMA continuum seems slightly rotated with respect to the JWST 4.4 m image and is not located in the center of the dark lane between the two bright regions east and west of the source position in the 4.4 m image. The JWST image aligns with the Spitzer IRAC image presented by Tobin et al. (2008) and there is no rotation evident based on the location of background stars. The east–west misalignment is not due to proper motion as L1527 is moving south, but the displacement is too small to rule out a systematic offset in the NIRCam image using the Spitzer image. and there is more short wavelength emission (2 m) in the eastern cavity, which indicates less extinction and hence that the eastern cavity is the blue-shifted outflow cavity.
The orientation inferred from the dust continuum and scattered light is at odds with the orientation derived from molecular line emission from the envelope (CS; Oya et al. 2015), which suggests that the western side is the back side. In this orientation, the blueshifted envelope emission is stronger in the southwest than in the southeast, while redshifted emission is stronger in the northeast than in the northwest. For a system with the eastern side being the back side, the blueshifted and redshifted envelope components would be strongest in the southeast and northwest, respectively. The velocity patterns of 13CO, C18O, c-C3H2, H2CO and SO observed here (Fig. 3) are consistent with the earlier CS observations and suggest that the western side of the envelope is the far side.
However, a small inclination toward the west, as suggested by the continuum observations, is consistent with the large scale (100′′) outflow observed in 12CO, which shows blueshifted emission predominantly toward the east and redshifted emission toward the west (Hogerheijde et al., 1998). Consistent with previous observations, on smaller scales as observed here, the 12CO emission displays both blueshifted and redshifted emission on both sides of the source, making it hard to infer the systems inclination. The potential blueshited jet feature in the west (Fig. 4), as well as the blueshifted SiO emission in the west (Fig. 7), would suggest an orientation opposite of that based on the large scale outflow. However, in the 12CO velocity channels, weak features are visible at high redshifted velocities in the extension of the potential jet.
Overall, the continuum emission on small scales (05), the scattered light images, and the large-scale 12CO outflow (100′′) suggest that the eastern side of the system is facing us, while molecular line emission on small scales (SiO jet) and intermediate scales (envelope) are consistent with the opposite orientation of the western side facing us. Differences in orientation based on outflowing material on small and large scales could be due to precession of the outflow, as discussed in more detail by Oya et al. (2015). The continuum asymmetry is observed at scales of 01, while the orientation derived from the line emission is based on envelope scales. This suggests that there is either a misalignment between the disk and the envelope, or a warp in the inner disk (Cook et al., 2019; Sakai et al., 2019). A detailed analysis of the molecular line emission on disk-scales may be able to help constrain the system’s orientation. Moreover, an overlay of the 12CO outflow cavity on the JWST NIRCam 4.4 m image shows that the asymmetry in the scattered light cavity shapes is not reflected in the 12CO cavity walls, and may thus be the result of shadowing on the northwestern and southeastern cavity wall (Fig.11). A comprehensive study including the molecular line emission, the multi-wavelength continuum emission, and the scattered light images is therefore required to fully unravel the structure of the system.
| Double power law | Inner power law fixed ( = 0.5) | ||||||
|---|---|---|---|---|---|---|---|
| Method | a | b | c | d | c | d | e |
| (km s-1) | (au) | (au) | () | ||||
| 13CO edge | 5.955 0.005 | 0.43 0.02 | 0.89 0.03 | 114 4 | 0.89 0.02 | 125 3 | 0.53 0.02 |
| 13CO ridge | 6.024 0.006 | 0.63 0.01 | 1.57 0.08 | 131 3 | 1.25 0.03 | 100 2 | 0.29 0.01 |
| C18O edge | 5.958 0.006 | 0.47 0.03 | 0.86 0.04 | 102 6 | 0.86 0.02 | 109 5 | 0.49 0.03 |
| C18O ridge | 5.995 0.007 | 0.98 0.02 | 54 2 | 0.32 0.02 | |||
Notes. a Systemic velocity. b Power-law index of the inner power law. c Power-law index of the outer power law. d Transition radius between the inner and out power law. e Central mass.
4.2 Dynamical mass and disk radius
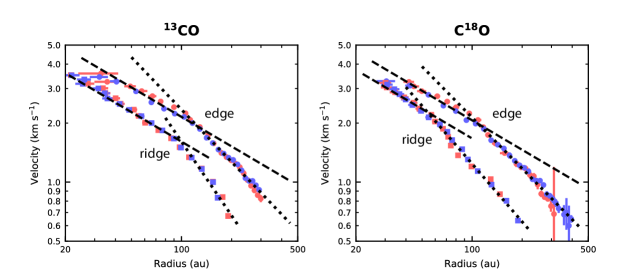
The stellar mass and disk radius can be derived by fitting a double power law to the rotation curve (e.g., Seifried et al., 2016; Aso & Machida, 2020; Maret et al., 2020). We use the publicly available Spectral Line Analysis/Modeling (SLAM) code666https://github.com/jinshisai/SLAM to extract the rotation curves from the 13CO and C18O pv-diagrams (Aso et al., 2015; Sai et al., 2020) and to do the fitting. The signal-to-noise ratio of the H2CO and SO emission is not high enough for this analysis and 12CO is dominated by outflow emission. Details of the methods employed by SLAM are described by Ohashi et al. (subm.), but the main steps are as follows.
First, the (position,velocity) coordinates are determined either for points tracing the outer edge (5 level) of the pv-diagram or for points tracing the peak of the emission (also called the “ridge” of the pv-diagram). Next, a double power law is fit to the (position,velocity) coordinates using the Markov Chain Monte Carlo (MCMC) algorithm implemented in the emcee package (Foreman-Mackey et al., 2013). For an infalling rotating envelope conserving angular momentum, the velocity is proportional to , while for a Keplerian disk, . In the latter case the stellar mass can be derived from , where is the velocity at the transition radius, , between disk and envelope velocity profiles. We first perform the fits with the systemic velocity and inner power-law index as free parameters and confirm that the power-law index for the inner region is indeed 0.5. We then fix the systemic velocity to the best-fit value and the inner power-law index to 0.5 to derive the dynamical stellar mass. The results are listed in Table 2 and the rotation curves are shown in Fig. 12.
The dynamical mass derived from the two isotopologues is consistent within 1-2, and is 0.3 using the ridge method and 0.5 using the edge method. This is higher than the 0.2 derived by Tobin et al. (2012) from 13CO and consistent with 0.45 derived by Aso et al. (2017) from C18O, who used the ridge method on lower resolution data. For the edge points, the transition radius found from 13CO and C18O is also consistent with each other within error bars, while the results from the ridge points are different for the two isotopologues and different from the edge point derived values. The reason is most likely that the ridge is not well defined at this high resolution (see the pv-diagrams in Fig. 6). The difference between 13CO and C18O for the ridge points could also be due to the difference in optical depth between the two isotopologues resulting in both isotopologues tracing a different layer. An average radius of 108 au from the edge points is only slightly larger than the radius derived from the C18O pv-diagram by Aso et al. (2017) (75 au). Tobin et al. (2012) derived a 125 au disk radius from multi-wavelength continuum modeling, but the 5 contour of the 1.3 mm image extends only out to 85 au. A detailed analysis of the continuum emission is required to better constrain the dust-disk size, but it seems not very different from the gas-disk size. Overall, the analysis for L1527 seems most robust using the edge method and suggests a stellar mass of 0.5 and a gas-disk radius of 110 au.
4.3 Temperature structure
4.3.1 The disk is too warm for CO freeze out
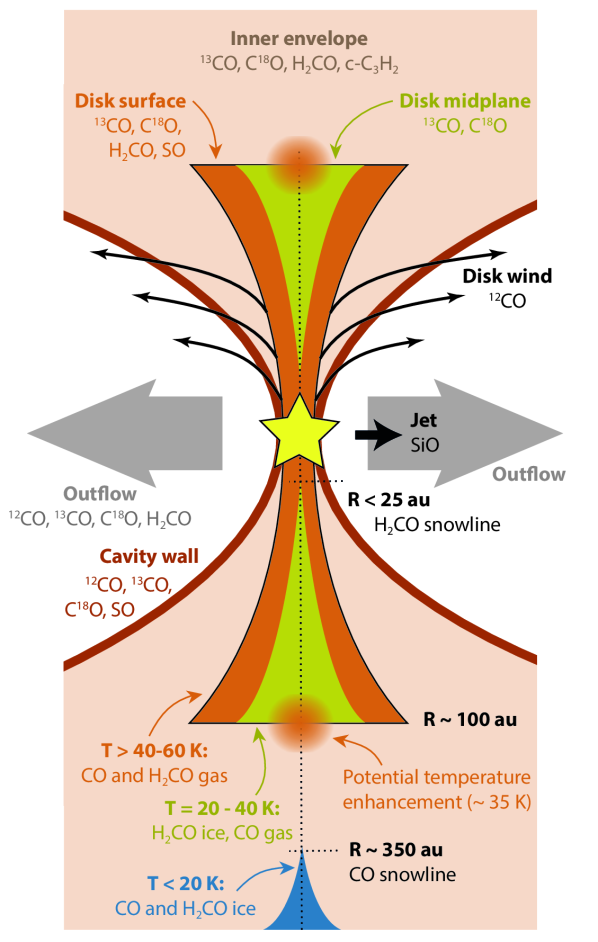
On scales of a few arcseconds, both 13CO and C18O display an X-shaped emission morphology (most clearly visible in the peak intensity maps in Fig. 4), with emission arising from the surface of the envelope along the outflow cavity wall out to larger radii than emission from the midplane. Along the midplane, the emission starts to disappear at offsets of 25 (350 au), suggesting that CO starts to freeze out. This is consistent with the analysis of 13CO, C18O and C17O by van ’t Hoff et al. (2018, 2020), which showed that CO was present in the gas phase throughout the entire disk (100 au), as well as with the temperature profile derived from modeling the multi-wavelength continuum emission by Tobin et al. (2013) in which the temperature drops below 20 K at a radius of 360 au.
A more detailed temperature structure can be obtained from the optically thick 13CO brightness temperature as presented in Fig. 13. For all channels with velocities km s-1 and with resolved emission, the brightness temperature is higher than 20 K, with temperatures increasing in the surface layers up to 50 K. The temperature in the radially and vertically most extended regions is 20 K, but this is likely due to the emission becoming optically thin (especially in the upper most surface layers) and beam dilution as this region typically fills only half of the beam. Beam dilution is also the reason why temperatures decrease at velocities km s-1, where the emission solely originates in the inner half of the disk. Based on the 13CO/C18O line ratio, the C18O emission is only optically thick in the midplane at angular offsets 05. Consequently, the midplane brightness temperatures are consistent with those for 13CO, while the brightness temperature in the surface layers is lower (30–35 K). These results are also in agreement with the disk midplane temperature profile derived by van ’t Hoff et al. (2018) from observations with lower resolution and sensitivity.
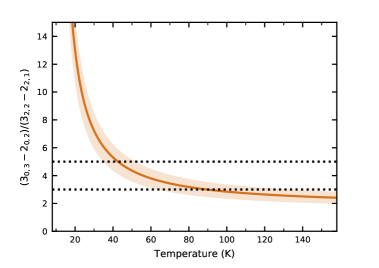
The temperature structure can also be assessed using H2CO. The resolution is high enough to spatially resolve a decrease in H2CO toward the midplane, as observed before for the edge-on young disk IRAS 04302 (Podio et al., 2020; van ’t Hoff et al., 2020). Assuming this is due to freeze out, the base of the V-shape provides an estimate of the H2CO snowline at 70 K (Noble et al., 2012; Fedoseev et al., 2015). The tip of the V is unresolved, suggesting that the snowline is at a radius less than 24 au. In addition, the ratios of H2CO lines are good probes of temperature (e.g., Mangum & Wootten, 1993). Fig. 14 (top row) presents the / line ratio per channel, and shows that the ratio is 3 in all pixels with a detection of the weaker transition.
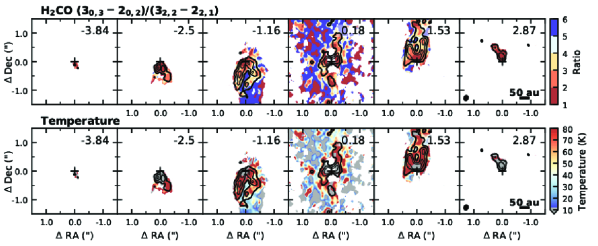
The / ratio as observed here is particularly sensitive to temperatures 90 K (see Fig. 28). For optically thin emission in Local Thermodynamic Equilibrium (LTE), the ratio drops from 20 to 5 for temperatures between 20 and 40 K. Around 90 K the ratio has dropped to 3, and the ratio remains higher than 2 for temperatures up to 300 K. If the emission is optically thick, the ratio drops below 2. The observed line ratio is , except in the inner 03, where the emission thus becomes optically thick. A conservative estimate of the uncertainty on the line ratio in the optically thin regions (ratio 2) with a detection of the transition is then 18% when propagating the individual rms noise levels of the observations. This means that for line ratios of 3, the temperature is at least 60 K, but the upper limit is not well constrained. As can be seen from Fig. 14, the temperature in the regions where both H2CO lines are detected is then at least 60 K. At velocity offsets of 1.16 and 1.53 km s-1, no emission is detected from the midplane and the ratio becomes 4, suggesting temperatures below 40 K. In the inner envelope midplane where both transitions are detected (angular offsets of 075-10) temperatures of at least 60 K are found. A similar temperature was derived in this region from a non-LTE large-velocity-gradient (LVG) analysis of SO by Ohashi et al. (2014); Sakai et al. (2014b).
The temperatures derived from the H2CO line ratio are 10–20 K higher than the 13CO brightness temperature. This difference is likely caused by two dominant effects. First, the brightness temperature from 13CO traces the radius where the emission gets optically thick. This is not necessarily the same as the observed angular offset, which means that colder material further out may be projected closer to the star. Second, the brightness temperature of the 13CO emission gets smeared out over the size of the beam, while the effects of beam dilution cancel out for the H2CO line ratio. Since both effects work to lower the observed brightness temperature of 13CO, the physical temperature is likely closer to that measured with H2CO. In addition, while the brightness temperature of the continuum drops steeply at radii 03, continuum subtraction may have lowered the 13CO brightness temperature a little. A higher midplane temperature than derived from the 13CO brightness temperature would be consistent with the analysis by van ’t Hoff et al. (2018) that showed that the temperature profile as derived by Tobin et al. (2013) from the multi-wavelength continuum emission needed to be increased by at least 30% to reproduce the observations. Such a warm temperature profile was also adopted by Aso et al. (2017) for analysis of C18O observations of L1527.
Finally, if the dust is optically thick, as suggested by the brightness asymmetry along the minor axis, the continuum brightness temperature provides a third temperature probe. The continuum brightness temperature is 40 K out to 25 au, after which it steeply drops to temperatures below 20 K (Fig. 2), probably because the emission becomes optically thin. A midplane temperature of 40 K at 25 au is consistent with the 13CO brightness temperatures at larger radii and the temperature profile derived by van ’t Hoff et al. (2018). However, the continuum brightness temperature suffers from the same effects as the 13CO brightness temperature, so it may also underestimate the real temperature. Overall, all results point to the L1527 disk being warm, with midplane temperatures too high for CO freeze out throughout the disk (20–40 K), but low enough for H2CO freeze out outside 24 au.
Moreover, the similarity between the temperature derived from the continuum and the molecular lines suggests that the grains do not scatter efficiently, as this would decrease the brightness temperature (Birnstiel et al., 2018). Since grains only scatter appreciably when the size of the grain is comparable to the observing wavelength, this suggests that L1527 mainly contains grains much smaller than 1 mm. The lack of large grains is consistent with the vertical extent of the dust disk which indicates that the grains have not yet settled.
4.3.2 A potential temperature enhancement around the disk–envelope interface
At intermediate redshifted velocities (e.g., the 1.8 km s-1 channel shown in Fig. 13), the 13CO brightness temperature increases from 25 K to 35 K at angular offsets 05 (1 = 2 K). A similar effect is derived from the H2CO line ratio, but at both redshifted and blueshifted velocities. This suggests that there may be an increase in temperature around the disk–envelope interface. Such a rise was invoked by Sakai et al. (2014b) based on SO observations. Temperatures of 60 K and 200 K were derived from SO emission at angular offsets between 06–10 (Ohashi et al. 2014; Sakai et al. 2014b, 2017, resp.), but these studies did not have high enough spatial resolution and signal-to-noise ratio to derive a temperature at smaller offsets. However, there is no increase in 13CO brightness temperature at blueshifted velocities, so several factors have to be taken into account before a temperature enhancement can be concluded from the observations presented here.
Relating the brightness temperature observed at a certain position in a certain velocity channel to a physical location is non-trivial, because it depends on where in the system the emission becomes optically thick (see e.g., Fig. 6 in van ’t Hoff et al. 2018). For example, if the emission along a line of sight close to the protostar becomes optically thick in the outer envelope, the brightness temperature at a small angular offset will reflect the temperature in the cold outer envelope instead of in the warm disk. Since redshifted emission originates in the rotating-infalling envelope in front of the disk, and blueshifted emission in the envelope behind the disk, a comparison between redshifted and blueshifted velocity channels can help constrain the origin of the emission. If the emission becomes optically thick in the disk, the redshifted and blueshifted channels should be similar. However, this is inconsistent with the observations. The two simplest possible scenarios are then that either the 13CO emission is just optically thick ( 1), or that the 13CO is very optically thick (1).
The first scenario ( 1) could explain the observations if the 13CO emission becomes optically thick in the envelope behind the disk at blueshifted velocities, and in the disk at redshifted emission. In other words, if the disk itself does not contain enough CO to make the emission optically thick. The observations would then suggest that the envelope midplane (seen at blueshifted velocities) is colder than the outer disk midplane (seen at redshifted velocities). A potential issue with this scenario is that it may not be able to reproduce the (marginally) optically thick C18O emission.
The second scenario (1) may explain the observations if the 13CO emission already becomes optically thick in the envelope at redshifted velocities and in the disk at blueshifted velocities. In this case there is enough material in both the envelope and the disk to make the emission optically thick. This would then suggest that the disk midplane (seen at blueshifted velocities) is colder than the inner envelope (seen at redshifted velocities). If the C18O emission does not become optically thick yet in the envelope (at redshifted velocities), this temperature increase would not be visible in C18O, consistent with the observations. A potential inconsistency is that you would expect to observe warm emission from the inner envelope at angular offsets larger than the extent of the disk at both blueshifted and redshifted velocities. The fact that this is not observed, suggests then that either the temperature or the optical depth drops quickly in the inner envelope. However, a rapid decrease in temperature is inconsistent with the temperature derived from H2CO, which shows 60 K out to 11–14 (150–200 au projected from the source), and a rapid decrease in optical depth is inconsistent with the observed 13CO/C18O line ratio, which suggests 13CO is optically thick out to 11–14 as well.
An alternative explanation for the 13CO observations is that there is a north–south asymmetry in the temperature, but this would be opposite to the north–south asymmetry observed for the continuum emission and not clearly visible in H2CO. In conclusion, both the 13CO and H2CO show potential evidence of an increase in the temperature in the outer disk and/or inner envelope. However, observations of H2CO at higher spectral resolution and for higher energy transitions are required to better constrain the temperature. Moreover, detailed radiative transfer modeling is required to derive a temperature structure for the disk and envelope from the observed emission and to confirm whether an increase in temperature occurs at the disk–envelope interface.
4.4 Molecular structure
A cartoon illustrating which components of the L1527 protostellar system are traced by which molecules is presented in Fig. 15. Outflowing material is visible in 12CO, 13CO, C18O, and H2CO with 12CO tracing the highest velocity gas. A blueshifted jet is visible in the western outflow cavity in SiO and potentially 12CO. The SiO jet is compact and located close to the protostar (peak position is 008 offset from source), while the 12CO jet is further away from the source (3–6′′) and extended in the east–west direction. The outflow cavity wall is clearly outlined in 12CO, but also faintly in 13CO (at small scales), C18O and SO. The large scale envelope is visible in c-C3H2 and weakly in DCN. Emission from the inner envelope is most strongly visible in 13CO. In addition, while weak envelope emission is seen in H2CO , all H2CO transitions display bright emission in the inner envelope midplane. The disk is traced by 13CO, C18O and H2CO, where H2CO only originates in the disk surface layers. SO also traces surface layers in the disk and inner envelope, that is, in layers along the outflow cavity wall. The physical and/or chemical reason behind the different emission morphologies is further discussed in the following sections.
4.4.1 Outflowing material
All three CO isotopologues display a moving front of emission in the outflow cavity with material at higher velocities located further away from the star (marked with dotted lines in the channel maps in Figs. 20-22). This is in agreement with both a jet/bow shock driven outflow as well as a wind-driven outflow (e.g., Lee et al., 2000; Arce et al., 2007, and references therein). The velocity maps in Fig. 3 show that the 12CO emission has higher velocities along the outflow cavity walls close to source (1′′) compared to the disk emission traced by 13CO and C18O, suggesting that there may be a disk wind in this system. The velocity structure can be shown more clearly in pv-diagrams obtained parallel to the disk minor axis at different offsets along the major axis, that is, north and south of the source position (Fig. 16). 13CO and C18O show Keplerian emission on one side of the diagram and a low-velocity contribution from the envelope in the other half. In contrast, 12CO shows extended emission in all four quadrants but peaks near the 13CO and C18O disk emission. However, the bright 12CO emission has velocities higher than the expected Keplerian velocity. The fainter extended 12CO emission may be explained by material moving away in a conical or parabolic shape. Because the outflow is in the plane of the sky, the near side of this shell would move toward us and the far side would move away from us, resulting in both redshifted and blueshifted emission. This poloidal expansion coupled with the super-Keplerian rotation suggests that 12CO may trace a rotating, expanding disk wind. A more detailed analysis is left for future work.
The outward moving front is present in both outflow cavities for 13CO and C18O, while 12CO only shows this in the eastern cavity (Figs. 20-22, but outside of the angular range shown in the pv-diagrams in Fig. 16). Instead, there is an indication of a blueshifted 12CO jet 3–6′′ ( 400–800 au) off source (Figs. 4 and 20). However, the velocity is lower than the velocity of the SiO jet closer to source ( 11 au). 12CO emission has been observed before with CARMA (3′′ resolution) and ALMA (08 resolution) in the transition (Flores-Rivera et al., 2021), which displays a similar outflow morphology as the transition presented here. Flores-Rivera et al. (2021) referred to the narrow ‘neck’ between the two outflow cavities (see Figs. 3, 11, 20, fourth row) as a jet extending out to 75 au. However, the channel maps in Fig. 20 (fourth row) suggest a widening of the outflow opening angle with the north-south extension (making up the ‘neck’) originating from emission cospatial with the disk and/or inner envelope (potentially tracing a wind) with redshifted emission north of the source and blueshifted emission south of the source. At larger scales (Fig. 20), there is a hint of a redshifted jet-like emission feature along the line of the blueshifted jet at larger offsets (8–12′′). This may signal that the jet has precessed. Precession may also explain the kinks seen in the outflow cavity walls (marked by white arrows in Fig. 4). Alternatively, this could be due to widening of the outflow opening angle over time, or due to inhomogeneity of the surrounding medium.
4.4.2 Disk versus envelope
Studying whether changes occur in the composition of the volatile material as it transitions from the envelope to the disk is crucial for understanding the origin of chemical complexity in planet-forming material. Moreover, identifying molecular species or transitions that exclusively trace the disk environment would aid in identifying and studying the conditions in young disks. In recent years, chemical changes across the disk–envelope interface have been observed for multiple sources (e.g., L1527, L1489, IRAS 16293 A, IRAS 16293 B, IRAS 15398; Sakai et al. 2014b; Yen et al. 2014; Oya et al. 2016, 2018; Okoda et al. 2018, resp.), but so far no molecule or transition has been uniformly identified that reliably traces the disk or the disk–envelope interface.
In the observations presented here, c-C3H2 emission originates solely in the envelope. The c-C3H2 observations are consistent with previous ALMA observations of different transitions (Sakai et al., 2014b) and the distribution of C2H (Sakai et al., 2014a). These hydrocarbons are often associated with UV irradiation and therefore typically observed in photo-dissociation regions (PDRs; e.g., van der Wiel et al. 2009; Guzmán et al. 2015) and along outflow cavity walls, especially in Class 0 sources (e.g., Murillo et al., 2018; Tychoniec et al., 2021). At the spectral resolution of 1.34 km s-1, strong c-C3H2 emission is only detected in three 1.34 km s-1 velocity channels (1.16 - 1.53 km s-1), but weak (3) emission is detected at 2.5 km s-1 for the blended and transitions, which is at a higher velocity offset than detected before (2.2 km s-1; Sakai et al. 2014b). Higher spectral resolution observations are required to constrain the distribution in the envelope, and higher sensitivity observations are needed to establish whether c-C3H2 is really absent in the disk. The presence or absence of c-C3H2 in the disk is interesting as bright hydrocarbon emission in Class II protoplanetary disks is associated with high C/O ratios ( 1; Bergin et al. 2016; Miotello et al. 2019). A comparison between embedded and mature disks could thus provide information about the chemical evolution during the disk stage.
The H2CO transitions observed here predominantly originate in the disk surface layers, where the temperature as determined from the line ratio is 60 K. The higher energy transitions ( and ) are not detected in the midplane, while weak emission from the lower energy transition () is present. The flux is expected to increase at lower temperatures (for a given column density), so this is not an excitation effect. The observed distribution could instead be due to freeze out of H2CO in the midplane as the freeze-out temperature is 70 K (Noble et al., 2012; Fedoseev et al., 2015). A low residual midplane abundance could be due to gas-phase formation of H2CO or nonthermal desorption (e.g., Aikawa et al., 2002; Loomis et al., 2015; Öberg et al., 2017; Terwisscha van Scheltinga et al., 2021). Alternatively, the emission along the midplane originates in the envelope that is visible between the disk surface layers. These results substantiate the analysis of the temperature profile of the young disk IRAS 04302 based on a similar V-shaped emission pattern of one H2CO transition toward that source (van ’t Hoff et al., 2020). The increase in H2CO intensity in the inner envelope (or outer disk, as detailed modeling is required to determine the exact location) could then be due to a lower freeze-out temperature at lower densities or an increase in temperature at the disk–envelope interface (as discussed in Sect. 4.3.2).
SO has been suggested to be enhanced at the centrifugal barrier in L1527, due to elevated temperatures in this region caused by an accretion shock (e.g., Sakai et al., 2014b, 2017). While the concept of a centrifugal barrier is not supported by hydrodynamic simulations, the physics and dynamics at the disk–envelope interface are complex (Jones et al., 2022; Shariff et al., 2022), and models show that SO can be enhanced if a shock occurs (Aota et al., 2015; Miura et al., 2017; van Gelder et al., 2021). Consistent with previous observations, SO emission is strong at scales 1′′, and in the region of the pv-diagram consistent with the outer disk and/or inner envelope. However, a careful examination of the individual velocity channels suggests that the emission is coming from surface layers of the envelope (i.e., along the cavity wall) rather than the midplane. This is, for example, clearly visible at 1.54 km s-1, where H2CO displays emission from the disk surface layers and the envelope midplane, while the SO emission surrounds the H2CO envelope midplane emission (Fig. 10, but see also Fig. 8). The SO emission pattern is also inconsistent with a simple model with emission from the inner envelope (Fig. 10, fifth set of panels), and shows better agreement with a model where the emission solely originates in the surface layers of the disk and envelope (Fig. 10, fourth set of panels).
Based on the H2CO line ratio, the temperature in the disk surface layers is 60 K, so the origin of the SO emission could be thermal sublimation of SO ice as the freeze out temperature of SO is 40–60 K (Hasegawa & Herbst, 1993; Garrod & Herbst, 2006). Thermal sublimation may also explain why there is some SO emission present along the midplane at 07 at low redshifted velocities (0.46-0.96 km s-1), as the 13CO brightness temperature is increased in this region. However, the increase in 13CO brightness temperature is visible at higher velocities (1.8 km s-1; Fig. 13), while there is no SO emission along the midplane at those velocities. Alternatively, SO may trace UV irradiated environments, either because of UV heating of the gas causing SO ice to desorb, or because its formation becomes possible in these regions through photodissociation of H2O. It is possible to form SO in shocks, which may occur at the disk–envelope interface and/or along the outflow cavity wall, but this still requires the presence of a UV field (van Gelder et al., 2021). If the distribution of SO is set by the UV field, this may naturally lead to an enhancement in the inner envelope as UV radiation may penetrate deeper into the envelope than into the disk. However, a detailed study is required as the disk could shadow parts of the inner envelope. An SO distribution along the outflow cavity wall was also inferred for the embedded disk TMC1A (Harsono et al., 2021). Observations of multiple SO transitions are needed to derive the temperature of the emitting gas and detailed modeling will be required to fully constrain the spatial and physical/chemical origin of the SO emission.
5 Conclusions
We have presented high resolution (006–017 or 8–24 au) ALMA observations (taken as part of the Large Program eDisk) of the 1.3 mm continuum and molecular line emission toward the Class 0 protostar L1527, and provided a qualitative description of the different emission morphologies and their potential underlying physical and/or chemical conditions. The main conclusions are summarized below:
-
•
The continuum emission is smooth, but asymmetric along both the major (north–south) and minor axis (east–west), with emission being brighter in the south and east. The flaring nature of the disk and the comparable brightness temperature of the dust and 13CO emission suggest that the grains have not yet grown beyond 1 mm and settled to the midplane.
-
•
Although the disk is viewed nearly edge-on, there is evidence of misalignment between different components as the continuum asymmetry along the minor axis (on scales of 005) and the large-scale outflow (100′′) suggest that the east side of the system is the far side, while the SiO jet (01) and envelope emission (a few arcsec) suggest that the west side is the far side.
-
•
Different molecules trace different components of the protostellar system. Outflowing material is most clearly visible in 12CO, but also in 13CO, C18O and H2CO, while SiO traces a compact jet in the western outflow cavity. The outflow cavity wall is also visible in SO. Super-Keplerian 12CO emission in the inner 1′′ may trace a disk wind. c-C3H2 and DCN only show emission from the envelope, although higher sensitivity is required to rule out their presence in the disk. 13CO, C18O, H2CO and SO trace the disk and inner envelope, with H2CO emission arising predominantly in the disk surface layers. SO emission is dominated by the envelope surface along the outflow cavity wall and the disk component originates in the surface layers. This suggests that SO may be tracing UV irradiated regions.
-
•
Analysis of the pv-diagrams of 13CO and C18O results in a 100 au Keplerian rotating disk around a 0.5 star.
-
•
The disk is warm, with temperatures of 20–40 K throughout the midplane and 50–60 K in the surface layers. The disk is therefore too warm for CO freeze out, which occurs at a midplane radius of 350 au in the envelope, while H2CO is frozen out in the midplane down to 25 au.
-
•
The 13CO brightness temperature and H2CO line ratio suggest a potential temperature increase around the disk–envelope interface. However, this increase is only seen at redshifted velocities for 13CO and more detailed modeling is required to determine whether the higher temperature occurs in the outer disk or inner envelope, and whether it is associated with an accretion shock.
High resolution observations of multi-wavelength continuum and multiple molecular species are required to study young disks. Given the complex nature of molecular line emission from a disk–envelope system, these observations need to be combined with source-specific radiative transfer modeling to provide a detailed picture of the physical and chemical structure. The eDisk observations and the work presented here highlight the potential of such studies, and a comparison between the ALMA and JWST NIRCam images already shows the synergy between the two observatories.
References
- Aikawa et al. (2002) Aikawa, Y., van Zadelhoff, G. J., van Dishoeck, E. F., & Herbst, E. 2002, A&A, 386, 622, doi: 10.1051/0004-6361:20020037
- ALMA Partnership et al. (2015) ALMA Partnership, Brogan, C. L., Pérez, L. M., et al. 2015, ApJ, 808, L3, doi: 10.1088/2041-8205/808/1/L3
- Ansdell et al. (2016) Ansdell, M., Williams, J. P., van der Marel, N., et al. 2016, ApJ, 828, 46, doi: 10.3847/0004-637X/828/1/46
- Aota et al. (2015) Aota, T., Inoue, T., & Aikawa, Y. 2015, ApJ, 799, 141, doi: 10.1088/0004-637X/799/2/141
- Arce et al. (2007) Arce, H. G., Shepherd, D., Gueth, F., et al. 2007, in Protostars and Planets V, ed. B. Reipurth, D. Jewitt, & K. Keil, 245. https://arxiv.org/abs/astro-ph/0603071
- Aso & Machida (2020) Aso, Y., & Machida, M. N. 2020, ApJ, 905, 174, doi: 10.3847/1538-4357/abc6fc
- Aso et al. (2015) Aso, Y., Ohashi, N., Saigo, K., et al. 2015, ApJ, 812, 27, doi: 10.1088/0004-637X/812/1/27
- Aso et al. (2017) Aso, Y., Ohashi, N., Aikawa, Y., et al. 2017, ApJ, 849, 56, doi: 10.3847/1538-4357/aa8264
- Beckwith et al. (1990) Beckwith, S. V. W., Sargent, A. I., Chini, R. S., & Guesten, R. 1990, AJ, 99, 924, doi: 10.1086/115385
- Bergin et al. (2016) Bergin, E. A., Du, F., Cleeves, L. I., et al. 2016, ApJ, 831, 101, doi: 10.3847/0004-637X/831/1/101
- Birnstiel et al. (2018) Birnstiel, T., Dullemond, C. P., Zhu, Z., et al. 2018, ApJ, 869, L45, doi: 10.3847/2041-8213/aaf743
- Brinch & Hogerheijde (2010) Brinch, C., & Hogerheijde, M. R. 2010, A&A, 523, A25, doi: 10.1051/0004-6361/201015333
- Bryden et al. (1999) Bryden, G., Chen, X., Lin, D. N. C., Nelson, R. P., & Papaloizou, J. C. B. 1999, ApJ, 514, 344, doi: 10.1086/306917
- Caselli et al. (2002) Caselli, P., Benson, P. J., Myers, P. C., & Tafalla, M. 2002, ApJ, 572, 238, doi: 10.1086/340195
- Cassen & Moosman (1981) Cassen, P., & Moosman, A. 1981, Icarus, 48, 353, doi: 10.1016/0019-1035(81)90051-8
- Cook et al. (2019) Cook, B. T., Tobin, J. J., Skrutskie, M. F., & Nelson, M. J. 2019, A&A, 626, A51, doi: 10.1051/0004-6361/201935419
- Dong et al. (2018) Dong, R., Liu, S.-y., Eisner, J., et al. 2018, ApJ, 860, 124, doi: 10.3847/1538-4357/aac6cb
- Fedoseev et al. (2015) Fedoseev, G., Cuppen, H. M., Ioppolo, S., Lamberts, T., & Linnartz, H. 2015, MNRAS, 448, 1288, doi: 10.1093/mnras/stu2603
- Flores-Rivera et al. (2021) Flores-Rivera, L., Terebey, S., Willacy, K., et al. 2021, ApJ, 908, 108, doi: 10.3847/1538-4357/abd1db
- Foreman-Mackey et al. (2013) Foreman-Mackey, D., Hogg, D. W., Lang, D., & Goodman, J. 2013, PASP, 125, 306, doi: 10.1086/670067
- Galli et al. (2019) Galli, P. A. B., Loinard, L., Bouy, H., et al. 2019, A&A, 630, A137, doi: 10.1051/0004-6361/201935928
- Garrod & Herbst (2006) Garrod, R. T., & Herbst, E. 2006, A&A, 457, 927, doi: 10.1051/0004-6361:20065560
- Guzmán et al. (2015) Guzmán, V. V., Pety, J., Goicoechea, J. R., et al. 2015, ApJ, 800, L33, doi: 10.1088/2041-8205/800/2/L33
- Harsono et al. (2018) Harsono, D., Bjerkeli, P., van der Wiel, M. H. D., et al. 2018, Nature Astronomy, 2, 646, doi: 10.1038/s41550-018-0497-x
- Harsono et al. (2021) Harsono, D., van der Wiel, M. H. D., Bjerkeli, P., et al. 2021, A&A, 646, A72, doi: 10.1051/0004-6361/202038697
- Hasegawa & Herbst (1993) Hasegawa, T. I., & Herbst, E. 1993, MNRAS, 263, 589, doi: 10.1093/mnras/263.3.589
- Hogerheijde et al. (1998) Hogerheijde, M. R., van Dishoeck, E. F., Blake, G. A., & van Langevelde, H. J. 1998, ApJ, 502, 315, doi: 10.1086/305885
- Jones et al. (2022) Jones, D. C., Lam, K. H., Li, Z.-Y., & Tu, Y. 2022, MNRAS, 517, 213, doi: 10.1093/mnras/stac1842
- Kataoka et al. (2016) Kataoka, A., Muto, T., Momose, M., Tsukagoshi, T., & Dullemond, C. P. 2016, ApJ, 820, 54, doi: 10.3847/0004-637X/820/1/54
- Kataoka et al. (2015) Kataoka, A., Muto, T., Momose, M., et al. 2015, ApJ, 809, 78, doi: 10.1088/0004-637X/809/1/78
- Kenyon et al. (1994) Kenyon, S. J., Dobrzycka, D., & Hartmann, L. 1994, AJ, 108, 1872, doi: 10.1086/117200
- Kwon et al. (2009) Kwon, W., Looney, L. W., Mundy, L. G., Chiang, H.-F., & Kemball, A. J. 2009, ApJ, 696, 841, doi: 10.1088/0004-637X/696/1/841
- Lee et al. (2000) Lee, C.-F., Mundy, L. G., Reipurth, B., Ostriker, E. C., & Stone, J. M. 2000, ApJ, 542, 925, doi: 10.1086/317056
- Loinard et al. (2002) Loinard, L., Rodríguez, L. F., D’Alessio, P., Wilner, D. J., & Ho, P. T. P. 2002, ApJ, 581, L109, doi: 10.1086/345940
- Loomis et al. (2015) Loomis, R. A., Cleeves, L. I., Öberg, K. I., Guzman, V. V., & Andrews, S. M. 2015, ApJ, 809, L25, doi: 10.1088/2041-8205/809/2/L25
- Luhman (2018) Luhman, K. L. 2018, AJ, 156, 271, doi: 10.3847/1538-3881/aae831
- Mangum & Wootten (1993) Mangum, J. G., & Wootten, A. 1993, ApJS, 89, 123, doi: 10.1086/191841
- Maret et al. (2020) Maret, S., Maury, A. J., Belloche, A., et al. 2020, A&A, 635, A15, doi: 10.1051/0004-6361/201936798
- Miotello et al. (2019) Miotello, A., Facchini, S., van Dishoeck, E. F., et al. 2019, A&A, 631, A69, doi: 10.1051/0004-6361/201935441
- Miura et al. (2017) Miura, H., Yamamoto, T., Nomura, H., et al. 2017, ApJ, 839, 47, doi: 10.3847/1538-4357/aa67df
- Murillo et al. (2018) Murillo, N. M., van Dishoeck, E. F., van der Wiel, M. H. D., et al. 2018, A&A, 617, A120, doi: 10.1051/0004-6361/201731724
- Nakatani et al. (2020) Nakatani, R., Liu, H. B., Ohashi, S., et al. 2020, ApJ, 895, L2, doi: 10.3847/2041-8213/ab8eaa
- Noble et al. (2012) Noble, J. A., Theule, P., Mispelaer, F., et al. 2012, A&A, 543, A5, doi: 10.1051/0004-6361/201219437
- Öberg et al. (2017) Öberg, K. I., Guzmán, V. V., Merchantz, C. J., et al. 2017, ApJ, 839, 43, doi: 10.3847/1538-4357/aa689a
- Ohashi et al. (1997) Ohashi, N., Hayashi, M., Ho, P. T. P., & Momose, M. 1997, ApJ, 475, 211, doi: 10.1086/303533
- Ohashi et al. (2022a) Ohashi, N., Jørgensen, J., Tobin, J., & eDisk team. 2022a, ApJ
- Ohashi et al. (2014) Ohashi, N., Saigo, K., Aso, Y., et al. 2014, ApJ, 796, 131, doi: 10.1088/0004-637X/796/2/131
- Ohashi et al. (2022b) Ohashi, S., Nakatani, R., Liu, H. B., et al. 2022b, ApJ, 934, 163, doi: 10.3847/1538-4357/ac794e
- Okoda et al. (2018) Okoda, Y., Oya, Y., Sakai, N., et al. 2018, ApJ, 864, L25, doi: 10.3847/2041-8213/aad8ba
- Oya et al. (2015) Oya, Y., Sakai, N., Lefloch, B., et al. 2015, ApJ, 812, 59, doi: 10.1088/0004-637X/812/1/59
- Oya et al. (2016) Oya, Y., Sakai, N., López-Sepulcre, A., et al. 2016, ApJ, 824, 88, doi: 10.3847/0004-637X/824/2/88
- Oya et al. (2018) Oya, Y., Moriwaki, K., Onishi, S., et al. 2018, ApJ, 854, 96, doi: 10.3847/1538-4357/aaa6c7
- Podio et al. (2020) Podio, L., Garufi, A., Codella, C., et al. 2020, A&A, 642, L7, doi: 10.1051/0004-6361/202038952
- Reipurth et al. (2004) Reipurth, B., Rodríguez, L. F., Anglada, G., & Bally, J. 2004, AJ, 127, 1736, doi: 10.1086/381062
- Roccatagliata et al. (2020) Roccatagliata, V., Franciosini, E., Sacco, G. G., Randich, S., & Sicilia-Aguilar, A. 2020, A&A, 638, A85, doi: 10.1051/0004-6361/201936401
- Rosenfeld et al. (2013) Rosenfeld, K. A., Andrews, S. M., Hughes, A. M., Wilner, D. J., & Qi, C. 2013, ApJ, 774, 16, doi: 10.1088/0004-637X/774/1/16
- Sai et al. (2020) Sai, J., Ohashi, N., Saigo, K., et al. 2020, ApJ, 893, 51, doi: 10.3847/1538-4357/ab8065
- Sakai et al. (2019) Sakai, N., Hanawa, T., Zhang, Y., et al. 2019, Nature, 565, 206, doi: 10.1038/s41586-018-0819-2
- Sakai et al. (2014a) Sakai, N., Oya, Y., Sakai, T., et al. 2014a, ApJ, 791, L38, doi: 10.1088/2041-8205/791/2/L38
- Sakai et al. (2014b) Sakai, N., Sakai, T., Hirota, T., et al. 2014b, Nature, 507, 78, doi: 10.1038/nature13000
- Sakai et al. (2017) Sakai, N., Oya, Y., Higuchi, A. E., et al. 2017, MNRAS, 467, L76, doi: 10.1093/mnrasl/slx002
- Segura-Cox et al. (2020) Segura-Cox, D. M., Schmiedeke, A., Pineda, J. E., et al. 2020, Nature, 586, 228, doi: 10.1038/s41586-020-2779-6
- Seifried et al. (2016) Seifried, D., Sánchez-Monge, Á., Walch, S., & Banerjee, R. 2016, MNRAS, 459, 1892, doi: 10.1093/mnras/stw785
- Shariff et al. (2022) Shariff, K., Gorti, U., & Melon Fuksman, J. D. 2022, MNRAS, 514, 5548, doi: 10.1093/mnras/stac1186
- Sheehan et al. (2020) Sheehan, P. D., Tobin, J. J., Federman, S., Megeath, S. T., & Looney, L. W. 2020, ApJ, 902, 141, doi: 10.3847/1538-4357/abbad5
- Sheehan et al. (2022) Sheehan, P. D., Tobin, J. J., Li, Z.-Y., et al. 2022, ApJ, 934, 95, doi: 10.3847/1538-4357/ac7a3b
- Shirley et al. (2011) Shirley, Y. L., Mason, B. S., Mangum, J. G., et al. 2011, AJ, 141, 39, doi: 10.1088/0004-6256/141/2/39
- Tamura et al. (1996) Tamura, M., Ohashi, N., Hirano, N., Itoh, Y., & Moriarty-Schieven, G. H. 1996, AJ, 112, 2076, doi: 10.1086/118164
- Teague & Foreman-Mackey (2018) Teague, R., & Foreman-Mackey, D. 2018, Research Notes of the American Astronomical Society, 2, 173, doi: 10.3847/2515-5172/aae265
- Terwisscha van Scheltinga et al. (2021) Terwisscha van Scheltinga, J., Hogerheijde, M. R., Cleeves, L. I., et al. 2021, ApJ, 906, 111, doi: 10.3847/1538-4357/abc9ba
- Tobin et al. (2008) Tobin, J. J., Hartmann, L., Calvet, N., & D’Alessio, P. 2008, ApJ, 679, 1364, doi: 10.1086/587683
- Tobin et al. (2012) Tobin, J. J., Hartmann, L., Chiang, H.-F., et al. 2012, Nature, 492, 83, doi: 10.1038/nature11610
- Tobin et al. (2013) —. 2013, ApJ, 771, 48, doi: 10.1088/0004-637X/771/1/48
- Tobin et al. (2010) Tobin, J. J., Hartmann, L., Looney, L. W., & Chiang, H.-F. 2010, ApJ, 712, 1010, doi: 10.1088/0004-637X/712/2/1010
- Tobin et al. (2011) Tobin, J. J., Hartmann, L., Chiang, H.-F., et al. 2011, ApJ, 740, 45, doi: 10.1088/0004-637X/740/1/45
- Tobin et al. (2020) Tobin, J. J., Sheehan, P. D., Megeath, S. T., et al. 2020, ApJ, 890, 130, doi: 10.3847/1538-4357/ab6f64
- Tychoniec et al. (2020) Tychoniec, Ł., Manara, C. F., Rosotti, G. P., et al. 2020, A&A, 640, A19, doi: 10.1051/0004-6361/202037851
- Tychoniec et al. (2021) Tychoniec, Ł., van Dishoeck, E. F., van’t Hoff, M. L. R., et al. 2021, A&A, 655, A65, doi: 10.1051/0004-6361/202140692
- Ulrich (1976) Ulrich, R. K. 1976, ApJ, 210, 377, doi: 10.1086/154840
- van der Wiel et al. (2009) van der Wiel, M. H. D., van der Tak, F. F. S., Ossenkopf, V., et al. 2009, A&A, 498, 161, doi: 10.1051/0004-6361/200811391
- van Gelder et al. (2021) van Gelder, M. L., Tabone, B., van Dishoeck, E. F., & Godard, B. 2021, A&A, 653, A159, doi: 10.1051/0004-6361/202141591
- van ’t Hoff et al. (2018) van ’t Hoff, M. L. R., Tobin, J. J., Harsono, D., & van Dishoeck, E. F. 2018, A&A, 615, A83, doi: 10.1051/0004-6361/201732313
- van ’t Hoff et al. (2020) van ’t Hoff, M. L. R., Harsono, D., Tobin, J. J., et al. 2020, ApJ, 901, 166, doi: 10.3847/1538-4357/abb1a2
- van ’t Hoff et al. (2022) van ’t Hoff, M. L. R., Harsono, D., van Gelder, M. L., et al. 2022, ApJ, 924, 5, doi: 10.3847/1538-4357/ac3080
- Velusamy et al. (2014) Velusamy, T., Langer, W. D., & Thompson, T. 2014, ApJ, 783, 6, doi: 10.1088/0004-637X/783/1/6
- Williams et al. (2019) Williams, J. P., Cieza, L., Hales, A., et al. 2019, ApJ, 875, L9, doi: 10.3847/2041-8213/ab1338
- Wilson & Rood (1994) Wilson, T. L., & Rood, R. 1994, ARA&A, 32, 191, doi: 10.1146/annurev.aa.32.090194.001203
- Yang et al. (2016) Yang, H., Li, Z.-Y., Looney, L. W., et al. 2016, MNRAS, 460, 4109, doi: 10.1093/mnras/stw1253
- Yen et al. (2014) Yen, H.-W., Takakuwa, S., Ohashi, N., et al. 2014, ApJ, 793, 1, doi: 10.1088/0004-637X/793/1/1
- Zhu et al. (2014) Zhu, Z., Stone, J. M., Rafikov, R. R., & Bai, X.-n. 2014, ApJ, 785, 122, doi: 10.1088/0004-637X/785/2/122
- Zucker et al. (2019) Zucker, C., Speagle, J. S., Schlafly, E. F., et al. 2019, ApJ, 879, 125, doi: 10.3847/1538-4357/ab2388
Appendix A Additional continuum images
Figure 17 presents an overview of the 1.3 mm continuum toward L1527 imaged with different robust parameters in addition to the image made with a robust value of 0.5 as presented in Fig. 2 (left panel). In addition, Fig. 18 presents a similar image for the 3.3 mm continuum image from archival ALMA data (2017.1.00509.S, PI: N. Sakai) as shown in Fig. 2 for 1.3 mm.
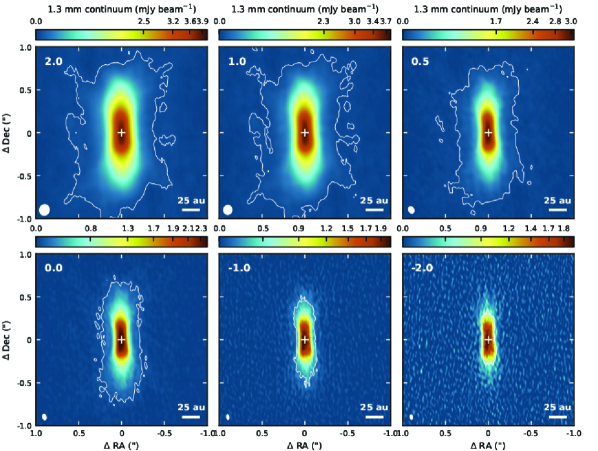
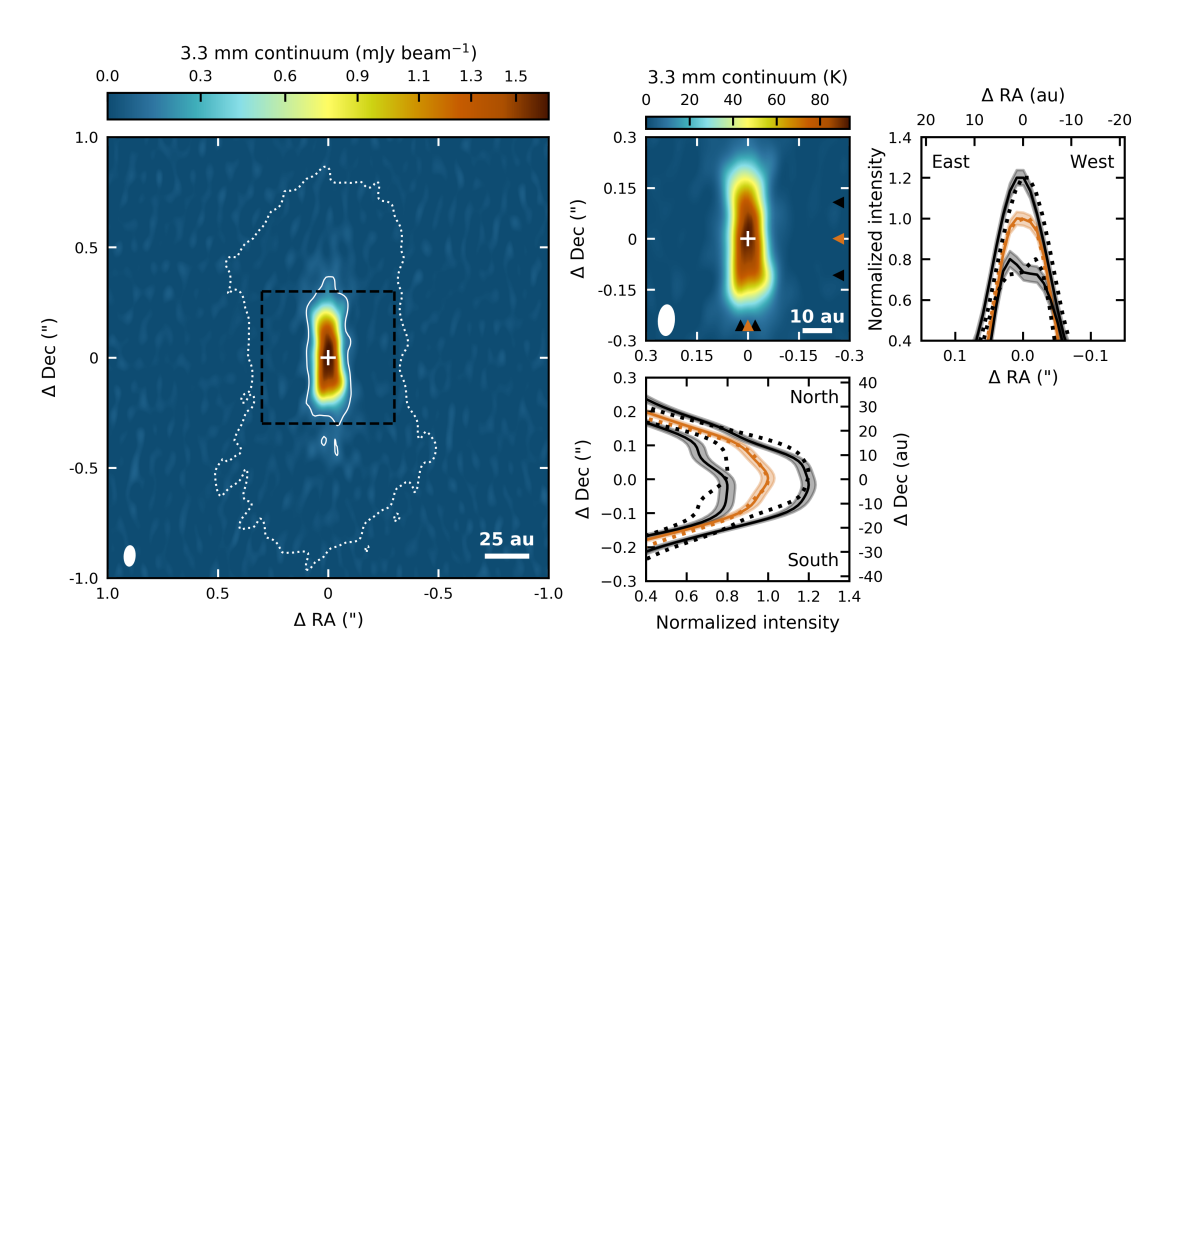
Appendix B Additional molecular line images
The individual 12CO, 13CO, and C18O channel maps used to make the RGB overlay (Fig. 5) are shown in Fig. 19. In addition, Figs. 20–22 present 12CO, 13CO, and C18O channel maps to highlight the outflowing material visible in the three CO isotopologues. Velocity channel maps for the c-C3H2 transitions are displayed in Fig. 23, for DCN in Fig. 24, for H2CO in Fig. 25, and for SO in Fig. 26. Figure 27 shows the SO moment eight (peak intensity) map.
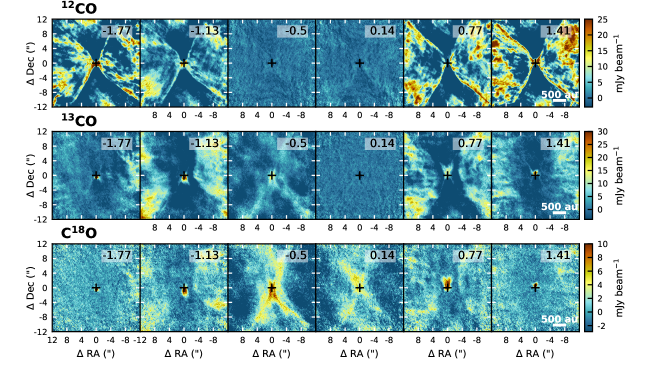
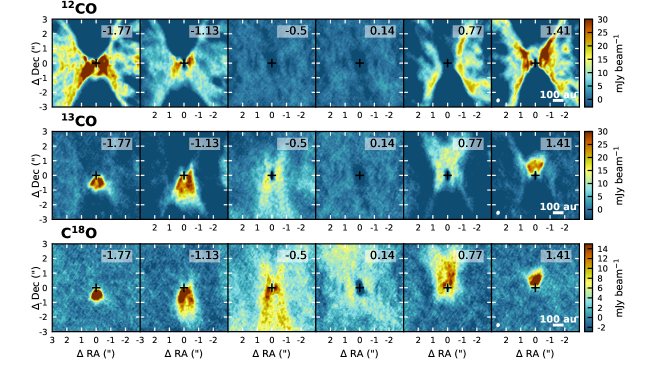
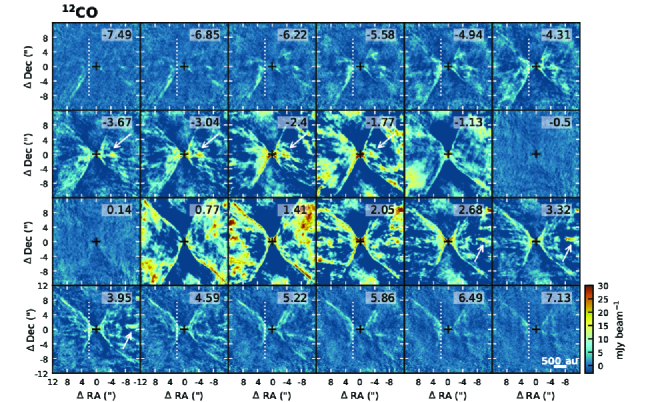
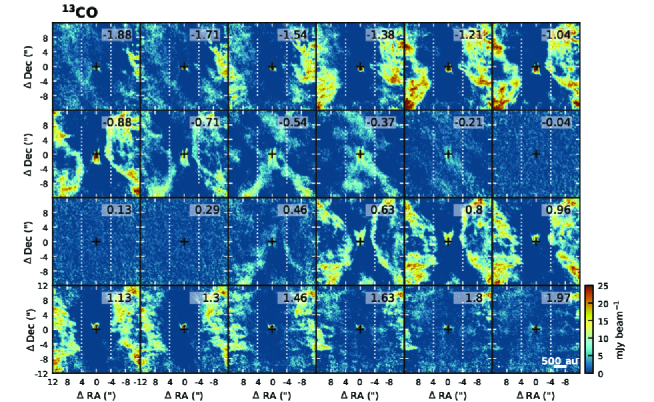
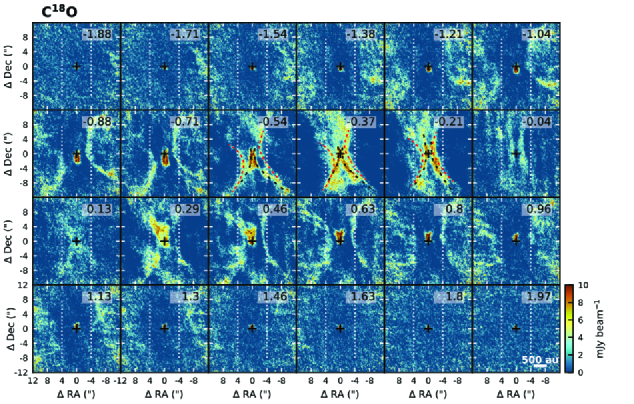
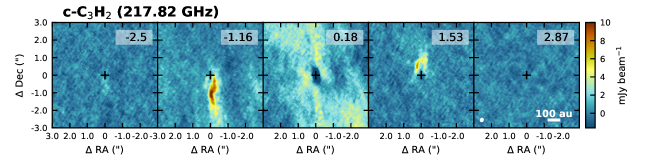
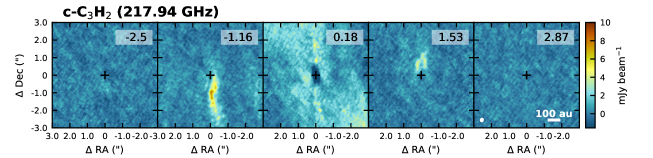
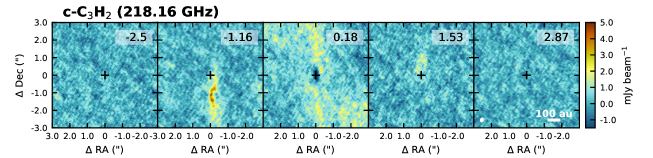
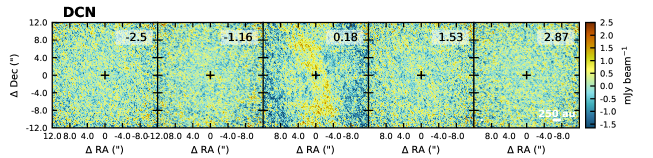
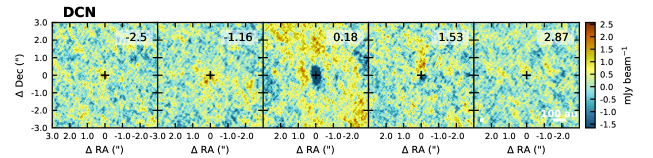
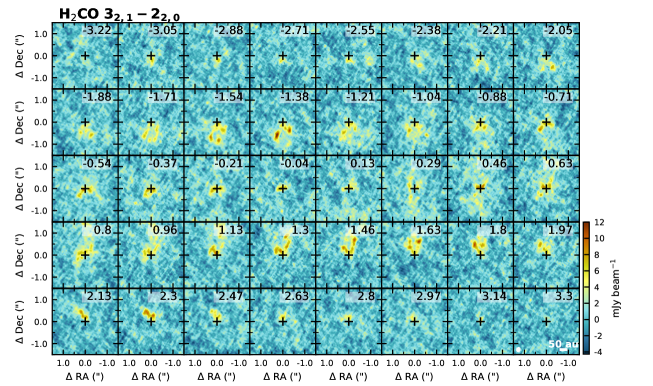
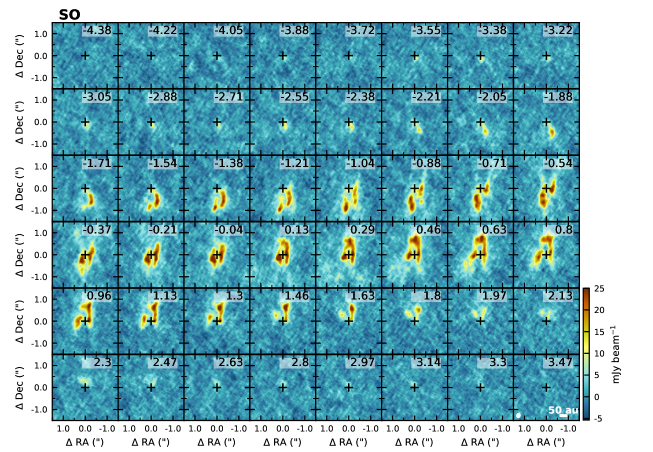
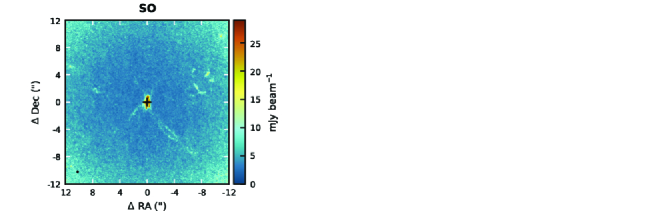
Appendix C Additional figures
Figure 28 presents the H2CO / line ratio as function of temperature for optically thin emission in LTE.