Early Planet Formation in Embedded Disks (eDisk). IV. The Ringed and Warped Structure of the Disk around the Class I Protostar L1489 IRS
Abstract
Constraining the physical and chemical structure of young embedded disks is crucial to understanding the earliest stages of planet formation. As part of the Early Planet Formation in Embedded Disks Atacama Large Millimeter/submillimeter Array Large Program, we present high spatial resolution (01 or 15 au) observations of the 1.3 mm continuum and 13CO 2–1, C18O 2–1, and SO – molecular lines toward the disk around the Class I protostar L1489 IRS. The continuum emission shows a ring-like structure at 56 au from the central protostar and a tenuous, optically thin emission extending beyond 300 au. The 13CO emission traces the warm disk surface, while the C18O emission originates from near the disk midplane. The coincidence of the radial emission peak of C18O with the dust ring may indicate a gap-ring structure in the gaseous disk as well. The SO emission shows a highly complex distribution, including a compact, prominent component at 30 au, which is likely to originate from thermally sublimated SO molecules. The compact SO emission also shows a velocity gradient along a slightly () tilted direction with respect to the major axis of the dust disk, which we interpret as an inner warped disk in addition to the warp around 200 au suggested by previous work. These warped structures may be formed by a planet or companion with an inclined orbit, or by a gradual change in the angular momentum axis during gas infall.
,
1 Introduction
Circumstellar disks are the birthplaces of planets. Constraining the structure of disks is thus essential for understanding the processes of planetary system formation. The physical and chemical structure of Class II disks has been studied in great detail through dust continuum and molecular line observations with the Atacama Large Millimeter/submillimeter Array (ALMA) (e.g., Andrews et al., 2018; Öberg et al., 2021). These studies have revealed that substructures such as rings and gaps are present in both dust and gas, suggesting that planet formation is ongoing in Class II disks. Furthermore, the presence of formed planets has recently become more apparent through the detection of velocity kinks in channel maps of bright molecular line emission (e.g., Pinte et al., 2018a; Teague et al., 2019), in addition to direct detections of circumplanetary disks within gaps (e.g., Keppler et al., 2018; Benisty et al., 2021; Bae et al., 2022).
The presence of substructures and planets in Class II disks suggests that planet formation could have started in the earlier evolutionary stages. It is thus essential to study what is happening in disks around younger Class 0/I protostars in order to obtain a complete picture of planet formation processes. Recent ALMA observations have revealed substructures in dust continuum emission in a handful of Class 0/I disks (e.g., ALMA Partnership et al., 2015; Sheehan & Eisner, 2018; Sheehan et al., 2020; Segura-Cox et al., 2020), suggesting that the first steps toward planet formation may be ocurring while these young disks are still embedded in their natal envelopes. Grain growth has also been suggested in embedded young disks (e.g., Harsono et al., 2018). In addition, recent surveys have shown that the mass of Class II disks is insufficient for giant planets to be formed, while Class 0/I disks are massive enough (e.g., Tychoniec et al., 2021).
Motivated by these previous studies, the Early Planet Formation in Embedded Disks (eDisk) ALMA Large Program (Ohashi et al., 2023) was initiated with the main goal of understanding how early substructures form in the disks around young protostars. The core of eDisk is a high-resolution systematic survey of the dust continuum substructures down to au scales in 19 young embedded sources. In addition to the dust continuum, several molecular lines, mainly CO isotopologue lines, have been observed to probe the gas distributions and kinematics in the embedded disks as well as in the envelopes.
One of the sources of the eDisk sample is the Class I protostar L1489 IRS (or IRAS 04016+2610), located in the Taurus molecular cloud. While several recent studies assume 140 pc as the distance to L1489 IRS (e.g., Sai et al., 2022; Mercimek et al., 2022) based on the average distance over the Taurus region (1417 pc; Zucker et al., 2019), Roccatagliata et al. (2020) estimate the distances to six different stellar population groups in the Taurus region using Gaia measurements. One of the groups (Taurus F in the original paper) with an estimated distance of 146 pc includes a nearby source to L1489 IRS (with a separation of ). Thus, in the present work we assume that the distance to L1489 IRS is 146 pc111We note that there is an independent estimate of the distance toward a neighboring molecular cloud L1498 of 129 pc (Zucker et al., 2020), which is significantly different from 146 pc adopted here.. Taking into account this distance, as well as the updated photometry from near-infrared to millimeter wavelengths, the bolometric luminosity and bolometric temperature are 3.4 and 213 K, respectively (Ohashi et al., 2023), from which L1489 IRS is classified as a Class I source.
L1489 IRS is embedded in a au scale infalling-rotating envelope as revealed by single-dish observations (Hogerheijde & Sandell, 2000; Motte & André, 2001). A bipolar outflow along the northwest-southeast direction is also identified by infrared and submillimeter line observations (Tamura et al., 1991; Hogerheijde et al., 1998). Brinch et al. (2007) first detected a rotation signature at – au scale using resolution HCO+ line observations with the Submillimeter Array (SMA), which was interpreted as a Keplerian disk. ALMA observations of 12CO and C18O (–) lines confirmed the presence of a Keplerian disk with a radius of – au and a central stellar mass of (Yen et al., 2014). Yen et al. (2014) also detected a streamer-like infalling flow feeding the material to the central protostellar disk with the C18O 2–1 emission. Higher-resolution () C18O line observations with ALMA revealed that the disk is warped at the boundary ( au) between the inner and outer disks (Sai et al., 2020). Dust continuum images obtained with ALMA (Yen et al., 2014; Sai et al., 2020) and the Combined Array for Research in Millimeter-wave Astronomy (CARMA; Sheehan & Eisner, 2017) also show a disk-like structure elongated along the northeast-southwest direction. Furthermore, Ohashi et al. (2022a) tentatively detect a ring-like structure at au in the 1.3 mm dust continuum emission, which may be a hint of dust growth, or even planet formation.
In this paper, we present high spatial resolution () observations of dust continuum and molecular lines toward the embedded disk around L1489 IRS as part of the eDisk ALMA Large Program. This paper is structured as follows. We describe the observational details in Section 2, and the observational results (image maps and radial profiles) in Section 3. Section 4 presents the analysis of the dust continuum and CO isotopologue line data to constrain the physical structures of the disk. The results are discussed in 5, and finally summarized in Section 6.
2 Observations and data reduction
L1489 IRS was observed as part of the eDisk Large Program (project code: 2019.1.00261.L, PI: N. Ohashi) and a dedicated Director’s Discretionary Time (DDT) program (project code: 2019.A.00034.S, PI: J. J. Tobin). Details of the observations and data reduction procedures are provided in Ohashi et al. (2023). Here we summarize the key aspects specific to L1489 IRS. Our observations were made in a total of five executions, two of which used extended antenna configurations (C43-8) from the Large Program, and the other three used compact antenna configurations (C43-5) from the DDT program. The two executions with extended antenna configurations were conducted in 2021 August, while the three executions with compact antenna configurations in the DDT program were conducted in 2021 December and 2022 July.
The eDisk program is designed to observe the dust continuum at 1.3 mm (or 225 GHz), as well as several molecular lines. The targeted molecular lines are listed in Table 2 of Ohashi et al. (2023). In this specific first-look paper on L1489 IRS, we focused on three molecular lines: 13CO 2–1, C18O 2–1, and SO 65–54. In addition to these lines, several other lines (12CO, DCN, H2CO, and -C3H2) are also detected, while SiO and CH3OH lines are not detected (see Table 2 in Ohashi et al. (2023) for the complete list of the targeted transitions).
The initial calibration was performed by the ALMA observatory using the standard ALMA calibration pipeline version 2021.2.0.128. We then carried out self-calibration using Common Astronomy Software Applications (CASA) version 6.2.1 (McMullin et al., 2007). Prior to self-calibration, we imaged the continuum data of each execution block separately. We then found an emission peak on each image and aligned the peaks to a common phase center using the CASA task fixvis and fixplanets. For the aligned visibilities, we applied an amplitude rescaling by inspecting the azimuthally averaged visibilities (amplitude profile against baseline length) from different executions to correct for possible flux calibration uncertainties (see Ohashi et al., 2023).
We then performed four iterations of phase-only self-calibration and then two iterations of phase and amplitude self-calibration on the compact configuration continuum data. The data were then combined with the extended configuration data and self-calibrated together. For the combined data, we performed two iterations of phase-only self-calibration and no phase+amplitude self-calibration. The self-calibration solutions were then applied to the line data. Finally, the line data were continuum-subtracted using the CASA task uvcontsub in the visibility domain.
For the continuum data, we CLEANed down to 2 the RMS noise level using different Briggs robust parameters as shown in Appendix A. The auto-multithresh algorithm implemented in CASA was used to generate the CLEAN masks. We adopted the image with robust as the representative image considering the balance between spatial resolution and sensitivity. The resulting beam size and RMS noise level of the continuum image are (PA ) and 14 µJy beam-1, respectively (Table 1). We note that the beam size of the representative image is a factor of 2 larger than the typical spatial resolution of other eDisk continuum images (005); because the continuum emission of the L1489 IRS disk is faint, we need to trade off spatial resolution for better sensitivity. Additionally, to clearly show the extended, faint emission, we made another continuum image with robust and uvtaper k, which has a beam size and RMS noise level are 02210179 (PA ) and 18 µJy beam-1, respectively (Table 1). For the line data, we CLEANed down to 3 the RMS noise level with robust (and uvtaper k as the default imaging parameter of eDisk line images, see Ohashi et al. 2023) for all lines presented in this paper. As in the case of continuum imaging, the auto-multithresh algorithm implemented in CASA was used to generate the CLEAN masks. The typical beam size and RMS noise level of the line images are 01 and 2 mJy beam-1 at a velocity channel width of 0.2 km s-1, respectively. We assume an absolute flux calibration uncertainty of 10%. The maximum recoverable scale is 222Based on the Equation 7.7 in https://almascience.nao.ac.jp/documents-and-tools/cycle8/alma-technical-handbook.. The detailed properties of the continuum image and line image cubes, as well as the corresponding spectroscopic data, are reported in Table 1333The self-calibration and imaging scripts for this source are available at https://github.com/jjtobin/edisk..
We note that there is an additional uncertainty in the intensity scale of the CLEANed images due to the “JvM effect” (Jorsater & van Moorsel, 1995; Czekala et al., 2021): the inconsistency of intensity units between the CLEANed model image and the residual image makes the intensity in the resulting CLEANed image incorrect (see Figure 3 in Czekala et al. 2021 for a comprehensive illustration). Czekala et al. (2021) introduced a method to correct for this effect (“JvM correction”). However, while the JvM correction recovers the correct intensity scales in the restored images, correcting the data in this way artificially manipulates the noise level by rescaling the residual image and may exaggerate the signal-to-noise ratio (S/N) (Casassus & Cárcamo, 2022). The modification of S/N could lead to the misinterpretation of the structure and extent of emission. Since we mainly focus on the morphology of the emission, we adopt the images without JvM correction. We exceptionally use the JvM-corrected image when we estimate the dust mass based on the flux density of the continuum emission in Section 3.1. Another exception is Section 4.1, where we compare the flux density estimated from the visibility analysis with that measured on the image plane, since the visibility analysis is not affected by the JvM effect.
| Frequency | ‡ | Spectral Resolution | Channel Width | Robust | Beam Size (PA) | RMS | |
|---|---|---|---|---|---|---|---|
| [GHz] | [K] | [km s-1] | [km s-1] | [mJy beam-1] | |||
| continuum | 225 | — | — | — | 1.0 | 01050078 (12) | 0.014 |
| continuum (tapered) | 225 | — | — | — | 2.0 | 02210179 (11) | 0.018 |
| 13CO 2–1 | 220.3986842‡ | 15.9 | 0.17 | 0.20 | 1.0 | 013011 (8.9) | 2.4 |
| C18O 2–1 | 219.5603541‡ | 15.8 | 0.17 | 0.20 | 1.0 | 013010 (13) | 1.7 |
| SO – | 219.9494420‡ | 35 | 0.17 | 0.20 | 1.0 | 013010 (15) | 2.1 |
3 Observational results
3.1 1.3 mm continuum
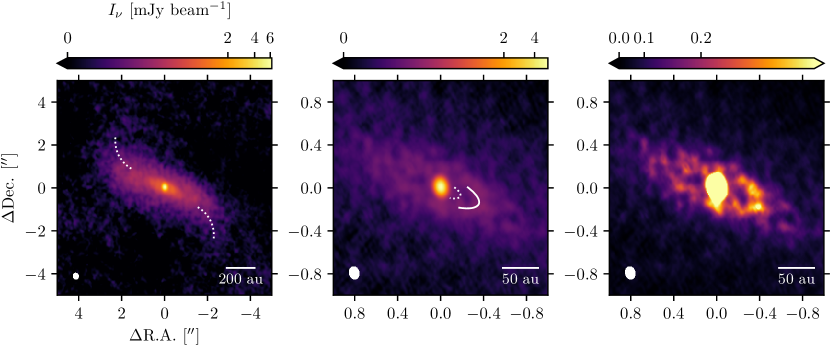
Figure 1 shows the 1.3 mm dust continuum images of the L1489 IRS disk. The left panel of Figure 1 shows the large-scale view of the continuum emission with robust and uvtaper k, while the middle and right panels show the zoom-in view with robust . A disk-like structure elongated along the northeast to the southwest direction is detected, which is consistent with previous observations (Yen et al., 2014; van ’t Hoff et al., 2020; Sai et al., 2020; Tychoniec et al., 2021). In the outermost region, non-axisymmetric, faint tails are also detected as indicated by the white dashed arcs in the left panel of Figure 1. These tails are also seen in the continuum image in Tychoniec et al. (2021) and are consistent with the molecular line emission tracing the warped outer disk as well as the accretion flows (Sai et al., 2020; Yen et al., 2014; van ’t Hoff et al., 2020).
The zoom-in view of the continuum image (middle panel of Figure 1) shows a central compact source at 01, which is unresolved at the current angular resolution. The peak intensity is 5.4 mJy beam-1, which corresponds to a brightness temperature of 21 K using the full Planck function. This component is spatially unresolved even in the higher resolution maps imaged with smaller robust parameters (Appendix A), indicating that this component is quite compact ().
Interestingly, an emission enhancement (i.e., a ring-like structure) is identified at a radius of from the central protostellar position is identified (middle panel of Figure 1). The locations of the ring and the adjunct gap are marked by the white solid and dashed arcs, respectively, in the middle panel of Figure 1. A non-axisymmetric brightness distribution (i.e., substructure in the azimuthal direction) at the ring is also observed. The right panel of Figure 1 shows the continuum image with an adjusted color scaling to clearly show the asymmetry. The western side of the ring is slightly brighter than its eastern counterpart. We will examine the properties of this ring-like structure in more detail in Section 4.1 and discuss its origin in Section 5.
To quantify the overall emission properties, we performed a two-component (i.e., central compact component and extended tenuous component) 2D Gaussian fit on the untapered continuum image using the imfit task in CASA. We note that due to the ring-like structure, the 2D Gaussian fit yields residuals at a level of at the ring location. The position of the emission peak of the central compact component derived by the fit is , . This is used as the position of the central protostar in the following analysis. The deconvolved sizes of the compact and extended components are 0037 0024 (PA , 5.4 au 3.7 au) and 39 13 (PA , 570 au 190 au), respectively. The deconvolved size of the extended component is consistent with the previous observations (Yen et al., 2014; Sai et al., 2020). The inclination angle of the outer, extended disk is estimated from the deconvolved size to be 71 ( for the face-on configuration) assuming a geometrically thin disk. The derived inclination angle is similar to the value measured by previous observations (73; Sai et al., 2020). The total flux density originating from both components is 91 9 mJy. The flux calibration uncertainty of 10% is added in quadrature. The measured flux density is 53% larger than that measured by Sai et al. (2020) ( mJy), which has been found to be due to the JvM effect (Jorsater & van Moorsel, 1995; Czekala et al., 2021, see also Section 2). Applying the JvM correction (Czekala et al., 2021) resulted in a JvM (the ratio of the CLEAN beam volume to the dirty beam volume) of and a similar flux density (50 mJy) to that derived by Sai et al. (2020).
Assuming that the continuum emission at is purely from the thermal dust emission and optically thin, the total dust mass can be estimated by
| (1) |
where is the flux density, pc is the distance to the source, is the dust mass opacity, and is the Planck function of the blackbody radiation at the temperature of . We adopted the flux density of mJy from the JvM-corrected image, and the dust mass opacity of based on Beckwith et al. (1990) with an assumption of the dust-to-gas mass ratio of 0.01. Adopting dust temperatures of , a typical value used in Class II surveys (e.g., Andrews & Williams, 2005; Ansdell et al., 2016; Tobin et al., 2020), and based on the prescription in Tobin et al. (2020),
| (2) |
with the bolometric luminosity of (Ohashi et al., 2023), we obtain disk dust masses of and , respectively. We note that these estimates are lower limits given that the emission at the central compact component may be optically thick.
3.2 Molecular lines
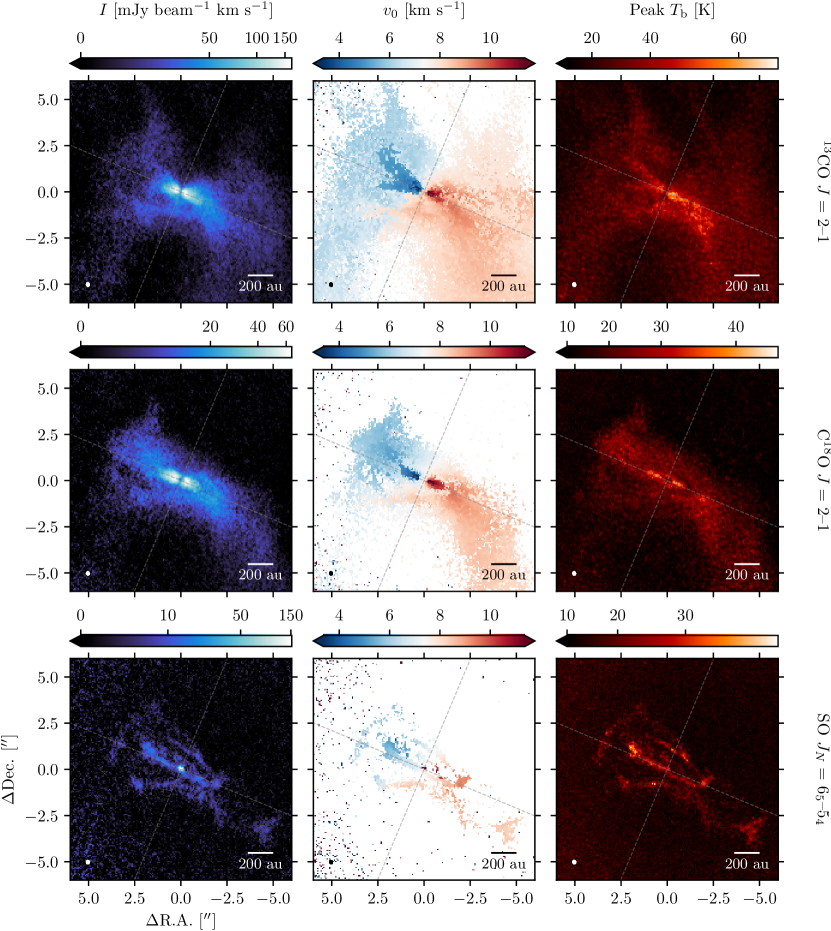
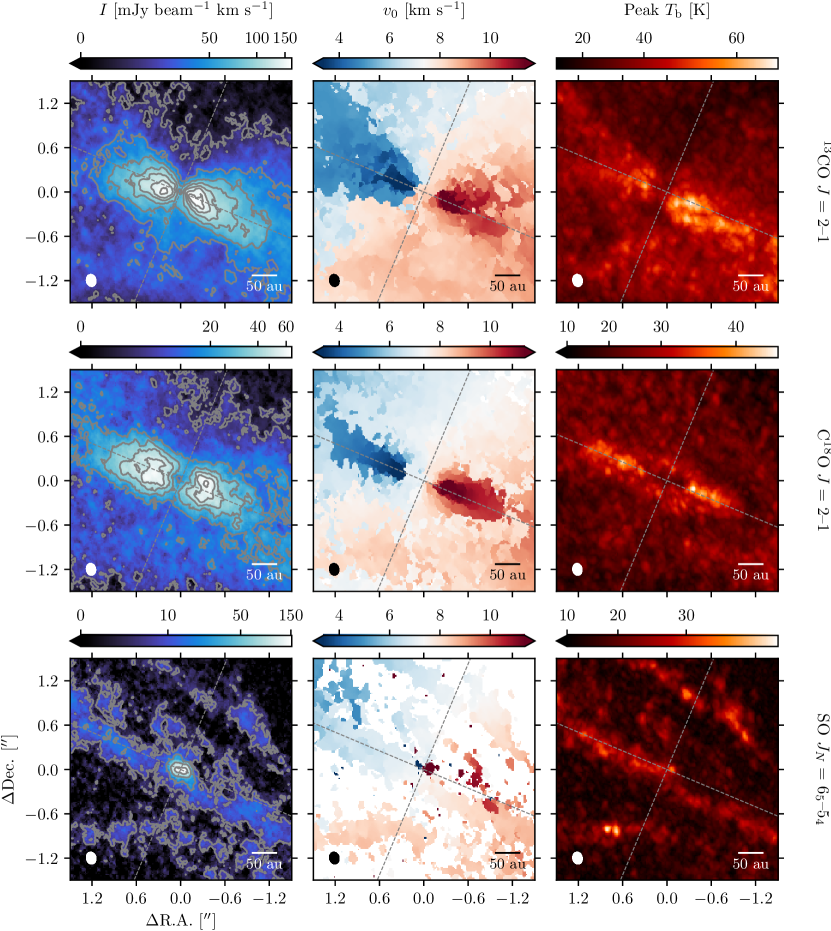
Figures 2 and 3 show the molecular line maps of the velocity-integrated intensity (or “zeroth moment”), velocity centroid, and peak brightness temperature with large-scale and zoom-in views, respectively. All the maps are generated using bettermoments (Teague & Foreman-Mackey, 2018). For the velocity-integrated intensity maps, we integrate only the emission above 2. For the velocity centroid maps and peak brightness temperature maps, we use the quadratic method implemented in bettermoments rather than traditional first/eighth moments.
3.2.1 13CO
The maps of the 13CO 2–1 emission are shown in Figures 2 and 3 (top rows). The emission is detected above 3 in a velocity range from 0.2 km s-1 to 15.6 km s-1, where the systemic velocity is 7.38 km s-1 as derived by the velocity structure analysis (Section 4.2). The velocity-integrated intensity map with a large-scale view (top-left panel of Figure 2) shows an elongated morphology along the major axis of the dust disk at , and the velocity centroid map (top-middle panel of Figure 2) shows a rotation signature of the disk. In the outer region (), the 13CO emission shows an extended structure, suggesting that the 13CO emission traces the envelope component. Sai et al. (2020) also observed the same transition and found a similar emission morphology (see Appendix C in their work).
The velocity-integrated intensity map with a zoom-in view (top-left panel of Figure 3) shows a bright, double-peaked 13CO emission at a spatial scale of . Interestingly, the peaks of the 13CO emission are slightly shifted southward from the disk major axis. This would be evidence that the 13CO emission is originating from the surface of the inclined disk. The brighter emission on the southern side indicates that the southern side is the far side of the disk, from which the emission of the warm disk surface reaches the observer directly (e.g., Ruíz-Rodríguez et al., 2017; Lee et al., 2017; Villenave et al., 2020; Takakuwa & eDisk team, 2022). This configuration of the disk is consistent with the outflow directions, where the red- and blue-shifted robes are located in the northern and southern sides, respectively (Yen et al., 2014).
The top-right panels of Figure 2 and 3 show the peak brightness temperature maps. The peak brightness temperature reaches 60 K at , again suggesting that the 13CO emission traces the disk surface where the temperature is higher than the midplane due to the heating by the protostar or the accretion shock. The map also shows the higher brightness temperature on the southwestern (or redshifted) side, which may indicate a non-axisymmetric temperature structure of the disk. The brighter molecular line emission on the southwestern (or redshifted) side of the disk has also been previously observed in C17O and H2CO emission (van ’t Hoff et al., 2020).
3.2.2 C18O
The maps of the C18O 2–1 emission are shown in Figures 2 and 3 (middle rows). The emission is detected above 3 in a velocity range from 0.8 km s-1 to 12.8 km s-1. The velocity-integrated intensity map (middle-left panel of Figure 3) shows a lack of the C18O emission in the innermost region (). In the intermediate region (), an elongated disk-like emission exists. While the C18O emission shows the double-peaked morphology at similar to that of 13CO, no significant shifts of the peaks from the major axis of the disk are seen, in contrast to the velocity-integrated intensity map of 13CO (the top-left panel of Figure 3). This indicates that the C18O emission mainly traces the gas near the disk midplane. Also, the radii of the C18O peaks are slightly larger than those of the 13CO peaks, which is more clearly presented in the radial intensity profiles in Section 3.3.
In the outer region (), a warped structure is seen, where the redshifted part is curved toward southwest and the blueshifted part toward northeast (Figure 2). This feature was first found by Sai et al. (2020), where they interpreted it as a misaligned Keplerian disk based on the velocity structure analysis. Furthermore, an extended redshifted emission is present in the outermost region () of the southwestern (redshifted) side (see the middle-left panel of Figure 2), consistent with the infalling accretion flow observed in Yen et al. (2014). The blushifted conuterpart of this component is also seen as a slight extension to the north on the northeastern side.
The centroid velocity map (central panel of Figure 3) shows the highest velocity (3–5 km s-1 with respect to the systemic velocity) along the major axis of the disk, suggesting that the high-velocity component of the C18O emission traces the gas in the rotating disk. A similar velocity structure was observed by Sai et al. (2020). In the innermost region (02), the map lacks the highest velocity component, which is due to the absence of the disk emission (possibly caused by the actual gas absence and/or the continuum over-subtraction; see Section 5.1), as seen in the velocity-integrated intensity map (middle-left panel of Figure 3).
The peak brightness temperature map (the middle-right panel of Figure 3) also suggests that the C18O emission originates from the disk midplane, as the peak emission components are located close to the disk major axis. Similar to the velocity-integrated intensity map (the middle-left panel of Figure 3), the peak brightness temperature also shows a central dip at and a ring-like structure with a radial peak at . In addition, the southwestern (or redshifted) side of the disk is slightly brighter than the northeastern side, consistent with the distributions of the 13CO peak brightness temperature structure.
3.2.3 SO
The maps of the SO ( 65–54) emission are shown in Figure 2 and 3 (bottom rows). The emission is detected above 3 over a wide velocity range from 3.8 km s-1 to 19.2 km s-1. Overall, the morphology of the SO emission is different from that of 13CO and C18O. The velocity-integrated intensity map with the zoom-in view (bottom-left panel of Figure 3) exhibits a prominent compact emission in the innermost region () and the diffuse extended emission in the outer disk, while the diffuse SO emission lacks the high-velocity component at – seen in 13CO and C18O (see the middle column of Figure 3). The central compact emission is marginally spatially resolved and shows an elongated structure along the east-west direction. Interestingly, this emission component shows a velocity gradient along the elongation direction over the extremely high velocities of 10–12 km s-1 with respect to the systemic velocity (bottom-middle panel of Figure 3). The origin of this emission is discussed in detail in Section 5.5. The outer diffuse emission shows a complex structure where the emission is mainly distributed along the major axis of the disk as well as in the regions relocated from the axis (bottom-left panel of Figure 2). It also shows the velocity gradient along a direction similar to the major axis of the disk, partially tracing the rotating disk (bottom-middle panel of Figure 2). In addition, an SO emission clump is detected on the southwestern side of the disk (), consistent with previous observations (Yen et al., 2014).
The peak brightness temperature map of the SO emission (the bottom-right panels of Figures 2 and 3) is highly intriguing. The multiple local enhancements of the peak brightness temperature are identified in the outer region. They may indicate the local enhancement of the gas temperature due to the accretion shock. On the other hand, the central compact emission shows lower peak brightness temperatures. This will be discussed in more detail in Section 5.5.
3.3 Radial intensity profiles
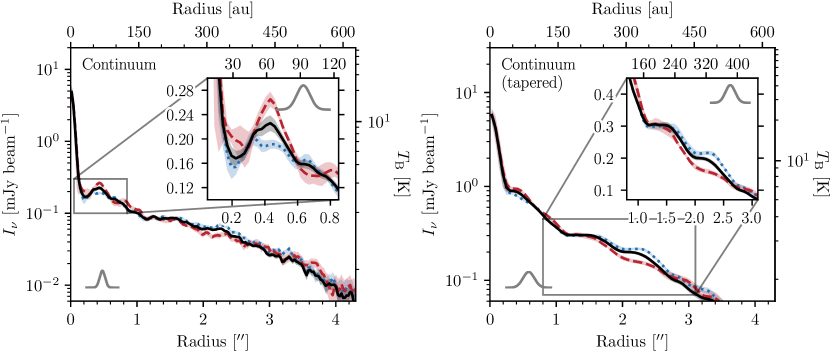
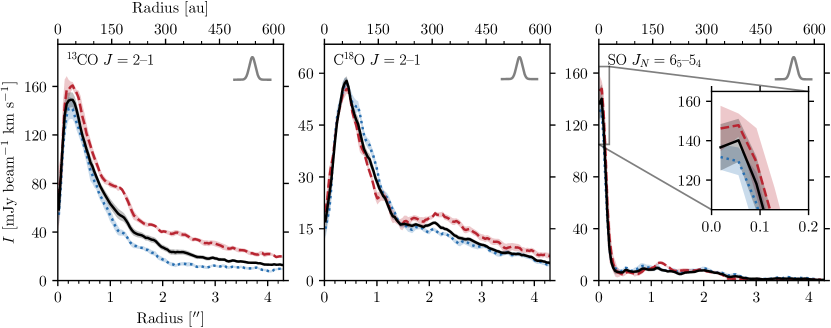
Figures 4 and 5 show the radial intensity profiles of the continuum and molecular lines, respectively. The methodology used to generate these radial profiles is described in detail in Appendix B. Briefly, we averaged the emission over certain radial bins within the limited wedge of with respect to the disk major axis. In addition to the profiles averaged over both sides of the disk, we calculated the profiles extracted from each southwestern (redshifted) side and northeastern (blueshifted) side of the disk to show the azimuthal variations. The radial and azimuthal substructures for the continuum and each line emission are described below. A more detailed comparison of the radial profiles will be made in Section 5.
Continuum — Figure 4 shows that the continuum emission consists of the centrally peaked compact component and the tenuous extended disk emission. In addition to these components, a gap-ring pair is identified at 02 (or 30 au) and 04 (or 60 au) radii from the disk center. The profile extracted from the southwestern side is brighter at the ring position than that extracted from the northeastern side by 0.08 mJy beam-1 (i.e., significance), which can be seen more clearly in the inset panel of the left panel of Figure 4. In the radial profile of the robust tapered image (the right panel of Figure 4), two shoulder-like structures are tentatively identified at 15 (or 220 au) and 23 (or 340 au). The profiles also show slight variations between the southwestern side and the northeastern side at those shoulder-like substructures. The northeastern side is brighter than the southwestern side.
13CO 2–1 — The radial intensity profile extracted from both sides peaks at 02 (or 30 au) radii. Additionally, a subtle shoulder is identified at 13 (or 190 au) radii. This feature is also seen in the profiles extracted from the southwestern and northeastern sides of the disk, although the feature in the northeastern side is subtle. Overall, the southwestern side is brighter than the northeastern side, while the difference is more significant in the outer radii ().
C18O 2–1 — The peak of the C18O intensity profile is slightly shifted outward (04 or 60 au) compared to the peak of 13CO. From this peak, the C18O profile shows a steep decline until 14 (or 200 au). At 22, the C18O intensity profile from the southwestern side shows a slight enhancement, which is brighter than the emission on the northeastern side. While the C18O profiles show the difference between the southwestern and northeastern sides of the disk in the outer region ( or 220 au), the profiles are consistent in the inner disk ().
SO 65–54 — The SO emission is centrally peaked at 02, although the innermost bin shows a slight central depression (the inset of the right panel of Figure 5). The extent of the central compact component is up to 02. In addition to the central compact component, there is a tenuous diffuse emission as also seen in the maps (Figure 2). There is no major variation between the southwestern and northeastern sides, although the 2D emission distributions are complex (Figure 2).
4 Analysis
We performed two simple modeling approaches to the observed continuum and line emission: (1) an analytical model fit to the observed continuum emission in the visibility domain to characterize the radial substructures and geometry of the dusty disk (Section 4.1) and (2) a rotation curve fit to the position-velocity (PV) diagram of the C18O emission to investigate the nature of the disk rotation (Section 4.2).
4.1 Visibility analysis of the dust continuum emission
To precisely characterize the dust disk geometry and morphology, we conduct an analytic model fit to the observed dust continuum data in the visibility domain. Visibility analysis has two advantages against the image analysis. First, the uncertainties associated with imaging can be avoided. Second, visibility can probe the structures on scales smaller than the beam size of the image, although the smallest scale that can be probed is limited by the maximum baseline length. We only consider the axisymmetric component and the innermost dust ring, given that the non-axisymmetric components and outer shoulder-like structures are rather faint. We use a Gaussian ring model with an intensity distribution given by
| (3) |
where is the peak intensity of the ring component, is the radius of the ring center, and is the width of the ring. The radial coordinate is the disk coordinate deprojected with the position angle (PA) and the inclination angle (). The central compact component is given by
| (4) |
We add the extended disk component as a Gaussian and it is similarly given by
| (5) |
The full model is then given by the sum of all the components,
| (6) |
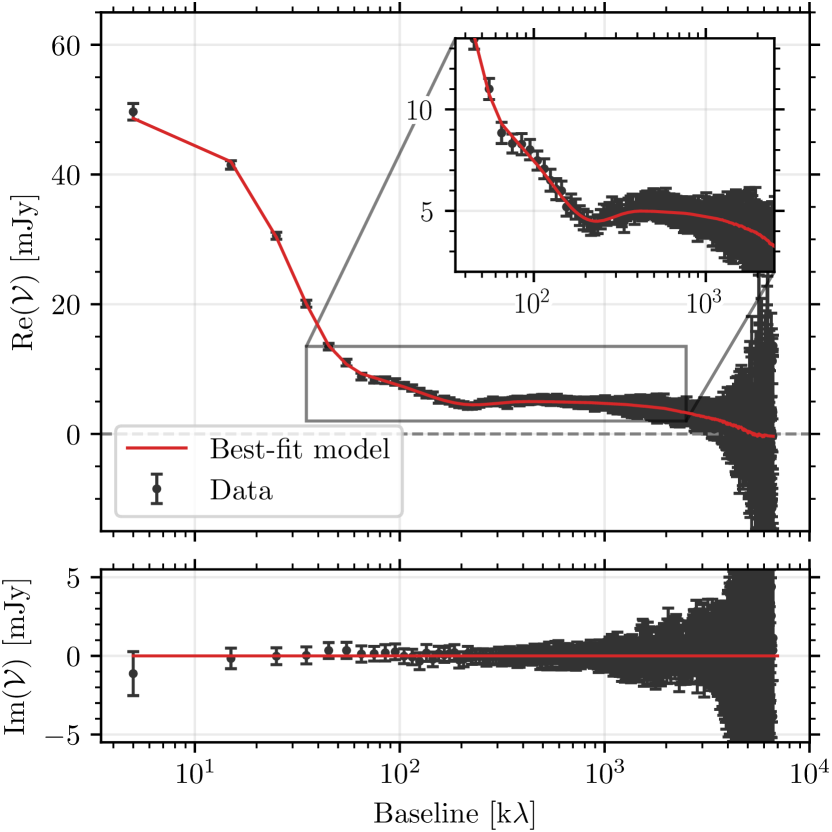
We directly fit this model to the observed visibilities. We used the flux density () instead of the peak intensity () for the parameters in practice. First, the model image is generated in the image plane, and then Fourier-transformed by the GALARIO code (Tazzari et al., 2018) onto the observed sampling of the -plane. We also consider the disk center offset from the phase center of the observations, resulting in additional parameters of . In total, we consider 11 parameters , and search the parameter space with the Markov Chain Monte Carlo (MCMC) method using the emcee package (Foreman-Mackey et al., 2013). The parameter space is sampled by 200 walkers with 1000 steps, and the initial 700 steps are discarded as burn-in.
Table 2 summarizes the resultant parameters of the fit. We find a PA of and an inclination of , both of which are consistent with the 2D Gaussian fit on the image plane (see Section 3). The ring radius is estimated to be (or 56 au), which is consistent with the peak of the radial intensity profile (Figure 4). The ring width is (or 35 au). The size of the central compact component is derived to be (or 1 au), which is smaller than the deconvolved size derived by the 2D Gaussian fit on the image plane (see Section 3). This indicates that the central component is indeed very compact and not spatially resolved at the current resolution. The size of the extended component ( in the standard deviation of Gaussian, or in FWHM) is comparable to that derived by the 2D Gaussian fit. The total flux density (summed up all the components) of 52 mJy is similar to the value derived from the JvM-corrected image (which is expected to recover the correct flux scale; see Section 3).
The comparison of the best-fit model (i.e., the model that maximizes the likelihood) with the observed visibilities (deprojected and azimuthally averaged) is shown in Figure 6. Overall, the observed visibilities are reproduced well by the model. Importantly, a dip at 200 k (the inset of Figure 6) clearly indicates the presence of a ring-like structure. In the shortest-baseline bin, a slight discrepancy between the observations and the model in both real and imaginary parts exists, although it is within the uncertainty. The discrepancy in the real part indicates that additional emission component(s) in the largest spatial scale (which can be traced by the present observations) may be required to better reproduce the observations. The discrepancy in the imaginary part in the shortest-baseline bin suggests that the additional component(s) would be non-axisymmetric with respect to the phase center. The potential presence of a large-scale, non-axisymmetric structure is consistent with the faint tails in the outermost region seen in the dust continuum image (the left panel of Figure 1), which are not included in the current model.
| Parameter | Unit | Description | Value† |
|---|---|---|---|
| mJy | Flux density of the central compact component | 5.05^+0.04_-0.04 | |
| ″ | Size of the central compact component | 0.00722^+0.00024_-0.00024 | |
| mJy | Flux density of the ring component | 5.39^+0.22_-0.22 | |
| ″ | Width of the ring | 0.238^+0.016_-0.016 | |
| ″ | Radius of the ring location | 0.384^+0.018_-0.019 | |
| mJy | Flux density of the extended component | 41.4^+0.4_-0.4 | |
| ″ | Size of the extended component | 1.58^+0.02_-0.02 | |
| ° | Position angle of the disk measured from north to east | 67.0^+0.3_-0.3 | |
| ° | Inclination angle of the disk (0 for face-on) | 72.0^+0.2_-0.3 | |
| ″ | Source offset from the phase center along Right Ascension | 0.00881^+0.00010_-0.00010 | |
| ″ | Source offset from the phase center along Declination | 0.00101^+0.00015_-0.00016 |
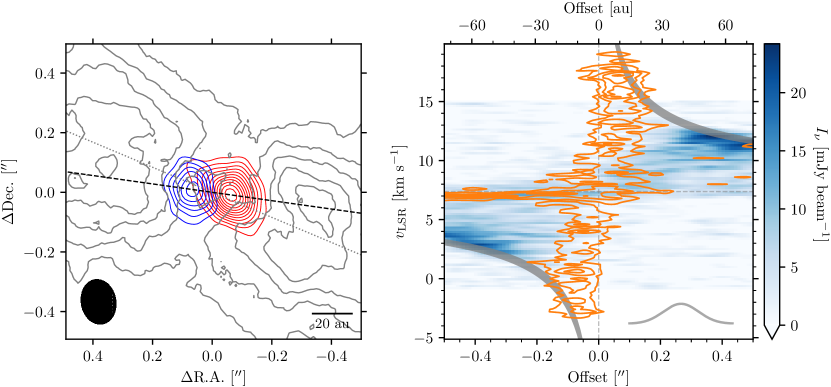
4.2 Velocity structure traced by the C18O emission
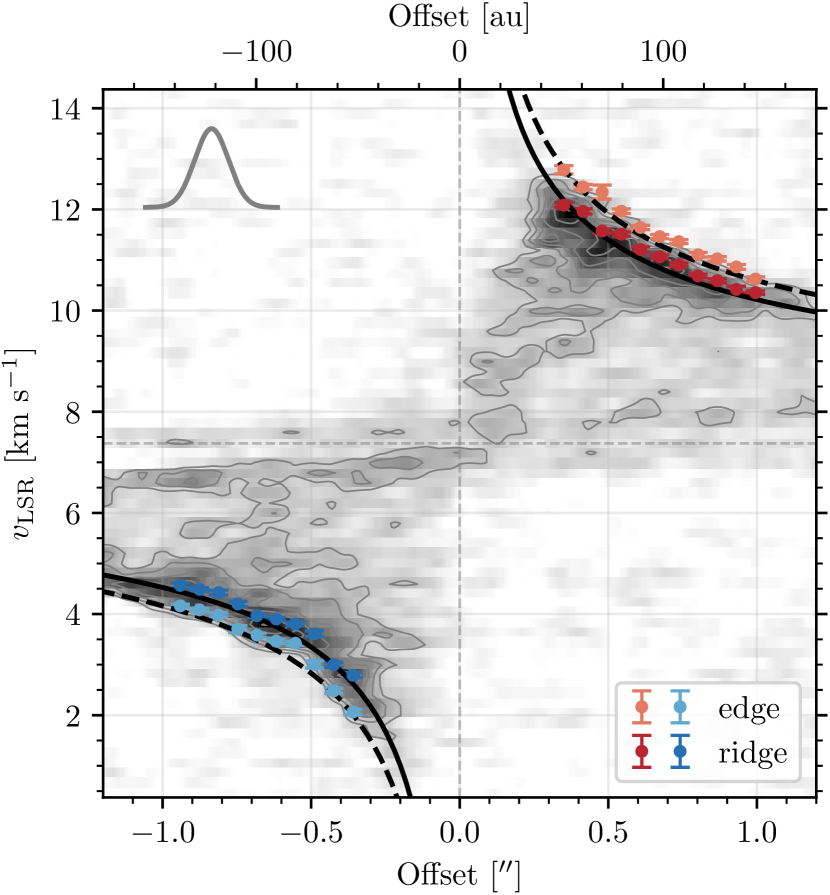
To investigate the velocity structure of the disk and infer the dynamical stellar mass, we use the C18O emission since the emission morphology suggests that it traces the rotating gas near the midplane (see the middle-left panel of Figure 3). Sai et al. (2020) found a large Keplerian disk extended to au with a warped structure at au by conducting the power-law fitting to the data points derived from the position-velocity (PV) diagram of C18O 2–1, and estimated the central stellar mass of (see also Yen et al., 2014). We here independently verify the Keplerian rotation of the disk and estimate the central stellar mass using the Spectral Line Analysis/Modeling (SLAM) code (Aso & Sai, 2023). We follow the methodology described in Ohashi et al. (2023). First, the C18O PV diagram along the major axis of the dusty disk (PA as derived by the visibility analysis; see Section 4.1) is generated and shown in Figure 7. The representative data point pairs are extracted from the diagram, to which a power-law function () is subsequently fitted. To extract the representative data points, we identified a peak velocity channel for each pixel of the positional axis and subsequently fitted a Gaussian to the adjacent two channels (i.e., in total three channels). This is referred to as the ridge method (e.g., Yen et al., 2013; Lee et al., 2018; Sai et al., 2020, see also Aso & Machida 2020). As a complementary method, we extracted the points where the emission reaches 5 for each pixel of the positional axis, which is referred to as the edge method (e.g., Seifried et al., 2016; Alves et al., 2017, see also Aso & Machida 2020). The two methods result in different estimates of the central stellar mass: the ridge method can underestimate it and the edge method can overestimate, depending on the spatial resolution (Maret et al., 2020). The difference between the central stellar masses derived from these methods is thus adopted as a systematic uncertainty. In addition, we only used 03–10 region to avoid the effects of spatial resolution as described in Appendix of Aso et al. (2015) and substructures (i.e., the central depression and the warped structure at au). The extracted representative data points are shown by red and blue points in Figure 7. We verified that these data points follow Keplerian rotation by conducting a power-law fit to them with SLAM. The best-fit power-law index are and for the ridge and edge methods, respectively; the index is consistent with Keplerian rotation. To infer the central stellar mass, we fit the Keplerian rotation model to these data points:
| (7) |
where is the line-of-sight component of the rotation velocity, is the gravitational constant, is the central stellar mass, is the radius, is the disk inclination angle, and is the systemic velocity. The free parameters are and . The disk inclination angle is fixed to 72 as derived from the visibility analysis described in Section 4.1. To search the parameter space, the MCMC algorithm implemented in the emcee package (Foreman-Mackey et al., 2013) is adopted. We ran 1000 steps with 200 walkers and discarded the initial 500 steps as burn-in. The convergence was tested by auto-correlation analysis. The best-fit values (median of the posterior distributions) and uncertainties (16th and 84th percentiles) are reported in Table 3 for both ridge and edge methods.
While the derived systemic velocities are consistent between the two methods, the best-fit stellar masses are significantly different (Table 3). The value from the edge method is larger than that from the other method, which is natural as the edge method tends to trace a higher velocity than the ridge method at each pixel. Thus, the derived stellar mass including the systematic uncertainty is –. This is consistent with the previous estimates of by Sai et al. (2020), where they used the ridge method and the data points from the outer warped disk as well.
| Method | ||
|---|---|---|
| [] | [km s-1] | |
| ridge | 1.498^+0.008_-0.008 | 7.372^+0.009_-0.009 |
| edge | 1.911^+0.010_-0.009 | 7.377^+0.010_-0.010 |
Note. — The uncertainties correspond to the 16th and 84th percentiles of the posterior distributions.
5 Discussion
5.1 Origin of the dust ring
As described in Section 3, our observations have detected several radial substructures in both dust continuum and molecular line emission. Various mechanisms have been suggested as the origin of ring/gap structures in protoplanetary disks: e.g., planet-disk interaction (e.g., Zhang et al., 2018), modification of dust grain properties at the snowlines of volatiles (Zhang et al., 2015; Okuzumi et al., 2016), disk winds (e.g., Takahashi & Muto, 2018), and dust growth (Ohashi et al., 2021).
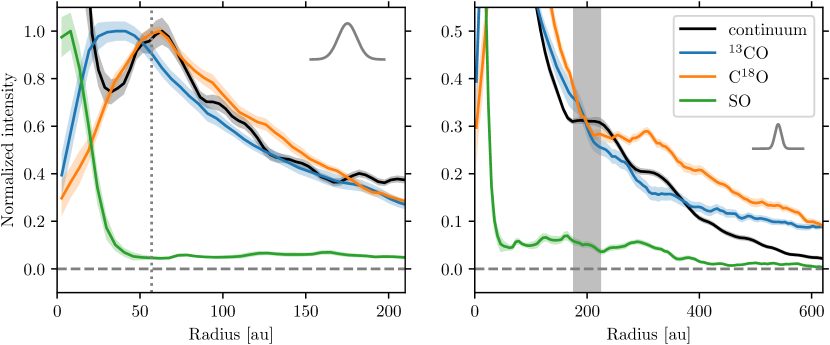
If the dust ring at au is carved by a planet, gas will also show a ring-gap structure at a similar radius. To explore the gas and dust structures around the dust ring, we compare the radial profiles of the dust continuum and line emission in the innermost region in Figure 8 (left panel). Interestingly, the dust ring and the radial peak of C18O intensity profile coincide with each other. Because the C18O emission is likely to trace the region near the midplane based on the emission morphology on the velocity-integrated emission map (Figure 3), this coincidence may indicate the presence of a ring-like structure in both dust and gas. In the adjacent dust gap (at 30 au), the 13CO emission is bright, which is likely due to its optically thick emission at the disk surface as indicated by the morphology on the velocity-integrated intensity map (Figure 3). While the dust and C18O intensity profiles at au show similar behavior, the C18O intensity profile monotonically decreases inwards at au, where the dust intensity profile shows a rapid increase. The 13CO intensity profile also shows a rapid decrease at au. These are likely due to the continuum over-subtraction (e.g., Weaver et al., 2018), which makes it difficult to infer the presence/absence of the gas gap, while the coincidence of the dust ring and the radial peak of the C18O emission is likely real.
If we assume that the gas disk has a gap with the same depth as the dust gap and that it is carved by a formed planet, the mass of the planet can be estimated using
| (8) |
where is the surface density contrast (i.e., gap depth), is the disk aspect ratio (i.e., the ratio of the scale height to the disk radius), is the turbulence parameter, and is the central stellar mass (Kanagawa et al., 2015). If we adopt the contrast of 0.64 as measured on the dust intensity profile (Figure 4; assuming the emission is optically thin) as , and assume –, –, and the central stellar mass of – as derived in Section 4.2, the mass of the planet (if present) would be 0.033–2.4 .
Another possible mechanism to explain the innermost ring/gap structures in the dust emission is the dust growth front, which is recently proposed by Ohashi et al. (2021). They calculated the time evolution of the dust size distribution and surface density profile considering the grain growth via coagulation and radial drift of dust grains and found that a ring-like structure in the surface density profile is formed at the dust growth front (or pebble production line; Lambrechts & Johansen 2014). Outside the dust growth front, the dust particles have not grown and remain in their initial states (µm size), while inside the growth front they have grown to mm size or larger and radially drifted, resulting in a local maximum of the surface density profile (i.e., ring-like structure) at the growth front. The expected radial location of the ring matched well the observed dust ring locations in young protostellar disks (Ohashi et al., 2021, 2022a), suggesting that the dust growth front mechanism could be a possible explanation for the origin of dust rings particularly in young disks. Ohashi et al. (2021) constructed an equation that predicts the radial location of the ring formed by this mechanism based on the radiative transfer modeling. The important parameters that control the location of the dust ring () are the disk age (), stellar mass (), and dust-to-gas mass ratio ():
| (9) |
If we adopt the stellar mass of – as derived in Section 4.2, , and (3–8) (Sai et al., 2022), the expected location of the dust ring is 28–59 au. The ring location of 56 au found by the present observations is consistent with this expectation. Ohashi et al. (2022a) also tentatively detected the ring-like structure at 90 au in the L1489 IRS disk; the difference with our result is likely due to their coarser spatial resolution. If the dust ring is produced by the dust growth front mechanism, dust grains in the inner 60 au has already grown to millimeter size or even larger (Ohashi et al., 2021). To confirm that grain growth indeed has taken place, higher resolution, multi-band observations are needed to measure the spectral indices across the dust ring.
The observed ring/gap structure may also be formed by the inner misaligned disk. We will discuss this possibility in Section 5.6.
5.2 Outer disk structures
In addition to the dust ring at 56 au, we identified two shoulder-like structures in the outer disk in the dust continuum radial profile (Figure 4). The comparison of the radial intensity profiles of the dust continuum and line emission in the outer region is shown in the right panel of Figure 8. The inner shoulder at 220 au coincides with the CO snowline location based on the radiative transfer modeling by Sai et al. (2020). The rapid inward increase of the C18O profiles at the shoulder also indicates the sublimation of CO molecules. Similar behaviors of CO line intensity profiles have been observed in Class II disks as well (e.g., Zhang et al., 2021). While the coincidence between the dust shoulder and the CO snowline may imply the change of the dust property to form the substructure, it is also possible that the rapid increase of the radial profiles of the CO isotopologues could simply be due to the gas density enhancement. We also note that the shoulder radius of au coincides with the warped structure as revealed by the C18O emission (Section 3.2.2; see also Sai et al. 2020)
The outer shoulder at 340 au is located in the outer warped disk. At the same location, the C18O emission, which traces near the disk midplane, exhibits a subtle emission enhancement. Similar enhancements of the line emission have been observed in C18O 2–1 by Sai et al. (2020) and C17O 2–1 by van ’t Hoff et al. (2020). This may imply that CO depletion is much less significant outside 340 au, which we call the secondary CO snow line. As the disk column density decreases with radius, photodesorption due to penetrating UV radiation could keep CO in the gas phase outside a certain radius. A similar re-enhancement of the line emission at an outer radius is also observed in several disks (Dutrey et al., 2017; Flores et al., 2021; Lin et al., 2023). In Class II disks, similar secondary CO snow lines have also been suggested by the double emission rings of DCO+, which is expected to trace the gas-phase CO (Öberg et al., 2015; Cataldi et al., 2021).
5.3 Azimuthal asymmetry
In addition to the radial substructures, the dust continuum and molecular line emission also show azimuthal asymmetries (Section 3). As for the dust continuum, the southwestern side of the disk is brighter than the northeastern side in the dust ring (see the right panel of Figure 1). Non-axisymmetric dust emissions have been observed in a handful of disks of both Class 0/I and Class II (e.g., van der Marel et al., 2013; Sheehan et al., 2020), at least part of which is considered to be non-axisymmetric dust traps, e.g., vortices. In the L1489 IRS disk, the ring at au may thus have the dust trap (i.e., gas pressure maximum) on the southwestern side. Alternatively, the azimuthal variance of the temperature can also lead to the asymmetry of the dust emission, which could be caused by an inner misaligned disk (see Section 5.6).
The L1489 IRS disk shows the asymmetry of the dust continuum emission along the major axis (see the left panel of Figure 1). This is in contrast to several other eDisk sources which exhibit asymmetries along the disk minor axis (see Ohashi et al. 2023 for a gallery of the continuum images). The latter is evidence that the dust grains are flared but not settled to the disk midplane; brighter emissions from the far side of the disk and fainter emissions from the near side of the disk are observed as a natural consequence of an flared optically thick disk with a radial temperature gradient (decreasing temperature as a function of radius; Ohashi et al., 2022b; Lin et al., 2023).
The lack of brightness asymmetry along the disk minor axis in the L1489 IRS disk could be due to its optically thin emission. In the case of the optically thin emission, the entire columns are seen at both near and far sides, resulting in a symmetric emission distribution along the minor axis. The low brightness temperature of the dust emission in the outer disk ( K, see Figure 4) indeed suggests that the dust emission is likely optically thin except for that originating from the spatially-unresolved innermost region ().
It is also possible that the dust in the L1489 IRS disk is settled to the midplane, which causes the lack of asymmetry along the minor axis of the disk. In contrast to young Class 0/I disks, observations of Class II disks indicate that the large dust grains are settled well to the midplane (e.g., Kwon et al., 2011; Pinte et al., 2016; Villenave et al., 2020, 2022). This suggests that the dust settling occurs during the evolution from the Class I phase to the Class II phase. It has also been speculated that L1489 IRS is in the later evolutionary stage of the Class I phase based on its relatively small disk mass compared to other Class I disks (Sai et al., 2020). Therefore, L1489 IRS may be in transition between the Class I and Class II phases, where the dust settling has started. A similar lack of asymmetry along the minor axis is also observed in the disk around V883 Ori, which is in transition from the Class I phase to the Class II phase (Cieza et al., 2016; Lee et al., 2019).
In addition to the dust continuum emission, the molecular line emissions also show azimuthal asymmetries (Figure 2 and 3). The slight shift of the emission peaks from the disk major axis to the southern side of the disk on the 13CO velocity-integrated emission map (Figure 3) is clear evidence that 13CO emission traces a significantly higher layer above the disk midplane (so-called “emission surface”)444We note that we tried to estimate the emission surface of 13CO using the disksurf package (Pinte et al., 2018b; Teague et al., 2021), but no reasonable estimates were obtained due to the contamination from the envelope emission.. The direction of the shift indicates that the southern side is the far side of the disk, which is consistent with the outflow configuration where the southern lobe is blueshifted (Yen et al., 2014). Similar molecular line structures elevated from the midplane have been observed in a number of disks (e.g., Law et al., 2021a, 2022; Lin et al., 2023). Furthermore, the 13CO and C18O emissions show higher brightness temperatures on the southwestern side of the inner () disk (Figure 3). These asymmetries, as well as the non-axisymmetric brightness distribution of the dust continuum emission, may be explained by the warped disk structure (see Section 5.6).
5.4 Gas disk size and dust disk size
Disk size is a key to undestanding disk evolution processes. Submm/mm Observations of Class II disks have revealed that the extent of the bright 12CO line emission is generally larger than that of the dust continuum emission (e.g., Andrews et al., 2012; de Gregorio-Monsalvo et al., 2013; Ansdell et al., 2018; Long et al., 2022). This difference has been interpreted as a consequence of grain growth and radial drift, although the difference could also be explained by the larger optical depth of the 12CO line emission than that of the dust continuum emission (e.g., Panić et al., 2009; Facchini et al., 2017; Trapman et al., 2019).
For the L1489 IRS disk, while the dust disk radius derived from the visibility analysis is 230 au, the gas disk radius was estimated to be 600 au from the rotation curve analysis of the C18O emission (Sai et al., 2020). This factor of 2–3 difference in the size of the gas and dust disks is consistent with the averaged ratio of the gas disk radii to the dust disk radii in samples of Class II disks (Ansdell et al., 2018; Long et al., 2022), suggesting that the dust growth and radial drift have already been occurred in the L1489 IRS disk. This is also consistent with the ring-like structure of the dust emission (see Section 5.1) and suggests that the L1489 IRS could be in transition between the Class I phase to the Class II phase (see also Section 5.3).
However, it may be also possible that the difference in the radii of the gas and dust disks is due to the difference in the optical depths of the gas and dust emission (Panić et al., 2009; Facchini et al., 2017). The brightness temperature of the dust continuum emission in the outer region of the L1489 IRS disk ( a few K; see Figure 4) is lower than that of the C18O emission ( a few tens of K; see Figure 2). This may indicate the difference in the optical depths, although it is also possible that the dust emission and the C18O emission trace the different vertical layers of the disk that should have different temperatures.
5.5 Origin of the SO emission: accretion shocks and a warm inner disk?
As described in Section 3.2.3, the nature of the SO emission is highly complex. Outside the radius of 30 au (), diffuse SO emission has been observed (Figure 2). The non-uniform diffuse SO emission suggests the localized enhancement of the SO column density rather than a smooth distribution of SO within the disk. In addition, the localized enhancements of the SO brightness temperature (Figure 2) indicate the elevated gas temperature. In particular, the SO brightness temperature enhancement is prominent at au on the disk major axis, and this radius roughly coincides with the landing point of the accretion flow observed in the C18O emission. Yen et al. (2014) reproduced the observed accretion flow with parabolic trajectories assuming a landing point (or centrifugal radius) of 300 au. It is thus likely that the origin of the diffuse SO emission is an accretion shock onto the protostellar disk caused by the infalling material. At the interface between the infalling material and the protostellar disk, slow shocks can occur; SO molecules are released into the gas phase due to the aerodynamic heating of dust grains in the post shock gas and/or formed from other desorbed molecules (e.g., Aota et al., 2015; van Gelder et al., 2021). In the Class 0 protostar L1527 IRS, the ring-like distributions of the SO emission have been interpreted as an indication of accretion shocks at the interface between the envelope and disk (Ohashi et al., 2014; Sakai et al., 2014, 2017, but see also van ’t Hoff et al. 2023). SO emissions originating from the accretion shock of the late-stage infalling streamer are also observed in Class I/II disks, DG Tau and HL Tau, as well (Garufi et al., 2022). Alternatively, the outer diffuse SO emission may originate from non-thermally desorbed SO molecules (e.g. photodesorption). However, the non-uniform distribution of the SO emission would be better explained by accretion shock.
In the innermost region (), on the other hand, a compact, prominent SO emission exists (Figure 3). This emission component is distinct from the outer diffuse emission in terms of the spatial distribution and the brightness, suggesting a separate origin. The comparison of the radial intensity profiles (Figure 8) clearly shows that the SO emission is distributed in inner regions ( au) compared to 13CO and C18O. Given the usual temperature structure of the disk (i.e., the higher temperature at a smaller radius), the compact SO emission traces the higher temperature region than that traced by CO isotopologue lines. Sai et al. (2020) calculated the temperature structure of the L1489 IRS disk by radiative transfer modeling. The midplane dust temperature at the SO emitting radii ( au) is K (see Appendix C), which is comparable to or higher than the sublimation temperature of SO ( K; e.g., Sakai et al., 2014; Aota et al., 2015; Miura et al., 2017), and the disk surface would be even warmer. The compact SO emission thus likely originates from the thermal sublimation of SO or its precursor (e.g., H2S) at the warm inner region. The bright emission also requires abundant SO gas, which could be naturally explained by thermal sublimation. Although the relatively low peak brightness temperatures of SO in the innermost region (see Figure 3) seemingly contradicts this interpretation, the brightness temperatures at the innermost region may be reduced due to the beam dilution effect. Additionally, the SO emission in the innermost region could be optically thin, resulting in lower peak brightness temperature than the actual gas temperature.
While a bright, compact SO emission is detected in the innermost region, a CH3OH transition with an upper state energy of 45 K, which is observed in the same spectral setup, is not detected. In the Class II disks around IRS 48 and HD 100546, SO emission and bright emission from complex organic molecules including CH3OH have been detected co-spatially (Booth et al., 2021a, b, 2023; Brunken et al., 2022), indicating a hot-corino-like chemistry in the warm ( K) region. The detection of SO and the non-detection of CH3OH in the L1489 IRS disk may indicate that the temperature is not high enough for CH3OH ice to thermally sublimate: while the sublimation temperature of SO is K (e.g., Sakai et al., 2014; Aota et al., 2015; Miura et al., 2017), a higher temperature ( K) is required for CH3OH ice to sublimate. Alternatively, the emitting region size of CH3OH molecules may be smaller than that of SO and the CH3OH emission is thus beam-diluted and/or absorbed by the bright continuum emission. Higher angular resolution observations at lower frequencies, where the dust continuum emission is expected to be more optically thin, would be a key to revealing the chemistry in the innermost region of the L1489 IRS disk.
5.6 Warped disk structures
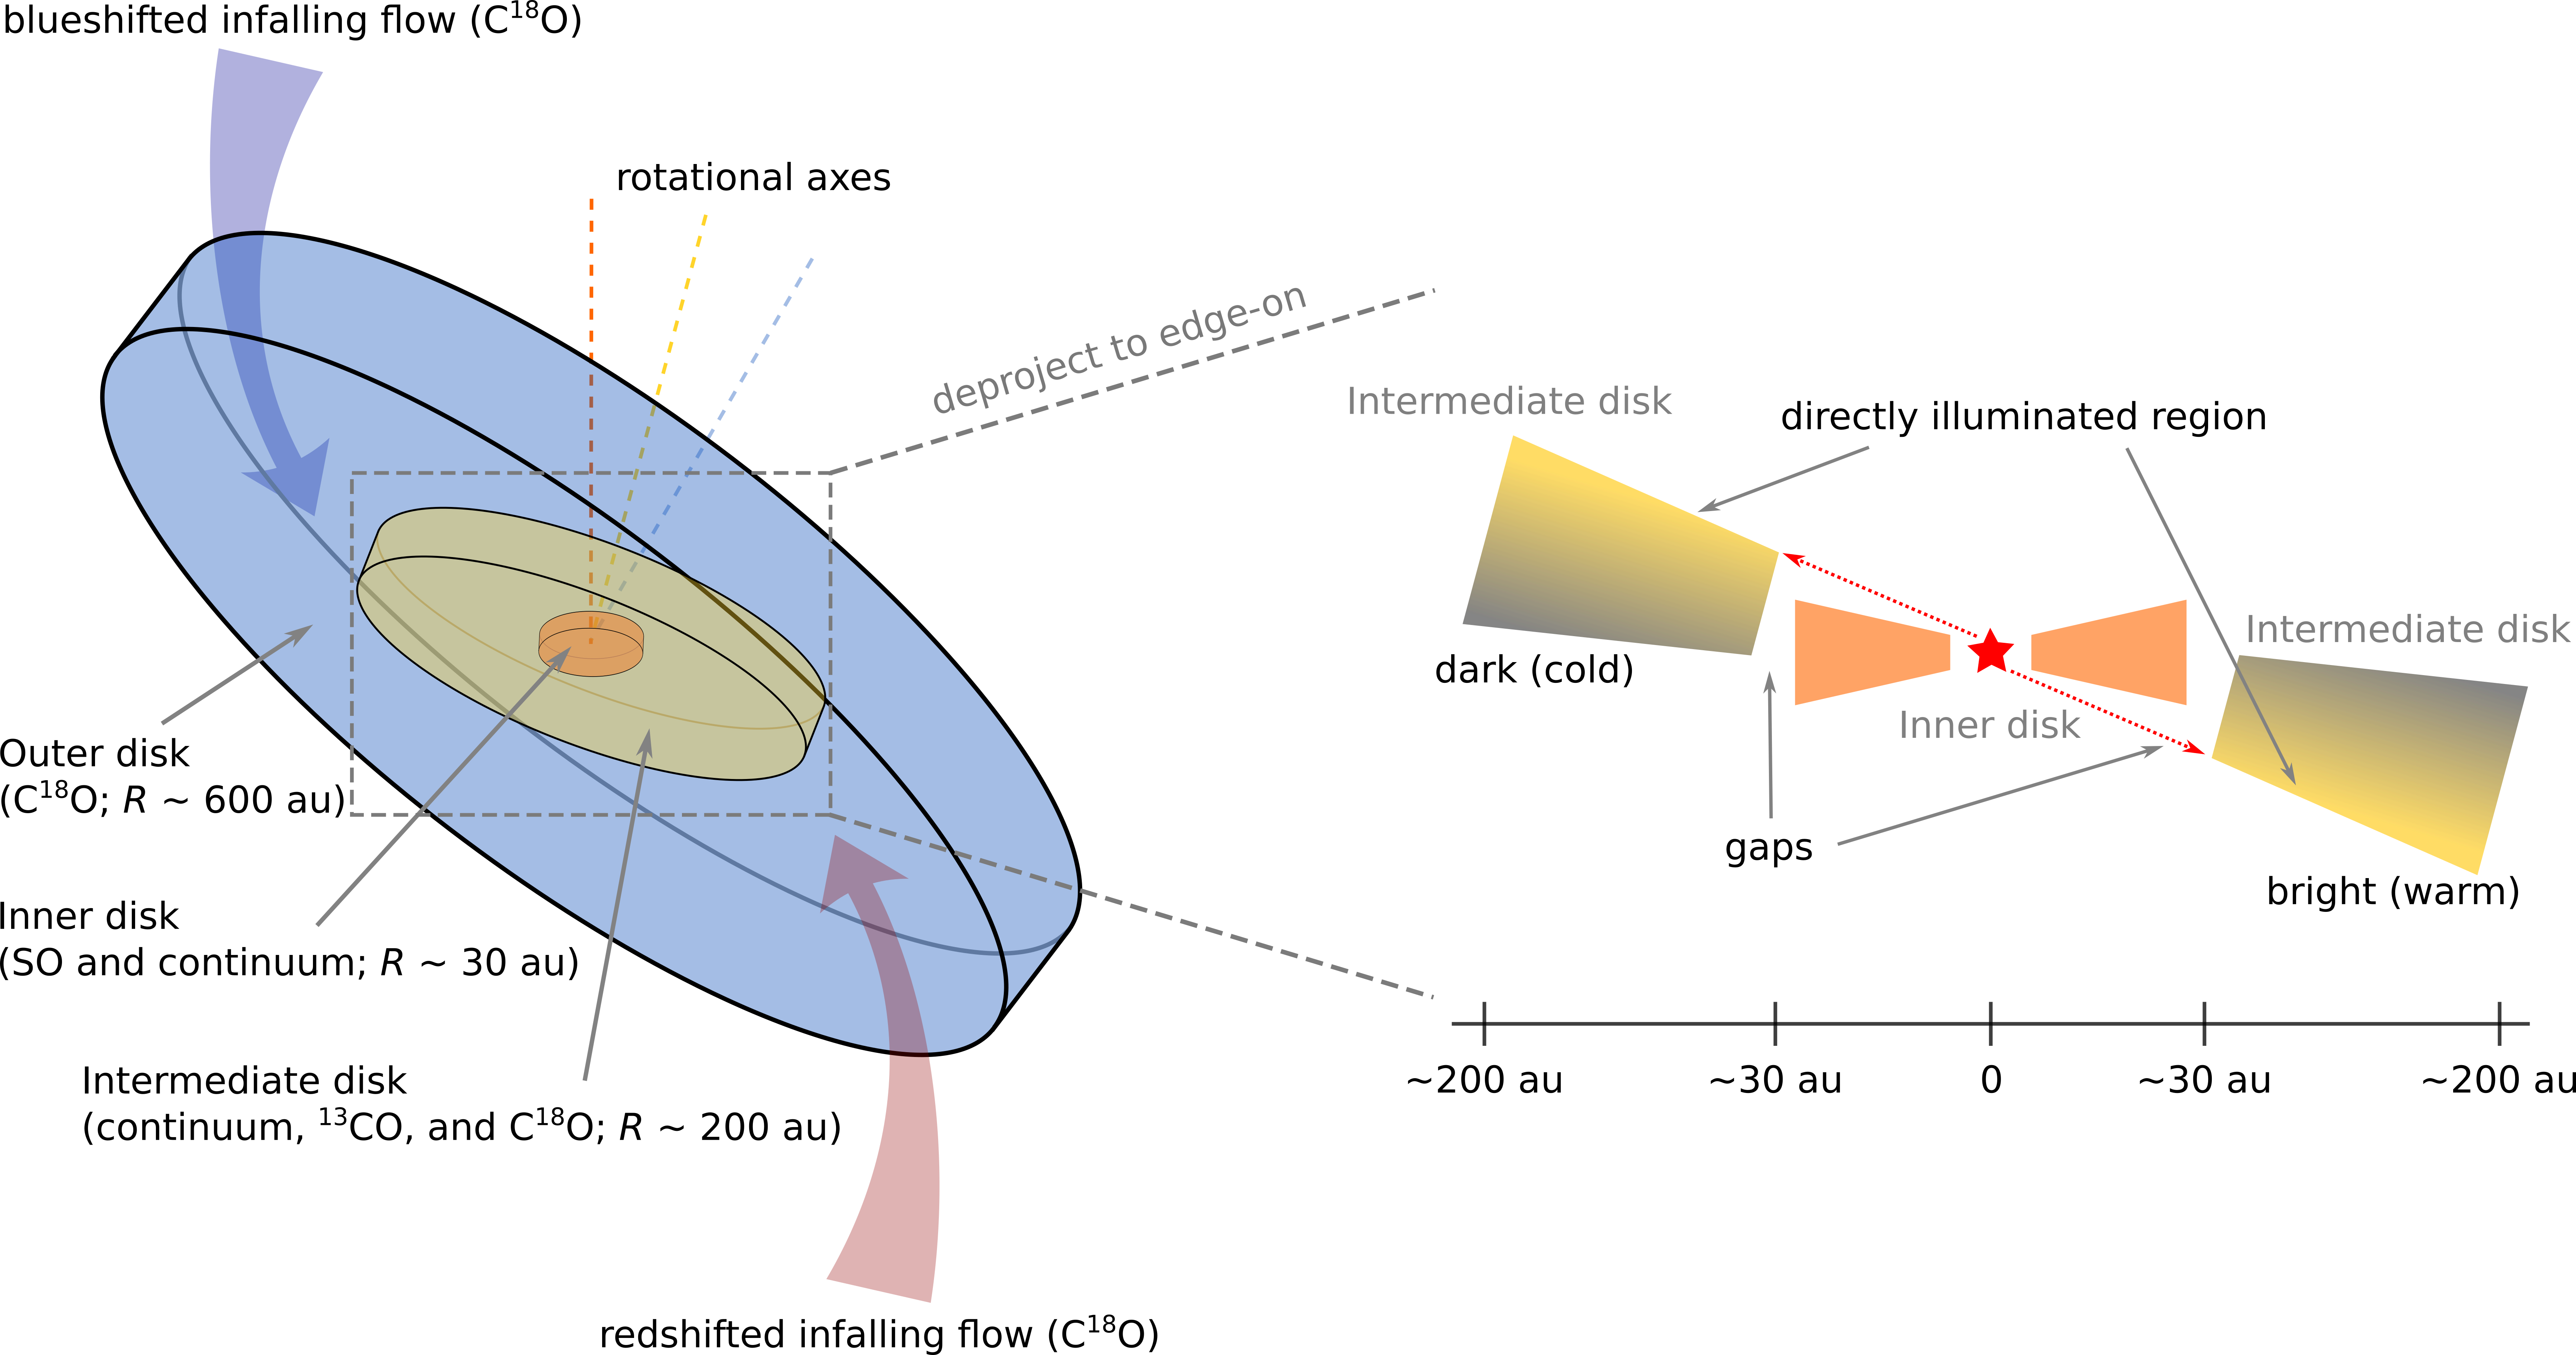
We also found that the compact SO emission shows a velocity gradient along a slightly different direction from the disk traced by 13CO and C18O. The left panel of Figure 9 shows the velocity-integrated intensity map of the high-velocity component (8–12 km s-1 with respect to ) of the redshifted and blueshifted SO emission. The position angle of the velocity gradient () is slightly () tilted with respect to the position angle () of the disk traced by 13CO, C18O, and dust continuum. The PV diagram of the SO emission along the position angle of (the right panel of Figure 9) indicates that the highest-velocity component of the SO emission is fairly consistent with the Keplerian velocity derived from the C18O analysis (see Section 4.2), suggesting that the compact SO emission originates from the innermost rotating disk.
The slight tilt of the velocity gradient direction is highly intriguing. While the non-axisymmetric emission distributions in the upper layers of the disk may result in such an appearance, the most straightforward interpretation is that the disk is warped; the rotation axis of the innermost SO disk is slightly () misaligned with respect to that of the outer disk, while the misalignment may be underestimated due to the projection effect. Observations of protostellar/protoplanetary disks have shown that many of those have misaligned or warped structures: e.g., the L1527 IRS disk (Sakai et al., 2018) and the GW Ori disk (Bi et al., 2020; Kraus et al., 2020). In the L1489 IRS disk, a warped structure at the outer radius au is also found by Sai et al. (2020).
With this innermost tilted disk, the observed features in both dust and molecular line emission may be explained consistently. The dust gap and the potential gas gap suggested by the C18O emission at au (see Section 5.1) can be the boundary between the outer disk and the innermost disk (e.g., Nealon et al., 2018). Furthermore, a tilted disk can cast a shadow on the outer disk and make an azimuthal variation in the temperature of the outer disk via irradiation (Figure 10). As a consequence, azimuthal brightness asymmetries in dust continuum and molecular line emission are expected (e.g., Facchini et al., 2018; Young et al., 2021). Indeed, our observations show a slightly weaker dust continuum emission on the northeastern side of the disk (Figure 1), which is consistent with the expectation from the misalignment direction of the innermost SO disk and the configuration of the outer disk; i.e., the northeastern side is shadowed considering that the southern side is the far side of the disk (see Figure 10). The 13CO and C18O emissions also show lower brightness temperatures on the northeastern side (Figure 3; see also Section 5.3).
We discuss the possible origins of the disk warp at 30 au based on the present observations and theoretical studies. Numerical simulations suggest that warped disks can be formed by the interaction with an embedded planet (e.g, Nealon et al., 2018; Zhu, 2019). If the orbital plane of the planet is inclined with respect to the outer disk, the inner disk can warp from the outer disk. If we assume that the observed gap is opened by a planet with an inclined orbit, the expected planet mass from the gap depth (Section 5.1) is slightly modified. Zhu (2019) revised Equation 8 considering the inclination of the planet orbit (see also Kanagawa et al. 2015). Based on Equation (12) and (13) in Zhu (2019), the expected planet mass would be a factor of – larger than the estimate in Section 5.1, i.e., –, assuming orbital inclinations of – and a typical disk aspect ratio of –.
Theoretical works have shown that the warped disk structure can also be formed by an inclined binary (e.g., Nixon et al., 2013; Facchini et al., 2018). Nixon et al. (2013) suggests that the binary torque can tear the disk and break it into two, inner and outer, disks with a misalignment. Numerical simulations of a circumbinary disk also showed that the circumbinary disk is broken into misaligned outer and inner disks (Facchini et al., 2018). The binarity of L1489 IRS has been discussed in previous studies, although there is still no direct evidence that L1489 IRS is a binary. Sai et al. (2020) derived an upper limit on the separation of the binary ( au) based on a scattered-light image obtained with the Hubble Space Telescope (Padgett et al., 1999). Although our higher resolution observations of the dust emission in mm wavelength do not spatially resolve the central compact emission either, we can provide a tighter constraint on the upper limit of the binary separation. Considering that the spatial resolution of the robust image is or au and that the emission is spatially unresolved, i.e., a point source (see Appendix A), the separation would be au.
Can such a close, inclined binary form the gap at au observed in the dust (and potentially C18O) emission? Nixon et al. (2013) simulated the binary system with a misaligned orbit with respect to its circumbinary disk and derived a formula to estimate the disk-breaking radius. Assuming the bending-wave regime ( where is the viscosity parameter), the possible maximum disk-breaking (or gap) radius would be au. Here we assume an inclination angle of the binary orbit with respect to the disk of , an equal-mass binary, and a typical disk aspect ratio of , which maximizes the disk-breaking radius. While this expected maximum gap radius of au seemingly does not explain the observed gap radius of au, the latter may be overestimated due to the beam smearing effect: the dust ring width is spatially resolved while the central compact component is unresolved (see Table 2), and the actual gap radius (i.e., the local minima of the radial profile) could thus be smaller. Therefore, it may be possible to form the observed gap by the inner inclined binary.
Warped structures are also formed by the change of the angular momentum in the envelope and the disk during the accretion process. Hydrodynamical simulations show that the temporal variation of the angular momentum axis direction during the gas infall indeed results in a warped disk system (Sai et al., 2020). The outer warped structure at au observed in C18O is likely to be formed by this mechanism rather than a binary (Sai et al., 2020). Similarly, a misalignment of the magnetic field and the angular momentum axis of the core results in a warped disk (Matsumoto et al., 2017; Hirano & Machida, 2019; Hirano et al., 2020). The warped structure of the L1489 IRS disk with tilts at au and au suggests the gradual change of the angular momentum axis of the infalling material.
6 Summary
We have observed the disk around the Class I protostar L1489 IRS in the 1.3 mm continuum and 13CO 2–1, C18O 2–1, and SO 65–54 lines at spatial resolutions of 01, as part of the eDisk ALMA Large Program. Our findings are summarized as follows:
-
1.
In the 1.3 mm continuum emission, we detected a disk-like elongated structure with a non-axisymmetric, faint tails in the outermost region ( or au) and a ring-like structure at 04 (or au). The dust continuum ring also shows azimuthal asymmetry, where the southwestern side is brighter than the northeastern side. We also detected a centrally peaked compact emission which is not spatially resolved. Furthermore, two tentative shoulder-like substructures at 15 (or 220 au) and 23 (or 340 au) are also identified in the radial intensity profile of the tapered continuum image.
-
2.
The high-velocity components of the 13CO and C18O emissions trace the protostellar disk. While 13CO originates from the disk surface as suggested by the shift of the emission peak along the disk minor axis, C18O traces the region near the midplane. The 13CO and C18O emissions also show (slightly) higher brightness temperatures on the southwestern side of the disk. In the outer region (), 13CO shows an extended structure, suggesting that it traces the envelope. C18O traces the warped disk structure as well as the streamer-like accretion flow in the outer region, which is consistent with the previous studies (Yen et al., 2014; Sai et al., 2020).
-
3.
The SO emission distribution shows a highly complex structure. While a compact, prominent emission appears in the innermost region (), emission in the outer region is diffuse and non-uniform. The central compact component exhibits a velocity gradient over the extremely high velocities (– km s-1 with respect to the systemic velocity). In the outer region, multiple localized enhancements of the peak brightness temperature are identified.
-
4.
We performed an analytical fit to the dust continuum emission in the visibility domain, from which we confirm that the observed visibility can be explained by a simple model that consists of two Gaussian components (central compact one and outer extended one) and one Gaussian ring at (or 56 au). We also precisely characterized the properties of each component and dust disk geometry through the fit. While the central component is quite compact ( au), the size of the outer component is au. The disk inclination and position angles are also constrained to be and , respectively.
- 5.
-
6.
We discuss the possible origin of the observed substructures. The coincidence between the dust ring and the peak of the C18O radial intensity profile suggests that the gas disk also has a ring/gap structure. If we assume that the gas gap is carved by a formed planet, the planet mass would be . Alternatively, the grain growth may be responsible for the observed dust ring, as the ring radius is consistent with the prediction of the dust coagulation model.
-
7.
The non-uniform distributions and localized brightness temperature increases of the SO emission suggest that the origin of the outer diffuse SO emission is likely to be an accretion shock caused by the infalling material. On the other hand, we suggest that the central compact component originates from the thermal sublimation of SO and/or its precursor molecules at the warm inner disk. Indeed, the disk model of L1489 IRS shows a midplane dust temperature of K at the SO emitting radii, which is comparable to the sublimation temperature of SO (50 K).
-
8.
We also find that the velocity structure of the compact SO emission is consistent with the Keplerian rotation and that its velocity gradient direction is slightly () misaligned with respect to that of the disk traced by 13CO and C18O. We propose that the inner disk is tilted, i.e., the rotation axis of the inner disk traced by SO is misaligned with respect to the outer disk traced by 13CO and C18O. The disk misalignment can make shadowed region in the outer disk, which explains the observed azimuthal asymmetry in the brightness of the dust and molecular line emission. We discuss the possible origins of the misalignment, planet or binary with an inclined orbit, or the temporal variation of the angular momentum axis direction during the gas infall.
-
9.
Combined with the previous studies, the L1489 disk has a warped structure with tilts at 30 au and 200 au (Figure 10). While the tilt at 30 au can be explained by a planet or binary with an inclined orbit, the temporal variation of the angular momentum axis direction during the gas infall could explain the whole warped structure.
Acknowledgments
This paper makes use of the following ALMA data: ADS/JAO.ALMA#2019.1.00261.L,
ADS/JAO.ALMA#2019.A.00034.S.
ALMA is a partnership of ESO (representing its member states), NSF (USA) and NINS (Japan), together with NRC (Canada), MOST and ASIAA (Taiwan), and KASI (Republic of Korea), in cooperation with the Republic of Chile. The Joint ALMA Observatory is operated by ESO, AUI/NRAO and NAOJ. The National Radio Astronomy Observatory is a facility of the National Science Foundation operated
under cooperative agreement by Associated Universities, Inc. Y.Y. is supported by the International Graduate Program for Excellence in Earth-Space Science (IGPEES), World-leading Innovative Graduate Study (WINGS) Program of the University of Tokyo. Y.A. acknowledges support by NAOJ ALMA Scientific Research Grant code 2019-13B, Grant-in-Aid for Scientific Research (S) 18H05222, and Grant-in-Aid for Transformative Research Areas (A) 20H05844 and 20H05847. N.O. acknowledges support from National Science and Technology Council (NSTC) in Taiwan through the grants NSTC 109-2112-M-001-051 and 110-2112-M-001-031. J.J.T. acknowledges support from NASA XRP 80NSSC22K1159. J.K.J. and R.S. acknowledge support from the Independent Research Fund Denmark (grant No. 0135-00123B). S.T. is supported by JSPS KAKENHI Grant Numbers 21H00048 and 21H04495. This work was supported by NAOJ ALMA Scientific Research Grant Code 2022-20A. I.d.G. acknowledges support from grant PID2020-114461GB-I00, funded by
MCIN/AEI/10.13039/501100011033. P.M.K. acknowledges support from NSTC 108-2112- M-001-012, NSTC 109-2112-M-001-022 and NSTC 110-2112-M-001-057. W.K. was supported by the National Research Foundation of Korea (NRF) grant funded by the Korea government (MSIT) (NRF-2021R1F1A1061794). S.P.L. and T.J.T. acknowledge grants from the National Science and Technology Council of Taiwan
106-2119-M-007-021-MY3 and 109-2112-M-007-010-MY3. C.W.L. is supported by the Basic Science Research Program through the National Research Foundation of Korea (NRF) funded by the Ministry of Education, Science and Technology (NRF- 2019R1A2C1010851), and by the Korea Astronomy and Space Science Institute grant funded by the Korea government (MSIT; Project No. 2022-1-840-05). J.E.L. is supported by the National Research Foundation of Korea (NRF) grant funded by the Korean government (MSIT) (grant number 2021R1A2C1011718). Z.Y.L. is supported in part by NASA NSSC20K0533 and NSF AST-1910106. Z.Y.D.L. acknowledges support from NASA 80NSSC18K1095, the Jefferson Scholars Foundation, the NRAO ALMA Student Observing Support (SOS) SOSPA8-003, the Achievements Rewards for College Scientists (ARCS) Foundation Washington Chapter, the Virginia Space Grant Consortium (VSGC), and UVA research computing (RIVANNA). L.W.L. acknowledges support from NSF AST-2108794. S.M. is supported by JSPS KAKENHI Grant Numbers JP21J00086 and 22K14081. S.N. acknowledges support from the National Science Foundation through the Graduate Research Fellowship Program under Grant No. 2236415. Any opinions, findings, and conclusions or recommendations expressed in this material are those of the authors and do not necessarily reflect the views of the National Science Foundation. H.-W.Y. acknowledges support from the National Science and Technology Council (NSTC) in Taiwan through the grant NSTC 110-2628-M-001-003-MY3 and from the Academia Sinica Career Development Award (AS-CDA-111-M03). M.L.R.H. acknowledges support from the Michigan Society of Fellows.
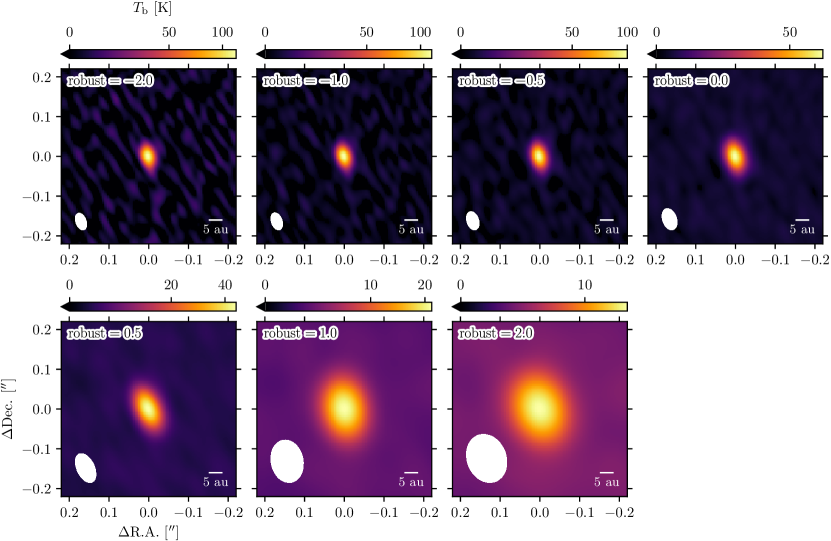
Appendix A Continuum Maps with different robust parameters
Figure 11 shows the continuum emission maps at the central region imaged with different robust parameters, ranging from (similar to uniform weighting) to (similar to natural weighting). The central compact component is not spatially resolved even with robust where the beam size is (or 6.9 au 3.4 au).
Appendix B Generation and selection of radial intensity profiles
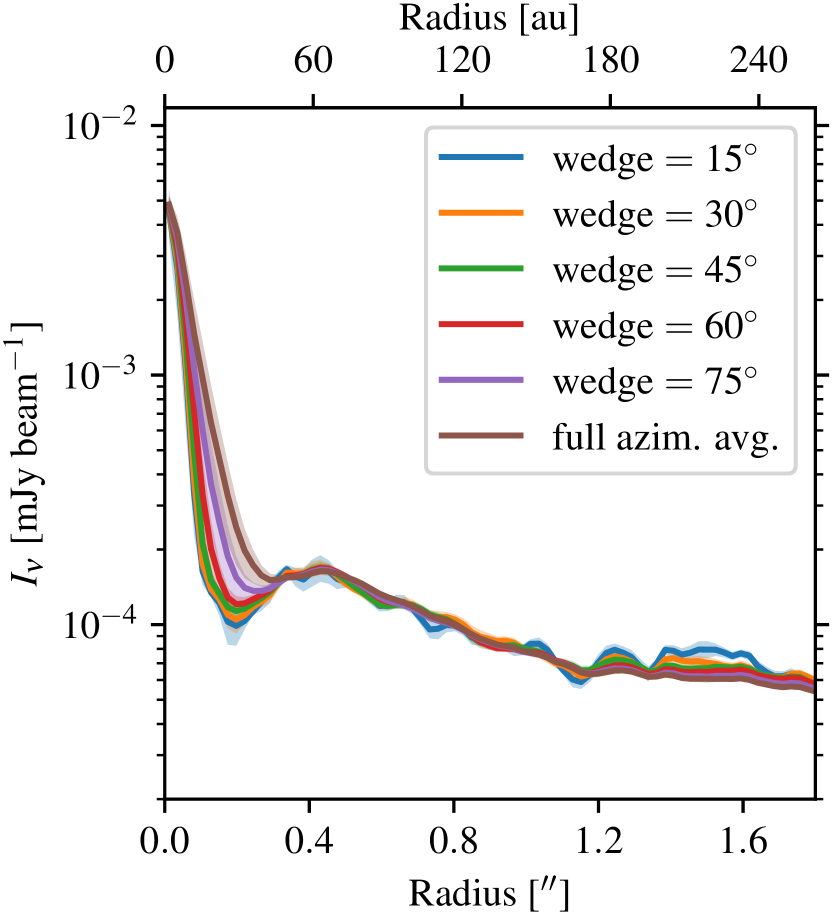
In this section, we describe the detailed method to generate and select the radial intensity profiles of the continuum and line emission. We follow the methodology described in Law et al. (2021b). We generate the profiles by deprojecting the emission maps (continuum) or velocity-integrated emission maps (line). To deproject the disk coordinates, we assume the disk geometry ( and PA ) based on the results of the visibility analysis (Section 4.1) for both continuum and line profiles. The radial bin size is one-quarter of the major axis of the synthesized beam. We averaged the emission in each radial bin. The uncertainty is calculated as the standard error on the region over which the emission is averaged. We generated the continuum intensity profiles averaged over several certain azimuthal wedges ( and (i.e., full azimuthal average)) with respect to the disk major axis, and compare them in Figure 12. While the wider wedges result in low-contrast substructures due to the coarser effective resolutions in the inclined disk, narrower wedges show wavy features that are not considered actual substructures in the outer radii. We selected the profile with wedge as the representative profiles to compromise those two effects. For the line emission, we choose the same wedge () as the continuum emission to generate the radial intensity profiles at similar effective resolutions. We note that the deprojection here assumes a geometrically thin disk and does not consider the 3D structures of the disk.
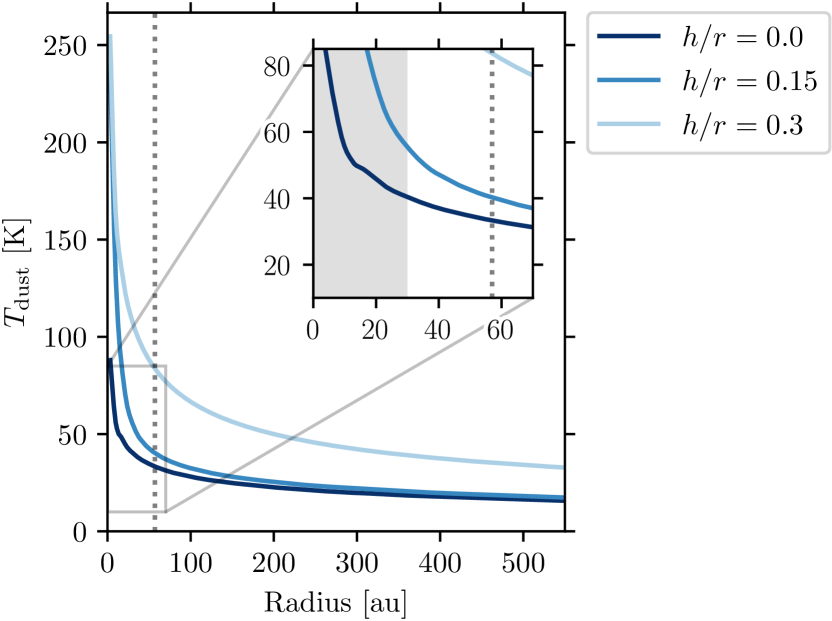
Appendix C Radiative transfer model of the L1489 IRS disk
Figure 13 shows the dust temperature profiles of the L1489 IRS disk at different disk scale heights ( (midplane) and ) calculated by the radiative transfer modeling by Sai et al. (2020). The readers are referred to the original paper for the details of modeling. In the emitting region of SO (the inset of Figure 13), the dust temperature is higher than 40 K, comparable to the sublimation temperature of SO molecules (50 K; see Section 5.5).
References
- ALMA Partnership et al. (2015) ALMA Partnership, Brogan, C. L., Pérez, L. M., et al. 2015, ApJ, 808, L3, doi: 10.1088/2041-8205/808/1/L3
- Alves et al. (2017) Alves, F. O., Girart, J. M., Caselli, P., et al. 2017, A&A, 603, L3, doi: 10.1051/0004-6361/201731077
- Andrews & Williams (2005) Andrews, S. M., & Williams, J. P. 2005, ApJ, 631, 1134, doi: 10.1086/432712
- Andrews et al. (2012) Andrews, S. M., Wilner, D. J., Hughes, A. M., et al. 2012, ApJ, 744, 162, doi: 10.1088/0004-637X/744/2/162
- Andrews et al. (2018) Andrews, S. M., Huang, J., Pérez, L. M., et al. 2018, ApJ, 869, L41, doi: 10.3847/2041-8213/aaf741
- Ansdell et al. (2016) Ansdell, M., Williams, J. P., van der Marel, N., et al. 2016, ApJ, 828, 46, doi: 10.3847/0004-637X/828/1/46
- Ansdell et al. (2018) Ansdell, M., Williams, J. P., Trapman, L., et al. 2018, ApJ, 859, 21, doi: 10.3847/1538-4357/aab890
- Aota et al. (2015) Aota, T., Inoue, T., & Aikawa, Y. 2015, ApJ, 799, 141, doi: 10.1088/0004-637X/799/2/141
- Aso & Machida (2020) Aso, Y., & Machida, M. N. 2020, ApJ, 905, 174, doi: 10.3847/1538-4357/abc6fc
- Aso & Sai (2023) Aso, Y., & Sai, J. 2023, jinshisai/SLAM: First Release of SLAM, v1.0.0, Zenodo, doi: 10.5281/zenodo.7783868
- Aso et al. (2015) Aso, Y., Ohashi, N., Saigo, K., et al. 2015, ApJ, 812, 27, doi: 10.1088/0004-637X/812/1/27
- Astropy Collaboration et al. (2013) Astropy Collaboration, Robitaille, T. P., Tollerud, E. J., et al. 2013, A&A, 558, A33, doi: 10.1051/0004-6361/201322068
- Bae et al. (2022) Bae, J., Teague, R., Andrews, S. M., et al. 2022, ApJ, 934, L20, doi: 10.3847/2041-8213/ac7fa3
- Beckwith et al. (1990) Beckwith, S. V. W., Sargent, A. I., Chini, R. S., & Guesten, R. 1990, AJ, 99, 924, doi: 10.1086/115385
- Benisty et al. (2021) Benisty, M., Bae, J., Facchini, S., et al. 2021, ApJ, 916, L2, doi: 10.3847/2041-8213/ac0f83
- Bi et al. (2020) Bi, J., van der Marel, N., Dong, R., et al. 2020, ApJ, 895, L18, doi: 10.3847/2041-8213/ab8eb4
- Booth et al. (2023) Booth, A. S., Ilee, J. D., Walsh, C., et al. 2023, A&A, 669, A53, doi: 10.1051/0004-6361/202244472
- Booth et al. (2021a) Booth, A. S., van der Marel, N., Leemker, M., van Dishoeck, E. F., & Ohashi, S. 2021a, A&A, 651, L6, doi: 10.1051/0004-6361/202141057
- Booth et al. (2021b) Booth, A. S., Walsh, C., Terwisscha van Scheltinga, J., et al. 2021b, Nature Astronomy, 5, 684, doi: 10.1038/s41550-021-01352-w
- Brinch et al. (2007) Brinch, C., Crapsi, A., Jørgensen, J. K., Hogerheijde, M. R., & Hill, T. 2007, A&A, 475, 915, doi: 10.1051/0004-6361:20078249
- Brunken et al. (2022) Brunken, N. G. C., Booth, A. S., Leemker, M., et al. 2022, A&A, 659, A29, doi: 10.1051/0004-6361/202142981
- Casassus & Cárcamo (2022) Casassus, S., & Cárcamo, M. 2022, MNRAS, 513, 5790, doi: 10.1093/mnras/stac1285
- Cataldi et al. (2021) Cataldi, G., Yamato, Y., Aikawa, Y., et al. 2021, ApJS, 257, 10, doi: 10.3847/1538-4365/ac143d
- Cieza et al. (2016) Cieza, L. A., Casassus, S., Tobin, J., et al. 2016, Nature, 535, 258, doi: 10.1038/nature18612
- Czekala et al. (2021) Czekala, I., Loomis, R. A., Teague, R., et al. 2021, ApJS, 257, 2, doi: 10.3847/1538-4365/ac1430
- de Gregorio-Monsalvo et al. (2013) de Gregorio-Monsalvo, I., Ménard, F., Dent, W., et al. 2013, A&A, 557, A133, doi: 10.1051/0004-6361/201321603
- Dutrey et al. (2017) Dutrey, A., Guilloteau, S., Piétu, V., et al. 2017, A&A, 607, A130, doi: 10.1051/0004-6361/201730645
- Endres et al. (2016) Endres, C. P., Schlemmer, S., Schilke, P., Stutzki, J., & Müller, H. S. P. 2016, Journal of Molecular Spectroscopy, 327, 95, doi: 10.1016/j.jms.2016.03.005
- Facchini et al. (2017) Facchini, S., Birnstiel, T., Bruderer, S., & van Dishoeck, E. F. 2017, A&A, 605, A16, doi: 10.1051/0004-6361/201630329
- Facchini et al. (2018) Facchini, S., Juhász, A., & Lodato, G. 2018, MNRAS, 473, 4459, doi: 10.1093/mnras/stx2523
- Flores et al. (2021) Flores, C., Duchêne, G., Wolff, S., et al. 2021, AJ, 161, 239, doi: 10.3847/1538-3881/abeb1e
- Foreman-Mackey et al. (2013) Foreman-Mackey, D., Hogg, D. W., Lang, D., & Goodman, J. 2013, PASP, 125, 306, doi: 10.1086/670067
- Garufi et al. (2022) Garufi, A., Podio, L., Codella, C., et al. 2022, A&A, 658, A104, doi: 10.1051/0004-6361/202141264
- Harsono et al. (2018) Harsono, D., Bjerkeli, P., van der Wiel, M. H. D., et al. 2018, Nature Astronomy, 2, 646, doi: 10.1038/s41550-018-0497-x
- Hirano & Machida (2019) Hirano, S., & Machida, M. N. 2019, MNRAS, 485, 4667, doi: 10.1093/mnras/stz740
- Hirano et al. (2020) Hirano, S., Tsukamoto, Y., Basu, S., & Machida, M. N. 2020, ApJ, 898, 118, doi: 10.3847/1538-4357/ab9f9d
- Hogerheijde & Sandell (2000) Hogerheijde, M. R., & Sandell, G. 2000, ApJ, 534, 880, doi: 10.1086/308795
- Hogerheijde et al. (1998) Hogerheijde, M. R., van Dishoeck, E. F., Blake, G. A., & van Langevelde, H. J. 1998, ApJ, 502, 315, doi: 10.1086/305885
- Jorsater & van Moorsel (1995) Jorsater, S., & van Moorsel, G. A. 1995, AJ, 110, 2037, doi: 10.1086/117668
- Kanagawa et al. (2015) Kanagawa, K. D., Muto, T., Tanaka, H., et al. 2015, ApJ, 806, L15, doi: 10.1088/2041-8205/806/1/L15
- Keppler et al. (2018) Keppler, M., Benisty, M., Müller, A., et al. 2018, A&A, 617, A44, doi: 10.1051/0004-6361/201832957
- Kraus et al. (2020) Kraus, S., Kreplin, A., Young, A. K., et al. 2020, Science, 369, 1233, doi: 10.1126/science.aba4633
- Kwon et al. (2011) Kwon, W., Looney, L. W., & Mundy, L. G. 2011, ApJ, 741, 3, doi: 10.1088/0004-637X/741/1/3
- Lambrechts & Johansen (2014) Lambrechts, M., & Johansen, A. 2014, A&A, 572, A107, doi: 10.1051/0004-6361/201424343
- Law et al. (2021a) Law, C. J., Teague, R., Loomis, R. A., et al. 2021a, ApJS, 257, 4, doi: 10.3847/1538-4365/ac1439
- Law et al. (2021b) Law, C. J., Loomis, R. A., Teague, R., et al. 2021b, ApJS, 257, 3, doi: 10.3847/1538-4365/ac1434
- Law et al. (2022) Law, C. J., Crystian, S., Teague, R., et al. 2022, ApJ, 932, 114, doi: 10.3847/1538-4357/ac6c02
- Lee et al. (2017) Lee, C.-F., Li, Z.-Y., Ho, P. T. P., et al. 2017, Science Advances, 3, e1602935, doi: 10.1126/sciadv.1602935
- Lee et al. (2018) Lee, C. W., Kim, G., Myers, P. C., et al. 2018, ApJ, 865, 131, doi: 10.3847/1538-4357/aadcf6
- Lee et al. (2019) Lee, J.-E., Lee, S., Baek, G., et al. 2019, Nature Astronomy, 3, 314, doi: 10.1038/s41550-018-0680-0
- Lin et al. (2023) Lin, Z.-Y. D., Li, Z.-Y., Tobin, J. J., et al. 2023, ApJ, 0, 0, doi: 0
- Long et al. (2022) Long, F., Andrews, S. M., Rosotti, G., et al. 2022, ApJ, 931, 6, doi: 10.3847/1538-4357/ac634e
- Maret et al. (2020) Maret, S., Maury, A. J., Belloche, A., et al. 2020, A&A, 635, A15, doi: 10.1051/0004-6361/201936798
- Matsumoto et al. (2017) Matsumoto, T., Machida, M. N., & Inutsuka, S.-i. 2017, ApJ, 839, 69, doi: 10.3847/1538-4357/aa6a1c
- McMullin et al. (2007) McMullin, J. P., Waters, B., Schiebel, D., Young, W., & Golap, K. 2007, in Astronomical Society of the Pacific Conference Series, Vol. 376, Astronomical Data Analysis Software and Systems XVI, ed. R. A. Shaw, F. Hill, & D. J. Bell, 127
- Mercimek et al. (2022) Mercimek, S., Codella, C., Podio, L., et al. 2022, A&A, 659, A67, doi: 10.1051/0004-6361/202141790
- Miura et al. (2017) Miura, H., Yamamoto, T., Nomura, H., et al. 2017, ApJ, 839, 47, doi: 10.3847/1538-4357/aa67df
- Motte & André (2001) Motte, F., & André, P. 2001, A&A, 365, 440, doi: 10.1051/0004-6361:20000072
- Müller et al. (2005) Müller, H. S. P., Schlöder, F., Stutzki, J., & Winnewisser, G. 2005, Journal of Molecular Structure, 742, 215, doi: 10.1016/j.molstruc.2005.01.027
- Müller et al. (2001) Müller, H. S. P., Thorwirth, S., Roth, D. A., & Winnewisser, G. 2001, A&A, 370, L49, doi: 10.1051/0004-6361:20010367
- Nealon et al. (2018) Nealon, R., Dipierro, G., Alexander, R., Martin, R. G., & Nixon, C. 2018, MNRAS, 481, 20, doi: 10.1093/mnras/sty2267
- Nixon et al. (2013) Nixon, C., King, A., & Price, D. 2013, MNRAS, 434, 1946, doi: 10.1093/mnras/stt1136
- Öberg et al. (2015) Öberg, K. I., Furuya, K., Loomis, R., et al. 2015, ApJ, 810, 112, doi: 10.1088/0004-637X/810/2/112
- Öberg et al. (2021) Öberg, K. I., Guzmán, V. V., Walsh, C., et al. 2021, ApJS, 257, 1, doi: 10.3847/1538-4365/ac1432
- Ohashi et al. (2023) Ohashi, N., Tobin, J. J., Jørgensen, J. K., et al. 2023, ApJ, 0, 0, doi: 0
- Ohashi et al. (2014) Ohashi, N., Saigo, K., Aso, Y., et al. 2014, ApJ, 796, 131, doi: 10.1088/0004-637X/796/2/131
- Ohashi et al. (2022a) Ohashi, S., Kobayashi, H., Sai, J., & Sakai, N. 2022a, arXiv e-prints, arXiv:2206.07800. https://arxiv.org/abs/2206.07800
- Ohashi et al. (2022b) Ohashi, S., Nakatani, R., Liu, H. B., et al. 2022b, ApJ, 934, 163, doi: 10.3847/1538-4357/ac794e
- Ohashi et al. (2021) Ohashi, S., Kobayashi, H., Nakatani, R., et al. 2021, ApJ, 907, 80, doi: 10.3847/1538-4357/abd0fa
- Okuzumi et al. (2016) Okuzumi, S., Momose, M., Sirono, S.-i., Kobayashi, H., & Tanaka, H. 2016, ApJ, 821, 82, doi: 10.3847/0004-637X/821/2/82
- Padgett et al. (1999) Padgett, D. L., Brandner, W., Stapelfeldt, K. R., et al. 1999, AJ, 117, 1490, doi: 10.1086/300781
- Panić et al. (2009) Panić, O., Hogerheijde, M. R., Wilner, D., & Qi, C. 2009, A&A, 501, 269, doi: 10.1051/0004-6361/200911883
- Pinte et al. (2016) Pinte, C., Dent, W. R. F., Ménard, F., et al. 2016, ApJ, 816, 25, doi: 10.3847/0004-637X/816/1/25
- Pinte et al. (2018a) Pinte, C., Price, D. J., Ménard, F., et al. 2018a, ApJ, 860, L13, doi: 10.3847/2041-8213/aac6dc
- Pinte et al. (2018b) Pinte, C., Ménard, F., Duchêne, G., et al. 2018b, A&A, 609, A47, doi: 10.1051/0004-6361/201731377
- Roccatagliata et al. (2020) Roccatagliata, V., Franciosini, E., Sacco, G. G., Randich, S., & Sicilia-Aguilar, A. 2020, A&A, 638, A85, doi: 10.1051/0004-6361/201936401
- Ruíz-Rodríguez et al. (2017) Ruíz-Rodríguez, D., Cieza, L. A., Williams, J. P., et al. 2017, MNRAS, 468, 3266, doi: 10.1093/mnras/stx703
- Sai et al. (2022) Sai, J., Ohashi, N., Maury, A. J., et al. 2022, ApJ, 925, 12, doi: 10.3847/1538-4357/ac341d
- Sai et al. (2020) Sai, J., Ohashi, N., Saigo, K., et al. 2020, ApJ, 893, 51, doi: 10.3847/1538-4357/ab8065
- Sakai et al. (2018) Sakai, N., Hanawa, T., Zhang, Y., et al. 2018, Nature, 565, 206, doi: 10.1038/s41586-018-0819-2
- Sakai et al. (2014) Sakai, N., Sakai, T., Hirota, T., et al. 2014, Nature, 507, 78, doi: 10.1038/nature13000
- Sakai et al. (2017) Sakai, N., Oya, Y., Higuchi, A. E., et al. 2017, MNRAS, 467, L76, doi: 10.1093/mnrasl/slx002
- Segura-Cox et al. (2020) Segura-Cox, D. M., Schmiedeke, A., Pineda, J. E., et al. 2020, Nature, 586, 228, doi: 10.1038/s41586-020-2779-6
- Seifried et al. (2016) Seifried, D., Sánchez-Monge, Á., Walch, S., & Banerjee, R. 2016, MNRAS, 459, 1892, doi: 10.1093/mnras/stw785
- Sheehan & Eisner (2017) Sheehan, P. D., & Eisner, J. A. 2017, ApJ, 851, 45, doi: 10.3847/1538-4357/aa9990
- Sheehan & Eisner (2018) —. 2018, ApJ, 857, 18, doi: 10.3847/1538-4357/aaae65
- Sheehan et al. (2020) Sheehan, P. D., Tobin, J. J., Federman, S., Megeath, S. T., & Looney, L. W. 2020, ApJ, 902, 141, doi: 10.3847/1538-4357/abbad5
- Takahashi & Muto (2018) Takahashi, S. Z., & Muto, T. 2018, ApJ, 865, 102, doi: 10.3847/1538-4357/aadda0
- Takakuwa & eDisk team (2022) Takakuwa, S., & eDisk team. 2022, ApJS
- Tamura et al. (1991) Tamura, M., Gatley, I., Waller, W., & Werner, M. W. 1991, ApJ, 374, L25, doi: 10.1086/186063
- Tazzari et al. (2018) Tazzari, M., Beaujean, F., & Testi, L. 2018, MNRAS, 476, 4527, doi: 10.1093/mnras/sty409
- Teague et al. (2019) Teague, R., Bae, J., & Bergin, E. A. 2019, Nature, 574, 378, doi: 10.1038/s41586-019-1642-0
- Teague & Foreman-Mackey (2018) Teague, R., & Foreman-Mackey, D. 2018, Research Notes of the American Astronomical Society, 2, 173, doi: 10.3847/2515-5172/aae265
- Teague et al. (2021) Teague, R., Law, C. J., Huang, J., & Meng, F. 2021, Journal of Open Source Software, 6, 3827, doi: 10.21105/joss.03827
- Tobin et al. (2020) Tobin, J. J., Sheehan, P. D., Megeath, S. T., et al. 2020, ApJ, 890, 130, doi: 10.3847/1538-4357/ab6f64
- Trapman et al. (2019) Trapman, L., Facchini, S., Hogerheijde, M. R., van Dishoeck, E. F., & Bruderer, S. 2019, A&A, 629, A79, doi: 10.1051/0004-6361/201834723
- Tychoniec et al. (2021) Tychoniec, Ł., van Dishoeck, E. F., van’t Hoff, M. L. R., et al. 2021, A&A, 655, A65, doi: 10.1051/0004-6361/202140692
- van der Marel et al. (2013) van der Marel, N., van Dishoeck, E. F., Bruderer, S., et al. 2013, Science, 340, 1199, doi: 10.1126/science.1236770
- van Gelder et al. (2021) van Gelder, M. L., Tabone, B., van Dishoeck, E. F., & Godard, B. 2021, A&A, 653, A159, doi: 10.1051/0004-6361/202141591
- van ’t Hoff et al. (2023) van ’t Hoff, M. L. R., Li, Z.-Y., Tobin, J. J., et al. 2023, ApJ, 0, 0, doi: 0
- van ’t Hoff et al. (2020) van ’t Hoff, M. L. R., Harsono, D., Tobin, J. J., et al. 2020, ApJ, 901, 166, doi: 10.3847/1538-4357/abb1a2
- Villenave et al. (2020) Villenave, M., Ménard, F., Dent, W. R. F., et al. 2020, A&A, 642, A164, doi: 10.1051/0004-6361/202038087
- Villenave et al. (2022) Villenave, M., Stapelfeldt, K. R., Duchêne, G., et al. 2022, ApJ, 930, 11, doi: 10.3847/1538-4357/ac5fae
- Weaver et al. (2018) Weaver, E., Isella, A., & Boehler, Y. 2018, ApJ, 853, 113, doi: 10.3847/1538-4357/aaa481
- Yen et al. (2013) Yen, H.-W., Takakuwa, S., Ohashi, N., & Ho, P. T. P. 2013, ApJ, 772, 22, doi: 10.1088/0004-637X/772/1/22
- Yen et al. (2014) Yen, H.-W., Takakuwa, S., Ohashi, N., et al. 2014, ApJ, 793, 1, doi: 10.1088/0004-637X/793/1/1
- Young et al. (2021) Young, A. K., Alexander, R., Walsh, C., et al. 2021, MNRAS, 505, 4821, doi: 10.1093/mnras/stab1675
- Zhang et al. (2015) Zhang, K., Blake, G. A., & Bergin, E. A. 2015, ApJ, 806, L7, doi: 10.1088/2041-8205/806/1/L7
- Zhang et al. (2021) Zhang, K., Booth, A. S., Law, C. J., et al. 2021, ApJS, 257, 5, doi: 10.3847/1538-4365/ac1580
- Zhang et al. (2018) Zhang, S., Zhu, Z., Huang, J., et al. 2018, ApJ, 869, L47, doi: 10.3847/2041-8213/aaf744
- Zhu (2019) Zhu, Z. 2019, MNRAS, 483, 4221, doi: 10.1093/mnras/sty3358
- Zucker et al. (2020) Zucker, C., Speagle, J. S., Schlafly, E. F., et al. 2020, A&A, 633, A51, doi: 10.1051/0004-6361/201936145
- Zucker et al. (2019) —. 2019, ApJ, 879, 125, doi: 10.3847/1538-4357/ab2388