Impact of Pycnonuclear Fusion Uncertainties on the Cooling of Accreting Neutron Star Crusts
Abstract
The observation of X-rays during quiescence from transiently accreting neutron stars provides unique clues about the nature of dense matter. This, however, requires extensive modeling of the crusts and matching the results to observations. The pycnonuclear fusion reaction rates implemented in these models are theoretically calculated by extending phenomenological expressions and have large uncertainties spanning many orders of magnitude. We present the first sensitivity studies of these pycnonuclear fusion reactions in realistic network calculations. We also couple the reaction network with the thermal evolution code dStar to further study their impact on the neutron star cooling curves in quiescence. Varying the pycnonuclear fusion reaction rates alters the depth at which nuclear heat is deposited although the total heating remains constant. The enhancement of the pycnonuclear fusion reaction rates leads to an overall shallower deposition of nuclear heat. The impurity factors are also altered depending on the type of ashes deposited on the crust. These total changes correspond to a variation of up to 9 eV in the modeled cooling curves. While this is not sufficient to explain the shallow heat source, it is comparable to the observational uncertainties and can still be important for modeling the neutron star crust.
1 Introduction
When neutron stars reside in Low Mass X-ray Binaries (LMXB), they can accrete matter onto their surface from the companion star (Tauris & van den Heuvel, 2006). This accretion can be unstable (Mineshige, 1993) resulting in transient systems with accretion outbursts and quiescent phases. During accretion, nuclear reactions heat the neutron star crust as the crust is compressed by the infalling matter (Sato, 1979; Haensel & Zdunik, 1990, 2008; Gupta et al., 2007, 2008; Shternin et al., 2007; Meisel et al., 2018; Lau et al., 2018; Shchechilin & Chugunov, 2019; Shchechilin et al., 2021). Together with the thermal transport properties, crustal heating determines the thermal structure of the crust. Depending on the depth of the nuclear heat sources, a large fraction of the nuclear heating is directed towards the neutron star core. Crustal heating is therefore also important for modeling the long-term thermal evolution of accreting neutron stars, which can provide constraints on the properties of the neutron star core (e.g., Brown et al., 2018; Ootes et al., 2019; Potekhin et al., 2019).
During the quiescence phase, the crust cools on observable timescales of several months to a few years (Rutledge et al., 2002; Cackett et al., 2006; Shternin et al., 2007; Brown & Cumming, 2009). Observations of the cooling neutron star surface therefore probe directly the thermal structure of the crust and its history of nuclear heating. Comparing models of these cooling curves to observations has led to many new insights into the physics of the neutron star crust such as the well-ordered lattice structure in the crust (Cackett et al., 2006; Shternin et al., 2007; Brown & Cumming, 2009), neutron superfluidity (Shternin et al., 2007; Brown & Cumming, 2009) and the hints for the existence of nuclear pasta at the crust-core transition (Horowitz et al., 2015; Deibel et al., 2017).
Previous studies (Sato, 1979; Haensel & Zdunik, 1990, 2008) have shown that pycnonuclear fusion reactions are the main heat source in crusts of accreting neutron stars. Yakovlev et al. (2006) showed that the theoretical predictions for these rates can be uncertain by 8 to 10 orders of magnitude (See § 2). Here, we investigate for the first time the impact of these uncertainties on the crust temperature profiles and the observable surface cooling during quiescence by varying the pycnonuclear fusion reaction rates in realistic nuclear network calculations.
This is of particular importance in light of previous studies that demonstrated that current estimates of nuclear heating are not sufficient to explain observed quiescent cooling as function of time. Instead, a strong shallow heat source has to be artificially included for models to match observations (Brown & Cumming, 2009; Degenaar et al., 2015; Page & Reddy, 2013; Deibel et al., 2015; Turlione et al., 2015; Merritt et al., 2016; Waterhouse et al., 2016; Parikh et al., 2019; Chamel et al., 2020; Potekhin & Chabrier, 2021). The characteristics of this inferred shallow heat source differ from system to system and even from one outburst to the other for the same system (Degenaar et al., 2019), and also depend on the assumed crust composition (Potekhin & Chabrier, 2021). Typically models require 0.5–2 MeV/u (MeV per accreted nucleon) of additional shallow heating, but for some systems up to of the order of 10 MeV/u (Deibel et al., 2015) appears to be needed (for an alternative interpretation, see Page et al., 2022). The nature and origin of this shallow heat source are unknown. Horowitz et al. (2008) proposed that some of the shallow heating could be due to the nuclear fusion of neutron-rich lighter elements with at shallower depths. However, Lau et al. (2018) showed that not enough energy is released by these reactions to account for the required shallow heating strength. Chamel et al. (2020) point out that fusion of 12C or 16O with subsequent electron captures could provide up to 1.4 MeV/u of shallow heat. For realistic abundances, however, the energy release would be considerably smaller. Furthermore, were such light elements present in significant quantities, they would be expected to burn explosively at relatively shallow depths (Cumming & Bildsten, 2001; Cooper et al., 2009). Our goal here is to determine whether increased fusion reaction rates, within their uncertainties, may shift some fusion reactions to sufficiently shallow depths to reduce the need for an artificially introduced source of shallow heating. The depth where a fusion reaction occurs not only affects the location, but also the total amount of energy released due to changes in the electron chemical potential that affect subsequent electron capture reactions.
The next section briefly describes pycnonuclear fusion reaction rates and the corresponding uncertainties associated with their calculations. After that, we discuss how the network is set up and how the cooling curves are calculated. Then we present the results of our sensitivity studies for a variety of initial compositions, particularly focusing on the cases where we see enhanced nuclear heating at shallower depth. We also identify the most important pycnonuclear fusion reactions that contribute to nuclear heating. Subsequently, we discuss the impact of these sensitivities on the predicted cooling curves which can be directly compared to the observations.
2 Pycnonuclear Fusion Rates and their Uncertainties
Pycnonuclear fusion is density-induced nuclear fusion (Harrison, 1964) enabled by the overlapping zero-point energy vibrations of nuclei. The rates used in our reaction network are calculated following the formalism presented in Yakovlev et al. (2006) for a multi-component plasma (MCP). There are two main contributions to the uncertainties of pycnonuclear fusion reaction rates - nuclear physics uncertainties and plasma physics uncertainties. The nuclear physics uncertainties stem principally from the calculation of the astrophysical S-factors of the reactions. These are calculated using Sao-Paulo potential (Chamon et al., 2002; Chamon, 2007) for describing the nucleus. A universal 9-parameter expression in Beard et al. (2010) was fit to the calculations for 946 reactions involving various isotopes of C, O, Ne and Mg. We use the same parameters for calculating the S-factors of 4844 different reactions from Be to Si in our network. The typical nuclear physics uncertainties are estimated to be two orders of magnitude (Gasques et al., 2007; Umar et al., 2012); however, Carnelli et al. (2014) determined experimentally the fusion S-factors for 10,14,15C + 12C and found excellent agreement with theory. It remains to be seen if this agreement holds for more exotic isotopes and for the fusion of neutron-rich isotopes of heavier elements up to Mg and Si.
In addition to uncertainties in the nuclear physics, plasma physics uncertainties are also present and are even larger than the nuclear uncertainties. They originate from the screening effects due to the Coulomb field of the surrounding plasma particles and uncertain spatial correlations of ions in a multi-component plasma. Overall, the total uncertainties span 8 to 10 orders of magnitude (Yakovlev et al., 2006). Here we use an uncertainty of a factor of in either direction to account for the combined effect of various theoretical uncertainties. Calculations are performed with all pycnonuclear fusion reaction rates increased and decreased by a factor of . Our goal is a “worst case” approach with the simultaneous enhancement and reduction of all pycnonuclear fusion rates. Owing to the strong density dependence of the rates, increased rates primarily lead to a shallower heat deposition whereas decreased rates primarily lead to a deeper heat deposition. We therefore expect that changing all rates simultaneously has the largest effect on the depth distribution of the heating, and thus on predictions of the observable cooling curve. We also use variations of a factor of one hundred in both directions to explore the maximum impact of just the estimated nuclear physics uncertainties.
3 Model
3.1 Nuclear Reaction Network Calculations
We use the same nuclear reaction network as in Lau et al. (2018) and only summarize it briefly here. The network includes a comprehensive set of nuclear reactions including electron capture, decay, neutron capture/emission, and nuclear fusion. To calculate the steady state composition of the accreted neutron star crust, we follow the composition changes of an accreted fluid element due to increasing pressure. In a thin plane-parallel layer, the pressure can be expressed as , where g cm-2 s-1 is the local accretion rate, cm s-2 is the local surface gravity (Newtonian value for a typical neutron star of mass and radius 10 km), and is the time since deposition on the surface. Our accretion rate corresponds to 0.3 of the spherical Eddington accretion rate (8.8 g cm-2 s-1), which is typical for many quasi-persistent transients. The density, , is calculated using an equation of state (Gupta et al., 2007) that includes degenerate, relativistic electrons, strongly coupled ions, and, at greater depth, free neutrons. In this work, we use pressure to indicate the depth. Temperature is treated as a constant parameter with GK throughout the crust to facilitate comparisons with previous results (Lau et al., 2018). Our analysis does not significantly depend on the choice of temperature as the zero-temperature pycnonuclear fusion reaction rates that are implemented in the network do not depend on temperature.
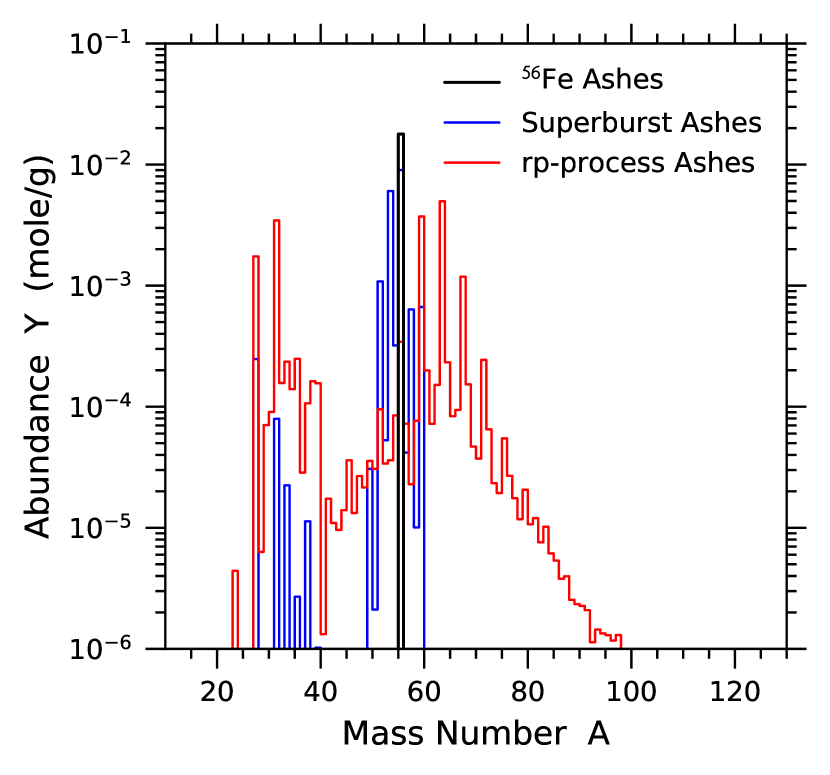
The initial composition on the surface of the neutron star crust depends on the composition of the accreted matter and the previous thermonuclear burning stages in the atmosphere and the ocean. We first consider an initial composition of 56Fe for comparison with the previous results by Haensel & Zdunik (1990). Next, we consider the initial composition of ashes predicted for a superburst powered by explosive carbon burning (Keek et al., 2012). This is appropriate for a system where all accreted matter is processed in repeated superbursts. During superbursts, explosive carbon burning leads to high temperatures and Nuclear Statistical Equilibrium (NSE) is established at relatively low densities and modest neutronization. As a result, the ashes are mainly composed of elements around iron. Finally, we also consider the ashes of hydrogen- and helium-rich X-ray bursts that underwent a rapid proton capture process (rp-process) (Woosley et al., 2004; Cyburt et al., 2016). The rp-process produces nuclei beyond 56Fe via a sequence of proton captures and decays, and the resulting nuclear ashes contain significant abundances of nuclei with mass number . Figure 1 shows the abundances as a function of the mass number for all three initial compositions.
3.2 Thermal Transport Code
We use the thermal transport code dStar (Brown, 2015) to model the evolution of the thermal structure of the crust during accretion, and the thermal emission from the neutron star surface during quiescence. We model a neutron star of mass and radius 11.2 km that accretes at a rate of 1017 g s-1 for 4,383 days before shutting off into quiescence. The choice of these parameters is motivated by observations of KS 1731-260 (Brown & Cumming, 2009; Merritt et al., 2016). For a given crust equation of state, dStar integrates the relativistic equations of stellar structure (Tolman, 1939; Oppenheimer & Volkoff, 1939) to compute the mechanical structure of the crust; dStar then divides the crust into a series of mass shells and integrates the thermal evolution equations (Thorne, 1977) using a method-of-lines algorithm (Schiesser, 1991).
The energy deposited in each mass shell during accretion is taken from the separate reaction network calculations. No other heating is included in our model. To obtain the heat sources, we run the network at 0.5 GK without -decays to remove any crust Urca cooling (Schatz et al., 2013). Crust Urca cooling is included in dStar directly using the Urca pairs identified in the full network calculation at 0.5 GK, with their luminosities scaled as . We find, however, that at our relatively low crust temperatures of up to 0.2 GK, Urca cooling is negligible. Our approach of decoupling the nuclear reaction network calculation from the cooling model assumes that nuclear heating is independent of temperature. This is justified, as , being the electron Fermi energy. The finite temperature therefore results only in a small shift in depth and a small broadening of the heat deposition by electron capture transitions. In addition, the pycnonuclear fusion reactions rates implemented are independent of temperature.
Heat transport via electron-phonon, electron-ion, and electron-impurity scattering is included. For electron-ion scattering, the crust composition, in particular the impurity factor, governs the heat transport in the crust (Roggero & Reddy, 2016). The impurity factor is the variance of the atomic numbers of elements present in the crust weighted by their abundances. It is defined as where and are the abundance and charge, respectively, of species and is the average charge number of the composition. The impurity factor in each zone is calculated from the composition as a function of depth obtained from the reaction network calculation.
The system is first evolved with nuclear heat sources during the accretion phase, establishing a temperature profile in the crust. Heating is then turned off for the subsequent quiescence phase. The calculated evolution of the effective surface temperature with respect to the observer at infinity corresponds to the observable quiescent cooling curve.
4 Results
| Reactions | Integrated flow |
|---|---|
| (mole/g) | |
| 40Mg + 40Mg 80Cr | 9.142 10-3 |
| 40Mg + 44Mg 84Cr | 1.588 10-3 |
| 44Mg + 44Mg 88Cr | 7.909 10-4 |
| 38Ne + 44Mg 82Ti | 4.090 10-4 |
| 38Ne + 40Mg 78Ti | 9.617 10-5 |
4.1 Initial Composition
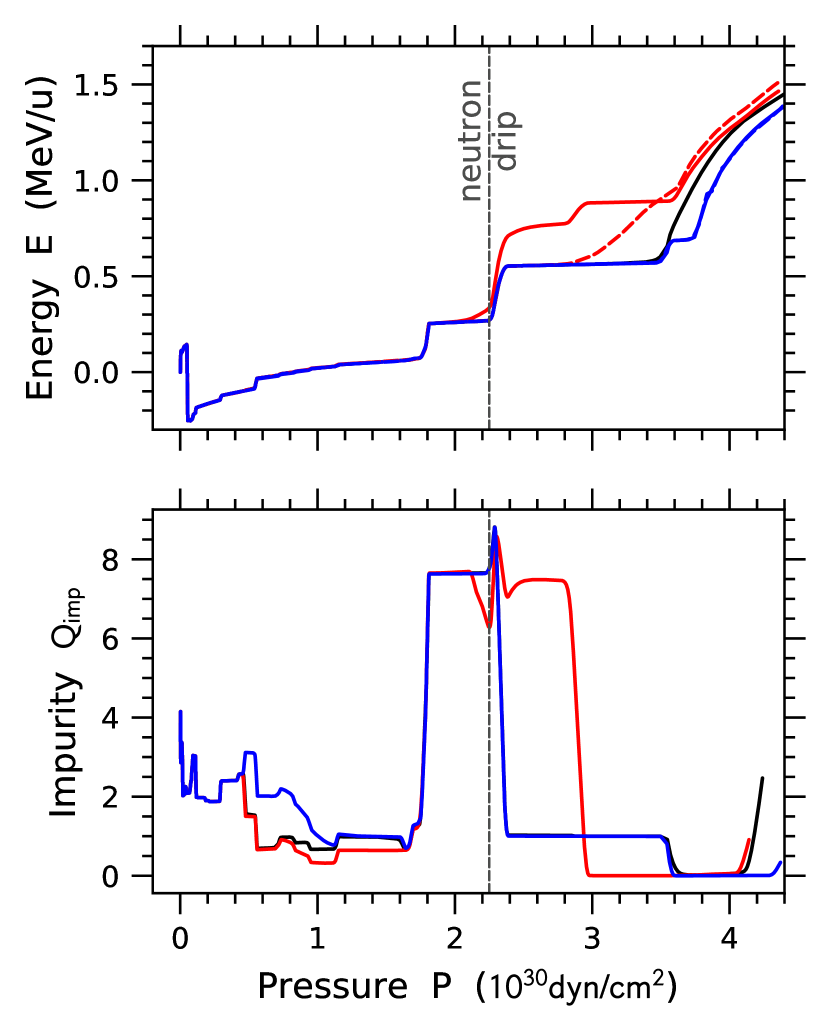
For an initial 56Fe composition, the upper panel in Figure 2 shows the integrated total nuclear heating as a function of depth for the nominal pycnonuclear fusion rates, as well as for fusion rates enhanced and reduced by a factor of a million, respectively. We find that regardless of the rate changes, the same fusion reactions occur (Table 1). Therefore, final composition and the total generated heat at the end of the calculation are similar for all cases. However, the changes in the pycnonuclear fusion rates lead to changes in the depth where the respective reactions occur. Consequently, enhanced pycnonuclear fusion reaction rates lead to an overall shallower heat deposition and the reduced reactions rates case shows a deeper heat deposition. A similar, but correspondingly smaller, effect is seen for rate changes of a factor of a hundred. Regardless of the rate changes, the heat deposition from fusion reactions for all calculations with 56Fe ashes as initial composition is always beyond and therefore around and beyond the neutron drip.
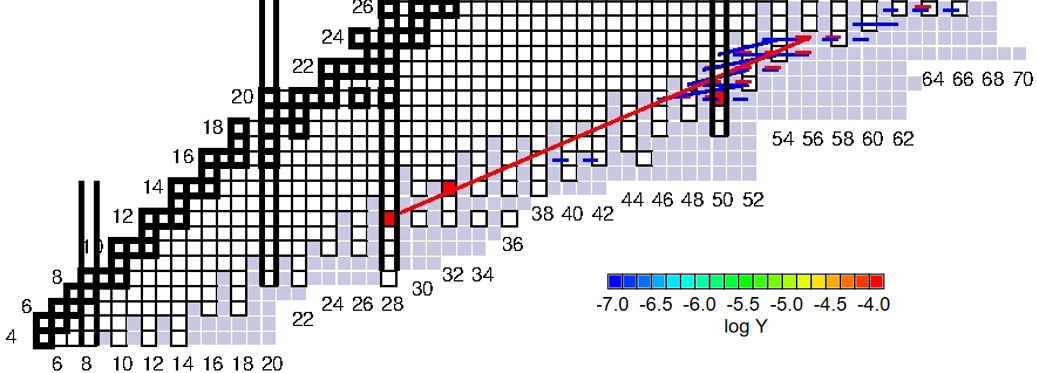
The rate changes also cause changes in the composition as a function of depth. The lower panel in Figure 2 shows that enhanced pycnonuclear fusion makes the crust more impure than the default case. This is because the pycnonuclear fusion of 40Mg starts earlier at a depth of around (or density, ), leading to a significant buildup of 70Ca since the superthreshold electron capture cascades (SEC) (Gupta et al., 2008) following pycnonuclear fusion are not fully efficient yet, as shown in Figure 3. This buildup of 70Ca is absent in the default rates case and is the main reason for the increased impurity of the crust between the depth of and . Beyond that depth, most of the 40Mg is depleted due to the enhanced pycnonuclear fusion and the crust impurity becomes lower than the default case.
The impact of the fusion rate variations on the heating profile is dominated by the reaction. Calculations with enhancements of different rate combinations show that the heating profile obtained with just enhancing the reaction is the same as the heating profile obtained by enhancing all fusion reactions. Individual enhancements of any of the other rates listed in Table 1 do not lead to a significant change in the heat deposition. Enhancing all fusion rates except for the reaction does however lead to a modest change in the heat profile. This is due to an enhancement of the fusion reactions involving Si isotopes. What makes 40Mg so important, nonetheless, is that it has a relatively high electron capture threshold as well as high neutron separation energy for our choice of mass model (Möller et al., 2016). This makes it relatively inert to electron capture as well as neutron capture/emission and the most abundant isotope in the inner neutron star crust.
4.2 Superburst Ashes Initial Composition
Superburst ashes are mainly composed of elements around 56Fe (Figure 1). Electron capture with neutron emission and neutron capture reactions simplify the composition once neutron drip is reached. Therefore, the composition in the region where pycnonuclear fusion reactions occur is very similar to the pure initial 56Fe case. As expected, the sensitivity to pycnonuclear fusion reaction rate enhancements and reductions is therefore also very similar (Figure 4) to the 56Fe case. One difference in the integrated energy is the initial cooling via crust Urca cooling (Schatz et al., 2013) due to the initial presence of odd- nuclei in the superburst ashes. This cooling depends sensitively on the chosen crust temperature, but does not impact the heating from pycnonuclear fusion at later times, which is of primary interest here.
4.3 Rp-Process Ashes Initial Composition
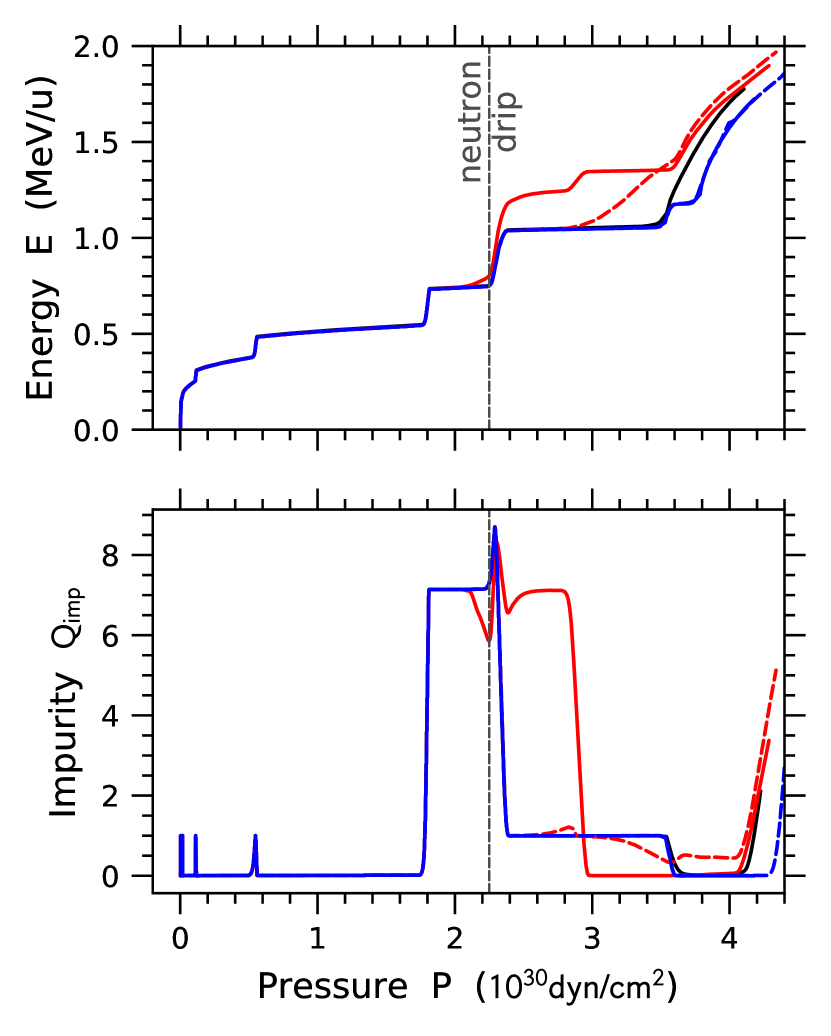
Figure 5 shows the dependence of heating and impurity profiles from changing all pycnonuclear fusion rates by factors of a million and a hundred for an initial composition of rp-process ashes. The main difference to the models with initial 56Fe or superburst ashes is the presence of fusion reactions at shallower depth (Lau et al., 2018), well before the neutron drip. This is a consequence of the presence of lighter nuclei in the initial composition which are mainly synthesized by secondary burning of residual helium left unburned by the rp-process during an X-ray burst. As a result, increased pycnonuclear fusion reaction rates already significantly increase heating at shallower depths above neutron drip, with heating already occurring at () for the most extreme case of a rate increase by a factor of a million (Figure 5). The initial negative heat deposition is again due to Urca cooling as discussed in § 4.2. The different final total energies for the different cases in Figure 5 are an artifact of choosing a fixed pressure to end the calculations. Continued running of the cases with lower fusion rates would eventually lead to the same final composition and similar total energy release.
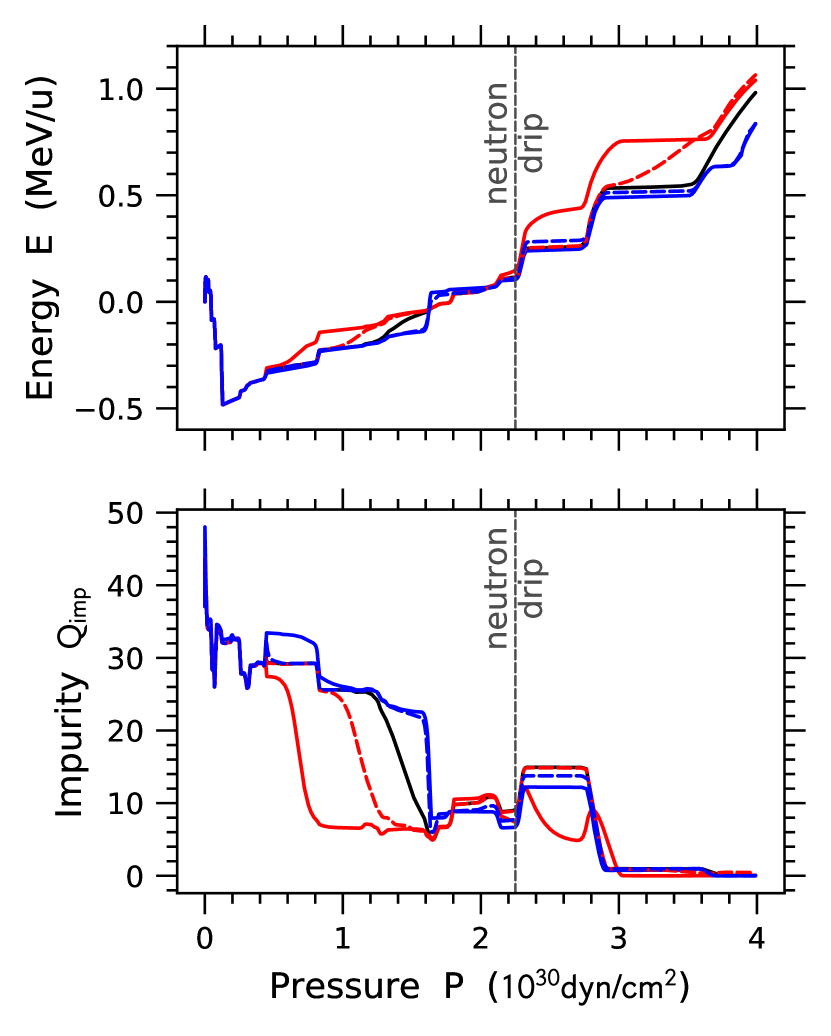
The reaction sequence for the default case is the same as that discussed in Lau et al. (2018). Fusion reactions involving isotopes like 21N, 20O, and 20C are initiated around a pressure of (). However, the heat generation at this stage does not appear to be sensitive to the rates of these reactions. The increased heat deposition at a relatively shallow depth where () for the rates enhanced by a factor of a million is due to fusion of 32Ne and 30Ne producing 56Ar, 62Ca, and 64Ca. The onset of these fusion reactions can also be identified in the corresponding impurity parameter drop of about 20 in Figure 5. For the default rates case, the onset of Ne fusion and the associated increase in heating and decrease in impurity occur later, at (). It is interesting to note that enhanced pycnonuclear fusion increases impurity in the crust for the 56Fe initial composition (see Figure 3) whereas it decreases impurity for rp-process ashes. This is because for rp-process ashes, the crust is already very impure with the composition spanning a large portion of the nuclear chart. Fusion reactions of the lightest elements present in the rp-process composition occur early and do not lead to fusion cycles in combination with the SEC cascades (Lau et al., 2018). Therefore, these fusion reactions eliminate nuclei at the lower mass end, thereby reducing the spread in atomic number.
| Reactions | Integrated flow |
|---|---|
| (mole/g) | |
Around the neutron drip, 40Mg starts to fuse at () for the enhanced rates case and at () for the default case. From this point onwards, this case is very similar to the 56Fe initial composition case. Table 2 lists the most important pycnonuclear fusion reactions in terms of the total integrated flow through their channels. The 40Mg + 40Mg reaction with the highest flow in 56Fe initial composition case is no longer the most important reaction as the fusion of Ne isotopes at shallower depths dominate the total integrated flow.
5 Impact on Crust Cooling
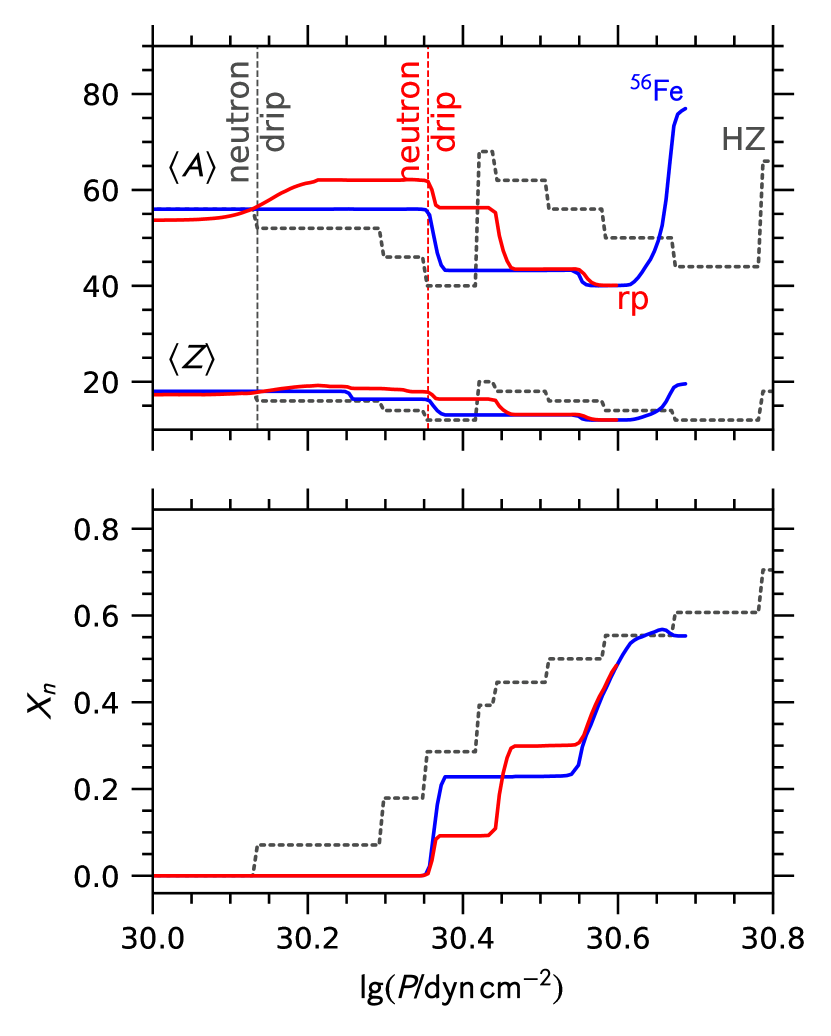
To incorporate the results of our network calculations into models of the thermal evolution of the crust, we first compute the crust equation of state resulting from our calculations. Figure 6 shows, in the region around neutron drip, the composition of two sample network calculations: one that starts with an initial composition of pure (red curves) and another that starts with a typical rp-process ash (blue curves). Compared with a reference calculation using the default dStar parameters (Haensel & Zdunik, 1990, gray curves), our neutron drip occurs at a higher pressure.
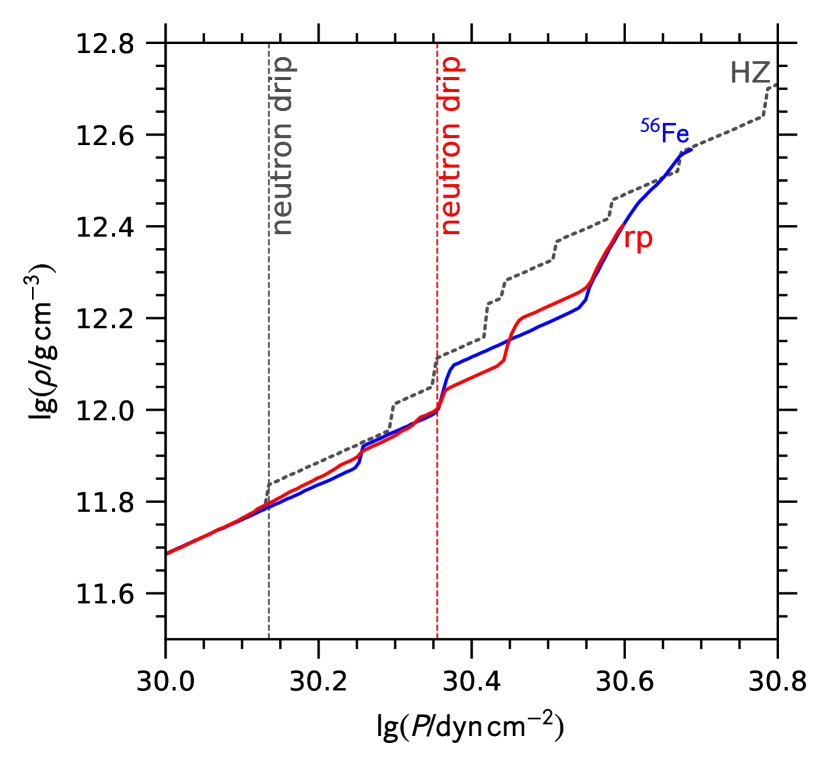
The resulting equation of state of these calculations is displayed in Figure 7. Compared with the reference composition of Haensel & Zdunik (1990), our calculations have a lower mass density in the vicinity of neutron drip owing to the different nuclear physics, such as the different masses (Möller et al., 2016), used.
As can be noted from Figures 6 and 7, the network runs do not extend to the crust-core interface but end when the abundances reach the edge of the detailed reaction network. At pressures greater than those reached in the network calculation, we use the composition of Haensel & Zdunik (1990). To ensure that the transition between the two compositions is numerically well-behaved, we linearly blend between the two compositions over 0.2 dex in .
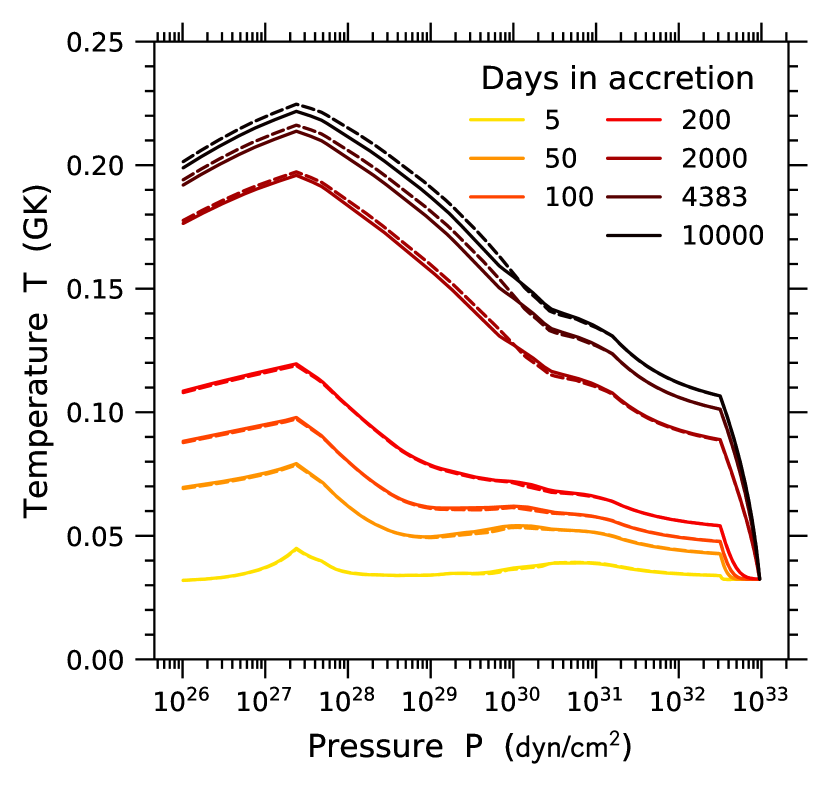
The evolution of the surface effective temperature during quiescence was calculated for the various heat source distributions obtained from the reaction network for different assumptions on initial crust composition and pycnonuclear fusion rates. Figure 8 shows the evolution of the crust temperature profile for rp-process ashes during an accretion outburst. During accretion, the temperature in the crust rises steadily. While in our model the accretion phase ends at 4,383 days, we show here the evolution for continued accretion out to 10,000 days to demonstrate that at 4,383 days the temperature profile is close to steady state. The kinks at and correspond to the boundaries of the section of the crust where nuclear heating is implemented. The temperature at the crust-core boundary at is held fixed as core temperature changes in a single outburst are negligible. Figure 8 shows that the temperature profiles for enhanced pycnonuclear fusion rates are slightly hotter during initial days of accretion. However, as time progresses, the reduced impurity reduces the thermal conductivity of the crust and the enhanced pycnonuclear fusion reaction rates lead to a cooler crust. Nonetheless, at 4,383 days, the largest temperature difference is only 4.4 MK or 2% at .
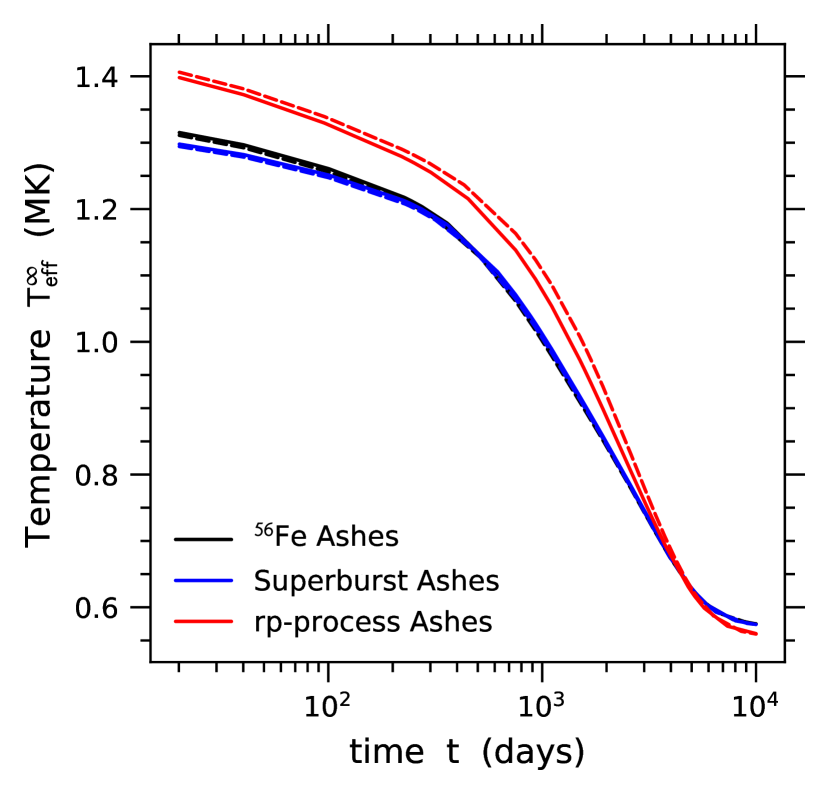
Cooling curves are then generated by stopping the accretion after 4,383 days (Section 3.2) and recording the effective surface temperature with respect to the observer at infinity as a function of time. Figure 9 shows these simulated cooling curves for all three initial compositions and for nominal and enhanced pycnonuclear fusion reaction rates. We find significant differences between the cooling curves with different compositions. The differences with enhancing pycnonuclear fusion reaction rates are the largest at late times for rp-process ashes. Crusts with this composition are also the hottest, as the lighter elements, like Ne, O, and F, in these ashes fuse and deposit heat at shallower depths. As a result, more heat flows to the surface rather than to the core. Even though the heating due to pycnonuclear fusion reactions is similar in crusts with 56Fe and superburst ashes, the abundances in superburst ashes are distributed among even and odd mass chains affecting the heat released by the electron captures in the outer crust. As a result, the crusts composed of superburst ashes have the lowest surface temperatures.
6 Conclusions
We provide the results for the first sensitivity studies of pycnonuclear fusion reaction rates in realistic network calculations. When all the pycnonuclear fusion reaction rates are varied up and down by a factor of a million, which corresponds to the estimated uncertainties, the nuclear heat deposition in the inner crust is altered. Owing to the steep density dependence of the pycnonuclear fusion rates, the resulting changes in the predicted cooling curves are relatively small, with temperature changes being at most of the order of 0.1 MK, or in photon energy. Even though the uncertainties in X-ray observations vary greatly with respect to the source, the telescope, and the time in quiescence, some systems have been observed at this and better levels of statistical uncertainty (Cackett et al., 2010, 2013; Fridriksson et al., 2011; Degenaar et al., 2014). With newer surveys planned and more sources observed, these differences in the cooling curves can still play an important role in precision modeling of the crust to match the observations.
When the reaction rates are enhanced, we find an overall shallower heat deposition whereas the reduced reaction rates lead to a deeper heat deposition in general. The shallowest pycnonuclear fusion in all the models considered occurs at the depth of () for the rp-process ashes initial composition case with the rates enhanced by a factor of a million. However, the additional shallow heating required to explain observations is typically inferred to occur at a much shallower depth of (). We therefore conclude that the uncertainties in pycnonuclear fusion reaction rates are unlikely to explain the shallow heating phenomenon, and will not affect its inferred strength and depth significantly.
During preparation of this work, it was suggested that the diffusion of neutrons may lead to accreted inner crusts that are closer in composition to a cold catalyzed crust with the transition occurring near, but not exactly at, traditional neutron drip (Gusakov & Chugunov, 2020, 2021). In this picture, our results for would not be affected. There would be no pycnonuclear fusion beyond but the energy would be released at the transition pressure. Note that the specific nuclear reaction pathways for this energy release have not been identified. The overall heat release in the crust would only be 10–30% of the heating reported in previous work (see also Shchechilin et al., 2021).
References
- Beard et al. (2010) Beard, M., Afanasjev, A. V., Chamon, L. C., et al. 2010, Atomic Data and Nuclear Data Tables, 96, 541, doi: 10.1016/j.adt.2010.02.005
- Brown (2015) Brown, E. F. 2015, dStar: Neutron star thermal evolution code. http://ascl.net/1505.034
- Brown & Cumming (2009) Brown, E. F., & Cumming, A. 2009, ApJ, 698, 1020, doi: 10.1088/0004-637X/698/2/1020
- Brown et al. (2018) Brown, E. F., Cumming, A., Fattoyev, F. J., et al. 2018, Phys. Rev. Lett., 120, 182701, doi: 10.1103/PhysRevLett.120.182701
- Cackett et al. (2013) Cackett, E. M., Brown, E. F., Cumming, A., et al. 2013, The Astrophysical Journal, 774, 131, doi: 10.1088/0004-637x/774/2/131
- Cackett et al. (2010) —. 2010, The Astrophysical Journal, 722, L137, doi: 10.1088/2041-8205/722/2/l137
- Cackett et al. (2006) Cackett, E. M., Wijnands, R., Linares, M., et al. 2006, MNRAS, 372, 479, doi: 10.1111/j.1365-2966.2006.10895.x
- Carnelli et al. (2014) Carnelli, P. F. F., Almaraz-Calderon, S., Rehm, K. E., et al. 2014, Phys. Rev. Lett., 112, 192701, doi: 10.1103/PhysRevLett.112.192701
- Chamel et al. (2020) Chamel, N., Fantina, A. F., Zdunik, J. L., & Haensel, P. 2020, Phys. Rev. C, 102, 015804, doi: 10.1103/PhysRevC.102.015804
- Chamon (2007) Chamon, L. 2007, Nuclear Physics A, 787, 198, doi: 10.1016/j.nuclphysa.2006.12.032
- Chamon et al. (2002) Chamon, L. C., Carlson, B. V., Gasques, L. R., et al. 2002, Physical Review C, 66, doi: 10.1103/physrevc.66.014610
- Cooper et al. (2009) Cooper, R. L., Steiner, A. W., & Brown, E. F. 2009, ApJ, 702, 660
- Cumming & Bildsten (2001) Cumming, A., & Bildsten, L. 2001, ApJ, 559, L127, doi: 10.1086/323937
- Cyburt et al. (2016) Cyburt, R. H., Amthor, A. M., Heger, A., et al. 2016, ApJ, 830, 55, doi: 10.3847/0004-637X/830/2/55
- Degenaar et al. (2014) Degenaar, N., Medin, Z., Cumming, A., et al. 2014, The Astrophysical Journal, 791, 47, doi: 10.1088/0004-637x/791/1/47
- Degenaar et al. (2015) Degenaar, N., Wijnands, R., Bahramian, A., et al. 2015, MNRAS, 451, 2071, doi: 10.1093/mnras/stv1054
- Degenaar et al. (2019) Degenaar, N., Ootes, L. S., Page, D., et al. 2019, MNRAS, 488, 4477, doi: 10.1093/mnras/stz1963
- Deibel et al. (2015) Deibel, A., Cumming, A., Brown, E. F., & Page, D. 2015, ApJ, 809, L31, doi: 10.1088/2041-8205/809/2/L31
- Deibel et al. (2017) Deibel, A., Cumming, A., Brown, E. F., & Reddy, S. 2017, ApJ, 839, 95, doi: 10.3847/1538-4357/aa6a19
- Fridriksson et al. (2011) Fridriksson, J. K., Homan, J., Wijnands, R., et al. 2011, The Astrophysical Journal, 736, 162, doi: 10.1088/0004-637x/736/2/162
- Gasques et al. (2007) Gasques, L. R., Afanasjev, A. V., Beard, M., et al. 2007, Physical Review C, 76, doi: 10.1103/physrevc.76.045802
- Gupta et al. (2007) Gupta, S., Brown, E. F., Schatz, H., Möller, P., & Kratz, K.-L. 2007, ApJ, 662, 1188, doi: 10.1086/517869
- Gupta et al. (2008) Gupta, S. S., Kawano, T., & Möller, P. 2008, Physical Review Letters, 101, doi: 10.1103/physrevlett.101.231101
- Gusakov & Chugunov (2020) Gusakov, M. E., & Chugunov, A. I. 2020, Phys. Rev. Lett., 124, 191101, doi: 10.1103/PhysRevLett.124.191101
- Gusakov & Chugunov (2021) —. 2021, Phys. Rev. D, 103, L101301, doi: 10.1103/PhysRevD.103.L101301
- Haensel & Zdunik (1990) Haensel, P., & Zdunik, J. L. 1990, A&A, 227, 431
- Haensel & Zdunik (2008) Haensel, P., & Zdunik, J. L. 2008, Astronomy & Astrophysics, 480, 459, doi: 10.1051/0004-6361:20078578
- Harrison (1964) Harrison, E. R. 1964, Proceedings of the Physical Society, 84, 213, doi: 10.1088/0370-1328/84/2/304
- Horowitz et al. (2015) Horowitz, C. J., Berry, D. K., Briggs, C. M., et al. 2015, Phys. Rev. Lett., 114, 031102, doi: 10.1103/PhysRevLett.114.031102
- Horowitz et al. (2008) Horowitz, C. J., Dussan, H., & Berry, D. K. 2008, Phys. Rev. C, 77, 045807, doi: 10.1103/PhysRevC.77.045807
- Keek et al. (2012) Keek, L., Heger, A., & in’t Zand, J. J. M. 2012, ApJ, 752, 150, doi: 10.1088/0004-637X/752/2/150
- Lau et al. (2018) Lau, R., Beard, M., Gupta, S. S., et al. 2018, The Astrophysical Journal, 859, 62, doi: 10.3847/1538-4357/aabfe0
- Meisel et al. (2018) Meisel, Z., Deibel, A., Keek, L., Shternin, P., & Elfritz, J. 2018, Journal of Physics G: Nuclear and Particle Physics, 45, 093001, doi: 10.1088/1361-6471/aad171
- Merritt et al. (2016) Merritt, R. L., Cackett, E. M., Brown, E. F., et al. 2016, ApJ, 833, 186, doi: 10.3847/1538-4357/833/2/186
- Mineshige (1993) Mineshige, S. 1993, Ap&SS, 210, 83, doi: 10.1007/BF00657876
- Möller et al. (2016) Möller, P., Sierk, A., Ichikawa, T., & Sagawa, H. 2016, At. Data Nucl. Data Tables, 109-110, 1, doi: 10.1016/j.adt.2015.10.002
- Ootes et al. (2019) Ootes, L. S., Wijnands, R., & Page, D. 2019, A&A, 630, A95, doi: 10.1051/0004-6361/201936035
- Oppenheimer & Volkoff (1939) Oppenheimer, J. R., & Volkoff, G. M. 1939, Phys. Rev., 55, 374, doi: 10.1103/PhysRev.55.374
- Page et al. (2022) Page, D., Homan, J., Nava-Callejas, M., et al. 2022, arXiv e-prints, arXiv:2202.03962. https://arxiv.org/abs/2202.03962
- Page & Reddy (2013) Page, D., & Reddy, S. 2013, Phys. Rev. Lett., 111, 241102, doi: 10.1103/PhysRevLett.111.241102
- Parikh et al. (2019) Parikh, A. S., Wijnands, R., Ootes, L. S., et al. 2019, A&A, 624, A84, doi: 10.1051/0004-6361/201834412
- Potekhin & Chabrier (2021) Potekhin, A. Y., & Chabrier, G. 2021, A&A, 645, A102, doi: 10.1051/0004-6361/202039006
- Potekhin et al. (2019) Potekhin, A. Y., Chugunov, A. I., & Chabrier, G. 2019, A&A, 629, A88, doi: 10.1051/0004-6361/201936003
- Roggero & Reddy (2016) Roggero, A., & Reddy, S. 2016, Physical Review C, 94, doi: 10.1103/physrevc.94.015803
- Rutledge et al. (2002) Rutledge, R. E., Bildsten, L., Brown, E. F., et al. 2002, ApJ, 580, 413, doi: 10.1086/342745
- Sato (1979) Sato, K. 1979, Progress of Theoretical Physics, 62, 957, doi: 10.1143/PTP.62.957
- Schatz et al. (2013) Schatz, H., Gupta, S., Möller, P., et al. 2013, Nature, 505, 62, doi: 10.1038/nature12757
- Schiesser (1991) Schiesser, W. E. 1991, The Numerical Method of Lines: Integration of Partial Differential Equations (Academic Press)
- Shchechilin & Chugunov (2019) Shchechilin, N. N., & Chugunov, A. I. 2019, MNRAS, 490, 3454, doi: 10.1093/mnras/stz2838
- Shchechilin et al. (2021) Shchechilin, N. N., Gusakov, M. E., & Chugunov, A. I. 2021, arXiv e-prints, arXiv:2105.01991. https://arxiv.org/abs/2105.01991
- Shternin et al. (2007) Shternin, P. S., Yakovlev, D. G., Haensel, P., & Potekhin, A. Y. 2007, MNRAS, 382, L43, doi: 10.1111/j.1745-3933.2007.00386.x
- Tauris & van den Heuvel (2006) Tauris, T. M., & van den Heuvel, E. P. J. 2006, in Cambridge Astrophysics Series, Vol. 39, Compact Stellar X-ray Sources, ed. W. Lewin & M. van der Klis (Cambridge University Press), 623–665
- Thorne (1977) Thorne, K. S. 1977, ApJ, 212, 825
- Tolman (1939) Tolman, R. C. 1939, Phys. Rev., 55, 364, doi: 10.1103/PhysRev.55.364
- Turlione et al. (2015) Turlione, A., Aguilera, D. N., & Pons, J. A. 2015, A&A, 577, A5, doi: 10.1051/0004-6361/201322690
- Umar et al. (2012) Umar, A. S., Oberacker, V. E., & Horowitz, C. J. 2012, Physical Review C, 85, doi: 10.1103/physrevc.85.055801
- Waterhouse et al. (2016) Waterhouse, A. C., Degenaar, N., Wijnands, R., et al. 2016, MNRAS, 456, 4001, doi: 10.1093/mnras/stv2959
- Woosley et al. (2004) Woosley, S. E., Heger, A., Cumming, A., et al. 2004, ApJS, 151, 75, doi: 10.1086/381533
- Yakovlev et al. (2006) Yakovlev, D. G., Gasques, L. R., Afanasjev, A. V., Beard, M., & Wiescher, M. 2006, Phys. Rev. C, 74, 035803, doi: 10.1103/PhysRevC.74.035803