11email: {Debo.Cheng,Ziqi.Xu}@mymail.unisa.edu.au,
11email: {Jiuyong.Li,Lin.Liu,Thuc.Le,Jixue.Liu}@unisa.edu.au
Learning Conditional Instrumental Variable Representation for Causal Effect Estimation
Abstract
One of the fundamental challenges in causal inference is to estimate the causal effect of a treatment on its outcome of interest from observational data. However, causal effect estimation often suffers from the impacts of confounding bias caused by unmeasured confounders that affect both the treatment and the outcome. The instrumental variable (IV) approach is a powerful way to eliminate the confounding bias from latent confounders. However, the existing IV-based estimators require a nominated IV, and for a conditional IV (CIV) the corresponding conditioning set too, for causal effect estimation. This limits the application of IV-based estimators. In this paper, by leveraging the advantage of disentangled representation learning, we propose a novel method, named DVAE.CIV, for learning and disentangling the representations of CIV and the representations of its conditioning set for causal effect estimations from data with latent confounders. Extensive experimental results on both synthetic and real-world datasets demonstrate the superiority of the proposed DVAE.CIV method against the existing causal effect estimators.
Keywords:
Causal Inference Instrumental Variable Latent Confounder1 Introduction
It is a fundamental task to query or estimate the causal effect of a treatment (a.k.a. exposure, intervention or action) on an outcome of interest in causal inference. Causal effect estimation has wide applications across many fields, including but not limited to, economics [20], epidemiology [17, 28], and computer science [30]. The gold standard method for causal effect estimation is randomised controlled trials (RCT), but they are often impractical or unethical due to cost restrictions or ethical constraints [30, 20]. Instead of conducting an RCT, estimating causal effects from observational data offers an alternative to evaluate the effect of a treatment on the outcome of interest.
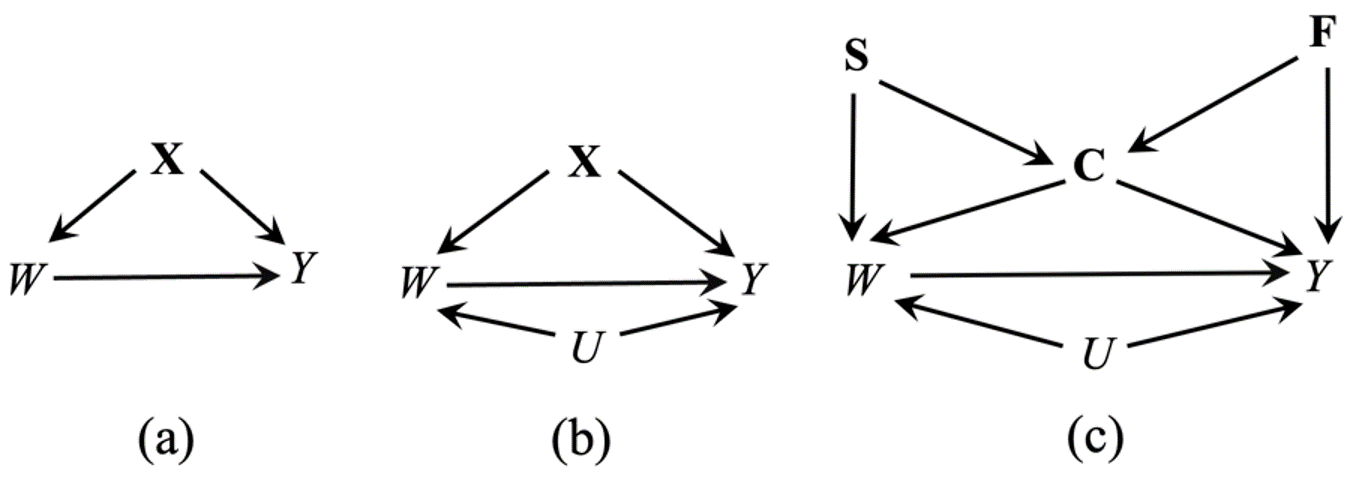
Confounding bias is a major obstacle in estimating causal effects from observational data. It arises from confounders that affect both the treatment variable and the outcome variable . When all confounders are measured (i.e., the unconfoundedness assumption [31, 20] is satisfied), adjusting for the set of all measured confounders is sufficient to obtain an unbiased estimation of the causal effect from observational data [20, 1]. For example, in the causal graph of Fig. 1(a), the unconfoundedness is satisfied when given . Nevertheless, the unconfoundedness assumption is untestable, and there exists a latent (a.k.a. unobserved, unmeasured) confounder affecting both and in many real-world applications, e.g. the latent confounder affects both and in the causal graph in Fig. 1(b). In such a situation, the causal effect of on is non-identification [30]. Most existing data-driven methods rely on the unconfoundedness assumption and thus it becomes challenging and questionable for them to obtain unbiased causal effects from data with latent confounders.
The instrumental variable (IV) approach is a practical and powerful technique for addressing the challenging problem of causal effect estimation in the presence of latent confounders. The IV approach requires a valid IV for eliminating the confounding bias caused by latent confounders [3, 19]. Valid IVs are exogenous variables that are associated with but not directly associated with [17, 27]. A valid IV needs to satisfy three conditions: (1) is correlated to ; (2) and do not share confounders (i.e. unconfounded instrument); and (3) the effect of on is entirely through (i.e. exogenous) [27, 17]. However, the last two conditions are too strict and not testable in real-world applications. Therefore, in many existing IV-based methods, an IV is nominated based on prior or domain knowledge. However, in many real-world applications, the nominated IVs based on domain knowledge could violate one of the three conditions, resulting in a biased estimate and potentially leading to incorrect conclusions [7, 17].
It is a challenging problem to discover a valid IV directly from data. Investigators usually collect as many covariates as possible, but few of them are valid IVs that satisfy the three conditions. Instead of discovering a valid IV, Kang et al. [21] proposed a data-driven method, referred to as sisVIVE, based on the assumption of some invalid and some valid IVs (i.e. more than half of candidate IVs are valid IVs ) to provide a bound of causal effect estimations. Hartford et al. [15] proposed DeepIV, a deep learning based IV approach for counterfactual predictions, but it requires a nominated IV and the corresponding conditioning set. Kuang et al. [24] developed a method to model a summary IV as a latent variable based on the statistical dependencies of the set of candidate IVs. Yuan et al. [37] proposed a data-driven method to automatically generate a synthetic IV for counterfactual predictions, but the method does not consider the confounding bias between the IV and the outcome, and the condition of unconfounded instrument may be violated in many cases. Therefore, it is desirable to develop an algorithm for learning a valid IV that considers the unconfounded instrument for causal effect estimations, especially conditional average causal effect estimations, from data with latent confounders.
To provide a practical solution for conditional average causal effect estimations, in this work, we focus on conditional IV (CIV), which can be considered as an IV with relaxed conditions and a CIV requires a conditioning set to instrumentalise it to function as an IV (details see Definition 1). We propose to leverage disentangled representation learning technique to learn from data the representations of a CIV and its conditioning set.
Specifically, as shown in Fig. 1(c), we assume that the observed covariates are learned through three representations, , and . Here, affects both treatment and , represents the confounding factor affecting both and the outcome , and represents the risk factor affecting both and . We then establish a theorem that is a valid CIV that is instrumentalised by , meaning that is the conditioning set of . Supported by this theorem, we design and develop a novel disentangled representation learning algorithm called DVAE.CIV model, which is based on the Variational AutoEncoder (VAE) model [23]. This model allows us to obtain the representations of the CIV and its conditioning set , enabling us to use as a valid IV conditioning on for estimating the conditional average causal effects of on from data when there are latent confounders. The main contributions of the paper are summarised as follows.
-
•
We address a challenging problem in conditional average causal effect estimations from data with latent confounders by utilising the CIV approach and VAE models.
-
•
We propose a novel disentanglement learning model based on the conditional VAE model to learn and disentangle the representations of covariates into the representations of a CIV and its conditioning set for conditional average causal effect estimations from data with latent confounders.
-
•
We conduct extensive experiments on synthetic and real-world datasets to show the performance of the DVAE.CIV model, w.r.t. causal effect estimations from data with latent confounders.
2 Preliminaries
In this paper, uppercase and lowercase letters are utilised to represent variables and their values, respectively. Bold-faced uppercase and lowercase letters indicate a set of variables and a value assignment of the set, respectively.
A DAG (direct acyclic graph) is a graph that contains directed edges (i.e. ) without cycles. In a DAG , the directed edge represents that is a cause of , and is an effect of . A DAG is a causal DAG when a direct edge represents that is a cause of . In this work, we assume a causal DAG to represent the underlying system, where , and denotes directed edges. In , we assume that is the set of pretreatment variables, is the set of latent confounders, is a binary treatment variable ( and denote the treated sample and control sample, respectively), and is an outcome of interest. Following the potential outcome model [31, 20], we have the potential outcomes and relative to the treatment . Note that we can only measure one of the two potential outcomes for a given individual . Conceptually, the individual causal effect (ICE) at is defined as . The average causal effect of on is defined as ACE, where is the expectation function.
The conditional average causal effect (CACE) of on is referred to as CACE, and defined as the form , where is do-operation and indicates an intervention on the treatment (i.e. set the value of as per [30]). Conceptually, can be obtained as:
| (1) |
In this work, we would like to estimate CACE from data that there exists at least a latent confounder affecting both and . When there is an IV and the set of conditioning covariates available in data, CACE can be calculated by the following formula as in [4, 20]:
| (2) |
The approach of CIV allows a measured covariate to be a valid IV conditioning on a set of measured variables. The formal definition of the CIV in a DAG (Definition 7.4.1 on Page 248 [30]) is introduced as follows.
Definition 1 (Conditional IV)
Let be a DAG with , a variable is a conditional IV w.r.t. if there exists a set of measured variables such that (i) , (ii) in , and (iii) , is not a descendant of .
Here, and are d-separation and d-connection for reading the conditioning relationships between nodes in a DAG [30]. The manipulated DAG in Definition 1 is obtained by deleting the direct edge from the DAG . Note that Definition 1 is defined on a single CIV that can be generalised to a set of CIVs easily.
With the pretreatment variables assumption, there is not a descendant of in , i.e. the condition (iii) of Definition 1 is always held. It means that one needs to check the first two conditions for verifying whether a variable is a CIV or not. Note that discovering a conditioning set from a given DAG is NP-complete [38]. Under the pretreatment assumption, the time complexity of discovering a conditioning set is still NP-complete. Instead of discovering a conditioning set from a given causal DAG, in this work, we will utilise disentangled representation learning to learn the representations of CIVs and the representations of the conditioning set directly from data with latent confounders.
3 The Proposed DVAE.CIV Model
3.1 The Disentangled Representation Learning Scheme for Causal Effect Estimation
In this work, we would like to estimate CACE from observational data with latent confounders. Note that the causal effect of on is non-identifiable when there exists a latent confounder affecting both and , i.e. in the underlying DAG [7, 30]. It is challenging to recover CACE from data with latent confounders due to the effect of is not computable. If there is a nominated CIV and its corresponding conditioning set, CACE can be obtained unbiasedly from data by using an IV-based estimator. However, a CIV and its conditioning set are usually unknown in many real-world applications. Furthermore, if an invalid CIV is used, the wrong result or conclusion may be drawn [27, 10].
To estimate the conditional average causal effects and average causal effects from data with latent confounders, we propose and design the DVAE.CIV model to learn three representations as in the scheme of Fig. 1(c). Here is the representation of CIVs that only affect but not , is the representation of the risk factors that affects but not , and is the confounding representation that affecting both and .
Our proposed DVAE.CIV model relies on VAEs: we assume that the measured covariates factorise conditioning on the latent variables, and use an inference model [23] which follows a factorisation of the true posterior [26, 16]. Based on our disentanglement setting in Fig. 1(c), we have the following theoretical result for causal effect estimation from data with latent confounders.
Theorem 3.1
Let be a causal DAG, in which is a set of pretreatment variables, is a set of latent confounders, and are treatment and outcome variables, respectively, and is in . If we can learn the three representations as per the scheme in Fig. 1(c), then the quantities of CACE can be calculated by using IV-based method.
Proof
The directed edge in is to ensure that has a causal effect on . In the causal DAG in Fig. 1(c), we first show that the set instrumentalises to be a valid CIV. is a common cause of and , so , i.e. the first condition of Definition 1 holds. In the causal DAG in Fig. 1(c), is a collider and is a common cause of and . That is, conditioning on , the path is open, but is sufficient to block this path. For the path , blocks it. Furthermore, in the manipulated DAG , is a collider such that the empty set blocks the three paths between and , i.e. , and . Hence, the set blocks all paths between and in , i.e. the second condition of Definition 1 holds. Finally, does not contains a descendant of due to the pretreatment variables assumption. Thus, the set instrumentalises . As in Eq.(2), the IV-based estimators, such as DeepIV [15], can be applied to remove the effect of by inputting the CIV representation and the representations of its conditioning set . Therefore, the quantities of can be obtained by using the CIV and its conditioning set in an IV-based estimator.
Theorem 3.1 ensures that a family of data-driven methods can be applied for causal effect estimation from data with latent confounders.
3.2 Learning the Three Representations
Based on Theorem 3.1, we have known that the set instrumentalises . In this section, we present our proposed DVAE.CIV model for obtaining the three latent representations from data by using the VAE technique [23], and the architecture of DVAE.CIV is presented in Fig. 2. As shown in Fig. 2, the DVAE.CIV model is to learn and disentangle the latent representation of into two disjoint sets by using disentangled variational autoencoder [16, 39], and generate the representation conditioning on by jointing the Conditional Variational AutoEncoder (CVAE) network [32].
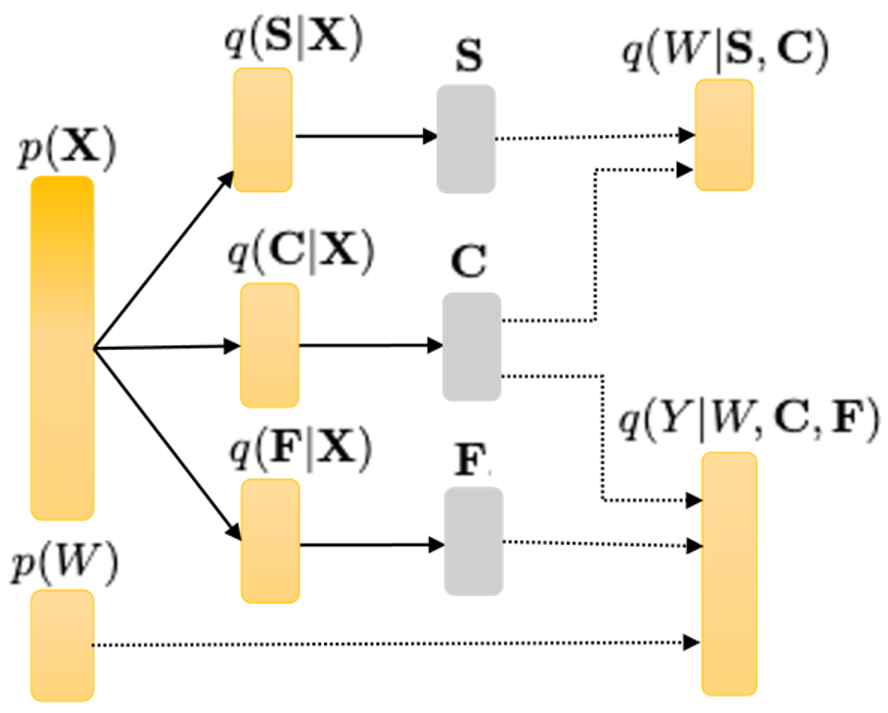
The DVAE.CIV model is designed to learn three representations shown in Fig.1(c) by utilising the inference model and generative model to approximate the posterior distribution . The inference model comprises three independent encoders , , and , which are treated as variational posteriors over the three latent representations. The generative model utilises the three latent representations with a decoder model to reconstruct the measured distribution .
Following the standard VAE model [23], the prior distributions and are drawn from the Gaussian distributions as:
| (3) |
where and are the dimensions of and , respectively. In the inference model, the variational approximations of the posteriors are described as:
| (4) | ||||
where is the dimension of , and and are the parameters of means and variances in the Gaussian distributions parameterised by neural networks.
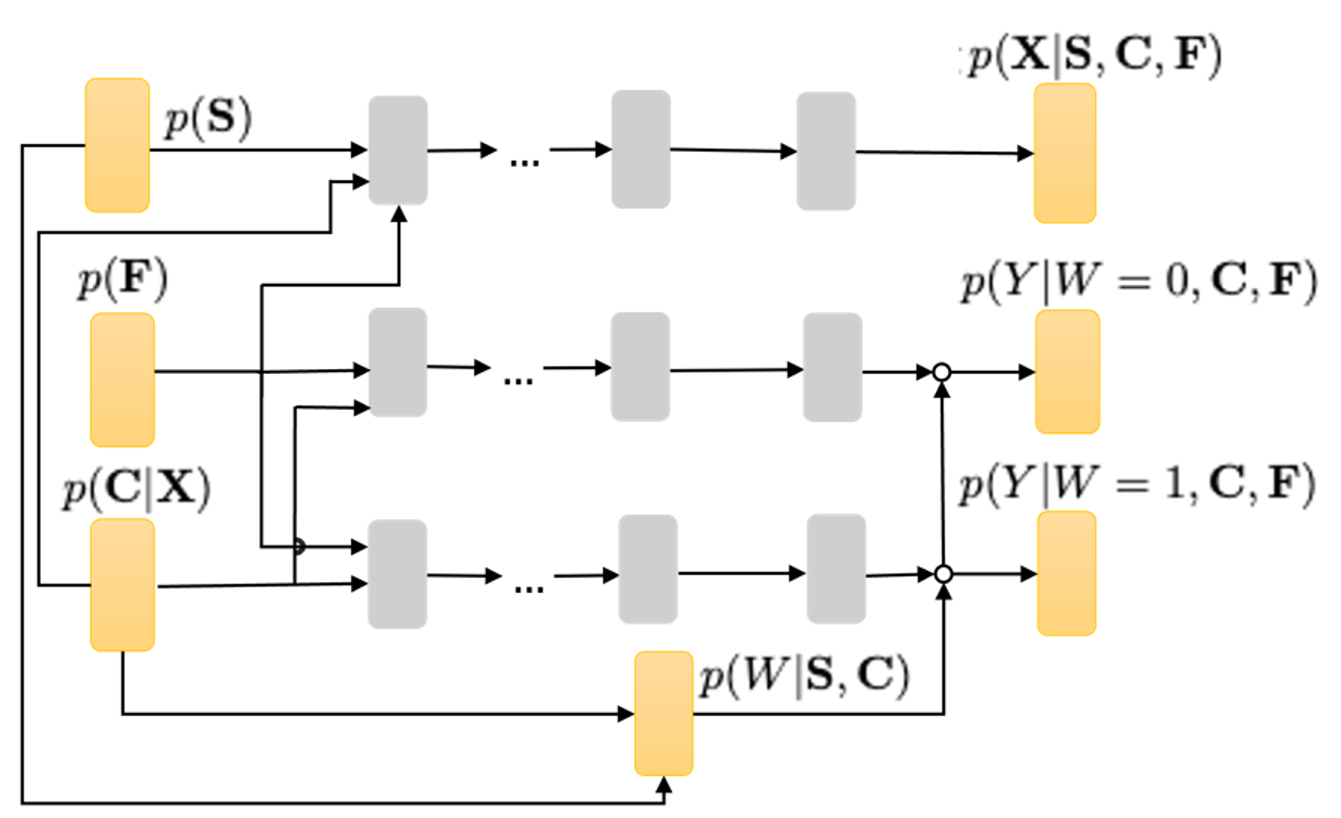
In the generative model, we utilise the Monte Carlo (MC) sampling strategy to sample the distribution based on the Conditional Variational AutoEncoder network (CVAE) [32] such that the latent representation of is generated from the distribution :
| (5) |
Furthermore, the generative models for and with the three latent representations are formalised as:
| (6) |
where is a function parameterised by neural networks, is the logistic function and is the function of Bernoulli distribution.
In our generative model, the latent representation for the outcome is based on the data type of . For the outcome with continuous values, we use a Gaussian distribution with its mean and variance parameterised by a pair of independent neural networks, i.e. and . Thus, the continuous is modelled by:
| (7) | ||||
where and are neural networks parameterised by their own parameters.
For the outcome with binary values, a Bernoulli distribution function based on neural networks is employed to model it and described as:
| (8) |
where is the same with the function . These parameters of neural networks can be approximated by maximising the Evidence lower bound (ELBO) :
| (9) | ||||
where the decoder is to ensure that the latent representation captures as much information of as possible.
To ensure that the treatment can be recovered from the latent representations and , and the outcome can be recovered from the latent representations and , two auxiliary predictors are added and the objective function of DVAE.CIV can be formalised as:
| (10) | ||||
where and are the weights for the auxiliary predictors.
After training the DVAE.CIV model, we get the CIV representation and the conditioning set representations based on Theorem 3.1. For estimating conditional causal effects, we employ an IV-based prediction, DeepIV [15], to implement this part, i.e. we feed and into the DeepIV method for conditional causal effect estimation.
4 Experiments
In this section, we evaluate the performance of the proposed DVAE.IV model by applying it to a set of synthetic datasets and three real-world datasets for CACE and average causal effect (ACE) estimation. The three real-world datasets include SchoolingReturns [8], Cattaneo [9] and RHC [12] that are usually utilised in evaluating the methods of causal effect estimation from observational data. Details of the implementation of DVAE.CIV and the appendix are provided in the GitHub1 ††1 https://github.com/IRON13/DVAE.CIV.
4.1 Experimental Setup
We compare the DVAE.CIV against the famous estimators in conditional causal effect estimation that are widely utilised in causal inference from observational data. Note that the ACE can be obtained by averaging the CACE of all individuals. These compared causal effect estimators are introduced in the following.
Compared causal effect estimators.
We compare our proposed DVAE.CIV with two Variational AutoEncoder based (VAE-based) causal effect estimators, three tree-based causal effect estimators, two machine learning based (ML-based) causal effect estimators, and three IV-based causal effect estimators. The two VAE-based causal effect estimators are Causal Effect Variational AutoEncoder (CEVAE) [26] and Treatment Effect estimation by Disentangled Variational AutoEncoder (TEDVAE) [39]). The three tree-based causal effect estimators are the standard Bayesian Additive Regression Trees (BART) [18], causal random forest (CF) [36] and causal random forest for IV regression (CFIVR) [5]. Note that CFIVR also belongs to IV-based estimators. The two ML-based causal effect estimators are double machine learning (DML) [11] and doubly robust learning (DRL) [13]. The three IV-based causal effect estimators are DeepIV [15], orthogonal instrumental variable (OrthIV) [34] and double machine learning based IV (DMLIV) [11].
Remarks.
The five estimators TEDVAE, BART, CF, DML and DRL rely on the assumption of unconfoundedness [20] (i.e. no latent confounders in data), so the five estimators cannot deal with the case with the data with latent confounders. CEVAE can deal with latent confounders, but it requires that all measured variables are proxy variables of the latent confounders, while our DVAE.CIV model does not have the restriction. The IV-based estimators CFIVR, DeepIV, OrthIV and DMLIV require a known IV that is nominated based on domain knowledge, but the nominated IV usually is not a valid IV and thus may result in a wrong conclusion as argued in Introduction.
Implementation details.
We use Python and the libraries including pytorch [29], pyro [6] and econml to implement DVAE.CIV. In our experiments, the dimension of latent representations is set as , and , respectively. The implementation of CEVAE is based on the Python library pyro [6] and the code of TEDVAE is from the authors’ GitHub2††2 https://github.com/WeijiaZhang24/TEDVAE. For BART, we use the implementation in the R package bartCause [18]. For CF and CFIVR, we use the implementations in the R functions causalforest and instrumentalforest in the R package grf [5], respectively. The implementations of DML, DRL, DeepIV, OrthIV and DMLIV are from the Python package encoml.
Evaluation metrics.
For performance evaluation, two commonly used metrics are employed in our experiments. For the synthetic datasets, we use absolute error of average causal effect [18], i.e. where is the true causal effect and is the estimated causal effect, and Precision of the Estimation of Heterogeneous Effect (PEHE, it is used to evaluate the CACE estimations.) [18, 26] where are the true outcomes and are the predicted outcomes, to assess the performance of all methods in terms of the causal effect estimation. Lower values of both metrics indicate better performance. For multiple replications, we present the mean with standard deviation. For the three real-world datasets, we use the reference causal effect in the literature as the baseline to evaluate the performance of all estimators since there is no ground truth causal effect available.
4.2 Simulation Study
It is challenging to evaluate a causal effect estimation method with real-world data since there is no ground truth in the real-world data. In this section, we design simulation studies to evaluate the performance of our proposed DVAE.CIV method in the case that there exists a latent confounder affecting both and , and there exists a CIV and its conditioning set in the synthetic datasets.
We use a causal DAG provided in the appendix to generate synthetic datasets with a range of sample sizes: 2k, 6k, 10k, and 20k. In the causal DAG , is the set of measured covariates and is the set of latent confounders in which affects both and . Note that is a CIV conditioning on the set for all synthetic datasets. Moreover, the data generation process allows the synthetic datasets to have the true individual causal effect. We provide the details of the synthetic data generating process in the appendix. In our experiments, the IV-based estimators OrthIV, DMLIV, DeepIV and CFIVR utilise the true CIV and the conditioning set as input for causal effect estimation.
| Samples | 2k | 6k | 10k | 20k | |
|---|---|---|---|---|---|
| Estimators | |||||
| ML-based | DML | 5.5070.387 | 5.6240.182 | 5.6190.122 | 5.6330.096 |
| DRL | 5.7460.404 | 5.8330.186 | 5.8250.156 | 5.8600.106 | |
| tree-based | BART | 3.5860.179 | 3.5960.090 | 3.6130.065 | 3.6220.060 |
| CF | 3.2260.342 | 3.2460.141 | 3.2740.127 | 3.3120.074 | |
| VAE-based | CEVAE | 5.595 0.455 | 5.6520.183 | 5.6310.179 | 5.7260.123 |
| TEDVAE | 5.6150.455 | 5.6550.181 | 5.6340.172 | 5.6960.112 | |
| IV-based | OrthIV | 2.2121.260 | 1.9520.585 | 1.7920.607 | 1.9740.419 |
| DMLIV | 2.1701.189 | 1.8880.572 | 1.7900.626 | 1.9710.432 | |
| DeepIV | 0.3520.180 | 0.6320.245 | 0.7260.315 | 0.7570.354 | |
| CFIVR | 1.2280.949 | 0.5040.369 | 0.5430.474 | 0.4150.307 | |
| DVAE.CIV | 0.5770.117 | 0.5770.064 | 0.5610.075 | 0.5120.091 | |
| Samples | 2k | 6k | 10k | 20k | |
| Estimators | |||||
| ML-based | DML | 5.4840.382 | 5.5840.167 | 5.5800.128 | 5.6090.105 |
| DRL | 5.7010.408 | 5.7730.179 | 5.7670.156 | 5.8150.112 | |
| tree-based | BART | 4.7910.205 | 4.7900.083 | 4.7890.072 | 4.7900.060 |
| CF | 3.4830.319 | 3.5000.134 | 3.5230.120 | 3.5540.070 | |
| VAE-based | CEVAE | 6.0930.396 | 6.1380.175 | 6.1070.160 | 6.1920.112 |
| TEDVAE | 6.1110.392 | 6.1380.177 | 6.1100.158 | 6.1670.103 | |
| IV-based | OrthIV | 3.0700.718 | 2.7980.299 | 2.7340.256 | 2.7950.218 |
| DMLIV | 3.0270.682 | 2.7670.278 | 2.7360.268 | 2.7940.221 | |
| DeepIV | 2.3960.054 | 2.4120.042 | 2.4180.060 | 2.4250.065 | |
| CFIVR | 3.0160.658 | 2.4210.235 | 2.4230.351 | 2.2030.145 | |
| DVAE.CIV | 2.4480.044 | 2.4600.037 | 2.4520.024 | 2.4420.025 | |
To provide a reliable assessment, we repeatedly generate 30 synthetic datasets for each sample size setting and utilize the aforementioned metrics to evaluate the performance of the DVAE.CIV against the compared estimators with respect to the task of ACE estimation and CACE estimation from data with latent confounders. For each dataset, we randomly take 70% of samples for training and 30% for testing. The results of all estimators with respect to the ACE estimations and CACE estimations measured by the metrics and in the out-of-sample set are provided in Tables 4 and 5, respectively. The out-of-sample set is on testing samples, and the within-sample set is on training samples. The results of the within-sample set are provided in the appendix.
Results.
By analysing the experiment results in Table 4, we have the following observations: (1) the ML-based and VAE-based estimators, DML, DRL, CEVAE and TEDVAE have the largest because the confounding bias caused by confounders and the latent confounder is not adjusted at all. (2) the tree-based estimators, BART and CF have the second largest as they fail to deal with the confounding bias caused by the latent confounder . (3) the IV-based estimators including DVAE.CIV significantly outperform the other estimators including DML, DRL, BART, CF, CEVAE and TEDVAE. (4) DVAE.CIV is the second best performer on all synthetic datasets and its performance is comparable with CFIVR and DeepIV. (5) as the sample size increases, the standard deviation of most estimators including DVAE.CIV decreases significantly. It’s worth mentioning that DVAE.CIV requires the least domain knowledge among all estimators since it only relies on the assumption that there exists a CIV and the conditioning set (maybe an empty set). This is very important in practice, as in many real-world applications, there is rarely sufficient prior knowledge for nominating a valid IV.
| Samples | SchoolingReturns | Cattaneo | RHC | |
| ML-based | DML | -0.0227 | -150.21 | 0.0244 |
| DRL | -0.0154 | -164.32 | 0.0447 | |
| tree-based | BART | -0.0384 | -172.53 | 0.0381 |
| CF | 0.1400 | -232.33 | 0.0278 | |
| VAE-based | CEVAE | 0.02617 | -221.23 | 0.0322 |
| TEDVAE | 0.0029 | -228.65 | 0.0293 | |
| IV-based | OrthIV | 1.3180 | - | - |
| DMLIV | 1.2806 | - | - | |
| DeepIV | 0.0328 | - | - | |
| CFIVR | 1.1510 | - | - | |
| DVAE.CIV | 0.1855 | -224.79 | 0.0414 | |
From the results in Table 5, we can conclude that (1) the ML-based, tree-based, and VAE-based estimators have the worst performance with respect to conditional causal effect estimations. (2) Among the IV-based estimators, DeepIV achieves the best performance on the first two groups of synthetic datasets and the second-best performance on the other datasets, and CFIVR obtains the best performance on the last four groups of synthetic datasets and the second-best performance on the first two groups of synthetic datasets. (3) DVAE.CIV obtains the second-best performance on all synthetic datasets. (4) The standard deviation of DVAE.CIV is the smallest on all datasets, and as the sample size increases, the standard deviation of DVAE.CIV reduces significantly. These conclusions demonstrate that DVAE.CIV can learn and disentangle the representations of the CIV and its conditioning set for CACE estimation from data with latent confounders.
In conclusion, DVAE.CIV achieves competitive performance compared to state-of-the-art causal effect estimators while requiring the least prior knowledge in ACE and CACE estimations from observational data with latent confounders.
4.3 Experiments on Three Real-World Datasets
We selected three real-world datasets with their empirical causal effect values available and commonly used in the literature to assess the performance of DVAE.CIV in ACE estimations. We did not conduct experiments on CACE estimation on the three datasets since there were no ground truth or empirical estimates of CACEs available for these datasets. The three real-world datasets are SchoolingReturns [8], Cattaneo [9], and RHC [12]. These datasets are widely utilized in the evaluation of either IV estimators or data-driven causal effect estimators [14]. Note that SchoolingReturns has a nominated CIV, and the last two datasets do not have a nominated IV for causal effect estimation. Thus, we only compared the DVAE.CIV model with all the aforementioned estimators on SchoolingReturns and the ML-based, tree-based, and VAE-based estimators on both Cattaneo and RHC datasets.
SchoolingReturns.
The dataset is from the national longitudinal survey of youth (NLSY), a well-known dataset of US young employees, aged range from 24 to 34 [8]. The dataset has 3,010 samples and 19 variables [8]. The variable of the education of employees is the treatment variable, and the variable of the raw wages in 1976 (in cents per hour) is the outcome variable. The dataset was collected to study the causal effect of education on earnings. Note that the variable of geographical proximity to a college, i.e. nearcollege is nominated to be an IV by Card [8]. The empirical estimate ACE with 95% confidence interval (0.0484, 0.2175) is from [35] and used as the reference value.
Cattaneo.
The dataset has the birth weights of 4,642 singleton births with 20 variables ([9]) that were collected from Pennsylvania, USA for the study of the average of maternal smoking status during pregnancy () on a baby’s birth weight (, in grams). The dataset contains several covariates: mother’s age, mother’s marital status, an indicator for the previous infant where the newborn died, mother’s race, mother’s education, father’s education, number of prenatal care visits, months since last birth, an indicator of firstborn infant and indicator of alcohol consumption during pregnancy. The authors [9] found a strong negative effect of maternal smoking on the weights of babies, i.e., about to lighter for a baby with a mother smoking during pregnancy.
Right Heart Catheterization (RHC).
RHC is a real-world dataset obtained from an observational study regarding a diagnostic procedure for the management of critically ill patients [12]. The RHC dataset can be downloaded from the package Hmisc3††3 https://CRAN.R-project.org/package=Hmisc. The dataset contains 2,707 samples with 72 covariates [12, 25]. RHC was for investigating the adult patients who participated in the Study to Understand Prognoses and Preferences for Outcomes and Risks of Treatments (SUPPORT). The treatment variable is whether a patient received an RHC within 24 hours of admission, and the outcome variable is whether a patient died at any time up to 180 days after admission. Note that the empirical conclusion is that applying RHC leads to higher mortality within 180 days than not applying RHC [12].
Results.
All results on the three real-world datasets are reported in Table 3. From Table 3, we make the following observations: (1) the estimated causal effects by DVAE.CIV and CF on SchoolingReturns and Cattaneo fall within the empirical intervals, while DML, DRL, and BART provide an opposite estimate to the empirical value on SchoolingReturns; (2) as there is no nominated IV on Cattaneo and RHC, the estimators OrthIV, DMLIV, DeepIV, and CFIVR do not work on both datasets; (3) all estimators, including DVAE.CIV, obtain a consistent estimation on the RHC data, and they reach the same conclusion as the empirical conclusion [12]. These observations further confirm that DVAE.CIV is capable of removing the bias between and in real-world datasets.
In conclusion, our simulation studies show the high performance of DVAE.CIV in ACE and CACE estimations from data with latent confounders, and our experiments on three real-world datasets further confirm the capability of DVAE.CIV in ACE estimation from observational data.
Limitations.
The performance of DVAE.CIV relies on the assumptions made in this work and the assumptions on the VAE model. Note that the identification of the VAE model [22] is an important issue for our proposed DVAE.CIV model. When some of the assumptions or the VAE identification do not hold, DVAE.CIV may obtain an inconsistent conclusion. To obtain a consistent conclusion, it would be better to conduct a sensitivity analysis [30, 20] together with DVAE.CIV to achieve a reliable conclusion in real-world applications.
5 Conclusion
It is a crucial challenge to deal with the bias caused by latent confounders in conditional causal effect estimations from observational data. IV-based methods allow us to remove such confounding bias in an effective way, but it relies on a nominated IV/CIV based on domain knowledge. In this paper, we propose an efficient approach, DVAE.CIV for conditional causal effect estimations from observational data with latent confounders. The DVAE.CIV utilizes the advantages of deep generative models for learning the representations of a CIV and its conditioning set from data with latent confounders. We theoretically show the soundness of the DVAE.CIV model. The effectiveness and potential of the DVAE.CIV are demonstrated by extensive experiments. In simulation studies, DVAE.CIV achieves competitive performance against state-of-the-art estimators that require extra prior knowledge in ACE and CACE estimation from data with latent confounders. The experimental results on three real-world datasets show the superiority of the DVAE.CIV model on ACE estimation over the existing estimators.
5.0.1 Acknowledgements
This work has been supported by the Australian Research Council (grant number: DP200101210 and DP230101122).
Appendix
In this Appendix, we provide additional graphical notations and definitions, details of synthetic and real-world datasets, and more experimental results.
Appendix 0.A Preliminaries
Paths.
In a graph , a path between and consists of a sequence of distinct nodes with every pair of successive nodes being adjacent. A node lies on the path if belongs to the sequence . A path is a directed or causal path if all edges along it are directed such as .
Ancestral relationships.
In a DAG , is a parent of (and is a child of ) if appears in this graph. In a directed path , is an ancestor of and is a descendant of if all arrows along point to .
In graphical causal modelling, the assumptions of Markov property, faithfulness and causal sufficiency are often involved to discuss the relationship between the causal graph and the distribution of the data.
Definition 2 (Markov property [30])
Given a DAG and the joint probability distribution of , satisfies the Markov property if for , is probabilistically independent of all of its non-descendants, given the set of parents .
Definition 3 (Faithfulness [33])
A DAG is faithful to a joint distribution over the set of variables if and only if every independence present in is entailed by and satisfies the Markov property. A joint distribution over the set of variables is faithful to the DAG if and only if the DAG is faithful to the joint distribution .
Definition 4 (Causal sufficiency [33])
A given dataset satisfies causal sufficiency if in the dataset for every pair of observed variables, all their common causes are observed.
In a DAG, d-separation is a graphical criterion that enables the identification of conditional independence between variables entailed in the DAG when the Markov property, faithfulness and causal sufficiency are satisfied [30, 33].
Definition 5 (d-separation [30])
A path in a DAG is said to be d-separated (or blocked) by a set of nodes if and only if (i) contains a chain or a fork such that the middle node is in , or (ii) contains a collider such that is not in and no descendant of is in . A set is said to d-separate from () if and only if blocks every path between to . otherwise they are said to be d-connected by , denoted as .
Appendix 0.B Experiments

0.B.1 Simulation Study
The simulated datasets are generated from the true DAG in Fig. 3, and the specifications of the data generation are as follows: and , where denotes the normal distribution. , , , , , and .
The treatment assignment is generated from ( denotes the sample size) Bernoulli trials by using the assignment probability . The potential outcome is generated from where . Note that true is fixed to 2 on all synthetic datasets.
| Samples | 2k | 6k | 10k | 20k | |
| Estimators | |||||
| ML-based | DML | 5.5070.387 | 5.6240.182 | 5.6190.122 | 5.6330.096 |
| DRL | 5.7460.404 | 5.8330.186 | 5.8250.156 | 5.8600.106 | |
| tree-based | BART | 3.8900.368 | 3.9990.156 | 4.0140.152 | 4.0460.106 |
| CF | 3.2180.325 | 3.2550.140 | 3.2770.131 | 3.3060.077 | |
| VAE-based | CEVAE | 5.558 0.407 | 5.6980.194 | 5.6400.172 | 5.7060.112 |
| TEDVAE | 5.6710.399 | 5.5830.194 | 5.6440.167 | 5.6740.100 | |
| IV-based | OrthIV | 2.2121.260 | 1.9520.585 | 1.7920.607 | 1.9740.419 |
| DMLIV | 2.1701.189 | 1.8880.572 | 1.7900.626 | 1.9710.432 | |
| DeepIV | 0.3520.180 | 0.6320.245 | 0.7270.315 | 0.7570.354 | |
| CFIVR | 1.2170.924 | 0.5140.369 | 0.5520.461 | 0.4160.296 | |
| DRVAE.CIV | 0.6120.090 | 0.5880.055 | 0.5360.085 | 0.5120.091 | |
| Samples | 2k | 6k | 10k | 20k | |
| Estimators | |||||
| ML-based | DML | 5.4550.353 | 5.5960.174 | 5.5870.115 | 5.5880.090 |
| DRL | 5.6710.370 | 5.7860.182 | 5.7740.144 | 5.7940.101 | |
| tree-based | BART | 4.185344 | 4.2270.149 | 4.2340.146 | 4.2530.106 |
| CF | 3.4750.301 | 3.5040.129 | 3.5220.121 | 3.5470.072 | |
| VAE-based | CEVAE | 6.0610.352 | 6.1490.178 | 6.1150.149 | 6.1730.101 |
| TEDVAE | 6.0760.337 | 6.1490.175 | 6.1190.148 | 6.1470.091 | |
| IV-based | OrthIV | 3.0500.700 | 2.8040.303 | 2.7360.255 | 2.7840.213 |
| DMLIV | 3.0090.664 | 2.7720.280 | 2.7380.268 | 2.7840.216 | |
| DeepIV | 2.4030.036 | 2.4080.038 | 2.4180.062 | 2.4250.065 | |
| CFIVR | 3.0480.649 | 2.4570.252 | 2.4320.355 | 2.3280.144 | |
| DRVAE.CIV | 2.4600.041 | 2.4540.029 | 2.4490.027 | 2.4480.015 | |
Results.
0.B.2 Experiments on Three Real-World Datasets
SchoolingReturns.
The dataset is from the national longitudinal survey of youth (NLSY), a well-known dataset of US young employees, aged range from 24 to 34 [8]. The treatment is the education of employees, and the outcome is raw wages in 1976 (in cents per hour). The data contains 3,010 individuals and 19 covariates. The covariates include experience (Years of labour market experience), ethnicity, resident information of an individual, age, nearcollege (whether an individual grew up near a 4-year college?), marital status, Father’s educational attainment, Mother’s educational attainment, and so on. A goal of the studies on this dataset is to investigate the causal effect of education on earnings. Card [8] used geographical proximity to a college, i.e. the covariate nearcollege as an instrument variable. We take with 95% conditional interval (0.0484, 0.2175) from [35] as the reference causal effect.
Cattaneo.
The Cattaneo ([9]) is usually used to study the ACE of maternal smoking status during pregnancy () on a baby’s birth weight (in grams)††http://www.stata-press.com/data/r13/cattaneo2.dta. Cattaneo2 consists of the birth weights of 4,642 singleton births in Pennsylvania, USA ([2, 9]). Cattaneo contains 864 smoking mothers (=1) and 3,778 nonsmoking mothers (=0). The dataset contains several covariates: mother’s age, mother’s marital status, an indicator for the previous infant where the newborn died, mother’s race, mother’s education, father’s education, number of prenatal care visits, months since last birth, an indicator of firstborn infant and indicator of alcohol consumption during pregnancy. The authors ([2]) found a strong negative effect of maternal smoking on the weights of babies, that is, about to lower for a baby with a mother smoking during pregnancy than for a baby without by statistical analysis on all covariates.
Right heart catheterization (RHC).
Right heart catheterization (RHC) is a real-world dataset obtained from an observational study regarding a diagnostic procedure for the management of critically ill patients ([12]). The RHC dataset can be downloaded from the package Hmisc††https://CRAN.R-project.org/package=Hmisc. RHC contains information on hospitalised adult patients from five medical centres in the USA. These hospitalised adult patients participated in the Study to Understand Prognoses and Preferences for Outcomes and Risks of Treatments (SUPPORT). Treatment indicates whether a patient received an RHC within 24 hours of admission. The outcome is whether a patient died at any time up to 180 days after admission. The original RHC dataset has 5,735 samples with 73 covariates. We preprocess the original data, as suggested by Loh et al. ([25]), and the final dataset contains 2,707 samples with 72 covariates. Note that the empirical conclusion is that applying RHC leads to higher mortality within 180 days than not applying RHC [12].
References
- [1] Abadie, A., Imbens, G.W.: Large sample properties of matching estimators for average treatment effects. econometrica 74(1), 235–267 (2006)
- [2] Almond, D., Chay, K.Y., Lee, D.S.: The costs of low birth weight. The Quarterly Journal of Economics 120(3), 1031–1083 (2005)
- [3] Angrist, J.D., Imbens, G.W.: Two-stage least squares estimation of average causal effects in models with variable treatment intensity. Journal of the American statistical Association 90(430), 431–442 (1995)
- [4] Angrist, J.D., Imbens, G.W., Rubin, D.B.: Identification of causal effects using instrumental variables. Journal of the American statistical Association 91(434), 444–455 (1996)
- [5] Athey, S., Tibshirani, J., Wager, S.: Generalized random forests. The Annals of Statistics 47(2), 1148–1178 (2019)
- [6] Bingham, E., Chen, J.P., et al.: Pyro: Deep universal probabilistic programming. The Journal of Machine Learning Research 20(1), 973–978 (2019)
- [7] Brito, C., Pearl, J.: Generalized instrumental variables. In: Proceedings of the Eighteenth conference on Uncertainty in artificial intelligence. pp. 85–93 (2002)
- [8] Card, D.: Using geographic variation in college proximity to estimate the return to schooling (1993)
- [9] Cattaneo, M.D.: Efficient semiparametric estimation of multi-valued treatment effects under ignorability. Journal of Econometrics 155(2), 138–154 (2010)
- [10] Cheng, D., Li, J., Liu, L., Liu, J., Le, T.D.: Data-driven causal effect estimation based on graphical causal modelling: A survey. arXiv preprint arXiv:2208.09590 (2022)
- [11] Chernozhukov, V., Chetverikov, D., Demirer, M., Duflo, E., Hansen, C., Newey, W., Robins, J.: Double/debiased machine learning for treatment and structural parameters. The Econometrics Journal 21(1), C1–C68 (2018)
- [12] Connors, A.F., Speroff, T., et al.: The effectiveness of right heart catheterization in the initial care of critically iii patients. Journal of the American Medical Association 276(11), 889–897 (1996)
- [13] Foster, D.J., Syrgkanis, V.: Orthogonal statistical learning. arXiv preprint arXiv:1901.09036 (2019)
- [14] Guo, R., Cheng, L., Li, J., Hahn, P.R., Liu, H.: A survey of learning causality with data: Problems and methods. ACM Computing Surveys (CSUR) 53(4), 1–37 (2020)
- [15] Hartford, J., Lewis, G., et al.: Deep IV: A flexible approach for counterfactual prediction. In: International Conference on Machine Learning. pp. 1414–1423 (2017)
- [16] Hassanpour, N., Greiner, R.: Learning disentangled representations for counterfactual regression. In: International Conference on Learning Representations. pp. 1–11 (2019)
- [17] Hernán, M.A., Robins, J.M.: Instruments for causal inference: an epidemiologist’s dream? Epidemiology pp. 360–372 (2006)
- [18] Hill, J.L.: Bayesian nonparametric modeling for causal inference. Journal of Computational and Graphical Statistics 20(1), 217–240 (2011)
- [19] Imbens, G.W.: Instrumental variables: An Econometrician’s Perspective. Statistical Science 29(3), 323–358 (2014)
- [20] Imbens, G.W., Rubin, D.B.: Causal Inference in Statistics, Social, and Biomedical Sciences. Cambridge University Press (2015)
- [21] Kang, H., Zhang, A., Cai, T.T., Small, D.S.: Instrumental variables estimation with some invalid instruments and its application to mendelian randomization. Journal of the American statistical Association 111(513), 132–144 (2016)
- [22] Khemakhem, I., Kingma, D., Monti, R., Hyvarinen, A.: Variational autoencoders and nonlinear ica: A unifying framework. In: International Conference on Artificial Intelligence and Statistics. pp. 2207–2217. PMLR (2020)
- [23] Kingma, D.P., Welling, M.: Auto-encoding variational bayes. In: International Conference on Learning Representations (2014)
- [24] Kuang, Z., Sala, F., et al.: Ivy: Instrumental variable synthesis for causal inference. In: International Conference on Artificial Intelligence and Statistics. pp. 398–410 (2020)
- [25] Loh, W.W., Vansteelandt, S.: Confounder selection strategies targeting stable treatment effect estimators. Statistics in Medicine 40(3), 607–630 (2021)
- [26] Louizos, C., Shalit, U., Mooij, J.M., Sontag, D., Zemel, R., Welling, M.: Causal effect inference with deep latent-variable models. In: Advances in Neural Information Processing Systems. pp. 6446–6456 (2017)
- [27] Martens, E.P., Pestman, W.R., de Boer, A., Belitser, S.V., Klungel, O.H.: Instrumental variables: application and limitations. Epidemiology pp. 260–267 (2006)
- [28] Martinussen, T., Nørbo Sørensen, D., Vansteelandt, S.: Instrumental variables estimation under a structural cox model. Biostatistics 20(1), 65–79 (2019)
- [29] Paszke, A., Gross, S., et al.: Pytorch: an imperative style, high-performance deep learning library. In: International Conference on Neural Information Processing Systems. pp. 8026–8037 (2019)
- [30] Pearl, J.: Causality. Cambridge university press (2009)
- [31] Rosenbaum, P.R., Rubin, D.B.: The central role of the propensity score in observational studies for causal effects. Biometrika 70(1), 41–55 (1983)
- [32] Sohn, K., Yan, X., Lee, H.: Learning structured output representation using deep conditional generative models. In: Proceedings of the 28th International Conference on Neural Information Processing Systems-Volume 2. pp. 3483–3491 (2015)
- [33] Spirtes, P., Glymour, C.N., Scheines, R., Heckerman, D.: Causation, prediction, and search. MIT press (2000)
- [34] Syrgkanis, V., Lei, V., et al.: Machine learning estimation of heterogeneous treatment effects with instruments. In: International Conference on Neural Information Processing Systems. pp. 15193–15202 (2019)
- [35] Verbeek, M.: A guide to modern econometrics. John Wiley & Sons (2008)
- [36] Wager, S., Athey, S.: Estimation and inference of heterogeneous treatment effects using random forests. Journal of the American Statistical Association 113(523), 1228–1242 (2018)
- [37] Yuan, J., Wu, A., et al.: Auto IV: Counterfactual prediction via automatic instrumental variable decomposition. ACM Transactions on Knowledge Discovery from Data 16(4), 1–20 (2022)
- [38] Van der Zander, B., Liśkiewicz, M., Textor, J.: Efficiently finding conditional instruments for causal inference pp. 3243–3249 (2015)
- [39] Zhang, W., Liu, L., Li, J.: Treatment effect estimation with disentangled latent factors. In: The AAAI Conference on Artificial Intelligence. pp. 10923–10930 (2021)