4FGL J1844.40306: high-energy emission likely from the supernova remnant G29.37+0.1
Abstract
Very-high-energy (VHE) observations have revealed approximately 100 TeV sources in our Galaxy, and a significant fraction of them are under investigation for understanding their origin. We report our study of one of them, HESS J1844030. It is found possibly associated with the supernova remnant (SNR) candidate G29.37+0.1, and detailed studies of the source region at radio and X-ray frequencies have suggested that this SNR is a composite one, containing a pulsar wind nebula (PWN) powered by a candidate young pulsar. As the GeV source 4FGL J1844.40306 is also located in the region with high positional coincidence, we analyze its -ray data obtained with the Large Area Telescope on-board the Fermi Gamma-ray Space Telescope . We determine the GeV -ray emission is extended, described with a Log-Parabola function. The obtained spectrum can be connected to that of the VHE source HESS J1844030. Given the properties and those from multi-frequency studies, we discuss the origin of the -ray emission by considering that the two -ray sources are associated. Our modeling indicates that while the TeV part would have either a hadronic (from the SNR) or a leptonic origin (from the putative PWN), the GeV part would arise from a hadronic process. Thus we conclude that 4FGL J1844.40306 is the likely GeV counterpart to G29.37+0.1.
1 Introduction
Supernova remnants (SNRs) and their homologues pulsar wind nebulae (PWNe) are conspicuous sources in our Galaxy, as both types of the sources can be bright from frequencies radio to -rays, showing features of different physical processes (e.g., Reynolds 2017; Gaensler & Slane 2006). In SNRs, their shockfronts are believed to accelerate both protons and electrons, and thus SNRs are considered as the sites from which Galactic cosmic rays (CRs) originate (e.g., Baade & Zwicky 1934; Bykov et al. 2018). If there is is dense material for the accelerated protons to run into, considerable high-energy and very-high-energy (VHE) -ray emissions are generated through proton-proton collisions, pion production and subsequent pion decay (e.g., Dermer 1986; Drury et al. 1994), i.e., the so-called hadronic process. The accelerated electrons can also generate emissions through synchrotron and inverse Compton Scattering (ICS) processes (e.g., Sturner et al. 1997), namely the so-called leptonic process. A PWN is powered by its central pulsar that drives an ultrarelativistic magnetized wind. The wind, consisting of electron/positron pairs (leptons), interacts with the ambient medium and slows down at the so-called termination shock, where the ram pressure of the wind is balanced by the internal pressure of the PWN (see Gaensler & Slane 2006, for a review). It is believed that leptons within the PWN are accelerated to relativistic energies via diffuse shock acceleration or other mechanisms still being investigated at the termination shock. The accelerated particles then escape into the nebula where they radiate from radio to VHE gamma-rays via synchrotron and ICS processes (Kennel & Coroniti, 1984; Atoyan & Aharonian, 1996; Zhang et al., 2008; Gelfand et al., 2009; Tanaka & Takahara, 2011). Therefore the SNRs and PWNe are targets of high-energy studies for understanding mechanisms of particle acceleration and related radiation, and are expected to be associated with VHE TeV sources found in our Galaxy.
In recent years, many TeV sources located in the Galactic plane have been detected in VHE surveys (H. E. S. S. Collaboration et al., 2018; Albert et al., 2020), and presumably most of them should be SNRs or/and PWNe. Indeed for example, among 78 sources detected in the High Energy Spectroscopy System (H.E.S.S.) Galactic plane survey, 16 and 12 were identified as SNRs and PWNe respectively (H. E. S. S. Collaboration et al., 2018). However on the other hand, a significant fraction of these TeV sources do not have obvious counterparts at other wavelengths, suggesting more detailed studies should be carried out for clarifying their possible SNR or PWN origin.
The TeV source HESS J1844030 is one of them (H. E. S. S. Collaboration et al., 2018), while its position coincides with that of a SNR candidate G29.37+0.1. This candidate was first revealed from the radio imaging survey of the first Galactic quadrant (Helfand et al., 2006), and appears to have an interesting S-shaped radio structure in the center, surrounded by a diffuse halo. Because of the positional coincidence, multi-wavelength follow-up studies of the source region were conducted by Castelletti et al. (2017). They found that the S-shaped structure is likely a background radio galaxy and the weak radio halo could be the shell of a composite SNR (Figure 1). They also suggested that HESS J1844030 could be associated with the radio galaxy. However, Petriella (2019) re-analyzed the archival data and proposed that the TeV source could be the VHE counterpart to an X-ray nebula source G29.4+0.1, which is likely a PWN powered by a potential pulsar (X-ray source PS1) (see details in Castelletti et al. 2017; Petriella 2019; see also Figure 1).
As part of our studies for understanding the origins of several tens of the Galactic TeV sources that do not have obvious counterparts at other wavelengths (H. E. S. S. Collaboration et al., 2018; Albert et al., 2020), we have noted that there is a -ray source in the GeV band detected with the Large Area Telescope (LAT; Atwood et al. 2009) on-board the Fermi Gamma-ray Space Telescope (Fermi). This source appeared in the Fermi LAT first source catalog (1FGL; Abdo et al. 2010) as 1FGL J1844.30309c and in the fourth catalog (4FGL; Abdollahi et al. 2022) as 4FGL J1844.40306. The source has a position consistent with those of HESS J1844030 and G29.37+0.1 (Figure 1). We thus analyzed the Fermi LAT data. The results provide a more complete picture for the G29.37+0.1 region. Here we report the analysis and results. In Section 2, we describe our analysis and present the corresponding results. In Section 3, we discuss the implication of the results by modeling the broadband spectral energy distribution (SED) that involves the sources observed at multi-wavelengths in the region of G29.37+0.1.
2 Fermi LAT Data Analysis and Results
2.1 LAT Data and Source Model
We used the Fermi-LAT Pass 8 data from 2008-08-04 15:43:36 (UTC) to 2021-12-01 00:00:00 (UTC). The region of interest (RoI) was set with a size of centered at the position of 4FGL J1844.40306. The events were selected with parameters evclass=128 and evtype=3 and the maximum apparent zenith angle at 90 degree. Good time interval were calculated with the tool gtmktime by setting the filter conditions DATA_QUAL0 && LAT_CONFIG=1 for Galactic point source analysis, and data in good time intervals were selected to be used in our analysis.
We built a source model using the data release 3 of 4FGL (4FGL-DR3), which was based on the analysis of 12-year LAT data (Abdollahi et al. 2022). All sources within 15 degree radius of 4FGL J1844.40306 were included in the source model. For the sources within (outside) a 5-degree distance from the RoI center, their the spectral parameters were allowed to vary (were frozen at the 4FGL-DR3 values). In addition, the Galactic background and extragalactic diffuse emission models, gll_iem_v07.fits and iso_P8R3_SOURCE_V3_v1.txt respectively, were included in the source model. The normalizations of these two components were always set as free parameters in the following analyses.
| Model | Best-fit parameters | TS | |
|---|---|---|---|
| LP† | |||
| LP‡ | 10744073.48 | 406 | |
| PL‡ | 10744065.59 | 456 | |
| PLSEC‡ | 10744072.31 | 416 | |
| LP∗ | 10744092.98 | 595 | |
| PL∗ | 10744092.43 | 613 |
†Values given in 4FGL-DR3; ‡Values for a point source; ∗ Values for an extended source with radius 03.
2.2 Likelihood analysis
The source 4FGL J1844.40306 has an unknown type in 4FGL-DR3 as a point source (PS), having a position of R. A. = 281119, Decl. = 3116 (J2000.0) with an error ellipse (at a 95% confidence) semi-major and semi-minor axes of 0116 and 0076 respectively (Figure 1). The source’s emission is fitted with a Log-Parabola (LP) model in the catalog, , where the and catalog values are given in Table 1 ( GeV is fixed). To fully investigate the -ray properties of this source, we also considered a power-law (PL) model, , and a sub-exponentially cutoff power law (PLSEC; Abdollahi et al. 2022), (when ; see Abdollahi et al. 2022 for details). For the latter, we intended to test if the emission could be better described with that of a pulsar, and the function form was recently proposed to be used for pulsars so as to reduce the correlation between the parameters in analysis (Abdollahi et al., 2022).
A standard binned likelihood analysis was performed to data in 0.3–500 GeV, in which the image scale was 01 and the size in pixels was 150. We did not use the data below 0.3 GeV because the source is in the Galactic plane where the background emission is dominant below the energy (Abdollahi et al., 2020). The source position was fixed at that given in 4FGL-DR3, and we first assumed a PS spatial model as in the catalog. Each of the three spectral models described above was tested in the analysis. In the LP model, is the scale parameter and was always fixed at 1.6 GeV in our analysis, following that given given in 4FGL-DR3. The similar scale parameter in the PL model was fixed at 1 GeV. The parameters and in the PLSEC model were fixed at and 1 GeV respectively, where the latter was set because of the correlation between and the normalization. The resulting best-fit parameters and TS values are given in Table 1. Of the PS spectral tests, the PL provided the largest TS value. However when we compared the likelihood values from the analyses with the models, using TS where are the maximum likelihood values from model and (see Table 1), the obtained TS values indicated that the LP and PLSEC models were 4.0 and 3.7, respectively, more preferable than the PL model. Below we considered the LP model as the one for describing emission from J1844.40306. It can be noted that the parameter of the LP model we obtained is smaller than that given in the catalog, but within the uncertainty (Table 1).
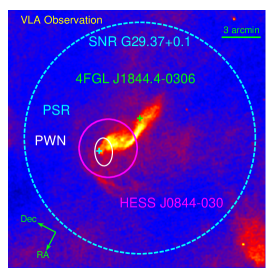
To illustrate the source field in the GeV band, we calculated a TS map in 0.3–500 GeV. By removing all the sources except J1844.40306 in the region, the TS map was obtained and is shown in the top left panel of Figure 1. The source is in a crowded region and relatively bright among the nearby sources. As can be seen, its 95% positional error region is highly coincident with that (95% confidence) of HESS J1844030 (magenta circle) and the source region of G29.37+0.1 (cyan dashed circle), where the latter was given by the radio observation (Petriella, 2019). We also show a VLA (1.4 GHz) radio image of G29.37+0.1 (Helfand et al., 2006) in the bottom panel of Figure 1. The position of J1844.40306 is close to the SNR’s center, at which the bright S-shaped structure is also located. The -ray position is approximately 0068 away from the X-ray source PS1 (as well as the putative PWN). The offset is within the 95% confidence error region of the -ray position, and thus the -ray source is in possible association with either PS1/PWN or the SNR.
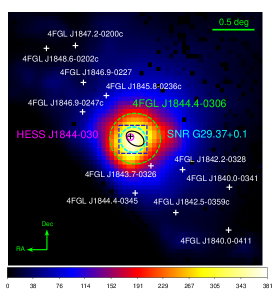
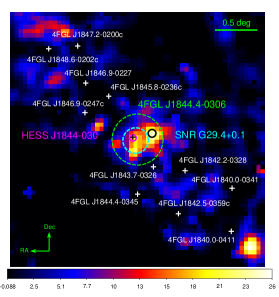
In addition, given the 0.3–500 GeV TS map shows possible evidence for source extension, we further calculated TS maps in the energy ranges of 5–500, 8–500, and 10–500 GeV to check. In the top right panel of Figure 1, we show the 5–500 GeV one. Additional TS20 emission northwest of J1844.40306 is seen, and it turns to be the only visible residual emission in 10–500 GeV. We ran gtfindsrc to the 10–500 GeV data, and a position of R.A.=280948, Decl.=3044 (equinox J2000.0), with a 1 nominal uncertainty of 0046, was obtained for the residual emission. However based on our analysis conducted in the next section, the emission could not be identified as an individual source.
2.3 Spatial analysis
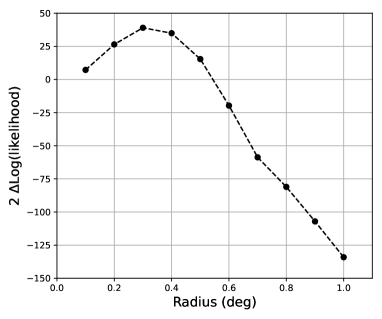
Given the above analysis results, we checked whether or not J1844.40306 is extended by setting up a uniform disk model in the source model file. A range of – radius, with a step of , for the uniform disk was tested. Assuming a LP spectral model for the source and performing the likelihood analysis, each of the resulting likelihood values was compared with that from considering a PS, that is, . The results are shown in Figure 2. At radius , the difference of the log-likelihood values is the largest, 38.4. The value indicates that the source is extended at a significance of 6.2 (given by ). Using the uniform disk model for the source, the best-fit LP parameters were found to be , , and the 0.3–500 GeV photon flux photon cm-2 s-1 (with a TS value of 595; also given in Table 1). The flux is higher than that from considering a PS by %. Also it can be noted that since the value is close to zero, the model fit has small curvature and is nearly a power law (Figure 3). We tested a PL spectral model to fit the extended emission and obtained , with a very similar value but a larger TS value (see Table 1). Thus a PL model equally well describes the extended emission.
Because the TS map at 5 GeV shows additional emission northwest of J1844.40306 (Figure 1), we conducted tests to determine whether the higher energy emission could be considered as an individual source. Adding it in the source model as a PS with its position at the one obtained in Section 2.2, we performed the likelihood analysis by assuming a PS or a uniform disk (with the same radius setup as the above) for J1844.40306 (i.e., two PSs or an extended disk plus a PS in the source model). Likely due to the faintness of the higher energy emission (TS20), the resulting likelihood values were not significantly increased. We thus concluded that the additional emission could not be determined as another source and it may be considered as part of the extended emission of J1844.40306.
We extracted a -ray spectrum of J1844.40306 in 0.3–500 GeV by considering an extended source with radius . The energy range was divided into 10 evenly logarithmically spaced energy bins. The maximum likelihood analysis was performed to the data in each energy bin, in which the sources within 5 degree of the target were set to have a free normalization parameter and all the other parameters of the sources in the source file were fixed at the values obtained in the above likelihood analysis assuming the LP spectral model for our source. The obtained spectral data points are given in Table LABEL:tab:spec and shown in Figure 3, for which the fluxes with TS4 were taken as measurements and otherwise 95% flux upper limits were derived.
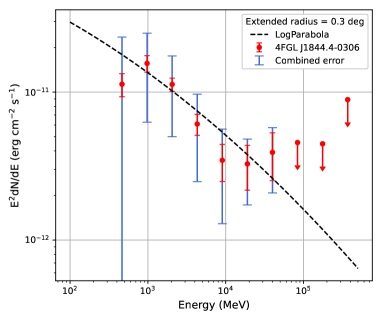
We note that Eagle (2022) also conducted a study of 4FGL J1844.40306, and similar results to ours were obtained, although the details were slightly different. For example, the best-fit template in the study was a radial Gaussian function, which assumes a centrally peaked intensity profile, rather than a flat-disk one in our analysis. Nevertheless, the source extension was found to be from the standard deviation of the Gaussian function, the same as ours. The spectrum of the source and the statistical uncertainties were reasonably consistent with ours. In addition, the systematic uncertainties were obtained in the study, and importantly, likely due to the crowdedness of the field, the values are mostly larger than the statistical ones. We thus obtained the systematic uncertainties for our spectral data points by interpolating from their values (as the energy bins in the study were 7 over an energy range of 0.3–2000 GeV; Eagle 2022). The obtained values (Table LABEL:tab:spec) were added in quadrature to the statistical uncertainties, and the combined uncertainties are shown in Figure 3, for which it can be noted that the systematic uncertainties are dominant at low, GeV energies and the first one at 0.5 GeV is large, comparable to the flux value (Table LABEL:tab:spec). The spectrum and the statistical plus systematic uncertainties are taken as the final measurements for the source (and to be discussed in Section 3), but the first data point is removed due to the large systematic uncertainty.
Based on these analyses, we summarize that the source J1844.40306, at the position R. A. = 281119, Decl. = 3116 (J2000.0) with an error ellipse (at a 95% confidence) semi-major and semi-minor axes of 0116 and 0076 respectively, has -ray emission being extended with a circular radius of 03 and described with a LP (or a PL) spectral model. Weak GeV emission was seen northwest of it, but the additional emission could not be significantly detected as another source.
2.4 Timing and variability analysis
As the X-ray source PS1 has been suggested as a putative young pulsar (Castelletti et al., 2017; Petriella, 2019), we performed timing analysis to the LAT data of J1844.40306 to search for possible -ray pulsations. The LAT events within an aperture radius of 0.5 deg in 0.1–500 GeV were selected for the analysis. We divided the whole data into sets of 2-yr long, and the timing-differencing blind search technique (Atwood et al., 2006) was applied to the events in each 2-yr data set. The search range of frequency () and frequency derivative over frequency () were 0.5–32 Hz and 0–1.310-11 s-1 (where the high-end range value is that of the Crab pulsar), with steps of 1.90735 Hz and 9.451 s-1, respectively. However, no significant -ray pulsations from the source was found.
| TS | ||
| (GeV) | ( erg cm-2 s | |
| 0.5 | 71 | |
| 1.0 | 207 | |
| 2.1 | 157 | |
| 4.3 | 50 | |
| 9.0 | 15 | |
| 19.0 | 11 | |
| 39.9 | 11 | |
| 83.7 | 0.2 | |
| 175.8 | 0.1 | |
| 369.1 | 1.4 |
Statistical and systematic uncertainties for fluxes are given, where the latter are interpolated from those given in Eagle (2022).
Since the S-shaped structure is likely an extragalactic radio galaxy and such sources could emit variable -rays (Abdollahi et al., 2022), we also checked the variability of J1844.40306. In 4FGL-DR3, its Variability_Index is given to be 8.93, lower than the variability threshold value 24.725 (for 12 bins with 1 yr per bin; Abdollahi et al. 2022). We re-calculated Variability_Index by using the best extended model we found above, and our data contain 13 1-yr time bins. A light curve consisting of 13 bins was obtained, in which only the spectral normalizations of all sources within 5 degree of J1844.40306 were set as free parameters. The obtained Variability_Index was 9.30. Thus no variations were detected in the source, and there is no strong evidence to suggest an association between the candidate radio galaxy and the -ray source.
3 Discussion and Summary
Because of the positional coincidence of 4FGL J1844.40306 with G29.37+0.1 (as well as HESS J1844030), we analyzed the Fermi LAT data for this source. When considering it as a PS, its emission appears to be described with a curved function, as more preferably fitted with an LP or PLSEC model than a PL. The emission could arise from the putative pulsar (i.e., PS1 in Castelletti et al. 2017; Petriella 2019), whose X-ray emission has been studied in detail by Petriella (2019). At a distance of 6.5 kpc (Petriella, 2019), the -ray luminosity would be erg s-1, suggesting a -ray efficiency of 2.6% based on the spin-down energy estimated for the pulsar by Petriella (2019). The efficiency value appears to be in the proper range derived for young pulsars (characteristic ages less than yrs; Abdo et al. 2013; Lu et al. 2021). However aside from these, no clear evidence, such as pulsed emission from the putative pulsar (e.g., Section 2.4), has been found.
Instead, we have found that the -ray source is extended, at a significance level of 6.2. Also the model fit for the extended source was changed to have small curvature (; Table 1), different from those of pulsars that often have an exponential cutoff at several GeV energies (Abdo et al., 2013). In addition, its GeV band spectrum can be relatively well connected to that of HESS J1844030 in TeV energies (see below), likely indicating its association with HESS J1844030. Given these properties and those derived from multi-wavelength data analyses, we discuss its possible origin in the following sub-sections by considering an SNR scenario (Section 3.1), a PWN scenario (Section 3.2), or a composite PWN-SNR scenario (Section 3.3). A summary is provided at the end in Section 3.4.
| Model | ||||||||
|---|---|---|---|---|---|---|---|---|
| () | ( erg) | ( erg) | (TeV) | (PeV) | (G) | |||
| A | 0.01 | 10 | 2.6 | 24.0 | 240.2 | 40 | 1 | 5 |
| B | 0.1 | 10 | 2.6 | 74.1 | 74.7 | 10 | 1 | 5 |
| C | 0.01 | 1000 | 2.5 | 0.2 | 2.1 | 50 | 1 | 5 |
| D | 0.1 | 1000 | 2.5 | 0.8 | 0.8 | 50 | 1 | 5 |
3.1 SNR Scenario
Taking the radio halo of G29.37+0.1 as a Galactic SNR (Castelletti et al., 2017; Petriella, 2019), the high-energy and VHE -ray emissions from it could correspond to 4FGL J1844.40306 and HESS J1844030 respectively. Note that there are no radio flux measurements and no X-ray detection of the halo, the latter possibly due to high hydrogen column density ( cm-2) towards the target region (Castelletti et al., 2017; Petriella, 2019). We thus model the GeV fluxes obtained in this work and TeV ones from H.E.S.S. (H. E. S. S. Collaboration et al., 2018). Both hadronic and leptonic processes are considered, in the latter of which the non-thermal bremsstrahlung process is included.
We assume that the particles accelerated by the SNR shock have a power-law form with a high-energy cutoff,
| (1) |
where e or p, is the power-law index, is the cutoff energy, and the normalization is determined by the total energy in particles with energy above 1 GeV, . To model the broadband SED from these energy distributions of particles, we used the PYTHON package Naima (Zabalza, 2015), which includes the synchrotron (Aharonian et al., 2010), non-thermal bremsstrahlung (Baring et al., 1999), ICS (Khangulyan et al., 2014), and pion-dacay (Kafexhiu et al., 2014) processes. In the calculation, we set presuming the charge-independent acceleration process. Considering the long lifetime of protons and the lack of the constraint on the high-energy cutoff, PeV is set. For the electrons, the cooling-limited maximum energy is used if the cutoff energy can not be constrained by the data. In addition, we employ the parameter instead of to control the number ratio of electrons to protons at 1 GeV. The measurement of the local CRs around the Earth implies . Some theoretical predictions suggest that may be up to 0.1 (Merten et al., 2017). Taking these into account, two cases, and 0.1, are respectively considered.
For the number density of the target gas (), no reliable value can be derived according to the current observations of the target field. Petriella (2019) gave a rough estimate of the ambient density based on the assumption that the SNR shock has swept part of the HI gas surrounding it. While there has been no evidence supporting the interaction of the SNR with any molecular cloud (MC; Petriella 2019), three MCs with a density (in atomic hydrogen) of order and a distance of 5–6 kpc have been found at the boundary of the radio halo (Castelletti et al., 2017), which possibly provide sufficient targets in the hadronic process. Thus, we also consider two cases: and .
The seed photon fields for the ICS process include the cosmic microwave background (CMB) radiation, the dust infrared (IR) with a temperature of 40 K and an energy density of , and the star light (SL) with a temperature of 4000 K and an energy density of . The IR and SL components around the target’s position are calculated based on the approximate method provided by Shibata et al. (2011).
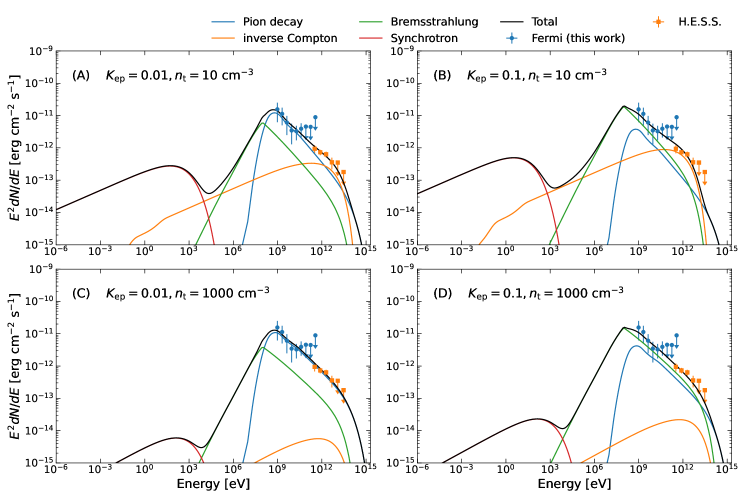
To summarize our model setup, there are four cases named Model A–D (Table 3), and in each case there are three free parameters: , , and . The SED of each model that best fits the GeV-TeV fluxes is obtained (Figure 4) and the corresponding parameters are summarized in Table 3. For this SNR scenario, since there are no radio or X-ray flux measurements, we just present the synchrotron fluxes under the magnetic field strength of G. In the case of , can be roughly constrained by the TeV fluxes, but for , it can not be and is thus set to be the synchrotron cooling-limited maximum energy TeV, where yr, the SNR’s age approximately estimated by Petriella (2019).
As can be seen in Figure 4, the radiation mechanism of the GeV-TeV -ray emission depends on the parameters and . For example, the GeV-TeV emission has a leptonic origin for and (Figure 4b). While for and (Figure 4c), it has a pure hadronic origin. Considering the fact that of the order of is commonly favored based on the measured electron-to-proton ratio in the CRs (e.g., Blasi 2013), Model A and C are preferred. The modeling results suggest that the GeV -ray emission may mainly has a hadronic origin, and depending on the target-gas density, the TeV emission may be dominated by the hadronic process (when the density is high) or contains substantial contribution from the ICS process (when the density is relatively low).
Considering the canonical explosion energy erg and typical energy conversion efficiency of 10%, the product erg cm-3 in Model A and C implies that G29.37+0.1 must be in a high-density environment. Indeed, we note that the additional 5 GeV emission (cf., top right panel of Figure 1) is outside of the SNR region but within the 03-radius extension and is positionally coincident with the three MCs mentioned in Castelletti et al. (2017). We may suspect that at least part of the higher energy emission of J1844.40306 likely arises from the interaction of the SNR or its precusor with the MCs, for the latter of which theoretical studies have predicted (Federici et al., 2015). Hopefully, the SNR hadronic scenario, the association between the SNR and the three MCs or other dense matter, could be clarified in future observational studies. In addition, flux measurements on the radio emission can help to constrain the magnetic field, since it affects the synchrotron cooling-limited maximum energy and thus the ICS contribution to the TeV -ray emission.
3.2 PWN scenario
Both Castelletti et al. (2017) and Petriella (2019) have shown that the non-thermal X-ray nebula surrounding PS1 likely has a PWN origin, powered by PS1 the putative young pulsar. We thus also investigate whether a PWN scenario can provide an explanation for the -ray emissions. Here we consider a broad-band SED that additionally includes the model spectrum in 1.5–8.0 keV for the X-ray nebula, which was derived from multiple Chandra and XMM-Newton observations (Petriella, 2019).
Based on the time-dependent PWN model (e.g., Zhang et al., 2008; Li et al., 2010; Tanaka & Takahara, 2010; Martín et al., 2012), the lepton spectrum, , inside the PWN is governed by the continuity equation in the energy space
| (2) |
where is the Lorentz factor of the leptons, the energy loss rate including the synchrotron radiation, the ICS process, and the adiabatic loss (see Li et al., 2010), and the escape time which can be estimated via Bohm diffusion (e.g. Zhang et al., 2008). The injection rate of leptons is generally assumed to be a broken power-law function
| (3) |
where denotes the break energy, and are the spectral indices below and above the break energy respectively. The normalization is determined from the total energy in the leptons, , converted from the spin-down power of the pulsar, where is the energy conversion fraction from to that of the magnetic field. The evolution of the spin-down power is governed by , where , , and are the initial spin-down luminosity, the initial spin-down timescale, and the breaking index, respectively (Pacini & Salvati, 1973). The minimum energy of the injected leptons is assumed to be , while the maximum energy is constrained by introducing a parameter , which requires that the Larmor radius of the leptons must be less than the termination shock radius (see Martín et al., 2012). The maximum energy is thus given by
| (4) |
where is the electron charge, is the electron mass, is speed of light, and is the magnetic compression ratio (Martín et al., 2012, and reference therein).
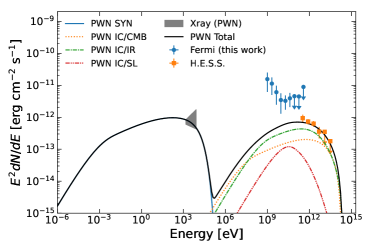
The lepton energy distribution in the PWN can be obtained by solving equation 2. Then the spectrum from radio to X-ray frequencies is calculated via the synchrotron process. The same population of the leptons also produce the -ray emission from the sub-GeV to VHE regime through the ICS process. The seed photon fields for the ICS process are the same as those used in the SNR scenario. The distance and age of the radio halo of G29.37+0.1 was constrained to be 6.5 kpc and kyr respectively (Petriella, 2019). We assume that the putative pulsar, originating from the supernova explosion, has the same distance and age (). For the pulsar’s breaking index, we adopt the standard value of as due to the magnetic dipole radiation. The initial spin-down timescale is degenerate with the initial spin-down luminosity for given and . We assume kyr. To explain the -ray luminosity, , corresponding to at the present time. The value is roughly consistent with the range of estimated from the empirical relations between the spin-down energy and the X-ray emission given in Petriella (2019). Due to lack of the radio data, the index below the break is fixed at a common value in the calculation (Sironi & Spitkovsky, 2011). The other parameters are approximated to be , , , and , which are all consistent with those of typical -ray-bright PWNe (see Table 1-3 in Zhu et al., 2018). These parameters and used values are summarized in Table 4, and the corresponding SED is displayed in the left panel of Figure 5. At the present time, the average magnetic field in the PWN given by is 5.2 G, and the maximum energy of electrons constrained by is 250 TeV. As shown in the left panel of Figure 5, however, the ICS process of the PWN can not provide a fit to the GeV -ray data points, suggesting that the pure PWN scenario can not simultaneously explain the observed GeV and TeV -ray emissions.
3.3 Composite PWN-SNR scenario
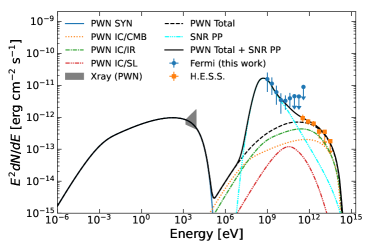
In the pure PWN model, the GeV data is not explained and needs an additional component that may be contributed by the SNR. We thus consider a composite scenario, in which the role of the PWN is similar to that of the ICS process in the SNR scenario. For simplicity, only the hadronic process discussed in Section 3.1 is included. In addition, to stress the role of the PWN, we assume the TeV emission is dominated by the contribution of the PWN.
To explain the GeV -ray emission, the power-law index and the total energy in protons erg are needed. The resulting lepto-hadronic SED (i.e, PWN+SNR) is shown as the black solid line in the right panel of Figure 5. This hybrid model can thus explain the broad-band SED, although it also requires a high-density environment for providing targets in the hadronic process.
3.4 Summary
Following the radio and X-ray studies of the region that contains the VHE source HESS J1844030 and the SNR G29.37+0.1 conducted by Castelletti et al. (2017) and Petriella (2019), we have analyzed the Fermi LAT data for the GeV source 4FGL J1844.40306 that is also located in the region. The GeV source is determined to be extended, but whether it contains emission from a young pulsar, whose existence has been suggested from the X-ray studies, remains to be resolved. The GeV spectrum can be connected to that of HESS J1844030, suggesting that the -ray emission arises from the composite SNR. By modeling the -ray spectrum and the broad-band SED that include the X-ray flux measurements for the putative PWN, we show that while either a hadronic or a leptonic origin may explain the TeV emission, a hadronic process is likely required in order to explain the GeV emission. Thus the Fermi LAT source 4FGL J1844.40306 is likely the GeV counterpart to the SNR G29.37+0.1, and our study helps provide a clearer picture for understanding this complex Galactic region.
| Parameters | Symbol | Value | Ref. |
|---|---|---|---|
| Distance (kpc) | 6.5 | Petriella (2019) | |
| Age (kyr) | 10 | Assumed | |
| Breaking index | 3 | Assumed | |
| Initial spin down timescale (kyr) | 2 | Assumed | |
| Initial spin down luminosity () | This work | ||
| Break energy | This work | ||
| Low energy index | 1.5 | Fixed | |
| High energy index | 2.55 | This work | |
| Shock radius fraction | 0.1 | This work | |
| Magnetic fraction | 0.09 | This work | |
| CMB temperature (K) | 2.73 | Fixed | |
| CMB energy density () | 0.26 | Fixed | |
| IR temperature (K) | 40 | Fixed | |
| IR energy density () | 1 | Fixed | |
| SL temperature (K) | 4000 | Fixed | |
| SL energy density () | 2 | Fixed |
References
- Abdo et al. (2010) Abdo, A. A., Ackermann, M., Ajello, M., et al. 2010, ApJS, 188, 405
- Abdo et al. (2013) Abdo, A. A., Ajello, M., Allafort, A., et al. 2013, ApJS, 208, 17
- Abdollahi et al. (2020) Abdollahi, S., Acero, F., Ackermann, M., et al. 2020, ApJS, 247, 33
- Abdollahi et al. (2022) Abdollahi, S., Acero, F., Baldini, L., et al. 2022, ApJS, 260, 53
- Aharonian et al. (2010) Aharonian, F. A., Kelner, S. R., & Prosekin, A. Y. 2010, Phys. Rev. D, 82, 043002
- Albert et al. (2020) Albert, A., Alfaro, R., Alvarez, C., et al. 2020, ApJ, 905, 76
- Atoyan & Aharonian (1996) Atoyan, A. M., & Aharonian, F. A. 1996, MNRAS, 278, 525
- Atwood et al. (2006) Atwood, W. B., Ziegler, M., Johnson, R. P., & Baughman, B. M. 2006, ApJ, 652, L49
- Atwood et al. (2009) Atwood, W. B., Abdo, A. A., Ackermann, M., et al. 2009, ApJ, 697, 1071
- Baade & Zwicky (1934) Baade, W., & Zwicky, F. 1934, Physical Review, 46, 76
- Baring et al. (1999) Baring, M. G., Ellison, D. C., Reynolds, S. P., Grenier, I. A., & Goret, P. 1999, ApJ, 513, 311
- Blasi (2013) Blasi, P. 2013, A&A Rev., 21, 70
- Bykov et al. (2018) Bykov, A. M., Ellison, D. C., Marcowith, A., & Osipov, S. M. 2018, Space Sci. Rev., 214, 41
- Castelletti et al. (2017) Castelletti, G., Supan, L., Petriella, A., Giac ani, E., & Joshi, B. C. 2017, A&A, 602, A31
- Dermer (1986) Dermer, C. D. 1986, A&A, 157, 223
- Drury et al. (1994) Drury, L. O., Aharonian, F. A., & Voelk, H. J. 1994, A&A, 287, 959
- Eagle (2022) Eagle, J. L. 2022, PhD thesis, Clemson University, South Carolina
- Federici et al. (2015) Federici, S., Pohl, M., Telezhinsky, I., Wilhelm, A., & Dwarkadas, V. V. 2015, A&A, 577, A12
- Gaensler & Slane (2006) Gaensler, B. M., & Slane, P. O. 2006, ARA&A, 44, 17
- Gelfand et al. (2009) Gelfand, J. D., Slane, P. O., & Zhang, W. 2009, ApJ, 703, 2051
- H. E. S. S. Collaboration et al. (2018) H. E. S. S. Collaboration, Abdalla, H., Abramowski, A., et al. 2018, A&A, 612, A1
- Helfand et al. (2006) Helfand, D. J., Becker, R. H., White, R. L., Fallon, A., & Tuttle, S. 2006, AJ, 131, 2525
- Kafexhiu et al. (2014) Kafexhiu, E., Aharonian, F., Taylor, A. M., & Vila, G. S. 2014, Phys. Rev. D, 90, 123014
- Kennel & Coroniti (1984) Kennel, C. F., & Coroniti, F. V. 1984, ApJ, 283, 694
- Khangulyan et al. (2014) Khangulyan, D., Aharonian, F. A., & Kelner, S. R. 2014, ApJ, 783, 100
- Li et al. (2010) Li, H., Chen, Y., & Zhang, L. 2010, MNRAS, 408, L80
- Lu et al. (2021) Lu, Q.-W., Wang, Z.-X., & Xing, Y. 2021, Research in Astronomy and Astrophysics, 21, 057
- Martín et al. (2012) Martín, J., Torres, D. F., & Rea, N. 2012, MNRAS, 427, 415
- Merten et al. (2017) Merten, L., Becker Tjus, J., Eichmann, B., & Dettmar, R.-J. 2017, Astroparticle Physics, 90, 75
- Pacini & Salvati (1973) Pacini, F., & Salvati, M. 1973, ApJ, 186, 249
- Petriella (2019) Petriella, A. 2019, A&A, 626, A65
- Reynolds (2017) Reynolds, S. P. 2017, Dynamical Evolution and Radiative Processes of Supernova Remnants, ed. A. W. Alsabti & P. Murdin, 1981
- Shibata et al. (2011) Shibata, T., Ishikawa, T., & Sekiguchi, S. 2011, ApJ, 727, 38
- Sironi & Spitkovsky (2011) Sironi, L., & Spitkovsky, A. 2011, ApJ, 741, 39
- Sturner et al. (1997) Sturner, S. J., Skibo, J. G., Dermer, C. D., & Mattox, J. R. 1997, ApJ, 490, 619
- Tanaka & Takahara (2010) Tanaka, S. J., & Takahara, F. 2010, ApJ, 715, 1248
- Tanaka & Takahara (2011) —. 2011, ApJ, 741, 40
- Zabalza (2015) Zabalza, V. 2015, Proc. of International Cosmic Ray Conference 2015, 922
- Zhang et al. (2008) Zhang, L., Chen, S. B., & Fang, J. 2008, ApJ, 676, 1210
- Zhu et al. (2018) Zhu, B.-T., Zhang, L., & Fang, J. 2018, A&A, 609, A110