Origins of the shocks in high-mass starless clump candidates
Abstract
Shocks are abundant in star-forming regions, and are often related with star formation. In our previous observations toward 100 starless clump candidates (SCCs) in the Galaxy, a sample of 34 SCCs associated with shocks is identified. In this work, we perform mapping observations of the SiO 2-1, 3-2, HC3N 10-9, HCO+ 1-0, H13CO+ 1-0, and H41 lines toward 9 out of the detected sources by using IRAM 30-m radio telescope to study the origins of the shocks in the SCCs. We find shocks in three sources (BGPS 3110, 3114, and 3118) are produced by collisions between the expanding ionized gas and ambient molecular gas, instead of by the star formation activity inside SCCs. On the other hand, shocks in the other six sources are related to star formation activity of SCCs. The signatures of protostellar outflows are clearly shown in the molecular lines toward BGPS 4029, 4472, 5064. Comparing our results with the previous ALMA observations performed in the same region, the shocks in BGPS 3686 and 5114 are also likely to be due to protostellar activity. The origin of shock in BGPS 5243 is still unclear although some features in the SiO spectra imply the presence of protostellar activity.
keywords:
star: formation – star: massive – ISM: shocks – ISM: structure – ISM: H II regions1 Introduction
Massive stars (M) are important in the evolution of galaxies, but the origin of massive stars are under debate (Motte et al., 2018). Massive starless clumps in molecular clouds could be precursors of protostellar cores (Kirsanova et al., 2021). A sample of massive clumps have been identified as Starless Clump Candidates (SCCs) in the 1.1 mm continuum Bolocam Galactic Plane Survey (BGPS) (Svoboda et al., 2016). Since high-mass protostars whose strong feedbacks can disturb the ambient environments are unlikely to be embedded in the SCCs of this sample (Svoboda et al., 2016; Calahan et al., 2018), these SCCs represent the environments at the early stage of star formation (Svoboda et al., 2016; Matzner, 2017; Calahan et al., 2018).
Shocks are abundant in star-forming regions, and the processes of star formation are generally associated with shocks. The jets and molecular outflows from protostellar activities with supersonic speed can lead to shocks, and the expansion of H II region which is ionized by massive main-sequence stars may also cause shocks (Deharveng et al., 2010; Zhu et al., 2015; Tafoya et al., 2021). Even in infrared dark clouds (IRDCs) regarded as the early stage of star formation, shocks were also detected (Motte et al., 2018; Li et al., 2019). The formation of shocks in early star-forming regions is commonly attributed to outflows from the protostars deeply embedded in molecular clouds. Svoboda et al. (2019) presented the ALMA Band 6 1.3 mm continuum and spectral line survey toward 12 high-mass SCCs. The shocks detected in these clumps are all caused by the outflows from low- and intermediate-mass protostars. However, some previous works suggested that colliding flows and cloud-cloud collision could also lead to low-velocity and widespread shocks (Jiménez-Serra et al., 2010; Nguyen Luong et al., 2013). Csengeri et al. (2016) performed a spectral line survey of a sample of 430 sources from the APEX telescope large area survey of the Galaxy (ATLASGAL). The SiO lines attributed to low-velocity shocks from cloud-cloud collisions are detected in some infrared-quiet clumps. In addition, a part of shocks in W43-MM1 ridge are also probably associated with colliding flows (Louvet et al., 2016).
In order to detect the shocks in star-forming regions, SiO rotational lines are often used (Jiménez-Serra et al., 2010; Duarte-Cabral et al., 2014; Cosentino et al., 2018; Svoboda et al., 2019). The SiO abundance can be increased by fast shocks up to several orders of magnitude higher than the abundance in dormant regions (Gusdorf et al., 2008). This makes the SiO molecule be a good shock tracer. In previous works, SiO lines were able to probe high-velocity ( km s-1) and low-velocity shocks ( km s-1) in star-forming regions (Nguyen Luong et al., 2013; Duarte-Cabral et al., 2014; Csengeri et al., 2016). The high-velocity shocks are thought to be caused by protostellar outflows, and the low-velocity ones could originate from colliding gas flows or weak outflows from low- and intermediate-mass protostars (Louvet et al., 2016). The SiO lines attributed to high-velocity shocks always have broad profiles while the profiles of the lines attributed to low-velocity shocks are narrow (Louvet et al., 2016; Csengeri et al., 2016). Some previous studies showed that the SiO emission can contain both broad and narrow components (Nguyen Luong et al., 2011, 2013; Sanhueza et al., 2013).
We recently performed single-dish observations of SiO lines (J=1-0, 2-1 and 3-2) toward 100 SCCs (Zhu et al., 2020). The detection rate of the SiO lines is about 30. About 30 detected SiO lines have a broad line width with full width at zero power (FWZP) greater than 20 km s-1, while about 40 of the SiO detections have narrow line widths with FWZP less than 10 km s-1. However, the origins of the shocks indicated by narrow SiO line profiles are unclear and have several possible candidates, such as outflows from low-mass protostars and cloud-cloud collisions (Cosentino et al., 2018). In the sources with detections of broad SiO lines, whether widespread low-velocity shocks exist also needs to be checked (Nguyen Luong et al., 2013). Then whether the shocks in these sources mainly result from star formation activities or from large-scale movement of clouds is unknown.
The identification of the main origin or the percentages of different origins of shocks in SCCs is crucial. This knowledge can aid in the study of the evolutionary processes in the early stage of massive star formation. In some cases, early phases of massive star formation have been found to exhibit bipolar outflows leading to shocks (Tan et al., 2016; Feng et al., 2016). This suggests that outflows and accretion processes could have begun in the early stage of massive star formation (Tan et al., 2016). If the majority of shocks in SCCs are caused by outflows, then accretion and outflow processes should be common in the SCCs with SiO detections as the early stage of star formation. Alternatively, determining the percentage of shocks resulting from collisions between large-scale gas components in SCCs is also helpful to evaluate the significance of these events in the early-stage star formation environment.
The molecular lines of HCO+ 1-0, HC3N 10-9, and the isotope H13CO+ 1-0 are often used to trace dense gas in star-forming regions (Beuther & Sridharan, 2007; Cosentino et al., 2018; Liu et al, 2020), which are also used for the studies of extragalactic star-forming activities (Michiyama et al., 2018; Nayana et al., 2020). HCO+ and H13CO+ 1-0 lines can trace dense gas within clumps and extended gas surrounding clumps as well, while (sub-)millimeter HC3N lines better trace dense cores in clumps (Nishimura et al., 2017; Liu et al, 2020) than HCO+ and H13CO+ 1-0 lines. With mapping observations for these lines, the velocity integrated flux distribution and velocity field of high-density gas can be revealed. The potential outflows could also be recognized by the high-velocity emission of the HCO+ 1-0 line (López-Sepulcre et al., 2013; Liu et al, 2020). Comparing the spatial distributions of these dense-gas and outflow tracers with that of the SiO lines, the origins of the shocks in the SCCs can be studied and revealed. Moreover, hydrogen recombination lines which are useful to detect ionized gas (Wood & Churchwell, 1989) can be used to distinguish shocks caused by expansion of ionized gas from those due to the star formation activities in SCCs, especially since the influence of classical H II regions might be missed in classifying massive starless and star-forming clumps (Svoboda et al., 2016).
In this work, we present the mapped observations of the SiO 2-1, 3-2, HC3N 10-9, HCO+ 1-0, H13CO+ 1-0, and H41 lines toward 9 SCCs using IRAM 30m radio telescope. These SCCs have been observed in our previous work (Zhu et al., 2020) and are associated with the SiO emissions. The positions and the morphologies of the dense clumps are displayed. And the origins of the shocks in these SCCs are studied and discussed. The organization is as follows. In Section 2, the details of the observations and the selected sample are described. The results of the observations are shown in Section 3. The discussions and analyses of the results are presented in Section 4. In Section 5, the summary is written.
2 Source sample and Observations
2.1 Sample
The sample in the current work consists of 9 sources selected from the 100 SCCs in our previous single-dish observations of the SiO 1-0, 2-1 and 3-2 lines using KVN 21m telescopes (Zhu et al., 2020). These SCCs were identified by using indicators of star formation including compact 70 sources, mid-IR color-selected YSOs, H2O and CH3OH masers, and ultra-compact H II regions in Svoboda et al. (2016). The selected sources were detected with SiO 2-1 line peak stronger than 60 mK in Zhu et al. (2020), which guarantee SiO 2-1 detection in mapping observations. The SiO 2-1 line peak is only 33 mK in BGPS 3686, but it is one of the brightest sources in the SiO 3-2 line. So BGPS 3686 is included in the selected sample. In addition, the SiO line widths in these sources are also considered. We prefer to choose sources with various SiO line widths in order that different kinds of shock origins may be discovered.
The properties of the sources are listed in Table 1. The distances of these sources range from 1.85 to 5.21 kpc. The Vlsr measured from single-dish H2CO 212-111 observations is considered as the systematic velocity of the sources (Zhu et al., 2020). The mass surface densities and the gas masses of the selected sources are provided by Ginsburg et al. (2013). The velocity-integrated SiO 2-1 line intensities obtained from previous observations are also listed.
| Source | Ra | Dec | Distance | vb | Mass | H2 Column density | |
|---|---|---|---|---|---|---|---|
| hh:mm:ssa | dd:mm:ssa | kpc | km s-1 | M⊙ | cm-2 | K km s-1 | |
| BGPS 3110 | 18:20:16.27 | -16:08:51.13 | 2.005 | 370.8 | |||
| BGPS 3114 | 18:20:31.50 | -16:08:37.80 | 1.848 | 5371.3 | |||
| BGPS 3118 | 18:20:16.17 | -16:05:50.72 | 2.001 | 365.4 | |||
| BGPS 3686c | 18:34:14.58 | -09:18:35.84 | 2.939 | 404.7 | |||
| BGPS 4029c | 18:35:54.40 | -07:59:44.60 | 3.539 | 473.4 | |||
| BGPS 4472 | 18:41:17.32 | -05:09:56.83 | 3.216 | 130.3 | |||
| BGPS 5064 | 18:45:48.44 | -02:44:31.65 | 5.210 | 1958.2 | |||
| BGPS 5114c | 18:50:23.54 | -03:01:31.58 | 3.681 | 821.9 | |||
| BGPS 5243 | 18:47:54.70 | -02:11:10.72 | 5.210 | 421.9 |
2.2 Observations and Data reduction
We performed mapping observations toward 9 SCCs using IRAM 30-m telescope in April 2020. We used 3 mm (E0) and 2 mm (E1) bands of the Eight Mixer Receivers (EMIR) simultaneously and the FTS backend with an 195 kHz channel width and an 8 GHz band width for the observations. The frequency ranges are 84.5-92.3 GHz and 128.0-135.8 GHz for the 3 mm and 2 mm bands, respectively. The spectrometer resolution is typically about 0.67 km s-1 in the 3 mm band, and is about 0.45 km s-1 in the 2 mm band. The OTF PSW observing mode was used to cover an area of for each source. This angular size corresponds to an area of pc2 for different sources. The beam sizes were and for the 3 mm and 2 mm bands, respectively. The locations of SCCs given in Svoboda et al. (2016) correspond to the centers of observational fields. The reference positions are 1 degree offset from each source in RA. The dump time is 0.5 second, while the sampling interval is . The system temperatures are typically 100 K and 120 K for the 3 mm and the 2 mm bands. The precipitable water vapour (pwv) with the average conditions is about 4.0 mm. The accuracy of absolute flux calibration is better than 20. The line frequencies, the beam sizes and the main-beam efficiencies corresponding to the observed molecular and atomic lines are listed in Table 2.
The observations were reduced with CLASS reduction package (https://www.iram.fr/IRAMFR/GILDAS). Linear baselines were removed from the spectra. The rms noise levels in Tmb are typically 35 mK and 50 mK per pixel in the 3 mm and 2 mm bands, respectively. Because the integration times and weather condition for the observations toward the sources are not significantly different, the rms noise levels of the main-beam brightness temperature corresponding to the molecular lines are consistent for different sources.
| Transition | Frequency [MHz] | Beam size [′′] | B | Sν/T [Jy/K] |
|---|---|---|---|---|
| SiO 2-1 | 86847.00 | 28 | 0.81 | 5.8 |
| SiO 3-2 | 130268.71 | 19 | 0.75 | 6.1 |
| HCO+ 1-0 | 89188.53 | 28 | 0.81 | 5.8 |
| H13CO+ 1-0 | 86754.29 | 28 | 0.81 | 5.8 |
| HC3N 10-9 | 90979.02 | 27 | 0.81 | 5.8 |
| H41 | 92034.43 | 27 | 0.81 | 5.8 |
-
•
Notes. The beam size, B, and Sν/T are derived from https://publicwiki.iram.es/Iram30mEfficiencies.
3 results
In this work, we present SiO 2-1, 3-2, HCO+ 1-0, H13CO+ 1-0, HC3N 10-9, and H41 lines toward 9 SCCs. The SiO lines are used to study the shocked gas, while HCO+ 1-0, H13CO+ 1-0 and HC3N 10-9 lines are used as dense gas tracers. The H41 line is used to analyze the ionized gas in H II regions.
The properties of the observed molecular and hydrogen recombination lines toward the SCCs are written in Table 3. They are measured within the regions that cover the compact parts of clumps and shocked gas, which are indicated by the black dashed circles shown in Figure 2-13. A single Gaussian distribution is used to estimate the properties from line profiles. The derived values in Table 3 correspond to the main velocity component in cases where multiple velocity components were identified. Moreover, the uncertainties of absolute flux calibration are not included in the uncertainties listed in Table 3.
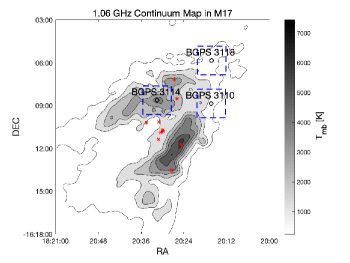
The molecular lines are detected in all of the sources. The H41 line is only detected in three SCCs (BGPS 3110, 3114 and 3118). According to the 1.06 GHz continuum map toward M17 H II region provided by the THOR project (Beuther et al., 2016) and presented in Figure 1, the SCCs, BGPS 3110, 3114, and 3118, are located in or near the H II region.
| SiO 2-1 | SiO 3-2 | H13CO+ 1-0 | ||||||||
| Source | Tka | Vlsr | FWHM | Vlsr | FWHM | Vlsr | FWHM | |||
| [K] | [km s-1] | [km s-1] | [K km s-1] | [km s-1] | [km s-1] | [K km s-1] | [km s-1] | [km s-1] | [K km s-1] | |
| BGPS 3110 | 25.17 | 18.030.19 | ||||||||
| BGPS 3114 | - | |||||||||
| BGPS 3118 | 23.68 | … | … | …b | ||||||
| BGPS 3686 | 14.70 | |||||||||
| BGPS 4029 | 11.87 | |||||||||
| BGPS 4472 | 14.29 | |||||||||
| BGPS 5064 | 15.80 | |||||||||
| BGPS 5114 | 14.12 | |||||||||
| BGPS 5243 | 12.69 | |||||||||
| HCO+ 1-0 | HC3N 10-9 | H41 | ||||||||
| Source | Vlsr | FWHM | Vlsr | FWHM | Vlsr | FWHM | ||||
| [km s-1] | [km s-1] | [K km s-1] | [km s-1] | [km s-1] | [K km s-1] | [km s-1] | [km s-1] | [K km s-1] | ||
| BGPS 3110 | ||||||||||
| BGPS 3114 | … | … | …c | |||||||
| BGPS 3118 | ||||||||||
| BGPS 3686 | ||||||||||
| BGPS 4029 | ||||||||||
| BGPS 4472 | ||||||||||
| BGPS 5064 | ||||||||||
| BGPS 5114 | ||||||||||
| BGPS 5243 | ||||||||||
-
•
a The kinetic temperatures in the SCCs are given in Svoboda et al. (2016).
-
•
b The signial-to-noise ratio of SiO 3-2 line is lower than 3 in the measured region, but this line is clearly detected in the southwest of BGPS 3118 as shown in Figure 17.
-
•
c The HC3N 10-9 line can be detected in BGPS 3114 if the measured region is much shrunk.
3.1 The sources without H41 detections
The optically thin HCO+ 1-0 emission at the line wings, comparing with simultaneously obtained H13CO+ 1-0, is used to determine protostellar outflows. Most of HCO+ 1-0 line emission is optically thick in star-forming regions while the H13CO+ 1-0 line is usually optically thin (Calahan et al., 2018; Liu et al, 2020). When the HCO+ 1-0 emission is optically thin, the intensity ratio of HCO+ to H13CO+ lines tends to be high due to the typically large 12CC elemental ratio, which is in interstellar medium (ISM) (Colzi et al., 2020). In such mapping observations, a gas component associated with optically thin HCO+ 1-0 emission is usually devoid of H13CO+ 1-0 detection. Compared with the H13CO+ line, the optically thick components and the contamination from nearby clumps with different velocities can be distinguished from the real high-velocity components of the HCO+ line. On the other hand, if H13CO+ 1-0 is detected as well, even though the velocity of HCO+ 1-0 emission can be far away from the main line center, such emission should be from another clump, which is the case for BGPS 3686, 5064, and 5243 with two main clumps closely located in each source.
Although high-velocity SiO emission is also useful to search for outflows (Svoboda et al., 2019), it is difficult to show spatial distributions of high-velocity gas clearly in the current observations, due to its relatively weaker emission. Thus, the SiO emission is only used to present the distribution of shocked gas. Since there are several sources with more than one clump identified by optically thin tracer H13CO+ 1-0 line, HC3N 10-9 line, with higher critical density and higher upper level energy than that of H13CO+ 1-0, is used to trace the compact regions in clumps where the potential dense cores associated with outflows may be embedded (Nishimura et al., 2017; Liu et al, 2020). The upper energy levels () are 4.2 K and 24.0 K for H13CO+ 1-0 and HC3N 10 -9 transitions, respectively. At a kinetic temperature of 10 K, the corresponding critical densities of the two transitions are cm-3 and cm-3, separately (Shirley, 2015). We describe the detailed information for individual sources.
3.1.1 BGPS 3686
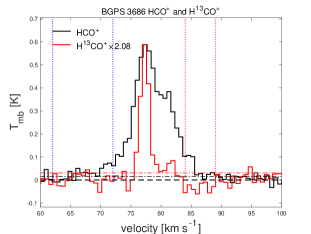
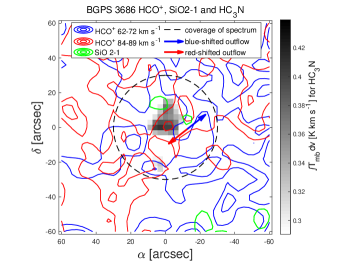
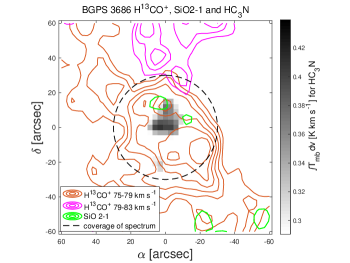
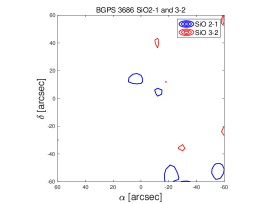
The HCO+ and H13CO+ 1-0 line profiles toward BGPS 3686 are presented in the top panel of Figure 2. The region from which the spectra are extracted is indicated by the black dashed circle in the bottom panel. Two velocity components with centers at about 77 and 82 km s-1 are shown in both the HCO+ and H13CO+ 1-0 spectra. In Figure 3, the distributions of the dense gas components with corresponding central velocities are shown by the H13CO+ 1-0 emission. The km s-1 component spreads widely from the northeast to the southwest, and the brightest part of this component is at the center of observational field. The km s-1 component is concentrated in the north.
The distribution of the HC3N 10-9 emission is also presented in Figure 3. The HC3N 10-9 emission indicates the compact part of the clump in which a protostellar core could be embedded. In BGPS 3686, the densest part of gas is distributed at the center of the observational field corresponding to the brightest part of the km s-1 H13CO+ component. According to the locations of the HC3N 10-9 and H13CO+ 1-0 emissions, the compact gas seems to be only related with the km s-1 clump. The SiO 2-1 emission shows the distribution of the shocked gas. However, the distribution of the SiO 2-1 line is relatively unclear. Since the SiO 2-1 line was detected in previous single-dish observations (Zhu et al., 2020), the SiO 2-1 emission may be widespread so that the intensity is close to the rms in the current mapping observation. Although the SiO intensity is close to the rms, a part of shocked gas indicated by the SiO 2-1 emission looks distributed near the HC3N 10-9 emission.
The HCO+ 1-0 spectrum shows both red- and blue-shift line wings. The distributions of the fluxes located at these line wings are displayed in the bottom panel of Figure 2. Both the high-velocity components in red- and blue-shift line wings are widespread. The feature of outflow cannot be found from the distribution of high-velocity HCO+ components based on our observations in BGPS 3686.
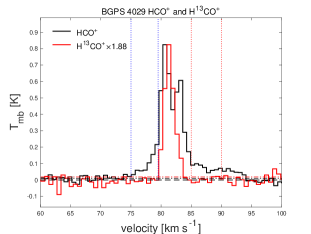
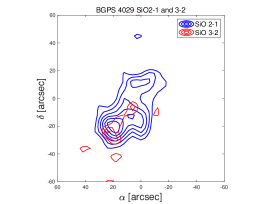
3.1.2 BGPS 4029
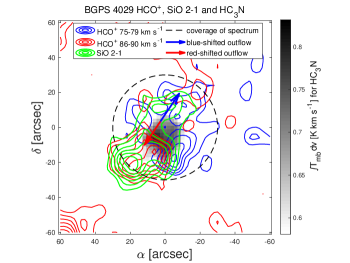
The spectra of the HCO+ and H13CO+ 1-0 lines toward BGPS 4029 are plotted in the top panel of Figure 4. A red-shifted absorption dip is shown in the HCO+ 1-0 spectrum, and this feature is also shown in Calahan et al. (2018) as a potential indicator of a global inflow in the clump. According to the comparison between the two spectra, the blue- and red-shifted components of the HCO+ 1-0 line are defined as the components in the velocity ranges of and km s-1. The distributions of the velocity-integrated intensities of the SiO 2-1 and HC3N 10-9 lines toward BGPS 4029 are displayed in the bottom panel of Figure 4. The distributions of the blue- and red-shift components of the HCO+ 1-0 line are also shown. The spreading area of the SiO 2-1 emission shows the distribution of the shocked gas which mainly spreads in the center of observational field. The blue- and red-shift components of the HCO+ 1-0 line are located at the opposite sides of the HC3N 10-9 emission. The coverages of the SiO 2-1 emission and the high-velocity HCO+ components are roughly overlapped. This suggests the relation between the shocked gas and the high-velocity components.
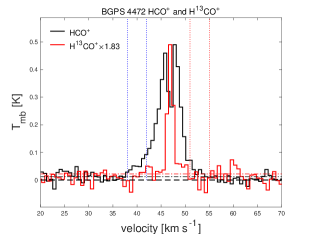
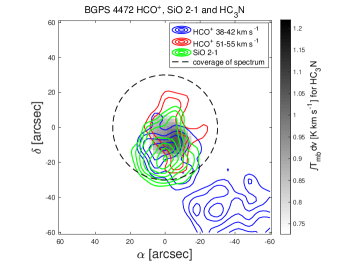
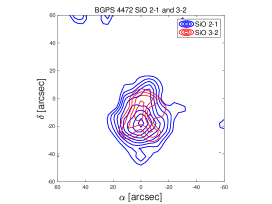
3.1.3 BGPS 4472
The comparison between the HCO+ and H13CO+ 1-0 spectra toward BGPS 4472 is displayed in the top panel of Figure 5. As is marked in the panel, the high-velocity components of the HCO+ 1-0 line are defined to be and km s-1, respectively. Unlike the HCO+ 1-0 spectrum for BGPS 4029, the signature of inflow is not found in BGPS 4472 since the self-absorption dip is not red-shifted relative to the central velocity of the H13CO+ 1-0 line. In the bottom panel of Figure 5, the distributions of the SiO 2-1 and HC3N 10-9 emissions, and the blue- and red-shift HCO+ 1-0 components are presented. The two high-velocity HCO+ components can be spatially resolved. The compact region of the clump indicated by the HC3N 10-9 line is located at the overlap region of the blue- and red-shift HCO+ components. The spreading region of the shocked gas shown by the SiO 2-1 emission is mostly overlapped with the high-velocity HCO+ components.
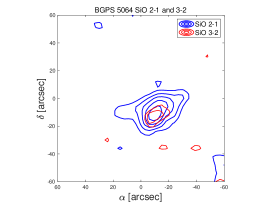
3.1.4 BGPS 5064
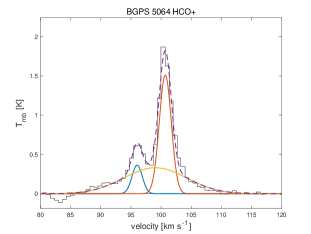
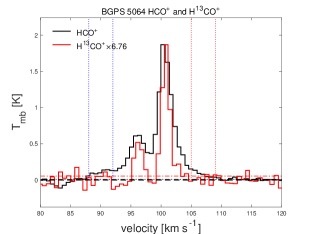
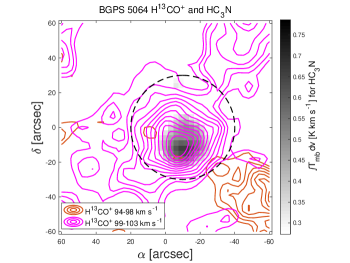
The HCO+ and H13CO+ 1-0 spectra in BGPS 5064 are plotted in the top panel of Figure 6. There are two velocity components in the H13CO+ 1-0 spectrum. The spatial distributions of these two components are shown in Figure 7. The component for the velocity range of 94-98 km s-1 is mainly distributed in the southwest, and the component for the velocity range of 99-103 km s-1 is distributed in the center region and the northwest.
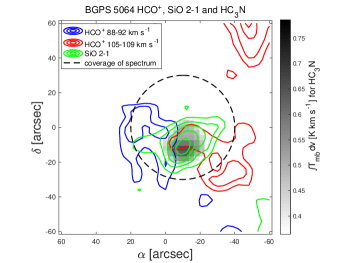
The spectrum of the HCO+ 1-0 line can be divided into three components. Two narrow components correspond to the two velocity components of the H13CO+ 1-0 line. The broad component with FWHM km s-1 seems to be related to the shocked gas. These three velocity components of the HCO+ 1-0 line are plotted in Figure 21. The HCO+ components in the velocity ranges of 88-92 and 105-109 km s-1 are used to present the distributions of the high-velocity components in the bottom panel of Figure 6. These two high-velocity components can be spatially resolved. The spreading areas of the SiO 2-1 and HC3N 10-9 emissions are also shown in the bottom panel. They are located near the connection point of the blue- and red-shifted HCO+ components. By comparing the center velocity and the spatial distribution, it suggests that the dense clump indicated by the H13CO+ 1-0 component in the velocity range of 99-103 km s-1 is associated with the shock in BGPS 5064. And the dense gas shown by the other velocity component of the H13CO+ 1-0 line is probably not related to the shock.
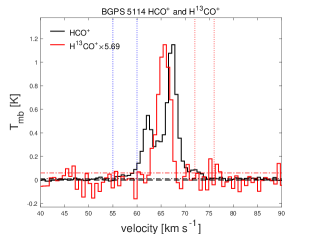
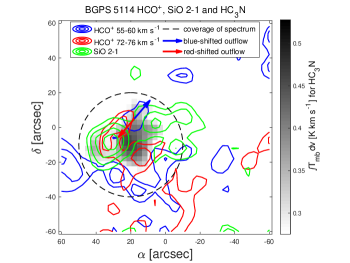
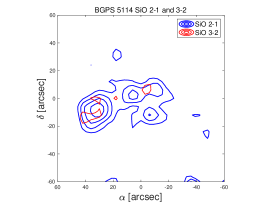
3.1.5 BGPS 5114
The HCO+ and H13CO+ 1-0 spectra toward BGPS 5114 are plotted in the top panel of Figure 8. There is an absorption dip in the HCO+ 1-0 spectrum because of the thick optical depth. The H13CO+ 1-0 spectrum is single-peaked. From the comparison between the HCO+ and H13CO+ 1-0 spectra, the HCO+ components in velocity ranges of 55-60 and 72-76 km s-1 are regarded as the indicators of the high-velocity gas. The distributions of these high-velocity components are shown in the bottom panel of Figure 8. The intensity distributions of the SiO 2-1 and HC3N 10-9 lines are also presented. However, the blue- and red-shift HCO+ components are chaotically distributed unlike those in BGPS 4029, 4472 and 5064. The HC3N 10-9 emission is concentrated near the position of (20, -10). The shocked gas shown by the SiO 2-1 line is located near the HC3N 10-9 emission. The association of the HC3N 10-9 and SiO 2-1 lines is implied by the spatial distributions of them.
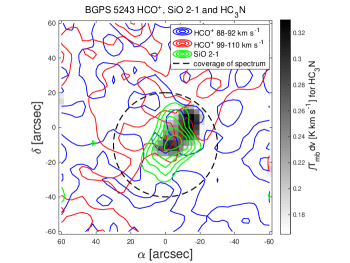
3.1.6 BGPS 5243
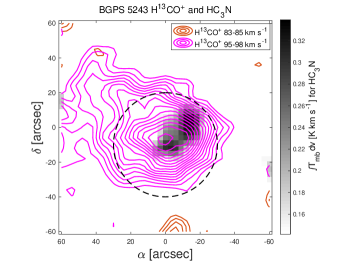
There are two H13CO+ 1-0 components with the velocity ranges of 83-85 and 95-98 km s-1, respectively. The locations of the two components are presented in Figure 9. One clump of dense gas with the velocity range of 95-98 km s-1 is mainly distributed from the center to the east side of observational field while the other dense clump is located at the center of the south side. The central velocities of the two clumps are 85 and 97 km s-1, respectively.
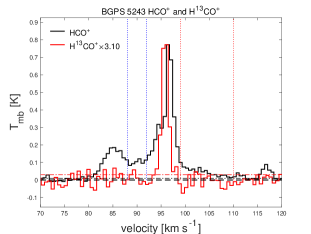
The HCO+ and H13CO+ 1-0 spectra toward BGPS 5243 are plotted in the top panel of Figure 10. The two dense clumps with different central velocities mentioned above also lead to the two velocity components in the HCO+ spectrum. The detected distribution of the HCO+ emission from the south clump is wider than that of H13CO+ emission. The two velocity components are clear in the HCO+ spectrum, but the H13CO+ spectrum only shows the emission from the 97 km s-1 clump. The HCO+ 1-0 emission in the velocity range between 85-90 km s-1 could be the overlap of line emission from the two clumps with different central velocities. Moreover, the HCO+ 1-0 intensity is also clear in the velocity range between km s-1.
The distributions of the velocity-integrated HCO+ intensities in the ranges of 88-92 and 100-110 km s-1 are presented in the bottom panel of Figure 10. Both of these two velocity components seem to be widespread. The 88-92 km s-1 component should be a mixture of the line emissions from the 85 and 97 km s-1 clumps. And the 100-110 km s-1 component is mainly distributed in the northeast of the 97 km s-1 clump. The broad spreading of the HCO+ emission in the velocity ranges implies a complex velocity field. The HC3N 10-9 emission is located near the center of observational field, while the SiO 2-1 emission spreads in the same area. The HC3N emission displays two closely-positioned intensity peaks in the bottom panel of Figure 10. Since the distance between these peaks is significantly lower than the 28′′ beam size, it is possible that they result from oversampling. It is difficult to determine if the HC3N emission indeed traces two components. Similar features in the HC3N emission exist in BGPS 3686 and 5114. However, given uncentainties in their reality, they will not be discussed further in this work.
3.2 The sources with H41 detections
As mentioned above, BGPS 3110, 3114 and 3118 are located near M17 H II region. In this section, the observational results for BGPS 3110, 3114 and 3118 are individually presented in details. In addition, the distributions of blue- and red-shifted high-velocity HCO+ components are not presented because no outflow features are found in these sources. The distributions of HC3N line are not much different from those of H13CO+ line in BGPS 3110 and 3118 while the HC3N line is very weak in BGPS 3114 (Zhu et al., 2023). So the H13CO+ line is used to trace high-density gas in the 3 sources, and the distributions of HC3N 10-9 line are not shown below.
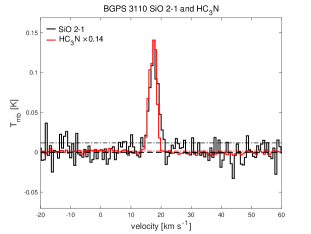
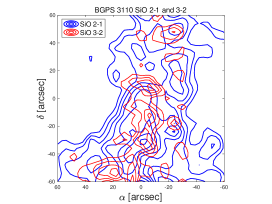
3.2.1 BGPS 3110
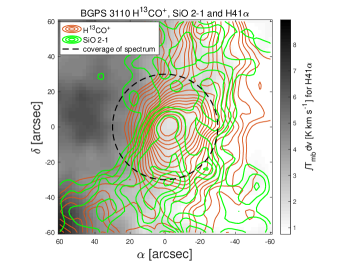
The HCO+ and H13CO+ 1-0 spectra toward BGPS 3110 are presented in the top panel of Figure 11. There is no obvious non-Gaussian and optically thin line wings shown in the HCO+ 1-0 spectrum. And we find no suitable velocity ranges for blue- and red-shifted HCO+ high-velocity components that can indicate the existence of outflows. The distributions of the H13CO+ 1-0, H41 and SiO 2-1 lines are shown in the bottom panel of Figure 11. The H41 emission indicates the spreading area of the H II region in the observational field. This line is bright in the east and much weaker in the west. The distribution of the H13CO+ 1-0 line represents the spreading area of dense gas distributed from the north to the southeast. The H13CO+ line emission is brightest in the center where corresponds to the position of SCC. In addition, the distribution of the shocked gas indicated by the SiO 2-1 line is approximately overlapped with that of high-density gas. This implies the relation between the shocked and high-density gases.
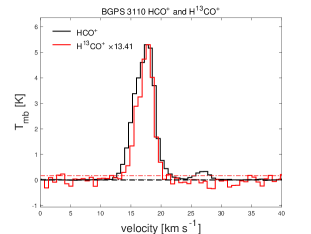
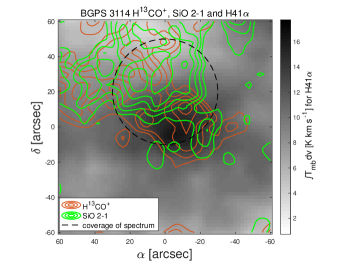
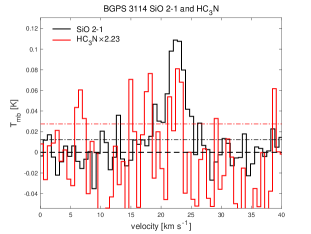
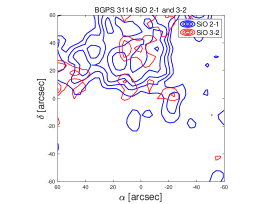
3.2.2 BGPS 3114
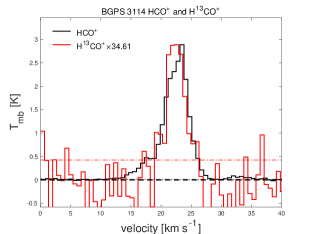
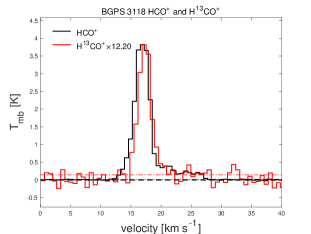
The HCO+ and H13CO+ 1-0 line profiles in BGPS 3114 are plotted in the top panel of Figure 12. There is a slight blue shifted absorption dip in the HCO+ 1-0 line profile. The H13CO+ 1-0 line intensity is mainly in the velocity range between 20 and 26 km s-1. The spatial distributions of the H13CO+ 1-0, SiO 2-1 and H41 lines are presented in the bottom panel of Figure 12. The H41 emission spreads in the whole observational field, and the brightest point is located at the center. Molecular gas can not exist in the H II region because of the processes of ionization and dissociation. According to the location and gas velocity, the dense gas indicated by the H13CO+ 1-0 line should be related with the isolated small cloud found by Wilson et al. (2003) which seems to be behind the ionized gas. The distributions of the SiO 2-1 and H13CO+ 1-0 lines are also overlapped as those in BGPS 3110. The central velocities of SiO and H13CO+ 1-0 lines are similar while they are different from the central velocity of H41 line.
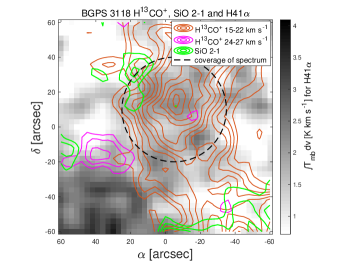
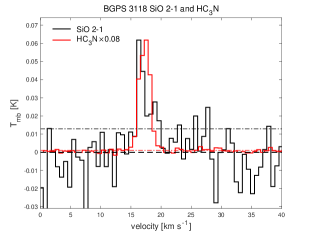
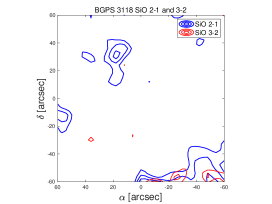
3.2.3 BGPS 3118
The HCO+ and H13CO+ 1-0 spectra are shown in the top panel of Figure 13. The profiles of these two lines are similar. The line emissions are mainly in the velocity range between 13 and 22 km s-1 with a tail in the range of 22-27 km s-1. The spatial distributions of the H13CO+ 1-0 emission in the velocity ranges of 15-22 and 24-27 km s-1 are shown in the bottom panel of Figure 13. The 15-22 km s-1 H13CO+ component is bright and spreads widely from the north side to the south side of observational field. The 24-27 km s-1 component is much weaker. It is only distributed near the position at offsets (40, -15). The distributions of the SiO 2-1 and H41 lines are also presented. The H41 emission is bright from the southeast to the northwest. The brightest point is in the southeast. In the northeast and southwest of observational field, the H41 emission also exists but is relatively weak. The SiO 2-1 emission is mainly distributed in the southwest. A small part of the SiO flux is distributed elsewhere. According to the positions of BGPS 3110 and 3118, the shocked gas indicated by the SiO 2-1 line in the southwest is likely the extension of the shocked gas in BGPS 3110.
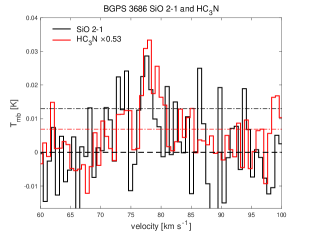
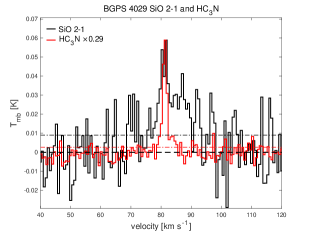
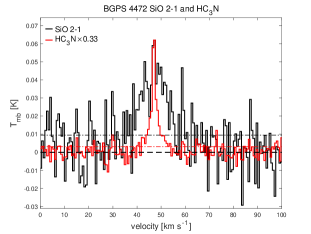
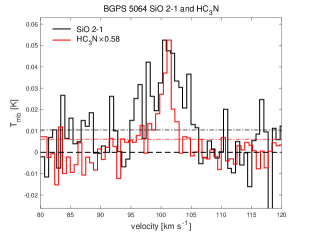
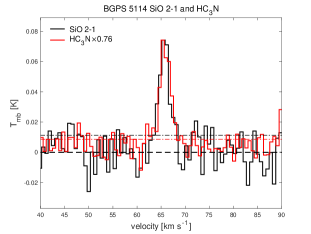
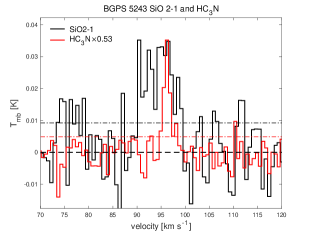
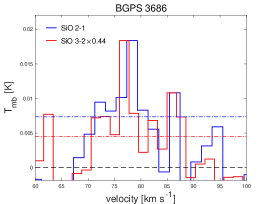
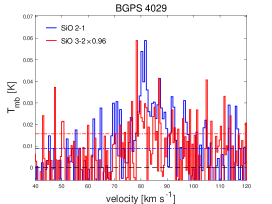
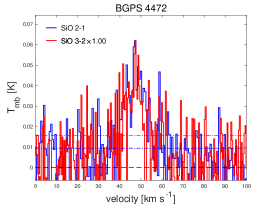
3.3 Spectra of the SiO 2-1 and HC3N 10-9 lines
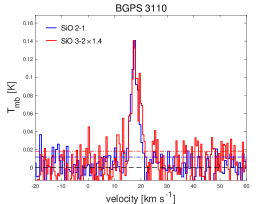
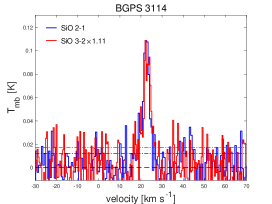
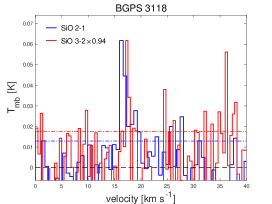
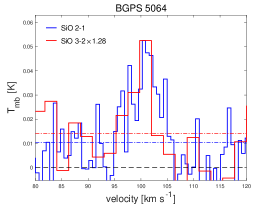
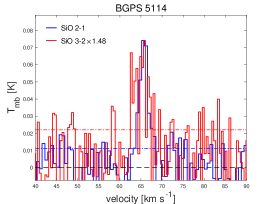
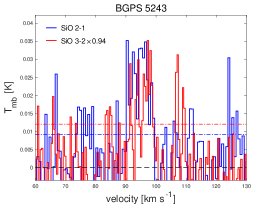
The different origins of the SiO 2-1 and HC3N 10-9 lines could lead to a distinction between the two line profiles if the shocked and dense gases have significantly different velocity distributions in the line of sight. The profiles of the SiO 2-1 and HC3N 10-9 lines toward the centers of the observational fields for the SCCs with and without H41 detections are plotted in Figure 14 and 15, respectively. The spatial coverages of the spectra are the same as those of the H13CO+ and HCO+ 1-0 spectra mentioned above.
The central velocities of the SiO 2-1 and HC3N 10-9 lines are always close to each other in each SCCs. However, the widths of these two lines are different in some sources. The SiO 2-1 line is much wider than the HC3N 10-9 line in BGPS 4029, 4472, 5064 and 5243. In the other sources, the difference between the SiO 2-1 and HC3N 10-9 line widths is not significant. Additionally, in BGPS 3110 and 3114 neighbouring M17 H II region, the SiO 2-1 line widths are slightly broader than those of HC3N 10-9 line.
4 discussions
By analyzing the distributions and the spectra of the molecular and hydrogen recombination lines, the origins of the shocks in SCCs are studied. The origins of the shocks in the sources without H41 line detections are discussed in Section 4.1. Those in the sources detected in the H41 line including BGPS 3110, 3114, and 3118 are analyzed in Section 4.2.
4.1 Shocks originated from early-stage star formation
4.1.1 The origins of the shocks in BGPS 4029, 4472, 5064
In BGPS 4029, 4472 and 5064, the HCO+ 1-0 spectra all show high-velocity components. The distributions of the blue- and red-shifted HCO+ components are distributed in the opposite sides of the location of the HC3N 10-9 emission which possible indicate the positions of protostellar cores. The shocked gas shown by the SiO emission spreads around the location of the HC3N 10-9 emission. In addition, as is presented in Figure 14, the SiO 2-1 line is clearly broader than the HC3N 10-9 line in the three sources. Especially, the SiO 2-1 and 3-2 line widths are wider than 12 km s-1 in BGPS 4029 and 4472. Such broad widths of the SiO lines are thought to be caused by powerful feedbacks from protostars (Nguyen Luong et al., 2013; Csengeri et al., 2016). These features are the indicators of protostellar outflows. So we suggest that the shocked gas in these sources are originated from protostellar activities. In addition, the bipolar outflows in BGPS 4029 found by the current work were also suggested in Svoboda et al. (2019). In those observations, the CO 2-1 line was used to found outflows, and compact points in 1.3 mm continuum maps were used to point out the positions of protostellar cores. The directions of bipolar outflow presented in Svoboda et al. (2019) are indicated in Figure 4.
4.1.2 The origins of the shocks in BGPS 3686 and 5114
The SiO 2-1 and 3-2 line widths in BGPS 3686 are broad. However, due to the low signal-to-noise ratios of the SiO lines, the reliability of the measured widths is diminished. The SiO line widths in BGPS 5114 are narrower than those in BGPS 4029, 4472, and 5064. In addition, they are not significantly broader than the HC3N line width which indicates the properties of the clump core. This implies that the shocks in BGPS 5114 are not fast shocks.
In our observations, no obvious outflow features can be found in BGPS 3686 and 5114. The central regions of the observational fields toward BGPS 3686 and 5114 were also observed in Svoboda et al. (2019). Outflow features are found in these two clumps. The directions of bipolar outflows detected in CO 2-1 emission and the dense cores found in the 1.3 mm continuum are presented in Figure 2 and 8.
In BGPS 3686, the dense core called G22695 S1 is suggested to be associated with a bipolar outflow. This core and corresponding outflows are located near the shocked gas indicated by the SiO 2-1 emission in our observations. This suggests that the shocked gas is caused by protostellar activities in BGPS 3686. The distributions of the CO 2-1 high-velocity components are presented in Figure 7 in Svoboda et al. (2019). There are multiple pairs of blue- and red-shifted gas components located close to each others in BGPS 3686. Because the current observations with beam size can not resolve the spatial distributions of these high-velocity components, the outflows can not be identified in the current observations alone.
A compact target in BGPS 5114, G30120 S1, is associated with strong CO bipolar outflows (Svoboda et al., 2019). In the bottom panel of Figure 8, it is presented that this compact source is near the shocked component shown by the SiO 2-1 emission. In addition, a pair of blue- and red-shifted high-velocity HCO+ components near G30120 S1 seem to show a bipolar outflow feature although they are not very clear because of the confusion with other high-velocity gas components. So we suggest that the shocked gas in BGPS 5114 is also caused by the protostellar outflows as that in BGPS 4029. In addition, there are some other high-velocity components shown in the CO 2-1 line in BGPS 5114 (Svoboda et al., 2019). Although they may be not related with the bipolar outflows associated with G30120 S1, the spreading areas of these high-velocity components seem to be also overlapped by the distribution region of the SiO 2-1 emission in our observation. These high-velocity components could also be related with the origin of the shocked gas. However, these detailed structures in BGPS 5114 can not be resolved in our observations because of the relatively big beam size.
It is noticed that the peaks of HC3N line emission are a little shifted with respect to the 1.3 mm continuum peaks associated with outflows in Svoboda et al. (2019) in BGPS 3686, 4029, and 5114. Two mechanisms could lead to this. First, the beam size of IRAM 30m is much larger than that of ALMA observations. Then dilution effect is important especially when there are multiple dense cores and filamentary structures in these SCCs. Second, the HC3N line traces gas with high volume density, but 1.3 mm continuum emission traces column density. This difference can cause the shift (Wilson et al., 2003).
4.1.3 The origin of the shock in BGPS 5243
The shocked gas indicated by the SiO 2-1 emission in BGPS 5243 is concentrated near the compact region of the clump shown by the HC3N 10-9 line. The central velocity and spatial distribution of the SiO 2-1 line show that the shocked gas should be related with the 97 km s-1 clump. The widths of SiO 2-1 and 3-2 lines are 7.1 and 5.4 km s-1. According to these FWHMs, it is difficult to judge whether the shock in BGPS 5243 is fast shock (Jiménez-Serra et al., 2010; Duarte-Cabral et al., 2014). Additionally, the SiO 2-1 line width is wider than that of HC3N 10-9 as those in BGPS 4029, 4472 and 5064. These features are more similar to the result of protostellar activity.
However, the red- and blue-shifted high-velocity HCO+ components shown in Figure 10 are widespread unlike the result due to protostellar outflows. Different velocity ranges of the high-velocity components are also checked. It is difficult to distinguish the high-velocity components related with the potential outflowing gas from ambient components. If protostellar outflows actually exist in BGPS 5243, we guess that the case in BGPS 5243 may be similar to that in BGPS 3686. Multiple high-velocity components are closely located so that they cannot be distinguished in the spatial resolution of the IRAM 30m telescope. It is necessary to perform observations with a higher spatial resolution to confirm this assumption.
4.2 Shocks originated from H II regions
BGPS 3110, 3114 and 3118 are all near M17 H II region. The gas kinetic temperatures calculated from the NH3 lines provided by Svoboda et al. (2016) are also given in Tables 3. As given in Table 3, the kinetic temperatures of molecular gas in BGPS 3110 and 3118 are 25.17 and 23.68 K, respectively, which are higher than those of the sources without H41 detections.
In this work, there are no evidences of outflows indicated by high-velocity components of HCO+ 1-0 emission found in these sources. The SiO 2-1 line widths in BGPS 3110 and 3118 are both narrow although they are slightly wider than the widths of HC3N line. In BGPS 3114, the SiO 2-1 line width is not broad while the HC3N 10-9 emission is very weak. The shocked gas and high-density gas spread over an elongated zone from the north side to the southeast side of observational field in BGPS 3110. This is not like the distributions of shocked and high-density components in those SCCs with outflow detections.
In the further observations performed in December 2020 to January 2021, the whole M17 H II region is observed to study its effect on the nearby star formation environments. The more forceful evidences of the origin of the shock in BGPS 3110, 3114, and 3118 are obtained (Zhu et al., 2023). The collision between ionized gas in M17 H II region and the surrounding molecular gas leads to the shocked gas distributed in the boundary region of the H II region including BGPS 3110, 3114, and 3118. So we suggest that the shocked gas in BGPS 3110, 3114, and 3118 is originated from the expansion of M17 H II region. Moreover, in Zhu et al. (2023), it is found that the 1.1 mm continuum emission in BGPS 3114 is mainly contributed from free-free continuum emission from ionized gas. Since BGPS 3114 was identified as a massive clump because the 1.1 mm continuum was attributed to dust emission (Ginsburg et al., 2013; Svoboda et al., 2016), the identification of this source is likely erroneous.
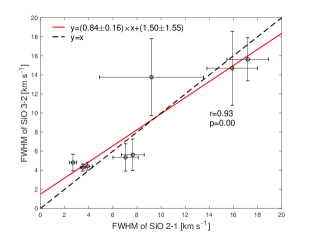
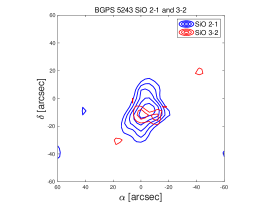
4.3 Comparison between properties of SiO 2-1 and 3-2 lines
The distributions of SiO 2-1 and 3-2 lines for the sources with and without H41 detections are shown in Figure 17 and 19, respectively. Because the rms noise level of SiO 3-2 line is much higher than that of SiO 2-1 line, the distributions area of SiO 3-2 line are significantly smaller than those of SiO 2-1 line in every source. The SiO 2-1 and 3-2 spectra corresponding to the results in Table 3 are plotted in Figure 18 and 20 for the sources with and without H41 detections. Because of its higher rms noise level, the signal-to-noise ratio of SiO 3-2 line intensity is lower than that of SiO 2-1 line intensity in most of the sources.
In Table 3, the differences between central velocities of SiO 2-1 and SiO 3-2 lines for different sources are all less than 2 km s-1. In most sources, differences in widths of the two lines are also not significant. The comparison between the SiO 2-1 and 3-2 line widths toward SCCs are plotted in Figure 16. The Spearman test is conducted to estimate the correlation between the widths of the two lines. The Spearman’s rank correlation coefficient of 0.93 with a corresponding p-value of 0.22 per cent indicates a strong correlation. These results suggest that the two SiO lines have same origins in these sources.
5 Summary
In this paper, we perform mapping observations of the SiO 2-1, 3-2, HCO+ 1-0, H13CO+ 1-0, HC3N 10-9, and H41 lines toward 9 SCCs, which were found to be associated with shocks in our previous single-dish observations (Zhu et al., 2020). The properties of the observed lines are shown. The spatial distributions of different gas components traced by these lines are investigated.
The origins of the shocks in these SCCs are studied. The H41 line is found in BGPS 3110, 3114 and 3118. The shocked gas in these 3 SCCs is likely caused by the expansion of M17 H II region. This result suggests that the existence of classical H II region should not be neglected in searching for early-stage star-forming targets. The shocks in BGPS 4029, 4472 and 5064 are probably originated from protostellar activities since the features of bipolar outflows are indicated by the HCO+ line. The shocks in BGPS 3686 and 5114 are suggested to be also caused by protostellar activities after comparing the results in our observations with those in previous ALMA observations toward the two sources (Svoboda et al., 2019). However, the origin of the shock in BGPS 5243 is still unclear. We acknowledge that further studies with larger samples are needed to obtain statistical results, but our results imply that a large part of shocks in SCCs are originated from protostellar outflows. Therefore, outflow and accretion processes could have occurred in a significant portion of SCCs identified in previous works since shocks are common in these SCCs (Zhu et al., 2020). In addition, the shocked gas is widespread in BGPS 3110, 3114 and 3118. These SCCs are close to M17 H II region. On the contrary, the distribution of shocked gas is concentrated in the other SCCs.
Acknowledgements
This work is based on the observations performed using IRAM 30m telescope. F.-Y. Z. thanks Dr. Jiang Xuejian for providing the knowledge about chemical abundances. It is supported by the National Science Foundation of China No. 12003055, and Key Research Project of Zhejiang Lab (No. 2021PE0AC03). Y. T. Y. is a member of the International Max Planck Research School (IMPRS) for Astronomy and Astrophysics at Universities of Bonn and Cologne. Y. T. Y. would like to thank China Scholarship Council (CSC) and the Max-Planck-Institut für Radioastronomie (MPIfR) for the financial support.
DATA AVAILABILITY STATEMENT
The data underlying this paper will be shared on reasonable request to the corresponding author.
References
- Arthur & Hoare (2006) Arthur. S. J. & Hoare, M. G. 2006, ApJS, 165, 283
- Bally et al. (1998) Bally, J., Sutherland, R. S., Devine, D., & Johnstone, D. 1998, AJ, 116, 293
- Beuther & Sridharan (2007) Beuther, H. & Sridharan, T. K., 2007, ApJ, 668, 348
- Beuther et al. (2016) Beuther, H., Bihr, S., Rugel, M., Johnston, K., Wang, Y., et al. 2016, A&A, 595, A32
- Bonnell et al. (1997) Bonnell, I., Bate, M., Clarke, C., & Pringle, J. 1997, MNRAS, 285, 201
- Bonnell et al. (2001) Bonnell, I., Clarke, C., Bate, M., & Pringle, J. 2001, MNRAS, 324, 573
- Calahan et al. (2018) Calahan, J. K., Shirley, Y. L., & Svoboda, B. E., et al. 2018, ApJ, 862, 63
- Csengeri et al. (2016) Csengeri, T., Leurini, S., Urquhart, J. S., et al. 2016, A&A, 586, A149
- Colzi et al. (2020) Colzi, L., Sipila, O., Roueff, E., Caselli, P., & Fontani, F. 2020, A&A, 640, A51
- Cosentino et al. (2018) Cosentino, G., Jiménez-Serra, I., Henshaw, J. D., et al. 2018, MNRAS, 474, 3760
- Deharveng et al. (2010) Deharveng, L., Schuller, F., Anderson, L. D., Zavagno, A., Wyrowski, F., et al. 2010, A&A, 523, A6
- Duarte-Cabral et al. (2014) Duarte-Cabral, A., Bonetmps, S., Motte, F., et al. 2014, A&A, 570,A1
- Ellsworth-Bowers et al. (2015) Ellsworth-Bowers, T. P., Rosolowsky, E., Glenn, J., Ginsburg, A., & Evnas II, N. J. 2015, ApJ, 799, 29
- Elmegreen & Lada (1977) Elmegreen, B. G., & Lada, C. J. 1977, ApJ, 214, 725
- Fukui et al. (2014) Fukui, Y., Ohama, A., Hanaoka, N., et al. 2014, ApJ, 780, 36
- Feng et al. (2016) Feng, S., Beuther, H., Zhang, Q., Liu, H. B., Zhang. Z., et al. 2016, ApJ, 828, 100
- García-Arredondo et al. (2001) García-Arredondo, F., Henney, W. J., & Arthur, S. J. 2001, ApJ, 561, 830
- Ginsburg et al. (2013) Ginsburg, A., Glenn, J., Erik, R., et al. 2013, ApJS, 208, 14
- Gordon & Sorochenko (2002) Gordon, M. A., & Sorochenko, R. L. 2002, Radio Recombination lines (Berlin: Springer)
- Guilloteau & Lucas (1988) Guilloteau, S., & Lucas, R. 1988, CLASS: Continuum and Line Analysis Single-dish Software (Grenoble:IRAM)
- Guo et al. (2016) Guo, W.-H., Esimbek, J., Tang, X.-D., et al. 2016, Astrophys Space Sci, 361, 264
- Gusdorf et al. (2008) Gusdorf, A., Pineau Des Forêts, G., Cabrit, S, & Flower, D. R. 2008, A&A, 490, 695
- Hildebrand (1983) Hildebrand, R. H. 1983, QJRAS, 24, 267
- Hoffmeister et al. (2008) Hoffmeister, V. H., Chini, R., Scheyda, C. M., Schulze, D., Watermann, R., et al. 2008, ApJ, 686, 310
- Hosokawa & Inutsuka (2006) Hosokawa, T., & Inutsuka, S.-I. 2006, ApJ, 646, 240
- Inoue & Fukui (2013) Inoue, T. & Fukui, Y. 2013, ApJ, 774, 31
- Jiang et al. (2011) Jiang, X., Wang, J., & Gu, Q. 2011, MNRAS, 418, 1753
- Jiménez-Serra et al. (2010) Jiménez-Serra, I., Caselli, P., Tan, J. C., Hernandez, A. K., Fontani, F., Butler, M. J., & van Loo, S. 2010, MNRAS, 406, 187
- Kauffmann et al. (2008) Kauffmann, J., Bertoldi, F., Bourke, T. L., Evans, N. J., II & Lee, C. W. 2008, A&A, 487, 993
- Kim et al. (2011) Kim, K.-T., Byun, D.-Y., Je, D.-H., et al. 2011, JKAS, 44, 81
- Kirsanova et al. (2021) Kirsanova, M. S., Salii, S. V., Kalenskii, S. V., Wiebe, D. S., Sobolev, A. M., & Boley, P. A. 2021, MNRAS, 503, 633
- Leurini et al. (2014) Leurini, S., Codella, C., López-Sepulcre, A., et al. 2014, A&A, 570, A49
- Li et al. (2019) Li, S.-H., Wang, J.-Z., Fang, M., et al. 2019, ApJ, 878, 29
- Liu et al (2020) Liu, T., Evans, N. J., Kim, K.-T., Goldsmith, P. F., Liu, S.-Y., Zhang, Q., et al. 2020, MNRAS, 496, 2790
- López-Sepulcre et al. (2013) López-Sepulcre, A., Taquet, V., Sanchez-Monge, Á., Ceccarelli, C., Dominik, C., et al. 2013, A&A, 556, A62
- Louvet et al. (2016) Louvet, F., Motte, F., Gusdorf, A., Nguyen Luöng, Q., Lesaffre, P., et al. 2016, A&A, 595, A122
- Lumsden et al. (2013) Lumsden, S. L., Hoare, M. G., Urquhart, J. S., Oudmaijer, R. D., Davies, B., et al. 2013, ApJS, 208, 11
- Mangum & Shirley (2015) Mangum, J. G., & Shirley, Y. L. 2015, PASP, 127, 266
- Marshall & Kerton (2019) Marshall, B., & Kerton, C. R. 2019, MNRAS, 489, 4809
- Martín-Pintado et al. (1992) Martín-Pintado, J., Bachiler, R., & Fuente, A. 1992, A&A, 254, 315
- Matzner (2017) Matzner, C. D. 2017, arXiv:1712.01457
- McKee & Tan (2003) McKee, C. F., & Tan, J. C. 2003, ApJ, 585, 850
- Michiyama et al. (2018) Michiyama, T., Iono, D., Sliwa, K., Bolatto, A., Nakanishi, K., et al. 2018, ApJ, 868, 95
- Motte et al. (2018) Motte, F., Bontemps, S., & Louvet, F. 2018, ARA&A, 56, 41
- Nayana et al. (2020) Nayana, A. J., Naslim, N., Onishi, T., Kemper, F., Tokuda, K., et al. 2020, ApJ, 902, 140
- Nishimura et al. (2018) Nishimura, A., Minamidani, T., Umemoto, T., et al. 2018, PASJ, 70, S42
- Nishimura et al. (2017) Nishimura, Y., Watanabe, Y., Harada, N., Shimonishi, T., Sakai, N., et al. 2017, ApJ, 848, 17
- Nishimura et al. (2019) Nishimura, Y., Watanabe, Y., Harada, N., Kohno, K., & Yamamoto, S. 2019, ApJ, 879, 65
- Nisini et al. (2007) Nisini, B., Codella, C., Giannini, T., et al. 2007, A&A, 462, 163
- Nguyen Luong et al. (2011) Nguyen Luong, Q., Motte, F., Schuller, F., et al. 2011, A&A, 529, A41
- Nguyen Luong et al. (2013) Nguyen Luong, Q., Motte, F., Carlhoff, P., et al. 2013, ApJ, 775, 88
- Sanhueza et al. (2013) Sanhueza, P., Jackson, J. M., Foster, J. B., ete al. 2013, ApJ, 773, 123
- Schuller et al. (2008) Schuller, F., Menten, K. M., Contreras, Y., et al. 2008, A&A, 504, 415
- Shirley (2015) Shirley, Y. L. 2015, PASP, 127, 299
- Svoboda et al. (2016) Svoboda, B. E., Shirley, Y. L., Battersby, C., et al. 2016, ApJ, 822, 59
- Svoboda et al. (2019) Svoboda, B. E., Shirley, Y. L., Traficate, A., Battersby, C., Fuller, G. A., et al. 2019, ApJ, 886, 36
- Tafoya et al. (2021) Tafoya, D., Sanhueza, P., Zhang, Q., Li, S., Guzmán, A. E., et al. 2021, ApJ, 913, 131
- Tan et al. (2016) Tan, J. C., Kong, S., Zhang, Y., Fontani, F., Caselli, P., et al. 2016, ApJ, 821, L3
- Tang et al. (2017) Tang, X. D., Henkel, C., Chen, C.-H. R., et al. 2017, A&A, 600, A16
- Traficante et al. (2015) Traficante, A., Fuller, G. A., Peretto, N., Pineda, J. E., & Molinari, S. 2015, MNRAS, 451, 3089
- Urquhart et al. (2018) Urquhart, J. S., König, C., Giannetti, A., et al. 2018, MNRAS, 473, 1059
- van der Tak et al. (2000) van der Tak, F. F. S., van Dishoeck, E. F., Evans, N. J., II, & Blake, G. A. 2000, ApJ, 537, 283
- van der Tak et al. (2007) van der Tak, F. F. S., Black, J. H., Schöier, F. L., Jansen, D. J., & van Dishoeck, E. F. 2007, A&A, 468, 627
- Vichietti et al. (2016) Vichietti, R. M., Spada, R. F. K., da Silva, A. B. F., Machado, F. B. C., & Haiduke, R. L. 2016, ApJS, 225, 2
- Wilson et al. (2003) Wilson, T. L., Hanson, M. M., & Muders, D. 2003, ApJ, 590, 895
- Wood & Churchwell (1989) Wood, D. O. S., & Churchwell, E. 1989, ApJS, 69, 831
- Zavagno et al. (2006) Zavagno, A., Deharveng, L., Comerón, F., Brand, J., Massi, F., et al. 2006, A&A, 446, 171
- Zavagno et al. (2010) Zavagno, A., Russeil, D., Motte, F., Anderson, L. D., Deharveng, L., et al. 2010, A&A, 518, L81
- Zhang et al. (2020) Zhang, S., Zavagno, A., Yuan, J., et al. 2020, A&A, 637, A40
- Zhu & Zhu (2015) Zhu, F.-Y., & Zhu, Q.-F. 2015, RAA, 15, 828
- Zhu et al. (2015) Zhu, F.-Y., Zhu, Q.-F., Li, J., Zhang, J.-S., & Wang, J.-Z. 2015, ApJ, 812, 87
- Zhu et al. (2020) Zhu, F.-Y., Wang, J.-Z., Liu, T., Kim, K.-T., Zhu, Q.-F., & Li, F. 2020, MNRAS, 499, 6018
- Zhu et al. (2023) Zhu, F.-Y., Wang, J. Z., Yan, Y. T., Zhu, Q.-F., & Li, J. 2023, MNRAS, 522, 503
Appendix A The spectra and distributions of SiO 2-1 and 3-2 lines
The distributions and spectra of SiO 2-1 and 3-2 lines for the sources with and without H41 detections are shown in Figure 17, 18, 19 and 20. The spectra of SiO 2-1 and 3-2 lines correspond to the results given in Table 3.
Appendix B Comparison with the KVN 21-m observations
In Table 4, the observational results of the SiO 2-1 and 3-2 lines in the current observations are compared with those in previous KVN 21-m observations (Zhu et al., 2020). The results of the current observations are convolved with the spatial resolution of the KVN 21-m observations. The differences between the central velocities of the SiO lines observed by the two telescopes are typically smaller than 2 km s-1. In the comparison of the FWHMs of SiO 2-1 and 3-2 lines, the corresponding differences are and , respectively. And for the velocity-integrated intensities of the SiO 2-1 and 3-2 lines, the differences are and , respectively. Comparing the accuracies of the velocity-integrated intensities and FWHMs in the two sets of observations, no significant difference between the two observations is found. Therefore, it suggests that the results of the previous KVN 21-m observations toward the sample of 100 SCCs are reliable.
| SiO 2-1 | SiO 2-1(KVN) | |||||
| Source | Vlsr | FWHM | Vlsr | FWHM | ||
| [km s-1] | [km s-1] | [K km s-1] | [km s-1] | [km s-1] | [K km s-1] | |
| BGPS 3110 | ||||||
| BGPS 3114 | ||||||
| BGPS 3118 | ||||||
| BGPS 3686 | ||||||
| BGPS 4029 | ||||||
| BGPS 4472 | ||||||
| BGPS 5064 | ||||||
| BGPS 5114 | ||||||
| BGPS 5243 | ||||||
| SiO 3-2 | SiO 3-2(KVN) | |||||
| Source | Vlsr | FWHM | Vlsr | FWHM | ||
| [km s-1] | [km s-1] | [K km s-1] | [km s-1] | [km s-1] | [K km s-1] | |
| BGPS 3110 | 18.010.20 | |||||
| BGPS 3114 | ||||||
| BGPS 3118 | ||||||
| BGPS 3686 | ||||||
| BGPS 4029 | … | … | … | |||
| BGPS 4472 | ||||||
| BGPS 5064 | ||||||
| BGPS 5114 | ||||||
| BGPS 5243 | ||||||
-
•
Notes. The properties are estimated from line profiles fitted by a single Gaussian distribution. This method is different from that in Zhu et al. (2020).
Appendix C Three components in the HCO+ spectrum toward BGPS 5064
The HCO+ line profile toward BGPS 5064 can be divided into three velocity components. The broad velocity component shown in Figure 21 should result from protostellar outflows. Then the velocity ranges of the blue- and red-shifted high-velocity components can be appropriately chosen.