The disruption index is biased by citation inflation
11footnotetext: Send correspondence to: apetersen3@ucmerced.eduA recent analysis of scientific publication and patent citation networks by Park et al. (Nature, 2023) suggests that publications and patents are becoming less disruptive over time.
Here we show that the reported decrease in disruptiveness is an artifact of systematic shifts in the structure of citation networks unrelated to innovation system capacity.
Instead, the decline is attributable to ‘citation inflation’, an unavoidable characteristic of real citation networks that manifests as a systematic time-dependent bias and renders cross-temporal analysis challenging.
One driver of citation inflation is the ever-increasing lengths of reference lists over time, which in turn increases the density of links in citation networks, and causes the disruption index to converge to 0.
A second driver is attributable to shifts in the construction of reference lists, which is increasingly impacted by self-citations that increase in the rate of triadic closure in citation networks, and thus confounds efforts to measure disruption, which is itself a measure of triadic closure. Combined, these two systematic shifts render the disruption index temporally biased, and unsuitable for cross-temporal analysis. The impact of this systematic bias further stymies efforts to correlate disruption to other measures that are also time-dependent, such as team size and citation counts.
In order to demonstrate this fundamental measurement problem, we present three complementary lines of critique (deductive, empirical and computational modeling), and also make available an ensemble of synthetic citation networks that can be used to test alternative citation-based indices for systematic bias.
A measure of disruption was recently developed and applied to empirical citation networks funk2017dynamic ; wu2019large ; park2023papers . This bibliometric measure, denoted by , quantifies the degree to which an intellectual contribution (e.g. an research publication or invention patent) supersedes the sources cited in its reference list, denoted by the set . As defined, is measured according to the local structure of the subgraph comprised of the focal node , nodes belonging to its reference list , and the set of nodes citing either or any member of , denoted by . If future intellectual contributions cite but do not cite members of , then it is argued that plays a disruptive role in the citation network. However, the critical issue we highlight is the following: as the length of the reference list increases, so does the likelihood that one of those papers is highly cited. Hence, is a biased measure because reference lists have increased dramatically over time, and so too have the number of citations that highly-cited papers accrue pan2016memory – both phenomena being bi-products of citation inflation petersen_citationinflation_2018 .
Citation inflation (CI) refers to the systematic increase in the number of links introduced to the scientific (or patent) citation network each year. CI is analog to monetary inflation orphanides1990money ; orphanides2003quest , whereby as a government prints more money the sticker price of items tends to go up, rendering the impression that the real cost of goods are increasing (to what degree this relationship is valid depends on wage growth and a number of other economic factors). By analogy, it might also be tempting to attribute the increased volume of scientific production to techno-social productivity increases, yet this explanation neglects the persistent growth rate of the inputs (e.g. researchers and research investment) that are fundamental to the downstream production of outputs (e.g. research articles, patents.
Indeed, secular growth underlies various quantities relevant to the study of the scientific endeavor, from national expenditures in R&D to the population size of researchers petersen_citationinflation_2018 and the characteristic number of authors per research publication Wuchty:2007 ; petersen_quantitative_2014 ; pavlidis_together_2014 – all quantities that have persistently grown over the last century. Nevertheless, the degree to which such growth affects the quantitative evaluation of research outcomes is under-appreciated, and can manifest in inconsistent measurement frameworks and metrics. Indeed, the number of citations an article receives is not solely attributable to novelty or prominence of the research, but also depends on the the population size and citing norms of a discipline, and quite fundamentally, the nominal production rate of links in the citation network, among other considerations bornmann2008citation . Hence, there is real need to distinguish nominal counts versus real values in scientific evaluation, which in the analysis of citation networks requires accounting for when each citation was produced, and in further extensions, how the credit is shared petersen2010methods ; pavlidis_together_2014 ; petersen_citationinflation_2018 ; shen2014collective .
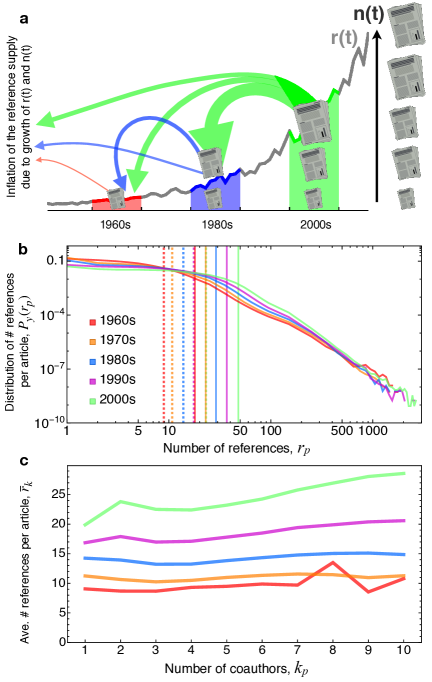
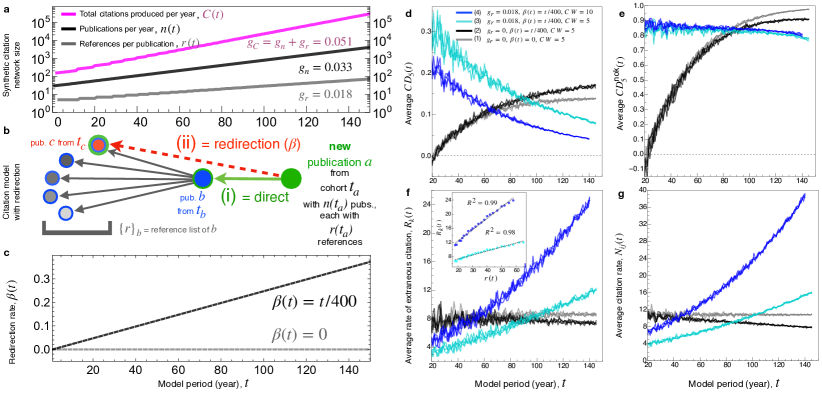
So what are the main sources of CI in scientific citation networks and what are the real-world magnitudes of their effects? Figure 1(a) illustrates how CI arises through the combination of longer reference lists, denoted by , compounded by an increasing production volume, . By way of real-world example, prior calculation of the growth rate of total number of citations produced per year based upon the entire Clarivate Analytics Web of Science citation network estimated that the total volume of citations generated by the scientific literature grows exponentially with annual rate pan2016memory . Hence, with the number of links in the citation network growing by roughly 5% annually, the total number of links in the citation doubles every years!
While the dominant contributor to CI is the growth of deriving from increased researchers and investment in science coupled with technological advances increasing the rate of manuscript production, the shift away from print towards online-only journals, and the advent of multidisciplinary megajournals petersen2018mismanagement , the contribution to CI from growing reference lists alone is nevertheless substantial and varies by discipline sanchez2018reference ; abt2002relationship ; dai2021literary ; nicolaisen2021number . By way of example, consider descriptive statistics based upon analysis of millions of research publications comprising the Microsoft Academic Graph (MAG) citation network sinha2015overview : in the 1960s, the average ( standard deviation) number of references per articles was (17); by the 2000s, increased to 23 (), a 2.6-fold increase over the 50-year period – see Fig. 1(b). Meanwhile, as research team sizes – denoted by , and used as a proxy for the production effort associated with a research output – increase in order to address research problems featuring greater topical and methodological breadth, there emerges a non-linear relationship between and showing that the modern research article is fundamentally different from those produced even a decade ago – see Fig. 1(c). Thus, not only does the nominal value of a citation vary widely by era, but the implications of secular growth on the topology of the citation network and thus citation-based research evaluation are profound pan2016memory . A standard solution to taming variables that are susceptible to inflation is to use a deflator index, which amounts to normalizing the cross-temporal variation by way of standardized reference point petersen2010methods ; petersen_citationinflation_2018 . Another more nefarious problem is the accurate measurement of the quantitative relationship between variables that are independently growing over time, which is susceptible to omitted variable bias if the role of time is neglected.
In what follows, we demonstrate the implications of CI that render unsuitable for cross-temporal analysis, and call into question the empirical analysis and interpretations of trends in scientific and technological advancement based upon wu2019large ; park2023papers . To establish how the disruption index suffers from citation inflation and is confounded by shifts in scholarly citation practice, we employ three different approaches: deductive analysis based upon the definition of , empirical analysis of the Microsoft Academic Graph (MAG) citation network, and computational modeling of synthetic citation networks. In the latter approach, we are able to fully control the sources of the systematic bias underlying (namely CI), thereby demonstrating that follows a stable frequency distribution in the absence of CI. We conclude with research evaluation policy implications.
1 Quantitative definition of and a deductive critique
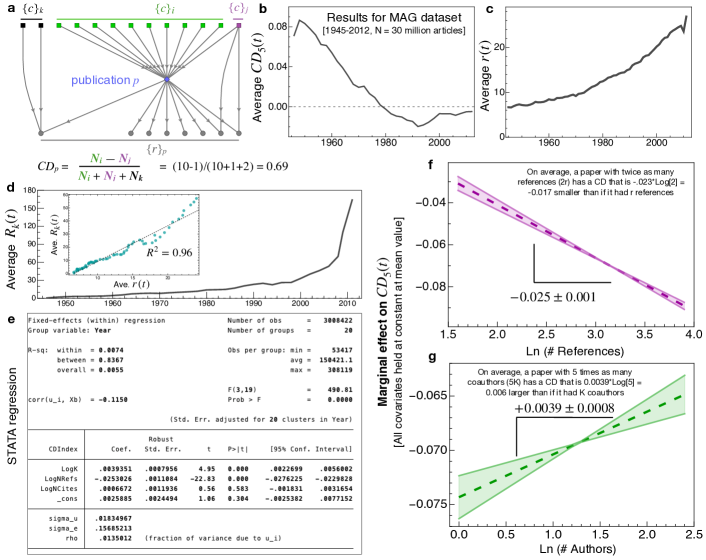
The disruption index is a higher-order network metric that incorporates information extending beyond the first-order links connecting to – those nodes that cite and are prospective (forward looking or diachronous), and those nodes that are referenced by , and thus retrospective (backward looking or synchronous) Nakamoto_synchronous_1988 ; Glanzel_forwardbackward_2004 . The original definition of was formulated as a conditional sum across the adjacency matrix funk2017dynamic , and was subsequently reformulated as a ratio wu2019large . According to the latter conceptualization, calculating involves first identifying three non-overlapping subsets of citing nodes, , of sizes , and , respectively – see Fig. 2(a) for a schematic illustration.
The subset refers to members of that cite the focal but do not cite any elements of , and thus measures the degree to which disrupts the flow of attribution to foundational members of . The subset refers to members of that cite both and , measuring the degree of consolidation that manifests as triadic closure in the subnetwork (i.e., network triangles formed between , , ). The subset refers to members of that cite but do not cite . As such, the index is given by the ratio,
| (1) |
which can be rearranged as follows,
| (2) |
The ratio is an extensive quantity that measures the rate of extraneous citation, whereas is an intensive quantity. The polarization measure is an alternative definition of disruption that simply neglects in the denominator bornmann2020disruption ; for this reason, characteristic values of are larger and decay more slowly over time then respective values – see ref. park2023papers . Following initial criticism regarding the definition of wu2019confusing ; bornmann2020disruption , other variations on the theme of have since been analyzed wu2019large and critiqued according to their advantages and disadvantages leydesdorff2021proposal .
To summarize, we argue that a simple deductive explanation trumps the alternative socio-technical explanations offered park2023papers ; kozlov2023disruptive for the decline in calculated for publications and patents. Namely, the disruption index systematically declines, along with similar variants bornmann2020disruption ; leydesdorff2021proposal ; wu2019large , for the simple reason that features a numerator that is bounded and a denominator that is unbounded. More technically, the term is susceptible to CI, which is entirely sufficient to explain why converges to 0 over time.
2 Empirical critique
In this section we show empirically that declines over time due to the runaway growth of , and implicitly, . While our results are based upon a single representation of the scientific citation network made openly available by the MAG project sinha2015overview , the implications are generalizable to citation networks featuring CI characterized by a non-stationary number of new links introduced by each new cohort of new citing items. To be specific, the citation network we analyzed is formed from the roughly million research articles in the MAG dataset that have a digital object identifier (DOI), were published between 1945-2012, and belonging to a mixture of research areas.
Figure 2(a) shows a schematic of the sub-graph used to calculate the value for each publication. To be consistent with wu2019large ; park2023papers , we calculate using a -year citation window (CW), meaning that only articles published within 5 years of are included in the subgraph . As such, Fig. 2(b) shows a decline in the average that is consistent with the overall trend shown in Fig. 2 in ref. park2023papers , where the data are disaggregated by discipline; also note that Fig. 2 and ED Figs. 6 and 9 in park2023papers show that disciplines with higher publication volumes and thus more references produced (life sciences and biomedicine, and physical sciences) tend to have smaller values in any given year relative to the social sciences (e.g. JSTOR), which is qualitatively consistent with our critique.
We also note that while the implementation of a CW may control for right-censoring bias, it does not control CI in any precise way. By way of example, consider the impact of the CW on , the number of extraneous articles that do not cite but do cite elements of . A CW will reduce the number of papers contributing to via , but it will also reduce in similar proportions, leaving the ratio unchanged, on average. Consider a more quantitative explanation that starts by positing that increases proportional to , as the nodes belonging to are unconstrained by the first-order citation network . Following the same logic, grows proportional to . In both cases, even if the proportionality constant depends weakly on , the ratio will grow proportional to .
There is likely to be considerable variance in the publication-level relationship between and , because if any member of is highly cited, then is skewed towards the heavy right tail of the citation distribution. Moreover, the base number of citations associated with extreme values in the citation distribution have increased dramatically over the last half century as a result of CI, such that the number of citations corresponding to the 99th percentile of the citation distribution increased at an annual rate of roughly 2% from roughly 55 citations in 1965 to roughly 125 citations in 2005 – see Fig. 4 in ref. pan2016memory . For this reason, the term introduces susceptibility to CI according to two channels.
Here we focus on the channel associated with the growth of , which grew at roughly the same rate as , growing from roughly 9 to 23 references per paper over the same period – see Fig. 2(c). Consequently, for nearly the entire period of analysis and that the growth of is largely explained by the growth of in the empirical data – see Fig. 2(d). For this reason, it is more accurate to describe as converging to 0 as opposed to decreasing over time.
In order to confirm these aggregate-level relationships at the publication level, we applied a linear regression model whereby the unit of analysis is an individual publication. The linear model specification is given by
| (3) |
which controls for secular growth by way of yearly fixed-effects, denoted by . The results of the ordinary least squares (OLS) estimation using the STATA 13.0 package xtreg are shown in Fig. 2(e), and are based upon 3 million publications with coauthors, references, and citations that were published in the two-decade period 1990-2009. The independent variables are modeled using a logarithmic transform because they are each right-skewed: “LogK” corresponds to ; “LogNRefs” corresponds to ; and LogNCites corresponds to , the number of citations received by in the 5-year window. This sample of MAG articles were used so that results are more closely comparable to Wu et al. who focus on articles with wu2019large .
Results indicate a negative relationship between and the number of references, consistent with our deductive argument. Figure 2(f) shows the marginal relationship with , holding all covariates at their mean values, and indicates a net shift in of roughly -0.06 units as increases by a factor of 10 from 5 to 50 total references. Similarly, Fig. 2(g) shows the marginal relationship with , indicating a net shift in of roughly +0.01 units as increases by a factor of 10 from 1 to 10 coauthors, which is in stark contrast to the relationship with opposite sign reported in ref. wu2019large .
3 Computational critique
3.1 Generative network model featuring citation inflation and redirection
We employ computational modeling to explicitly control several fundamental sources of variation, and to also explore complementary mechanisms contributing to shifts in over time – namely, shifts in scholarly citation practice. Our identification strategy is to growth synthetic citation networks that are identical in growth trajectory and size, but differ just in the specification of (i) and/or (ii) the rate of triadic closure denoted by that controls the consolidation-disruption difference defining the numerator of .
We model the growth of a citation network using a model originally developed in ref. pan2016memory that applies Monte Carlo (MC) simulation to operationalize stochastic link dynamics by way of a random number generator. This model belongs to the class of growth and redirection models krapivsky_network_2005 ; barabasi2016network , and reproduces a number of statistical regularities established for real citation networks – both structural (e.g. a log-normal citation distribution UnivCite ) and dynamical (e.g., increasing reference age with time pan2016memory ; exponential citation life-cycle decay petersen_reputation_2014 ). – see the Appendix Section A1 and Fig. A1 for more information regarding the empirical validation of our generative network model. The synthetic networks constructed and analyzed in what follows are openly available DryadDisruption2023 and can be used to test and other citation-network based bibliometric measures for sensitivity to CI and other aspects of secular growth.
We construct each synthetic citation network by sequentially adding new layers of nodes of prescribed volume in each MC period representing a publication year. Each new node, denoted by the index , represents a publication that could in principal cite any of the other existing nodes in the network. As such, the resulting synthetic networks are representative of a single scientific community, and also lack latent node-level variables identifying disciplines, authors, journals, topical breadth or depth, etc.
We seed the network with ‘primordial’ nodes that are disconnected, i.e. they have reference lists of size . This ensures that the initial conditions are the same for all networks generated. All nodes added thereafter have reference lists of a common prescribed size, denoted by . These rules ensure there is no variation within a given publication cohort regarding their synchronous connectivity.
To model the exponential growth of scientific production, we prescribe the number of new “publications” according to the exponential trend . We use as the publication growth rate empirically derived in prior work pan2016memory .
Similarly, we prescribe the number of synchronous (outgoing) links per new publication according to a second exponential trend . For both and we use their integer part, and plot their growth in Fig. 3(a).
We set the initial condition in scenarios featuring no reference list growth (characterized by ), such that each new publication cites 25 prior articles independent of . Alternatively, in scenarios that do feature reference list CI, we use the empirical growth rate value, and .
We then sequentially add cohorts of publications to the network over periods according to the following link-attachment (citation) rules that capture the salient features of scholarly citation practice:
Network growth rules
-
1.
System Growth: In each period , we introduce new publications, each citing other publications by way of a directed link. Hence, the total number of synchronous (backwards) citations produced in period is , which grows exponentially at the rate .
-
2.
Link Dynamics: illustrated in the schematic Fig. 3(b). For each new publication :
(i) Direct citation : Each new publication starts by referencing 1 publication from period (where by definition). The publication is selected proportional to its attractiveness, prescribed by the weight . The factor is the total number of citations received by thru the end of period , thereby representing preferential attachment (PA) link dynamics Simon_class_1955 ; Barabasi_evolution_2002 ; Jeong_Measuring_2003 ; Redner2005PA ; peterson_nonuniversal_2010 . The factor is the number of new publications introduced in cohort , and represents crowding out of old literature by new literature, net of the citation network. The parameter is a citation offset controlling for the citation threshold, above which preferential attachment “turns on” petersen_reputation_2014 such that a node becomes incrementally more attractive once .
(ii) Redirection : Immediately after step (i), the new publication then cites a random number of the publications cited in the references list (of size ) of publication . By definition, represents the fraction of citations following from this redirection mechanism, which is responsible for the rate of non-spurious triadic closure in the network. Hence, by construction , where represents the average number of citations to elements of by publication (such that the expected value of is ). Consequently, is the ratio of the rate of citations following citing mechanism (ii) by the rate of citation following the ‘direct’ citation mechanism (i).
We operationalize the stochastic probability of selecting references according to the binomial distribution,
(4) with success rate to ensure that . Put another way, on average, the total number of new citations per period that follow from the redirection citation mechanism (ii) is .
Once is determined by way of a random number generator, we then select members from the set (i.e. without replacement). Each publication belonging to is selected according to the same weights used in step (i). As such, this second-stage PA also prioritizes more recent elements of (i.e., those items with larger ), in addition to more highly-cited elements of . Note that we do not allow to cite any given element of more than once within its reference list.
(c) Stop citing after reaching : The referencing process alternates between mechanisms (i) and (ii) until publication has cited exactly publications.
-
3.
Repeat step 2. Link Dynamics for each new publication entering in period .
-
4.
Update the PA weights, , for all existing nodes at the end of each .
-
5.
Perform steps (1-4) for periods and then exit the network growth algorithm.
3.2 Computational simulation results
In this section we present the results of a generative citation network model pan2016memory that incorporates latent features of secular growth and two complementary citation mechanisms illustrated in Fig. 3(b), namely: (i) direct citation from a new publication to publication ; and (ii) redirected citations from to a random number of publications from the reference list of . The redirection mechanism (ii) gives rise to triadic closure in the network, thereby capturing shifts in correlated citation practice – such as the increased ease at which scholars can follow a citation trail with the advent of web-based hyperlinks, as well as self-citation. This redirection is the dominant contributor to ’consolidation’ measured by in . We explicitly control the rate of (ii) with a tunable parameter that determines the fraction of links in the citation network resulting from mechanism (ii). And to simulate the net effect of , we construct some networks featuring a constant and other networks featuring an increasing such that corresponding to roughly 1/3 of links arising from mechanism (ii) by the end of the simulation – see Fig. 3(c).
We construct ensembles of synthetic networks according to six growth scenarios that incrementally add or terminate either of two citation mechanisms: corresponds to no CI; and corresponds to no triadic closure (i.e., no ‘consolidation’). More specifically, the parameters distinguishing the six scenarios analyzed in what follows are:
-
(1)
no CI ( with ); and no explicit redirection mechanism that controls triadic closure ();
-
(2)
no CI ( with ); and an increasing redirection rate, such that ;
-
(3)
CI implemented using the empirical value () with ; and increasing redirection rate, ;
-
(4)
same as (3) but calculated using a larger citation window.
-
(5)
same as (3) but reference list capped at for .
-
(6)
same as (4) but reference list capped at for .
For each scenario we constructed four distinct synthetic citation networks, each evolving over periods (i.e years) from a common initial condition at . For scenarios (1-3) we calculate using a citation window of CW= 5 periods, whereas in (4) we use CW=10 periods. Scenarios (3) and (4) are shown in order to show the non-linear sensitivity of to the CW parameter bornmann2019disruption , and demonstrates that fixed CWs do not address CI petersen_citationinflation_2018 .
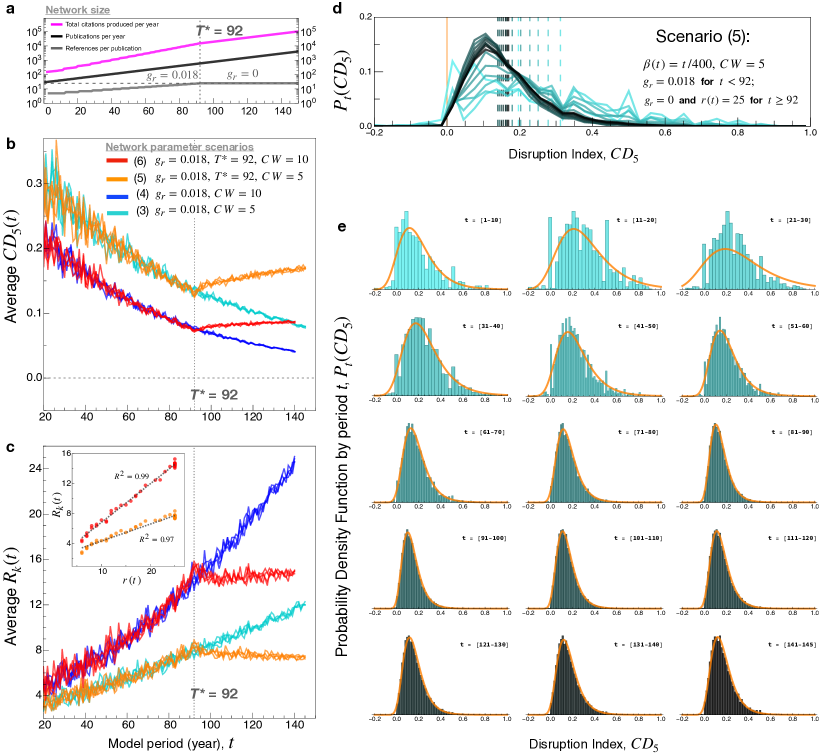
Figure 3(d) shows 16 average curves calculated for each synthetic network. Because the sources of network variation are strictly limited to the stochastic link dynamics, there is relatively little variance across each ensemble of networks constructed using the same scenario parameters, and so in what follows we show all realizations simultaneously. As there are no latent institution, author or other innovation covariates, then the difference between network ensembles is attributable to either CI or the redirection mechanism.
We start by considering scenarios (1,2) for which , which show that systematically increases in the absence of reference list CI. While scenario (1) does capture CI attributable to increased publication volume (), it does not appear to be sufficient to induce a negative trend in . Scenario (2) features an increasing , which results in larger values because redirected citations tend to fall outside shorter CW and thus are not incorporated into the subgraph. Summarily, comparison of (1) and (2) indicate that the redirection mechanism capturing shifting patterns of scholarly citation behavior is the weaker of the two mechanisms we analyzed.
The comparison of scenarios (2,3) illustrates the role of CI. Notably, scenario (3) reproduces both the magnitude and rate of the decreasing trend in observed for real citation networks park2023papers . Figure 3(e) shows that alternative metric proposed in ref. bornmann2020disruption , which also matches the empirical trends reported in ref. park2023papers . These results demonstrate the acute effect of reference-list CI on since the only difference between scenarios (2) and (3) pertains to .
Figure 3(f) reproduces the linear relationship between and and confirms the empirical relationship shown in Fig. 2(e) – thereby solving the mystery regarding the origins of the decreasing disruptiveness over time kozlov2023disruptive : as the size of the reference list increases, so does the likelihood that contains a highly-cited paper, which increases to such a degree that and so independent of the relative differences between disruption and consolidation captured by . Figure 3(g) shows that even suffers from systematic bias affecting its denominator, and so neglecting the term does not solve the fundamental issue of CI.
Scenarios (3,4) reveal the effect of CW, which controls the size of the set and thus the magnitude and growth rate of . Notably, the number of items included in depends on both CW and because the reference age between the cited and citing article increases with time pan2016memory . Regardless, the average as increases, independent of the used.
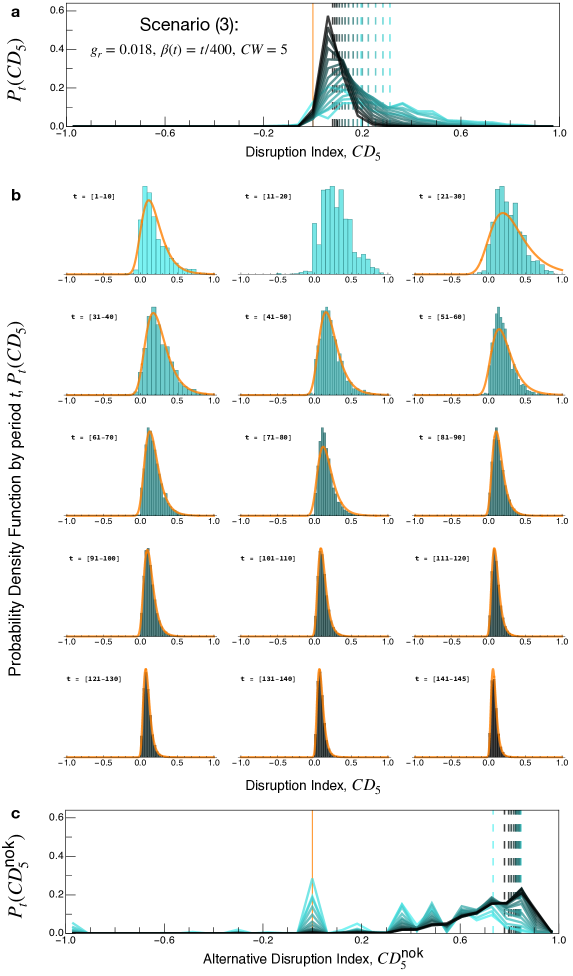
Figure 4 further explores the implications of CI on by modeling a hypothetical scenario in which CI is suddenly ‘turned off’ after a particular intervention time period . In this way, scenarios (5,6) explore the implications of a restrictive publishing policy whereby all journals suddenly agree to impose caps on reference list lengths. Scenarios (5,6) enforce this hypothetical policy at by way of a piecewise smooth curve such that: for and – see Fig. 4(a). This hypothetical intervention exhibits the potential for the scientific community to temper the effects of CI by way of strategic publishing policy. For completeness, scenarios (3) and (5) use CW=5 and scenarios (4) and (6) use CW =10.
Figures 4(b,c) show that the average and trajectories for each pair of scenarios are indistinguishable prior to . Yet immediately after the scenarios (5) and (6) diverge from (3) and (4), respectively. Notably, the average in scenarios (5) and (6) reverse to the point of slowly increasing, thereby matching the trends observed for scenario (2). In the spirit of completeness, Fig. 4(c) confirms that this trend-reversal is due to the relationship between and . The shifts in the average are indeed representative of the entire distribution of values – see Figs. 4(d,e). Interestingly, the distribution converges to a stable Extreme-Value (Fisher-Tippett) distribution in the absence of reference list growth, which exposes candidate avenues for developing time-invariant measures of disruption by rescaling values according to the location and scale parameters. The feasibility of this approach was previously demonstrated in an effort to develop field-normalized UnivCite and time-invariant (z-score) citation metrics petersen2014inequality ; HBP_2020 .
4 Discussion
In summary, Despite the reasonable logic behind the definition of , the difference between disruptive and consolidating links appearing in the numerator, , is systematically overwhelmed by the extensive quantity appearing in the denominator of . More specifically, we show that the index artificially decreases over time due to citation inflation deriving from ever-increasing , rendering systematically biased and unsuitable for cross-temporal analysis. For the same reasons that central banks must design monetary policy to avoid the ill effects of printing excess money orphanides1990money ; orphanides2003quest , researchers analyzing scientific trends should be wary of citation-network bibliometrics that are not stable with respect to time. Scenarios where achievement metrics are non-stationary and thus systematically biased by nominal inflation are common, including researcher evaluation petersen2010methods , journal impact factors ASI:ASI20936 , and even achievement metrics in professional sports petersen2011methods ; petersen_renormalizing_2020 .
In addition to the measurement error induced by CI, the disruption index also does not account for confounding shifts in scholarly citation practice. The counterbalance to disruption, captured by the term in Eq. (1), is consolidation (), which is fundamentally a measure of triadic closure in the subgraph . While triangles may spuriously occur in a random network, their frequency in real networks is well in excess of random base rates due to the correlated phenomena underlying the scholastic practice – in particular, increasingly strategic (personal and social) character of scholarly citing behavior.
The source and implications of citation inflation are not inherently undesirable, and if anything point to thriving industry emerging from the scientific endeavor. The advent of online-only journals is a main reason for the steady increase in , as they are not limited by volume print capacity, unlike more traditional print journals. Hence, in the era of megajournals petersen2018mismanagement there may have emerged a tendency to cite more liberally than in the past. Another mechanism connecting CI and citation behavior derives from the academic profession becoming increasingly dominated by quantitative evaluation, which thereby promotes the inclusion of strategic references dispersed among the core set of references directly supporting the research background and findings abramo2021effects . Notably, scholars have identified various classes of self-citation ioannidis2015generalized , which generally emerge in order to benefit either the authors fowler2007does ; ioannidis2019standardized ; pinheiro2022women , institutional collectives (tang2015there, ), the handling editor petersen2018mismanagement , and/or the journal martin2016editors ; ioannidis2019user – but are otherwise difficult to differentiate from ‘normal’ citations. Regardless of their intent, these self-citations are more likely to contribute to triadic closure because if article cites as a result of self-citation, then for the same reason a new article that cites (or ) is that much more likely to complete the triangle on principal alone.
These two issues – citation inflation and shifting scholarly behavior – introduce systematic bias in citation-based research evaluation that extends over significant periods of time. Indeed, time is a fundamental confounder, and so to address this statistical challenge various methods introducing time-invariant citation metrics have been developed UnivCite ; petersen_reputation_2014 ; petersen_citationinflation_2018 ; HBP_2020 . A broader issue occurs when different variables simultaneously shift over time, such as the number of coauthors, topical breadth and depth of individual articles, which makes establishing causal channels between any two variables ever more challenging. By way of example, we analyzed the relationship between and , using a regression model with fixed effects for publication year to superficially control for secular growth, and observe a positive relationship between these two quantities, in stark contrast to the negative relationship reported in ref. wu2019large .
We conclude with a policy insight emerging from our analysis regarding interventional approaches to addressing citation inflation. Namely, journals might consider capping reference lists commensurate with the different types of articles they publish, e.g. letters, articles, reviews, etc. An alternative that is more flexible would be to impose a soft cap based upon the average number of references per article page abt2002relationship . Results of our computational simulations indicate that such policy could readily temper the effects of citation inflation in research evaluation, and might simultaneously address other shortcomings associated with self-citations by effectively increasing their cost.
Data Availability
All synthetic citation networks analyzed are openly available at the Dryad data repository DryadDisruption2023 . The psuedocode for the citation network growth is sufficient to generate additional citation networks with different parameters.
References
- (1) Funk, R. J. & Owen-Smith, J. A dynamic network measure of technological change. Management science 63, 791–817 (2017).
- (2) Wu, L., Wang, D. & Evans, J. A. Large teams develop and small teams disrupt science and technology. Nature 566, 378–382 (2019).
- (3) Park, M., Leahey, E. & Funk, R. J. Papers and patents are becoming less disruptive over time. Nature 613, 138–144 (2023).
- (4) Pan, R. K., Petersen, A. M., Pammolli, F. & Fortunato, S. The memory of science: Inflation, myopia, and the knowledge network. Journal of Informetrics 12, 656–678 (2018).
- (5) Petersen, A. M., Pan, R. K., Pammolli, F. & Fortunato, S. Methods to account for citation inflation in research evaluation. Research Policy 48, 1855–1865 (2018).
- (6) Orphanides, A. & Solow, R. M. Money, inflation and growth. Handbook of monetary economics 1, 223–261 (1990).
- (7) Orphanides, A. The quest for prosperity without inflation. Journal of monetary Economics 50, 633–663 (2003).
- (8) Wuchty, S., Jones, B. F. & Uzzi, B. The increasing dominance of teams in production of knowledge. Science 316, 1036–1039 (2007).
- (9) Petersen, A. M., Pavlidis, I. & Semendeferi, I. A quantitative perspective on ethics in large team science. Sci. & Eng. Ethics. 20, 923–945 (2014).
- (10) Pavlidis, I., Petersen, A. M. & Semendeferi, I. Together we stand. Nature Physics 10, 700–702 (2014).
- (11) Bornmann, L. & Daniel, H.-D. What do citation counts measure? a review of studies on citing behavior. Journal of documentation (2008).
- (12) Petersen, A. M., Wang, F. & Stanley, H. E. Methods for measuring the citations and productivity of scientists across time and discipline. Physical Review E 81, 036114 (2010).
- (13) Shen, H.-W. & Barabási, A.-L. Collective credit allocation in science. Proceedings of the National Academy of Sciences 111, 12325–12330 (2014).
- (14) Petersen, A. M. Megajournal mismanagement: Manuscript decision bias and anomalous editor activity at PLOS ONE. Journal of Informetrics 13, 100974 (2019).
- (15) Sánchez-Gil, S., Gorraiz, J. & Melero-Fuentes, D. Reference density trends in the major disciplines. Journal of informetrics 12, 42–58 (2018).
- (16) Abt, H. A. & Garfield, E. Is the relationship between numbers of references and paper lengths the same for all sciences? Journal of the American Society for Information Science and Technology 53, 1106–1112 (2002).
- (17) Dai, C. et al. Literary runaway: Increasingly more references cited per academic research article from 1980 to 2019. Plos one 16, e0255849 (2021).
- (18) Nicolaisen, J. & Frandsen, T. F. Number of references: A large-scale study of interval ratios. Scientometrics 126, 259–285 (2021).
- (19) Sinha, A. et al. An overview of Microsoft Academic Service (MAS) and applications. In Proceedings of the 24th international conference on world wide web, 243–246 (2015).
- (20) Nakamoto, H. Synchronous and diachronous citation distributions. In Egghe, L. & Rousseau, R. (eds.) Informetrics 87/88: Select Proceedings of the 1st International Conference on Bibliometrics and Theoretical Aspects of Information Retrieval, 157–163 (Elsevier, New York, 1988).
- (21) Glänzel, W. Towards a model for diachronous and synchronous citation analyses. Scientometrics 60, 511–522 (2004).
- (22) Bornmann, L., Devarakonda, S., Tekles, A. & Chacko, G. Are disruption index indicators convergently valid? The comparison of several indicator variants with assessments by peers. Quantitative Science Studies 1, 1242–1259 (2020).
- (23) Wu, S. & Wu, Q. A confusing definition of disruption. SocArXiv e-print: 10.31235/osf.io/d3wpk (2019).
- (24) Leydesdorff, L., Tekles, A. & Bornmann, L. A proposal to revise the disruption index. El profesional de la información (EPI) 30 (2021).
- (25) Kozlov, M. ’disruptive’science has declined-and no one knows why. Nature (2023).
- (26) Krapivsky, P. L. & Redner, S. Network growth by copying. Phys. Rev. E 71, 036118 (2005).
- (27) Barabasi, A. Network Science (Cambridge University Press, 2016).
- (28) Radicchi, F., Fortunato, S. & Castellano, C. Universality of citation distributions: Toward an objective measure of scientific impact. Proc. Natl. Acad. Sci. USA 105, 17268–17272 (2008).
- (29) Petersen, A. M. et al. Reputation and impact in academic careers. Proc. Natl. Acad. Sci. USA 111, 15316–15321 (2014).
- (30) Petersen, A. M. The disruption index suffers from citation inflation and is confounded by shifts in scholarly citation practice: synthetic citation networks for bibliometric null models. https://datadryad.org/stash/dataset/doi:10.6071/M3G674 (2023).
- (31) Simon, H. A. On a class of skew distribution functions. Biometrika 42, 425–440 (1955).
- (32) Barabasi, A.-L. et al. Evolution of the social network of scientific collaborations. Physica A 311, 590 – 614 (2002).
- (33) Jeong, H., Neda, Z. & Barabasi, A. L. Measuring preferential attachment in evolving networks. EPL 61, 567 (2003).
- (34) Redner, S. Citation statistics from 110 years of physical review. Physics Today 58, 49–54 (2005).
- (35) Peterson, G. J., Presse, S. & Dill, K. A. Nonuniversal power law scaling in the probability distribution of scientific citations. Proc. Natl. Acad. Sci. USA 107, 16023–16027 (2010).
- (36) Bornmann, L. & Tekles, A. Disruption index depends on length of citation window. El profesional de la información (EPI) 28 (2019).
- (37) Petersen, A. M. & Penner, O. Inequality and cumulative advantage in science careers: a case study of high-impact journals. EPJ Data Science 3, 24 (2014).
- (38) Petersen, A. M., Ahmed, M. E. & Pavlidis, I. Grand challenges and emergent modes of convergence science. Humanities and Social Sciences Communications 8, 194 (2021).
- (39) Althouse, B. M., West, J. D., Bergstrom, C. T. & Bergstrom, T. Differences in impact factor across fields and over time. JASIST 60, 27–34 (2009).
- (40) Petersen, A. M., Penner, O. & Stanley, H. E. Methods for detrending success metrics to account for inflationary and deflationary factors. The European Physical Journal B 79, 67–78 (2011).
- (41) Petersen, A. M. & Penner, O. Renormalizing individual performance metrics for cultural heritage management of sports records. Chaos, Solitons & Fractals 136, 109821 (2020).
- (42) Abramo, G., D’Angelo, C. A. & Grilli, L. The effects of citation-based research evaluation schemes on self-citation behavior. Journal of Informetrics 15, 101204 (2021).
- (43) Ioannidis, J. P. A generalized view of self-citation: Direct, co-author, collaborative, and coercive induced self-citation. Journal of psychosomatic research 78, 7–11 (2015).
- (44) Fowler, J. & Aksnes, D. Does self-citation pay? Scientometrics 72, 427–437 (2007).
- (45) Ioannidis, J. P., Baas, J., Klavans, R. & Boyack, K. W. A standardized citation metrics author database annotated for scientific field. PLoS biology 17, e3000384 (2019).
- (46) Pinheiro, H., Durning, M. & Campbell, D. Do women undertake interdisciplinary research more than men, and do self-citations bias observed differences? Quantitative Science Studies 3, 363–392 (2022).
- (47) Tang, L., Shapira, P. & Youtie, J. Is there a clubbing effect underlying c hinese research citation increases? Journal of the Association for Information Science and Technology 66, 1923–1932 (2015).
- (48) Martin, B. R. Editors’ JIF-boosting stratagems–Which are appropriate and which not? Research Policy 45, 1–7 (2016).
- (49) Ioannidis, J. P. & Thombs, B. D. A user’s guide to inflated and manipulated impact factors. European journal of clinical investigation 49, e13151 (2019).
- (50) Egghe, L. A model showing the increase in time of the average and median reference age and the decrease in time of the price index. Scientometrics 82, 243–248 (2010).
- (51) Lariviere, V., Archambault, E. & Gingras, Y. Long-term variations in the aging of scientific literature: From exponential growth to steady-state science (1900-2004). JASIST 59, 288–296 (2008).
- (52) Acharya, A. et al. Rise of the Rest: The Growing Impact of Non-Elite Journals. arXiv:1410.2217 (2014).
- (53) Schwartz, C. A. The Rise and Fall of Uncitedness. College & Research Libraries 58, 19–29 (1997).
- (54) Wallace, M. L., Lariviere, V. & Gingras, Y. Modeling a century of citation distributions. Journal of Informetrics 3, 296 – 303 (2009).
- (55) Lariviere, V., Gingras, Y. & Archambault, E. The decline in the concentration of citations, 1900-2007. JASIST 60, 858–862 (2009).
- (56) Parolo, P. D. B. et al. Attention decay in science. Journal of Informetrics 9, 734 – 745 (2015).
- (57) Barabasi, A. L., Song, C. & Wang, D. Publishing: Handful of papers dominates citation. Nature 491, 40 (2012).
A1 Appendix: Reproduction of statistical regularities in a real-world citation network – the Web of Science
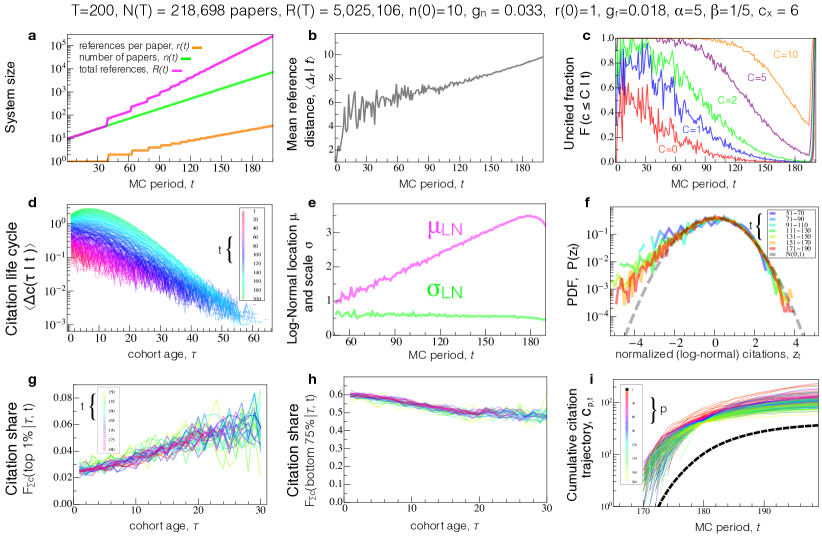
The following is a summary of the structural and dynamical regularities that characterize a typical network produced by our model using the growth parameters indicated along the top bar of Fig. A1. In addition to the stylized regularities listed below, the citation model also reproduces the temporal trends in , , and the frequency distribution , reported by Park et al. park2023papers – see Figs 1, A1 and A2.
Figure A1(a) shows the time series , , and as determined by the empirical parameters , , and .
Figure A1(b) shows the mean of the reference distance calculated as the time difference between the publication year of and of any given publication that it cites. The increasing conforms with prior theoretical and empirical work egghe2010model ; lariviere_long-term_2008 ; acharya_rise_2014 ; pan2016memory .
Figure A1(c) shows the decreasing frequency of publications with less than = 0, 1, 2,5, 10 citations. This trend is consistent with empirical work schwartz_rise_1997 ; Wallace2009296 ; lariviere_decline_2009 , and has profound implications on the connectivity of the citation network, and search and retrieval algorithms based upon the connectivity.
Figure A1(d) shows the average citation life-cycle, of individual publications conditioned on their publication year , where is the age of the publication in that year, . The exponential decay of the consistent with empirical work parolo_attention_2015 .
Figure A1(e) shows the mean and standard deviation of , where citations counts are tallied at , the final period of the model. Naturally, very recent publications have not had sufficient time to accrue citations. Also, very early publications were at the peak of their lifecycle during periods in which there was smaller . Hence, the average peaks near the end of the model, and then decays to 0 for the final period. This systematic bias due to citation inflation, as well as the right-censoring bias, may seem difficult to overcome. However, the location and scale given by and , respectively, provide a powerful solution, which is to normalized citations according to the rescaling,
| (A1) |
where and are the mean and the standard deviation of the logarithm of calculated across all within each . This normalization procedure leverages the property that the distribution is log-normally distributed, as shown for real citation networks UnivCite . As such, the distribution takes the form of a standardized z-score distributed according to the normal distribution , which is stable over time. As shown in Fig. A1(f), forms an inverted parabola when plotted on log-linear axes, independent of . This normalization is useful in regression settings aimed at identifying citation effects net of temporal trends, where is included in the model specification as either as a continuous or dummy variable petersen_citationinflation_2018 ; HBP_2020 .
Figures A1(g,h) show the evolution of the citation share of the top and bottom percentile groups , consistent with empirical work showing that a small fraction of the top-cited papers from high-impact journals increasingly dominate the future citations of that journal Barabasi2012 .
And Figure A1(i) shows individual citation trajectories, , produced by the model. The shape and distribution of the cohort are consistent with empirical citation trajectories reported in petersen_reputation_2014 .