Interpreting GNN-based IDS Detections Using Provenance Graph Structural Features
Abstract
The black-box nature of complex Neural Network (NN)-based models has hindered their widespread adoption in security domains due to the lack of logical explanations and actionable follow-ups for their predictions. To enhance the transparency and accountability of Graph Neural Network (GNN) security models used in system provenance analysis, we propose ProvExplainer, a framework for projecting abstract GNN decision boundaries onto interpretable feature spaces.
We first replicate the decision-making process of GNN-based security models using simple explainable models such as Decision Trees (DTs). To maximize the accuracy and fidelity of the surrogate models, we examine graph structural features founded on classical graph theory and enhanced by extensive data study with security domain knowledge. Our graph structural features are closely tied to problem-space actions in the system provenance domain, which allows the detection results to be explained in descriptive human language. ProvExplainer enabled simple DT models to achieve 95% fidelity to the GNN on program classification tasks with general graph structural features, and 99% fidelity on malware detection tasks with a task-specific feature package tailored for direct interpretation. The explanations for malware classification are demonstrated with case studies of five real-world malware samples across three malware families.
1 Introduction
With advanced and sophisticated attackers posing a significant threat [1, 2, 3], security is critical in today’s connected world. At the same time, recent advances in system provenance data collection techniques have resulted in a large amount of log data that needs to be analyzed to detect novel attacks. To address this challenge, Machine Learning (ML) has been widely adopted as a tool to enhance security detection [4, 5, 6, 7, 8, 9, 10, 11, 12, 13, 14, 15, 16, 17]. The success of ML in other domains has motivated security researchers and industry practitioners to explore advanced modeling approaches, such as Deep Neural Networks (DNNs) and GNNs, for improving their security defenses [18, 19, 20, 21, 22, 23, 24, 25, 26, 27]. Particularly, the recent popularization of system provenance in End-host Detection and Response (EDR) solutions has established a stable source of fine-grained system events, expressed in a highly complex heterogeneous graph format.
While the latest GNN-based classifiers and anomaly detectors can process deluges of system events streaming from large-scale deployments [28, 29, provdetector, nodoze, 13], their adoption in production is hindered by the black-box nature of NN-based security models and the lack of logical and actionable explanations for their decisions. In cybersecurity, where a single mistake can lead to catastrophic consequences, it is crucial to have models that can be trusted and can explain their results. Despite the proven ability of ML models to counter advanced and stealthy attacks, the black-box nature of the models makes it difficult for research and industry to fully trust [31] the models due to their inability to explain and justify the detection results.
Among other merits, the most pronounced advantage of NN-based models lies in their ability to learn directly from the original representation with minimal preprocessing. The latest development of applying NNs to graph-structured datasets, GNNs, has framework-level support for learning from relational dependencies and topological structures in graphs. The GNN uses a message passing mechanism that reaches out to more distant nodes and edges with each added layer. The ability to automatically learn from complex graph datasets has helped users in various domains, but is comes at the cost of sharply reduced visibility into the internal structure of the model, which shrouds the reasoning behind the models’ predictions.
In this paper, we propose a novel approach to enhance the transparency and accountability of complex GNN models by replicating their decision-making process with simpler, explainable models such as DTs. While employing simple surrogate models to explain the decisions of complex models is not new and is inherently restricted by the limited capacity of the surrogate, our proposed research bridges that gap with theoretically principled structural graph features and data-driven studies that incorporate security domain knowledge. Particularly, our research focuses on developing abstract structural graph features that are robust against adversarial manipulation and are designed to facilitate problem space interpretation by human domain experts. We believe our research context and proposed approach are in tandem with the most pronounced usages of system provenance, which aims to defend against advanced threats.
The insight behind our research is that highly complex NN and GNN models infer hidden features by processing a colossal amount of data. We thus believe that, with well-defined sets of features aided by extensive data study and domain knowledge, a simpler model can reproduce the behavior of complex models and achieve a compatible degree of prediction accuracy. To accurately project the complex model’s decision boundary into an interpretable feature space to produce trustworthy explanations, we aim to maximize the surrogate model’s fidelity to the complex model. Seen from a different perspective, one can regard our research effort as a process of rearranging a typical ML architecture by decoupling the processes of feature selection (or feature engineering) and decision-making processes of the complex models (i.e., NN-based models), with a focus on using feature engineering to assist human interpretation rather than simply improving model performance. For example, via data study, we develop features that capture several graph substructures and their topological properties to capture well-known malicious activities, such as drive-by-download (e.g., dropper malware) behavior [dropper, dropper2], and explain the malware detection results.
By using principled, interpretable features to approximate the complex implicit features learned by GNN models, we can reap the benefits of complex models while minimizing sacrifices to transparency. In high-stakes domains, concrete explanations that are grounded in the problem space (i.e., system-level actions) are crucial to verify predictions, develop action plans, and justify organizational responses. The feature engineering process, although labor-intensive, can be accelerated through careful orchestration of extensive datasets, black-box oracles, principled graph theory foundations, and security domain knowledge.
With the goal of creating transparent and trustworthy GNN-based security detectors, we focus on the system provenance domain due to its fine-grained data and expressive graph representation. System provenance is based on low-level system events that capture extensive causal dependencies across different system resources. While previous research has used system provenance data to defend against advanced and stealthy attacks, most have lacked proper mechanisms to verify their detection results and determine follow-up actions. Given the widespread use of system provenance and its application in detecting behavioral anomalies, we believe this research is well-timed and meets the pressing needs of both academia and industry.
While our research takes full advantage of an extensive dataset that we collected from real systems, the paper specifically focuses on the structural features of system provenance graphs, without considering the text or numerical node and edge attributes. We restrict the scope of our attribute view for the following reasons: First, the core merit of provenance-based Intrusion Detection System (IDS) lies in the ability to retain features drawn from causal dependencies captured and buried in graph structural relations; these structural features are significantly more difficult for adversaries to manipulate than textual attributes (e.g., filenames). Second, we already have ample research and industry solutions that can handle text and numerical attributes. Via extensive data study, we concretely associate structural graph features with problem space actions to understand and explain the detection result in descriptive human language or with Cyber Threat Intelligence (CTI) formats [34, yara].
Notably, our research does not attempt to replace existing GNN model explanation approaches. While stable and accountable, ProvExplainer’s coverage is inherently limited by the capacity of our surrogate architecture, DT. We intend ProvExplainer to be complementary to a large body of existing literature on ML and GNN model explanation efforts [36, 37, 38, 39] with a specific emphasis on security detections and their interpretability. To our knowledge, none of the existing GNN model explanation approaches try to leverage structural features that are tailored to cybersecurity applications.
Being first to propose a surrogate model explanation approach for provenance-based IDS, ProvExplainer renders the following contributions:
-
•
ProvExplainer examines structural graph features rooted in classical graph theory literature and extensive data studies aided by security domain knowledge, which are linked to problem space actions.
-
•
Our features enabled simple DT models to achieve 95% fidelity on program classification tasks with general structural features, and 99% fidelity on malware detection tasks with specialized features tailored towards security detection.
-
•
Our extensive evaluation using in-house data collection and real-world malware samples [40] confirmed the efficacy of the structural graph features in practice, showcasing a variety of case studies.
Our research is enabled by the extensive system provenance datasets that we established with in-house deployment and malware execution instances referred from credible sources [40]. To benefit the community and facilitate future research, we will publicize our dataset and code to support researchers and security practitioners.
2 Background and Related Work
In this section, we first introduce system provenance and its applications in anomaly detection and malware classification. We then provide insights for building GNN models using in-host system provenance graphs. Next, we discuss the efforts made to explain these GNN models. Finally, we address the challenges related to the interpretability of GNN models.
2.1 System Provenance and Graph Learning
System provenance. System provenance analysis [41] was originally proposed by King et al. [42]. A data collection agent installed on each host collects syscall-level system events and sends them to a central database. These events are then used to associate files, processes, and network resources through their data and control dependencies, creating a provenance graph. The events that system provenance collects are: (1) process events, such as process create and destroy; (2) file events, including file read, write, and execute; and (3) network events, including socket open, close, read, and write.
Host-based IDS. While most anomaly detection approaches use network traces [43, 44] for detection, several approaches perform intrusion detection with system events. Amit et. al [45, 46] propose an approach to detect intrusion events from system events by retrieving entities from the collected events and constructing relations among the entities. Siddiqui et al. [47] developed a system to detect malicious system entities using a multi-view based technique. [provdetector] proposes a document embedding and ML pipeline to detect stealthy malware using system events. Security threats (i.e., abnormal events) are defined by providing statistical queries related to the relationships to detect anomalies. NoDoze [nodoze] is a threat alert triage system that uses OS-level system log events.
Provenance-based IDS. With the increased deployment of provenance based security solutions in the last decade [48], provenance graphs form the foundation for graph-based learning and detection approaches in the security domain. In this regard, provenance graphs best represent the runtime characteristics of system entities and have quickly become an essential source of input to model the runtime behavior of programs. Along with recent developments in graph-based learning approaches [49, 19, 50], research on GNN-based behavioral modeling and its application for anomaly detection has gained considerable momentum [26, 27].
2.2 Model Explainability
Despite the proven effectiveness of deep graph structures such as GNN on a wide variety of tasks, their lack of explainability and interpretability support has hindered their adoption for critical applications. Graph explainability has been categorized by Yuan et al. [51], but new explainers have been since been added. In security, we group explainers into two categories: black box and white box. Black box explainers generate explanations by approximating the predictions by locally learning the explainable models, e.g., linear models and additive models [52, 53]. White box explainers focus on explaining predictions using two primary methods: forward and backward propagation. The forward propagation method changes the input and checks the change in output of the task to infer important features. Backward propagation uses the NN gradient to extrapolate the important features. The white box methods GNNExplainer [36], PGExplainer [37], and TAGE [54], have access to the target GNN’s internals. Black box methods, such as XGNN [55] and SubgraphX [38], only need to access the inputs and outputs of the GNN. These explainers are not well suited for the security domain as they do not consider edge features while creating explanations and their computation time increases exponentially with the size of the graph. System provenance graphs are relational and contain both node and edge types and attributes. Therefore, ProvExplainer considers both node and edge types and the associated subgraphs to make predictions that consider the whole graph context.
Due to the importance of explainability in security applications, we have seen several explainers for ML-based security analysis. LEMNA [guo2018lemna] focused on classifying PDF malware and detecting a function’s entry point in binary code using regression mixture models to approximate the decision boundary. But these models are unable to predict the GNN’s decision boundary since the GNN’s decision boundary is created based on the topological and structural relationships in graphs which is not taken into account by the regression mixture models. Recent works such as CFGExplainer [39] are very specialized in explaining data from a certain distribution and suffer when out-of-distribution data or new data is used. Herath et al. [39] explains GNN-based malware classification using control flow graphs. Therefore, it cannot be directly applied to provenance-based ML pipelines, whereas our explainer can be directly applied.
Jacob et al. [jacobs2022ai] proposed TRUSTEE, an immediate predecessor work closest to ProvExplainer, which extends the DT model to produce high-fidelity and low-complexity decision trees to determine the trustworthiness of complex ML detectors against a variety of network attacks. However, TRUSTEE works on readily available features from network packets (e.g., packet header entries), whereas ProvExplainer focuses on abstract graph structure and proposes new features associated with their problem space interpretations.
ProvExplainer is a black box technique that focuses on GNN-based security detectors whose model structures are far more opaque and complex than other models. GNNs often use multiple layers of nodes and edges to process and analyze the data, and it can be difficult to understand how the network is making decisions or arriving at predictions. Worse, GNNs often use complex mathematical operations and algorithms, which can further add to their complexity. Many GNNs are designed to be highly effective at solving specific tasks, and the focus on improving performance often impedes interpretability.
3 Research statement
The primary objective of explainable ML is to provide logical explanations for classification and anomaly detection results. Specifically, in the context of graph learning, given an input graph instance and a GNN-based classifier , the classifier will assign a label for (i.e., ). Note, for anomaly detection, can be out-of-distribution data or a completely new graph. Explanation techniques then aim to provide the reasoning for why is identified as . This involves identifying graph components such as vertex-edge relationships (e.g., system events) or subgraph structures that make key contributions to the decision process. The selected subgraph components are interpretable and can be verified by security analysts with the ground truth, therefore providing a context-aware explanation.
To this end, we create global explanations in the form of DTs that agree with the black-box GNN model’s decisions, which we use to describe in detail the reasoning behind the model’s behavior. Earlier works have been successfully applied to other black-box models [58, 59, 60, jacobs2022ai], but have not yet succeeded in extracting DT explanations from GNN models or other models in the system provenance domain. In this paper, we focus on generating DT-based explanation methods for GNNs in the domain of security applications.
4 ProvExplainer Overview
We overview the steps that ProvExplainer takes to arrive at its explanations and then review the design options to build DT models.
4.1 ProvExplainer Workflow
Granted a complex model built with system provenance dataset, we outline three stage process for user to apply ProvExplainer.
Stage 1: Refine feature sets. We carefully curated and designed a set of features that captures key structural signals (behaviors) from the input graph that can be directly mapped back to actions (ground truth) in the problem space. Unlike traditional feature engineering, this step focuses on selecting features that result in decision paths that are interpretable by security domain experts and are also sufficiently expressive to approximate the GNN’s decision boundary. In § 5, we describe a foundational feature set that expresses a wide range of graph structural structures and provide their problem space interpretations in the context of system provenance.
Our core feature set can be easily extended with analysis-specific features to tune the explanations to particular subtasks; we exercise a demonstrative example with our security domain feature package (§ 5.3), that play vital roles malware detection tasks; in particular, our case studies highlight their usefulness in practice (§ 7) where we use ProvExplainer’s explanations to explore the GNN’s detection decisions on five malware samples across three case studies of different malware families.
Stage 2: Train interpretable surrogate. Next, we use the same large system provenance dataset that was used to train the GNN to train an interpretable surrogate model using the feature sets we have selected. By modelling the GNN’s decision boundary using the selected features, we project the GNN’s decision boundary onto the interpretable feature space. In this work, we use three different types of decision trees (detailed in § 4.2) as our interpretable surrogates because they have high fidelity and easy to interpret. Notably, this approach is not limited to decision trees, and benefits from orthogonal work in developing new interpretable models.
Stage 3: Interpret the surrogate. Finally, we use the interpretable surrogate as a projection of the GNN’s decision boundary to draw actionable evidence about the GNN and explain individual decisions. Because ProvExplainer yields global explanations, domain experts can analyze the interpretable surrogate model to improve their understanding and increase their trust toward the GNN.
4.2 Extracting Decision Trees
To achieve the best accuracy and fidelity results, we enhance traditional DT in three dfferent ways: (1) directly train the decision tree on the provenance data, (2) train the decision tree on the model’s labelling of the provenance data, and (3) TRUSTEE’s data augmentation approach. Combined with our graph structural features, we compare three design options in our experimental evaluations (§ 6). In all three approaches, we begin with an original labelled set of graphs , which is used to train the GNN. We then collect the GNN’s predictions on , yielding . To prepare data for training our DT models, we extract the structural graph features described in § 5 to create a labelled feature dataset . For fidelity-oriented approaches, we associate the GNN’s predictions with the structural features to create . In our evaluation § 6, F1 scores are calculated against , and fidelity is calculated against .
DirectDT: Training a DT directly on . This is the only one of the three approaches that doesn’t prioritize fidelity to the GNN’s predictions. This approach does yield the most accurate DT of the three approaches, and will therefore largely agree with the GNN as long as both the DT and the GNN perform well on the dataset. However, because this DT only considers the true labels , its ability to explain the GNN’s predictions is limited to highlighting structural trends in the training data. In the evaluation § 6, we call this approach DirectDT.
FidelityDT: Training a DT directly on . This approach aims to immediately maximize fidelity to the GNN, which provides strong explanatory power. Unsurprisingly, immediately optimizing for fidelity yields the most faithful DT models of the three approaches, which can provide insight into the trends and shortcuts that the GNN has learned. However, DT models are prone to overfitting, so the explanations yielded by this method can be unstable. That is, small changes in the training data can result in disproportionately large changes in the explanation. In the evaluation § 6, we call this approach FidelityDT.
ProvDT: Training a DT on with data augmentation. Leveraging the methods of Jacobs et al. [jacobs2022ai], we use two-layer iterative dataset augmentation to train a series of DT models. At each iteration of the inner loop, all misclassified samples are duplicated to increase their weight in the next iteration; from this series of models, the one with the highest fidelity is selected as the result of the inner loop. This process is repeated several times in the outer loop, then the surrogate model with the highest mean agreement among those high-fidelity DTs is selected as the final surrogate model for explanation. This dramatically improves the stability of the explanations, but at the cost of some fidelity and accuracy on smaller datasets. Because the surrogate model is aggregated over several iterations, the final resulting model is less sensitive to small changes in the training set. In the evaluation § 6, we call this approach ProvDT.
5 ProvExplainer Graph Features
A key contribution of ProvExplainer is the curation of a structural graph feature suite that abstractly represents problem space system actions. These graph features enable simple, interpretable ML models to achieve high classification and anomaly detection fidelity with much more powerful GNN models. We build our graph-level features from traditional node-level graph features, which are then aggregated over the different types of system provenance entities (files, processes, and network sockets).
5.1 Structural Graph Features
Our analysis primarily considers abstract graph structural features to assess the predictive ability of control and data dependencies captured by system provenance graphs. Besides the basic statistical features such as node and edge counts, we refer to the classic graph theory research literature and borrow a series of standard features known to capture the key characteristics of input graphs that are robust against the minute deviations that can take place on subgraph nodes and edges.
From the graph theory literature, we selected the following structural features [61]: degree centrality, closeness centrality, betweenness centrality, eigenvector centrality, clustering triangles, and clustering coefficient. These features capture important behavioral trends of system entities, but need to be aggregated across the nodes of a graph to obtain graph-level features. Without further specification, while the structural features are useful to ML models, they are difficult to directly tie back to the problem space for interpretation by human experts.
We provide informal definitions of each feature to refresh the reader. Degree centrality is simply the degree of the node; that is, the number of incident edges. Closeness centrality is the inverse of the mean shortest path distance from all other nodes to the target node, measuring how "close" the rest of the graph is. Betweenness centrality is the proportion of shortest paths between any other two nodes that include the target node, which measures how frequently it is used as a waypoint. Eigenvector centrality provides a distributed measure of importance; the target node will have high eigenvector centrality if its neighbors also have high eigenvector centrality. Clustering triangles counts the number of "triangles" that the node participates in. The clustering coefficient divides the clustering triangles by the degree of the target node, measuring how close to a complete graph it forms with its neighbors.
5.2 System Entity Type Differentiation
To refine the meaning of each of the structural graph features discussed in § 5.1, we modify the aggregation scheme to separate the features collected for each class of system entity: files, processes, and network sockets. In this section, we examine the system-level behaviors that are measured by each of these type-aware structural features.
File and Process Closeness Centrality. Closeness centrality is most impactful when aggregated over files or processes. When a file is read from but never written to, it is unreachable in the provenance graph, so its node-level closeness centrality is 0. Files that are written to have a positive closeness centrality, with a stronger emphasis on files that are written to by many processes. One of the primary signals that is captured in the file closeness centrality is the ratio of file reads to file writes. When file closeness centrality is high, it typically indicates the presence of shared log files and lock files. When file closeness centrality is low, it typically indicates the presence of shared libraries, caches, and configuration files.
Process closeness centrality is a measure of the reachability of processes in the provenance graph. Small or tightly-knit graphs will have a higher process closeness centrality than that of larger and more spread out graphs. In particular, "shortcuts" through the main process chain through file communication are a key driver of process closeness centrality in large graphs. Complementing file closeness centrality, process closeness centrality signals the representation of file read operations in the population of process operations. When process closeness centrality is high, the program involved typically operates on a small region of the system and primarily performs read operations. Low process closeness centrality indicates the prominence of file write operations and suggests that the program is operating on a large scale.
File and Socket Degree Centrality. When aggregated over files, high degree centrality reveals the presence of important files that are shared across several processes, including logs, locks, libraries, and data files. Because degree centrality is normalized by the number of nodes in the graph and every node is at least degree 1, file degree centrality also signals the prevalence of file nodes in a provenance graph.
Similarly, aggregating degree centrality over network socket nodes can reveal network locations that are contacted by several processes, as well as indicate the overall prominence of network connections in the provenance graph.
File and Process Betweenness Centrality. When aggregated over processes, the betweenness centrality measures the linearity of the multiprocessing logic. That is, the process betweenness centrality is maximized when there are several file or network reads at the start of a process chain, then several file or network writes at the end of the process chain. Low process betweenness centrality often indicates the presence of "leaf" processes that do not generate any output files, but can also indicate nonlinear information flow. For example, if there is a tree of processes, or a communication file between some processes that circumvents the typical process chain, that will lower the process betweenness centrality.
When aggregated over files, the betweenness centrality is a measure of the program’s dependence on files for communicating information between processes. File closeness centrality is maximized when the only files touched by the program are used as bridges between islands of processes. Low file closeness centrality indicates that files are primarily used as input/output (e.g., log files, result files, shared libraries, and cache files).
File and Process Eigenvector Centrality. Notably, when the provenance graph happens to be acyclic, the eigenvector centrality will be zero for all nodes. This “special value” for eigenvector centrality indicates that the information flow was strictly unidirectional.
In system provenance graphs, processes with high eigenvector centrality are typically "ringleaders" that control a large amount of information. That is, these ringleaders are restrictive bridges that connect otherwise disconnected components of the graph. Similarly, files with high eigenvector centrality are used as communication channels between influential processes. These communication channels are typically lock files or data files.
File and Process Clustering Triangles. Files participate in triangles with processes, so aggregating across either files or processes will illustrate the prevalence of shared resources between parent and child processes. Notably, clustering triangles do not capture resources shared between processes that are not immediately related. In practice, whichever entity type is less prominent in the graph overall will give a stronger signal through this feature. Triangles commonly form around shared library, lock, and log files.
File and Process Clustering Coefficient. In contrast to the unprocessed triangle count, the clustering coefficient more accurately represents the degree to which a node’s neighbors are related. Typically, processes will cluster around shared lock and log files when a parent process and its children perform similar tasks. Similarly to the unprocessed triangle count, the lesser represented entity between files and processes will usually give the stronger signal.
5.3 Security Domain Features
In our research, we have identified microstructures and entity subclasses that are important to capture in the security domain. In this section, we introduce these security domain features, which are directly tied to system-level events.
Dropper triangles. Malware will often "drop" staged payloads onto the system for execution. This behavioral pattern leaves a recognizable structure in the provenance graph, which enabled us to create a feature that tracks it. When a process writes to a file, then creates a child process that executes that file, this creates a dropper triangle.
Clone triangles. When a process executes a file, then creates a child process that executes the same file, this indicates that the parent process cloned itself. This pattern does not necessarily entail malicious behavior, but it is an uncommon and noteworthy structure. Clone triangles indicate homogenous multiprocessing-based parallelism, which is common in malware that blitzes towards their objectives. Clone triangles are also common in benign programs that use multiprocessing as part of their standard workflow.
Probe triangles. When a process inspects a file by reading it before creating a child process that executes it, they are exhibiting probing behavior. In malicious programs, the probing pattern is used to avoid triggering rare events caused by executing files that don’t exist. The probing pattern can also be used to confirm the version or validity of a utility before invoking it. Probing is common in quieter malwares and in programs that have specific dependencies on other programs on the system.
Internal vs. external network connections. Network connections serve as a significant indicator for understanding a program’s behavior. To further enhance this information, we differentiated network nodes based on whether their IP addresses were internal or external to the system’s network. This adds a robust feature with minimal engineering effort, has high security importance, and is difficult for attackers to manipulate.
6 Evaluation
To confirm our research hypothesis and evaluate ProvExplainer effectiveness, we designed two sets of experiments to measure the accuracy (in F-1 score) and its accordance with complex models (in fidelity score). Leveraging extensive datasets we established from benign deployments and malware samples from credible sources, we carefully designed experiments to understand the predictive power of the proposed graph structural features and practical usefulness in detecting malware samples. Lastly, regarding plausibility evaluation, we introduce case studies analyzing system provenance graphs drawn from noteworthy malware samples to show ProvExplainer’s applicability in real world security operations.
6.1 Evaluation Protocols
Throughout the evaluation, we leverage extensive system provenance data collections established from real-world deployment and malware samples. Using the datasets, we also exercised different surrogate modeling approaches: naïve DirectDT, FidelityDT, and ProvDT. Finally, we employed different sets of graph structural features to evaluate their predictive abilities without considering textual and numerical attributes which are easily manipulated by attackers. With these experiment settings, we consider both program classification and malware detection tasks.
Program classification. In this experiment, to verify the predictive power of graph structural features, we choose widely used programs from Linux and Windows systems whose runtime behaviors are dictated by command line arguments. In the appendix (§ A.2), the selected programs are summarized in Table 4 and representative graphs are illustrated in Figure 4. While originating from the same static binary, these programs run different tasks directed by their command line arguments, causing their runtime behavior and resulting system provenance graphs to dramatically diverge. We first attempt to classify programs running different tasks using complex models. After that, we replicate those with different surrogate modeling approaches achieving similar accuracy and high fidelity scores. Then, referring to the resulting DTs, we manually investigate and analyze the list of outstanding features that contributed to the classification.
Fileless malware detection. We specifically target a family of stealthy malware samples that impersonate well-known benign programs. Granted that the malware uses the benign program binary to inject malicious logic into a process, it can trivially evade conventional security solutions such as Anti-Virus (AV) file scanners. However, their runtime behaviors will be captured by system provenance. We evaluate the performance of ML-based security detectors and interpret the reasons behind their detection results. Among the malware samples that have been selected for evaluation, we chose noteworthy instances for individualized case studies in § 7.
python programs. From Linux, we choose five distinctive python programs for program classification. Besides the fact that all of these programs stem from the python binary running different scripts at runtime, python is also one of the most popular scripting languages, so it is well-represented in the wild. Due to python’s convenient syntax, widespread availability, and mature ecosystem, many malware authors favor python for prototyping malware and attack payloads. The developer community has gradually adopted python for important tasks such as system utilities, language decompilers, certification management, malware analysis, etc. . Linux program behaviors generally involve a larger number of file accesses (e.g., reads and writes), and therefore yield larger system provenances graphs that contain more information. The verbose nature of Linux and its provenance graphs has contributed to the high accuracy for program classification tasks even when we only have accounted the coarse-grained graph structural features. A detailed list of five different python programs that we choose for the evaluation are listed in Table 4 alongside their descriptions.
svchost.exe programs. svchost.exe is a Windows system program that hosts wide range of hardware and OS related services daemons in the background whose behaviors are determined by command line arguments, which load different library (e.g., .dll) files. Due to the svchost.exe’s persistent presence and its well-trusted nature, adversaries often impersonate svchost.exe to launch their attack payloads. Therefore, in addition to the benign program classification task using svchost.exe, we also exercised an anomaly detection task to distinguish between benign and malicious svchost.exe instances. Detailed list of svchost.exe programs invoked with different command line arguments are listed in Table 4 alongside their brief descriptions.
rundll32.exe programs. rundll32.exe hosts specific functions exported from library (e.g., .dll) files. While similar to svchost.exe, rundll32.exe is more easily exploited, as an attacker can write their own .dll to be loaded by rundll32.exe. Security incident reports and research rank rundll32.exe as one of the most favored targets for malware impersonation because it can be used to embed malicious .dlls into the target’s address space using a legitimate host program. We conducted two sets of evaluations for rundll32.exe: program classification for benign rundll32.exe applications and anomaly detection for malware samples that impersonate rundll32.exe. The different categories of tasks include calling API functions within a .dll to execute system commands, refreshing Windows Universal App Package cache, performing maintenance tasks on the Windows state repository, and updating and patching system software or driver. These tasks can help resolve various issues related to system settings, installation and removal of UWP apps, and performance optimization. A detailed list of rundll32.exe programs that load different .dll are listed in Table 4 alongside their brief descriptions.
Fileless malware. The fileless malware dataset used for malware detection is given in Table 6, and the malwares can be broadly classified into three categories: banking trojans, DDoS trojans, and ransomware. Banking trojans such as Zeus [grammatikakis2021understanding], Emotet [grammatikakis2021understanding] and Blackmoon [kuchler2021does] are used to steal banking credentials. They spread through spam and compromised download links. To camouflage their interactions with .dlls and writes and read from temporary files, they masquerade as svchost.exe. Distributed-Denial-of-service Ulise [kuchler2021does] is a multi-purpose trojan that can establish remote access connections, capture keyboard input, collect system information, download/upload files, drop other malware into the infected system, and perform denial-of-service (DoS) attacks. Because it usually interacts with network sockets, it masquerades as nslookup.exe.
| Dataset | Metric | Black-Box GNN | DirectDT | FidelityDT | ProvDT |
| Program classification | |||||
| python | F1 / Fidelity | 0.96/ — | 0.89/ 0.86 | 0.91/ 0.92 | 0.95/ 0.99 |
| svchost.exe | F1 / Fidelity | 0.89/ — | 0.86/ 0.85 | 0.84/ 0.89 | 0.83/ 0.88 |
| rundll32.exe | F1 / Fidelity | 0.91/ — | 0.94/ 0.83 | 0.87/ 0.93 | 0.82/ 0.90 |
| Average | F1 / Fidelity | 0.92/ — | 0.90/ 0.92 | 0.87/ 0.92 | 0.87/ 0.92 |
| Fileless malware detection | |||||
| explorer.exe | F1 / Fidelity | 0.99/ — | 0.99/ 0.99 | 0.98/ 0.98 | 0.97/ 0.97 |
| nslookup.exe | F1 / Fidelity | 0.99/ — | 0.98/ 0.97 | 0.96/ 0.98 | 0.98/ 0.97 |
| netsh.exe | F1 / Fidelity | 0.99/ — | 0.98/ 0.99 | 0.98/ 0.99 | 0.97/ 0.97 |
| python.exe | F1 / Fidelity | 0.99/ — | 0.96/ 0.96 | 0.96/ 0.96 | 0.95/ 0.95 |
| rundll32.exe | F1 / Fidelity | 0.99/ — | 0.98/ 0.98 | 0.99/ 0.99 | 0.97/ 0.97 |
| schtasks.exe | F1 / Fidelity | 0.99/ — | 0.99/ 0.99 | 0.99/ 0.98 | 0.97/ 0.97 |
| svchost.exe | F1 / Fidelity | 0.99/ — | 0.99/ 0.99 | 0.99/ 0.99 | 0.97/ 0.97 |
| Average | F1 / Fidelity | 0.99/ — | 0.98/ 0.98 | 0.98/ 0.98 | 0.97/ 0.97 |
6.2 Structural Graph Feature Evaluation
Surrogate model performance. We evaluate the efficacy of the graph structural features proposed in § 5 at improving the accuracy and fidelity to the baseline GNN models across different surrogate generation approaches (DirectDT, FidelityDT, and ProvDT). The GNN used was a Graph Attention Network(GAT) [gat] with eight connected layers, sixty-four hidden neuron and four heads. Recalling the DT generation procedures outlined in § 4.2, DirectDT was trained directly on the true data labels, FidelityDT was trained on the labels generated by the GNN, and ProvDT was trained on the GNN labelled data with additional pruning and data augmentation to improve the stability and quality of the result.
Table 1 shows the F1 score of the base GNN model alongside those of three other surrogate models: DirectDT, FidelityDT, and ProvDT. To estimate the stability and performance of the proposed schemes, we performed 10-fold cross validation and reported the average and standard deviation of the F1 score across the 10 folds. The surrogate models were given the features discussed in § 5, including type-sensitive node and edge counts, type-sensitive centrality and clustering measures, as well as counts of the security-relevant microstructures discussed in § 5.3. As expected, the baseline GNN outperforms the simple surrogate models in all categories. We highlight the high fidelity that the decision trees were able to achieve with features that are meaningful to human security experts. The FidelityDT surrogate was able to achieve the highest overall F1-score and fidelity of the surrogate models, both at 0.97. Notably, the ProvDT surrogate was able to better take advantage of larger datasets, particularly the benign python dataset. While directly optimizing the decision tree for accuracy yielded the highest F1-score in most cases, the cost to fidelity caused by not tying the results to those of the black box means that the DirectDT surrogate is less able to explain the GNN’s predicitons. Although the naïve approaches yielded better performance on several of these datasets than the ProvDT surrogate, we chose to use the ProvDT in our case studies because of the generalizability and readability advertised in [jacobs2022ai]. The pruned and feature selected decision trees produced by ProvDT ensure that the decision nodes include only the features that are important and independent of each other are selected, and it stops the decision tree of overfitting the data by pruning the tree. These claims in [jacobs2022ai] were validated by the ProvDT surrogate’s stronger ability to take advantage of larger datasets than the naïve approaches.
In malware detection, python.exe has the lowest F1 and fidelity scores for the surrogate models, falling 3 or more points behind in F1 score, but the GNN has similar detection rates as on the other fileless malwares. Through manual inspection of graphs in the python.exe dataset, we found that the malicious and benign graphs were extremely similar, even under direct investigation by human security experts. Both the benign and malicious python.exe instances read many .pyc files to load libraries, made external socket connections to query APIs, and created multiple processes for parallel computing. The GNN is able to leverage its message passing function to discover hidden patterns that yielded a small performance edge over the surrogates and over human experts. Because these hidden patterns were not captured by interpretable graph features, the surrogate models were not able to fully replicate the GNN’s decision-making process in these few cases. Overall low standard deviations across classification and anomaly detection experiment indicated the stability of DT-based surrogate modeling for both accuracy and fidelity metrics.
| Dataset | Metric | Feature Set | |||||||
| Security Domain Features § 5.3 | |||||||||
| Structural Graph Features § 5.1 | System Entity Type Differentiation § 5.2 | Dropper Triangles | Clone Triangles | Probe Triangles | Internal vs External IPs | All Security Domain Features | All Features | ||
| Program Classification | |||||||||
| python | F1 | 0.76 (-0.16) | 0.90 (-0.02) | 0.55 (-0.40) | 0.23 (-0.69) | 0.30 (-0.62) | 0.29 (-0.63) | 0.63 (-0.29) | 0.92 |
| Fidelity | 0.81 (-0.14) | 0.93 (-0.02) | 0.55 (-0.40) | 0.27 (-0.68) | 0.35 (-0.60) | 0.30 (-0.65) | 0.65 (-0.30) | 0.95 | |
| svchost.exe | F1 | 0.75 (-0.08) | 0.80 (-0.03) | 0.37 (-0.46) | 0.30 (-0.53) | 0.32 (-0.51) | 0.30 (-0.53) | 0.44 (-0.39) | 0.83 |
| Fidelity | 0.78 (-0.11) | 0.86 (-0.03) | 0.38 (-0.51) | 0.31 (-0.58) | 0.35 (-0.54) | 0.30 (-0.59) | 0.45 (-0.44) | 0.89 | |
| rundll32.exe | F1 | 0.77 (-0.07) | 0.81 (-0.03) | 0.51 (-0.33) | 0.35 (-0.49) | 0.50 (-0.34) | 0.45 (-0.39) | 0.55 (-0.29) | 0.84 |
| Fidelity | 0.88 (-0.05) | 0.92 (-0.01) | 0.51 (-0.42) | 0.35 (-0.58) | 0.51 (-0.42) | 0.45 (-0.48) | 0.58 (-0.35) | 0.93 | |
| Average | F1 | 0.76 (-0.16) | 0.90 (-0.02) | 0.51 (-0.41) | 0.23 (-0.69) | 0.30 (-0.62) | 0.29 (-0.63) | 0.63 (-0.29) | 0.92 |
| Fidelity | 0.81 (-0.14) | 0.93 (-0.02) | 0.55 (-0.40) | 0.27 (-0.68) | 0.35 (-0.60) | 0.30 (-0.65) | 0.65 (-0.30) | 0.95 | |
| Fileless Malware Detection | |||||||||
| explorer.exe | F1 | 0.95 (-0.04) | 0.97 (-0.02) | 0.94 (-0.05) | 0.94 (-0.05) | 0.97 (-0.02) | 0.95 (-0.04) | 0.96 (-0.03) | 0.99 |
| Fidelity | 0.97 (-0.02) | 0.97 (-0.02) | 0.95 (-0.04) | 0.95 (-0.04) | 0.98 (-0.01) | 0.97 (-0.02) | 0.97 (-0.02) | 0.99 | |
| netsh.exe | F1 | 0.98 (0.00) | 0.98 (0.00) | 0.98 (0.00) | 0.95 (-0.03) | 0.98 (0.00) | 0.91 (-0.07) | 0.98 (0.00) | 0.98 |
| Fidelity | 0.98 (-0.01) | 0.98 (-0.01) | 0.99 (0.00) | 0.96 (-0.03) | 0.98 (-0.01) | 0.92 (-0.07) | 0.98 (-0.01) | 0.99 | |
| nslookup.exe | F1 | 0.96 (-0.01) | 0.96 (-0.01) | 0.96 (-0.01) | 0.91 (-0.06) | 0.96 (-0.01) | 0.96 (-0.01) | 0.98 (0.01) | 0.97 |
| Fidelity | 0.97 (-0.01) | 0.97 (-0.01) | 0.96 (-0.02) | 0.93 (-0.05) | 0.97 (-0.01) | 0.97 (-0.01) | 0.98 (0.00) | 0.98 | |
| python.exe | F1 | 0.80 (-0.14) | 0.88 (-0.06) | 0.77 (-0.17) | 0.81 (-0.13) | 0.83 (-0.11) | 0.80 (-0.14) | 0.88 (-0.06) | 0.94 |
| Fidelity | 0.82 (-0.13) | 0.88 (-0.07) | 0.79 (-0.16) | 0.81 (-0.14) | 0.84 (-0.11) | 0.81 (-0.14) | 0.87 (-0.08) | 0.95 | |
| rundll32.exe | F1 | 0.95 (-0.04) | 0.98 (-0.01) | 0.95 (-0.04) | 0.95 (-0.04) | 0.99 (0.00) | 0.96 (-0.03) | 0.98 (-0.01) | 0.99 |
| Fidelity | 0.96 (-0.03) | 0.98 (-0.01) | 0.96 (-0.03) | 0.96 (-0.03) | 0.99 (0.00) | 0.97 (-0.02) | 0.98 (-0.01) | 0.99 | |
| schtasks.exe | F1 | 0.95 (-0.03) | 0.95 (-0.03) | 0.95 (-0.03) | 0.91 (-0.07) | 0.97 (-0.01) | 0.96 (-0.02) | 0.97 (-0.01) | 0.98 |
| Fidelity | 0.95 (-0.03) | 0.96 (-0.02) | 0.96 (-0.02) | 0.93 (-0.05) | 0.98 (0.00) | 0.97 (-0.01) | 0.98 (0.00) | 0.98 | |
| svchost.exe | F1 | 0.86 (-0.13) | 0.93 (-0.06) | 0.95 (-0.04) | 0.91 (-0.08) | 0.96 (-0.03) | 0.93 (-0.06) | 0.98 (-0.01) | 0.99 |
| Fidelity | 0.88 (-0.11) | 0.93 (-0.06) | 0.95 (-0.04) | 0.93 (-0.06) | 0.97 (-0.02) | 0.93 (-0.06) | 0.98 (-0.01) | 0.99 | |
| Average | F1 | 0.95 (-0.04) | 0.97 (-0.02) | 0.94 (-0.05) | 0.94 (-0.05) | 0.97 (-0.02) | 0.95 (-0.04) | 0.96 (-0.03) | 0.99 |
| Fidelity | 0.97 (-0.02) | 0.97 (-0.02) | 0.95 (-0.04) | 0.95 (-0.04) | 0.98 (-0.01) | 0.97 (-0.02) | 0.97 (-0.02) | 0.99 | |
Graph structural feature effectiveness. We show the importance of the graph structural features introduced in § 5. Table 2 summarizes their impacts on fidelity and accuracy of the generated DT explanations. We show that basic graph statistics are insufficient for the surrogate decision tree model to consistently produce faithful predictions across all the datasets. By combining structural features, entity type awareness, and security-specific features, the surrogate DTs are able to explain the black-box GNN’s decisions across a wide range of datasets.
Graph structure. We supply the model with the structural graph features outlined in § 5.1 aggregated over all the nodes in the graph. In most cases, the surrogate DT has difficulty modelling the GNN’s decisions without the entity type information encoded in the graph. This shows that while the structural features do indeed capture important information about the relationships between the nodes of the graph, they paint an incomplete picture of the behavior of the programs. Further, the type-unaware graph features do not cleanly map onto the problem space for interpretation, with each feature aggregating several behavioral signals into one number.
System entity type differentiation. We supply the model with the graph structural features outlined in § 5. We see that the performance only undergoes slight degradation as compared to the DT models that were supplied with all the available features. This indicates that the DT models are able to use the structural information with entity types to infer similar behavioral tendencies as the GNN. This feature set performs well on a wide variety of tasks and datasets, creating a strong foundation for general provenance graph explanations.
Security domain features. We supply the model with the concrete security domain features presented in § 5.3. We consider each of these features individually as well as all together to provide a more comprehensive view of the effectiveness of these features. Notably, because these features are designed to extract malicious behaviors, they do not provide a strong signal to the model in the benign program classification tasks. In the malware detection tasks, however, any of the features on their own provides a very strong signal for malware detection; together, they perform nearly as well as when all features are present. Importantly, since these features are directly and concretely tied to the problem space, they are easily understood by security domain experts.
All features. We supply the model with all the above features to serve as an upper bound on available information, and by extension, an upper bound on performance. We see slight improvement over the DT models that only had structural information or security-specific features, which shows that the structural features work well in tandem with domain-specific extensions. In many cases, we find that there is significant overlap in the behaviors that can be inferred from different meaningful feature space projections, as evidenced by the relatively small performance enhancement provided by considering all the feature sets together.
7 Case Studies
To showcase ProvExplainer’s explanation performance on malware detection tasks, we collected fileless malwares suggested by various credible sources [62, 63, 64, 40], which are summarized in Table 7. While all malware samples target Windows, we first ran the initial round of analysis by running 5203 malware instances from a sandbox environment, then we manually analyzed the provenance graphs to choose 4197 noteworthy ones. The 4197 selected samples represent 30 malware families, each of which required 2 hours to interpret the GNN’s decisions and analyze the root causes.
7.1 Banking Trojans
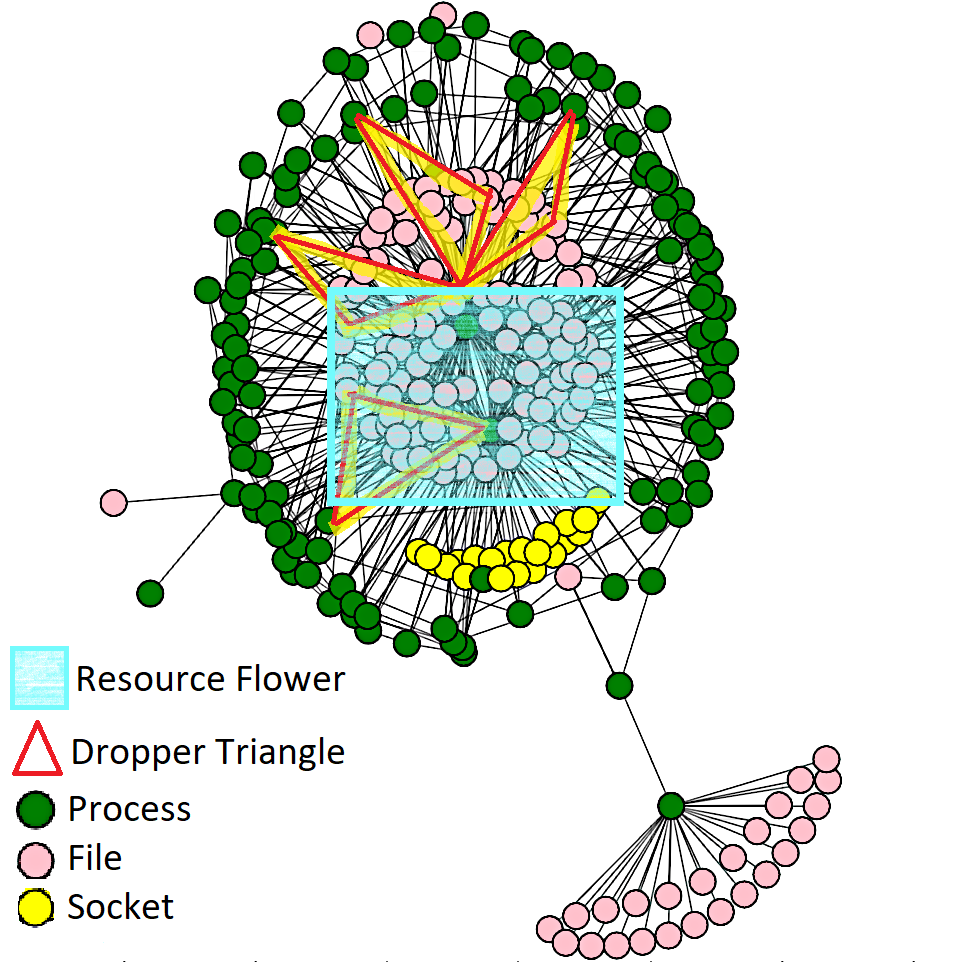
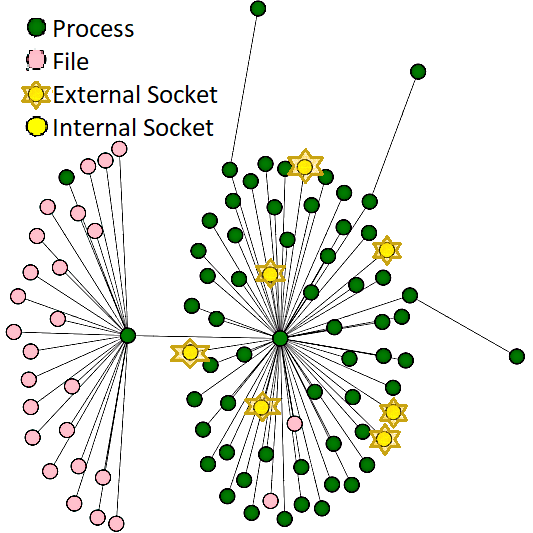
Description. Blackmoon is a highly advanced and constantly evolving trojan discussed by Kuchler et al. [63]. First reported in 2014, Blackmoon specifically target banking applications to steal user credentials. Blackmoon infects computers primarily through drive-by downloads or infected software installers. Once inside the computer, they execute their malicious activities, including process impersonation, privilege escalation, and data exfiltration. While primarily focusing on Blackmoon , we also analyzed other similar banking trojans: Zeus and Emotet [62]. The different malwares and their signature graph features are shown in Figure 1.
DT Rules. The important features used for malware classification are dropper triangles ( 0.006), and process closeness centrality ( 0.393). The average number of dropper triangles in each of the banking trojan samples are: Blackmoon (2.45), Emotet (1.02), and Zeus(1.34); these are significantly higher than the average number of dropper triangles in benign svchost.exe instances (0.02). The average process closeness centrality for each of the banking trojan samples are: Blackmoon (0.021), Emotet (0.035), and Zeus(0.033); these are substantially lower than the average process closeness centrality of benign svchost.exe (0.534) instances.
System interpretation. Blackmoon [kuchler2021does] starts its kill chain by first reading shared .dlls, and then writing and executing a file called svchost.exe. The malicious svchost.exe writes sensitive information to temporary files (e.g., C:\298KE7.EXE, C:\5LO32.EXE). Then, the malicious svchost.exe creates a chain of processes by writing a temporary executable file which contains the next link in the chain, then executing it to create a domino effect. The behavior of parent process writing to a temporary file, which is executed to create a child which involves reading the temporary file by the child process creates the dropper triangle substructure.
As seen in 1(a), the malware staging behavior is difficult to distinguish visually, but the dropper triangle feature efficiently captured the behavior. The presence of dropper triangles indicates that the processes captured in the provenance graph are highly related and are executing files that were written to by their parents. In normal execution, benign svchost.exe graphs almost never include dropper triangles, and often do not include any triangles; the average dropper triangle count for svchost.exe is 0.02.
The low process closeness centrality shows that each process node cannot reach every other resource node, which means that each process has clusters with a specific purpose (e.g., write files, contact the C&C server, find other devices on the local network). In § 5.2, we found that process closeness centrality is reduced when file/ socket write operations are prominent, particularly when those writes are to different files / sockets. Because the processes in Blackmoon write to significantly more files than a benign svchost.exe instance, the process closeness centrality of Blackmoon is substantially lower. In normal execution, benign svchost.exe reads (of *.dll, *.log, *.mui) far more often than it writes to files; the average process closeness centrality metric for svchost.exe is 0.534.
Cross comparison. Although visually indistinguishable, the similar set of similar behaviors across Blackmoon , Emotet , and Zeus are captured by graph structural features. For each of Blackmoon (1(a)), Zeus (1(b)) and Emotet (1(c)), we can see one instance of a dropper triangle (§ 5.3) marked in red and “flowers” that drive process closeness centrality marked in a sky blue box, which signify the presence of multiple resource access from a single node. Although the flowers of system resources that surround particular processes in the figures can be either file nodes or socket nodes, the process closeness centrality metric only considers their relation to the process, not the entity type of the other participating nodes. In this case, process closeness centrality is reduced by the flowers because they are file/socket writes, which introduce many nodes that cannot reach the process in the provenance graph. Taking the combination of these two features into consideration, this program is characterized by processes writing and executing staged payloads, but those processes engage in relatively little direct communication.
7.2 Distributed Denial of Service Trojans
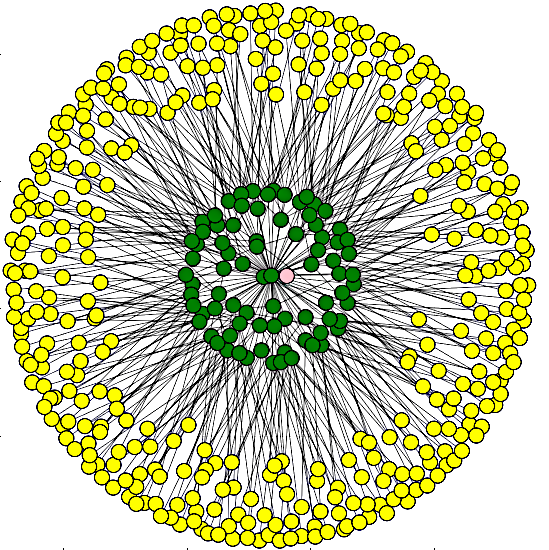
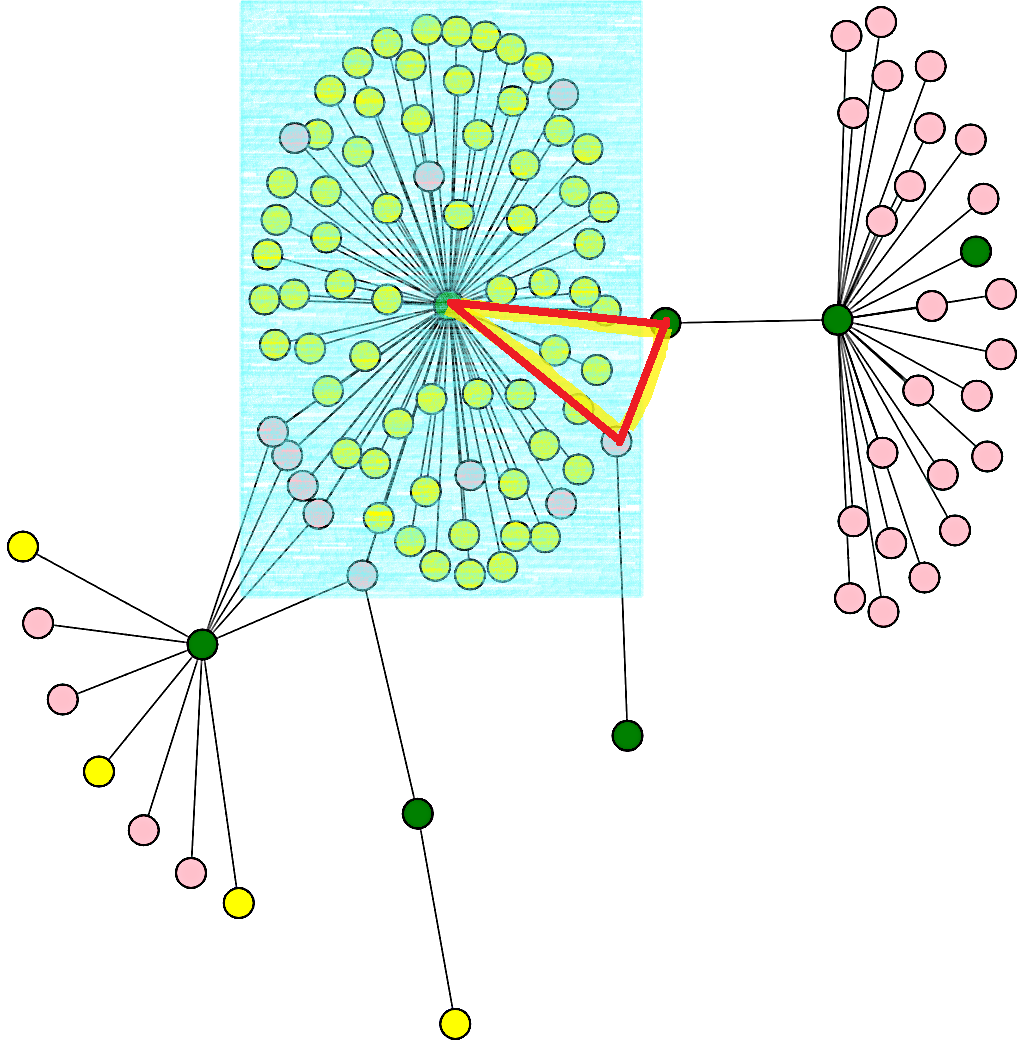
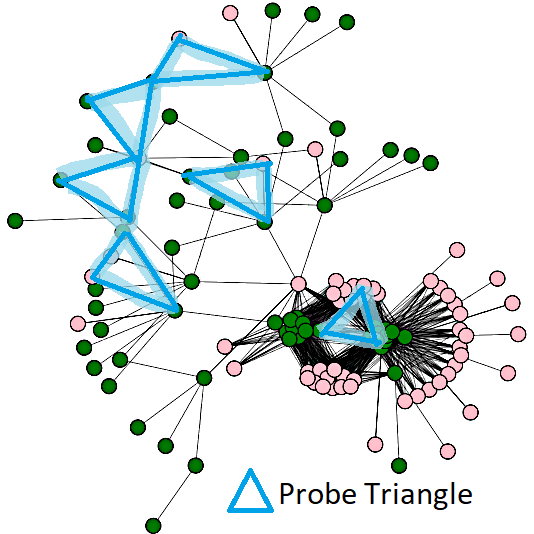
Description. Ulisse [kuchler2021does] is a fileless malware that masquerades as nslookup.exe to infect a victim’s computer system and open a backdoor, allowing attackers to remotely control the infected device. Ulisse brute-forces its way across the victim’s network, finding vulnerable machines and causing widespread damage by replicating itself and overloading the network with socket connections. Another similar kind of malware is MyDoom , which impersonates rundll32.exe and carries out a distributed denial-of-service (DDoS ) attack against the website of the SCO Group. The main distinction between Ulisse and MyDoom is the side of the network that the target belongs to. Still, they exhibit similar behavior as shown in Figure 2.
| Program | Process Clustering Coefficient | Process Closeness Centrality | File Betweenness Centrality | Number of External Socket Writes | File Degree Centrality |
| DT Rule Threshold | 0.004 | 0.227 | 0.002 | 2.0 | 0.058 |
| Benign nslookup.exe | 0.003 | 0.197 | 0.001 | 4.4 | 0.375 |
| Ulisse | 0.003 | 0.013 | 0.001 | 2.5 | 0.005 |
| Benign rundll32.exe | 0.002 | 0.157 | 0.001 | 0.1 | - |
| Mydoom | 0.001 | 0.207 | 0.001 | 7 | - |
DT rules. The five most important features for malware classification and their thresholds are shown in Table 3.
System interpretation. Referencing the feature values in Table 3, Ulisse has a low process clustering coefficient, indicating that the resources that the processes access are typically not shared. Its very low process closeness centrality indicates that the processes are focused almost exclusively on sending out information to files or to network sockets. Low file betweenness centrality indicates that Ulisse ’s processes do not typically communicate through files. The relatively low number of external socket writes shows that Ulisse is not extensively communicating to the internet. Finally, the extremely low file degree centrality shows that there are very few file interactions. Combining these observations into a cohesive view of Ulisse , based on these features, Ulisse is a program that performs substantial internal network writes, and does not interact with many files on the host system; this suggests that Ulisse is an independent program that primarily aims to propagate information contained in its binary to other devices on the local network.
Again referencing Table 3, MyDoom is similar to Ulisse in its low process clustering coefficient and file betweenness centrality. Where MyDoom differs is in its abnormally high number of external socket writes, which indicates that MyDoom is communicating extensively with entities on the internet, and its high process closeness centrality, which indicates that there are many file reads near the start of the process chain (typically caused by loading shared libraries). Based on these features, MyDoom is a program that relies heavily on resources that already exist on the system, communicates extensively with external network entities, and does not engage in significant interprocess communication.
Cross comparison. Ulisse is a self-contained malware that does not read a lot of .dll files, and starts by writing an executable file under C:\\AppData\\Roaming\\Microsoft and executing it. The main purpose of the trojan is to behave like nslookup.exe by interacting with network sockets and writing a huge number of DNS queries. The malicious nslookup.exe then copies itself and creates multiple copies which make DNS queries. These DNS queries are executed by each program individually, which creates no process triangles to serve as evidence of clustering. These DNS queries are evidence of the malware trying to brute force and map the internal network.
MyDoom is a standalone trojan that creates an executable file in the C:\\AppData\\Local\\Temp directory, which requires access to multiple .dll files. The executable file is written and executed, creating a series of trusted system programs such as cmd.exe, at.exe, rundll32.exe, and cacls.exe. Particularly, the “cacls” command is used to modify permissions on system folders and volumes, granting the victim user full control. rundll32.exe runs a function from the WININET.dll library located in C:\\Windows\\syswow64, making MyDoom send constant HTTP requests to launch a DoS attack. Also, cmd.exe first deletes all scheduled tasks and uses AT.exe to schedule its own task. The task is set to run at 9:00 AM daily and will run with the highest privileges in an interactive mode. The task is to run a file written to the C:\\Users\\\%USERPROFILE\%\\Desktop\\system3_.exe file which contains the logic of making HTTP connections to the targeted host.
Even though the purpose of MyDoom is to attack a host in the external network, the behavior is robustly captured by the graph features. MyDoom starts from a core process that creates multiple child processes, and each child process then performs substantial network write operations to different network sockets. This suggests that the program is focused on transmitting data to external sources rather than processing or storing large amounts of data locally.
7.3 Ransomware Installer
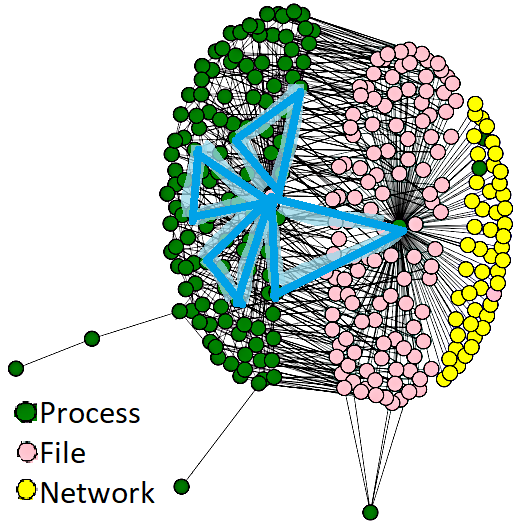
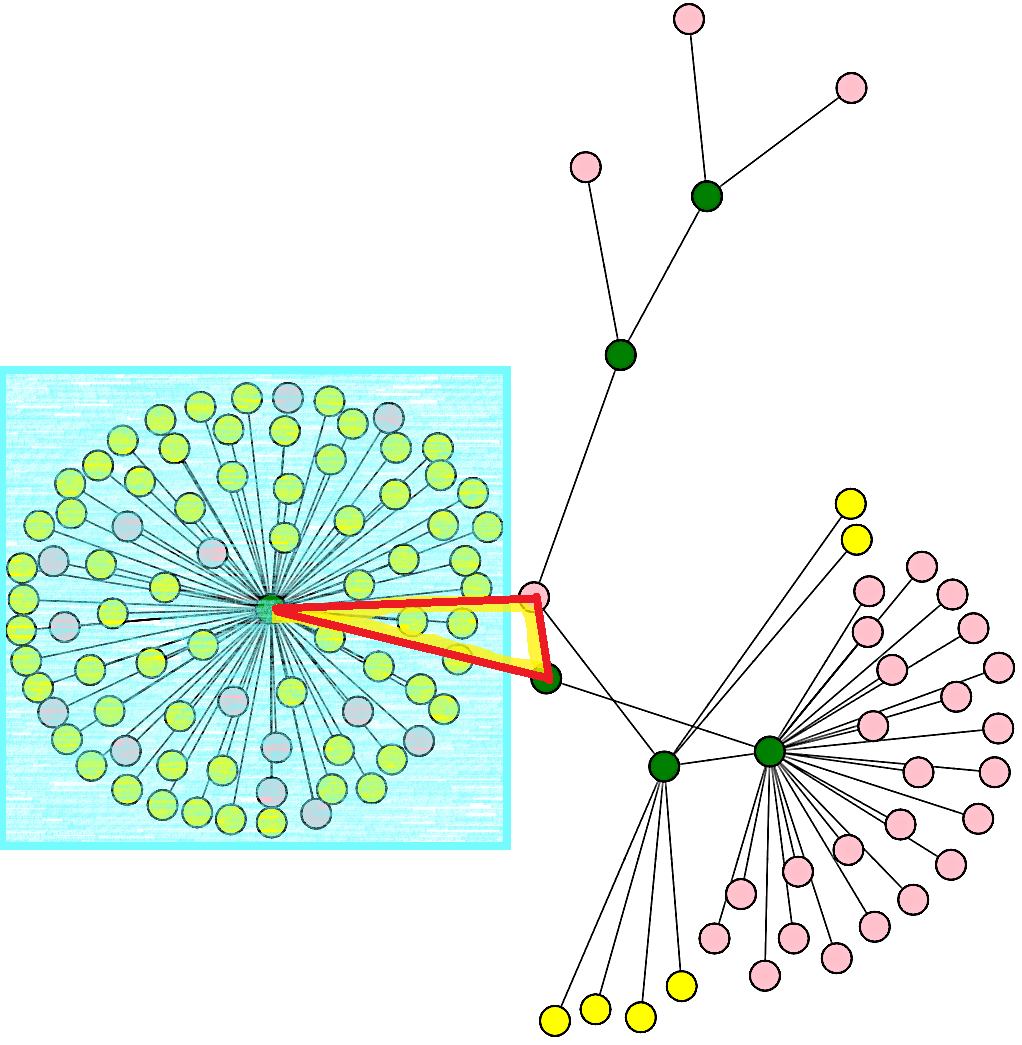
Description. The VirLock [66] ransomware impersonates explorer.exe to evade detection. It rapidly creates multiple copies of itself to overwhelm the system and efficiently encrypt files, making them inaccessible to the user until a ransom is paid. VirLock typically spreads through malicious email attachments, social engineering, and drive-by downloads. Two ransomware installers, VirLock and Scar , are shown in Figure 3, which highlights their security-relevant substructures.
DT rules. The decision path to classify the ransomware installers simply checks if probe triangles are prominent (> 25.5). The average number of probe triangles in each of the ransomware installers are: VirLock (39), and Scar (351); these are significantly higher than the average number of probe triangles in benign explorer.exe (2.4) and benign svchost.exe (0.7), respectively.
System interpretation. VirLock is a polymorphic family of ransomware which attempts to lock users out of their device while infecting other files on the system. Upon execution, it creates two morphed copies of itself and places them in the %USERPROFILE% and %ALLUSERSPROFILE% directories. The ransomware will then read a copy of this file and execute it to create a new process creating the probe triangle structure. This instance of the malicious process with benign name such as explorer.exe or vbs.exe. This behavior will continue till the system is overloaded with malicious processes. Interestingly, this replication behavior is captured under another feature that is not used in the explanation: clone triangles are created as the malware writes VBS scripts in %LOCALAPPDATA% and executes them to facilitate the infection of other local files.
Cross comparison. Although visually indistinguishable, the similar set of similar behaviors across VirLock and Scar are captured by graph structural features. For each of VirLock (3(a)), and Scar (3(b)), we can see multiple instance of probe triangles (§ 5.3) marked in blue. Scar creates new configuration files (e.g., C:\USERS\APPDATA\LOCAL\QPATH.INI) on the infected system, which it reads before executing to create a copy of itself. Scar modifies existing files on the infected system to create a backup of the configuration file, by writing to temporary directory C:\USERS\APPDATA\LOCAL\TEMP\TMPUMMPDY. The presence of clone triangles are identified in both VirLock and Scar as sometimes the malware executes the backup configuration file and assumes that the file will be there since the location is secretive and hidden inside the system directory, so it does not do a read operation to verify and just executes it to create another instance of the malware.
8 Discussion and Future Work
Comparison to existing GNN Explainers. The paper provides a framework to identify shortcut learning [jacobs2022ai] and a quantifiable metric to trust the State-of-the-Art (SOTA) provenance-based IDS leveraging powerful GNN models. In this paper, ProvExplainer provides global black box explanations through graph structural features that are interpreted in terms of system-level actions in the problem space. These interpretations can be used by the security operators to improve their understanding of different graph features and how these features can be leveraged to build IDS classifiers that rival SOTA DNN based IDS. To that end, we discuss some points that we came across when we were conducting the research. The DT explanations provided by ProvExplainer are a tool that domain experts can use to diagnose shortcut learning. When only a small number of graph features are needed to classify large portions of the data with high fidelity, that may be evidence of a structural shortcut that the black-box model learned. Once these simple heuristics have been identified, it is up to a domain expert to determine how likely it is to generalize; that is, the domain expert must determine if the shortcut is a real data trend or simply an artifact of the training distribution.
GNN model capacity. If decision trees trained upon the interpretable features provide accuracy comparable to GNN models, why do we need highly resource intensive GNN-based-IDS? In an IDS context, the automatic adaptability and generality provided by GNN models are necessary for quickly understanding the execution profiles of a wide variety of programs. The decision trees that ProvExplainer uses to generate explanations require some manual feature engineering to be able to consistently keep up with the GNN’s decisions on known datasets. While the features that are developed and discussed in this paper proved to be generally useful, their effectiveness varied on different datasets (e.g., the DT models performed better on the python dataset than on the svchost dataset). Notably, if the GNN’s decision boundary cannot be well-represented by a small number of graph features, that provides some evidence that the GNN is not relying on a convenient oversimplification of the execution modelling task. GNN’s are optimized to learn from the neighboring nodes in a graph using the message passing algorithm, so they are able to accurately learn the distinguishable substructure. So, the expressive nature of deep structures becomes very helpful when the programs in the dataset are similar. This does not diminish the utility of ProvExplainer. Because, even with a good accuracy there is chance of shortcut learning, and ProvExplainer is able to identify that and in that instance increase the trust on the deep model.
Adversarial Manipulation of Graph Features. What are the implications of attackers using knowledge of the structural graph features to design adversarial attacks against the explainer? The interpretable explainer models used in ProvExplainer are separate models used by the black-box detection model. There are two failure cases to consider: (1) a low-impact failure, where the explainer marks the behavior as anomalous, but the detection model claims that it is benign; and (2) a high-impact failure, where the explainer model marks the behavior as benign, but the detection model claims that it is anomalous. Low-impact failures can be caused by benign workload drift or software version updates, and do not worsen the ability of an organization to respond to cyber threats. High-impact failures will prevent an organization from obtaining an actionable explanation of alerts raised by the detection model, which will hinder the triaging process. The most direct way to perform structural graph feature manipulation is to add thousands of edges through process and file interactions, such that the “benign-looking” camouflage makes up a significant portion of the overall provenance graph. Under this style of attack, Goyal et al. showed that even state-of-the-art (SOTA) provenance detectors are highly vulnerable to adversarial manipulations [68]. Fooling both the interpretable surrogates and the underlying black-box model is the ideal case for an attacker seeking to avoid suspicion, so an attacker with the ability to launch this style of attack on the explanation model is also capable of attacking the detection model. Even with a limited set of targeted manipulations, Mukherjee et al. demonstrated that SOTA provenance detectors can be evaded [69]. Creating robust detection and explanation systems that can withstand such significant adversarial manipulation is a critical open research problem, and is beyond the scope of this work.
Is ProvExplainer model agnostic? ProvExplainer is model agnostic and works on black-box provenance-based IDS as long as we can query the model to get a detection result. This line of research is not novel, as previous works [jacobs2022ai], have used decision trees as surrogate models for deep neural networks before. ProvExplainer’s novelty stems from bridging the gap between the feature space decision boundary and the problem space actions necessary to satisfy the condition in the system provenance domain. The interpretation of advanced graph features in the system provenance domain enables domain experts to better understand the system-level evidence that provenance-based IDS models are prioritizing.
Capturing subgraph modifications. To address the weakness of whole-graph aggregation washing out the influence of small malicious subgraph modifications, ProvExplainer’s DT explanations can be combined with other subgraph explanations techniques (e.g., SubgraphX) which were originally not suitable for security domain, but can be tied to problem space actions by ProvExplainer’s interpretable features. By weighting the aggregation functions according to the importance that the GNN places on each node and edge, we believe that local explanations that leverage ProvExplainer’s graph features will be able to detect small changes in subgraph structures. In future work, we plan on combining the strengths of ProvExplainer with those of generic GNN-based explainers e.g., GNNExplainer and SubgraphX, we hope to contextualize the relative degrees of global trends and edge-case logic involved in a particular prediction.
Behavioral query language for system provenance. In the future work we hope to develop a graph query language using defined behavioral features to classify programs and perform anomaly detection. The graph query will be based on the graph features, allowing the operator to search for programs using problem space descriptions of their behavior, which will be converted into graph features in the query engine. For example, if the operator wants to find long process chains that are making outward network connections and reading from temporary files, they will look for program with low process closeness centrality, non-zero process triangle clustering and non-zero but not too large socket degree centrality.
9 Conclusion
We have introduced ProvExplainer, a novel framework that defines graph structural features and their corresponding system-level interpretations to address the pressing need for increased transparency and accountability in provenance-based IDS.
Assisted with the proposed graph features, we could use simple interpretable DT models to achieve a high degree of accuracy and fidelity on program classification and malware detection tasks. We evaluate the efficacy of these graph features in allowing DT models to match the predictions of more powerful GNN models across multiple system provenance datasets in program classification and malware detection tasks. With extensive case-studies against real-world malware samples, we confirmed that ProvExplainer can assist end users in evaluating opaque black-box models to identify important structural patterns in terms of interpretable graph features. While there is still significant remaining work to bring problem-space explanations to graph models in general, we believe that ProvExplainer is a strong step towards transparency in provenance-based IDS.
References
- [1] Ankur Saini and Hossein Jazi “North Korea’s Lazarus APT leverages Windows Update client, GitHub in latest campaign” (Accessed on 11/09/2021), https://shorturl.at/nzDF9, 2022
- [2] DENIS LEGEZO “WildPressure targets industrial-related entities in the Middle East” (Accessed on 11/09/2021), https://shorturl.at/iuvMV, 2022
- [3] David E Sanger “U.S. Said to Find North Korea Ordered Cyberattack on Sony” (Accessed on 11/09/2021) In The New York Times, 2021
- [4] George E Dahl, Jack W Stokes, Li Deng and Dong Yu “Large-scale malware classification using random projections and neural networks” In 2013 IEEE International Conference on Acoustics, Speech and Signal Processing, 2013, pp. 3422–3426 IEEE
- [5] Daniel Arp et al. “Drebin: Effective and explainable detection of android malware in your pocket.” In Ndss 14, 2014, pp. 23–26
- [6] Ekta Gandotra, Divya Bansal and Sanjeev Sofat “Malware analysis and classification: A survey” In Journal of Information Security 2014 Scientific Research Publishing, 2014
- [7] Joshua Saxe and Konstantin Berlin “Deep neural network based malware detection using two dimensional binary program features” In 2015 10th international conference on malicious and unwanted software (MALWARE), 2015, pp. 11–20 IEEE
- [8] Kathrin Grosse et al. “Adversarial perturbations against deep neural networks for malware classification” In arXiv preprint arXiv:1606.04435, 2016
- [9] Barath Narayanan Narayanan, Ouboti Djaneye-Boundjou and Temesguen M Kebede “Performance analysis of machine learning and pattern recognition algorithms for malware classification” In 2016 IEEE National Aerospace and Electronics Conference (NAECON) and Ohio Innovation Summit (OIS), 2016, pp. 338–342 IEEE
- [10] Bojan Kolosnjaji, Apostolis Zarras, George Webster and Claudia Eckert “Deep learning for classification of malware system call sequences” In Australasian joint conference on artificial intelligence, 2016, pp. 137–149 Springer
- [11] Ahmad Javaid, Quamar Niyaz, Weiqing Sun and Mansoor Alam “A deep learning approach for network intrusion detection system” In Proceedings of the 9th EAI International Conference on Bio-inspired Information and Communications Technologies (formerly BIONETICS), 2016, pp. 21–26
- [12] Tuan A Tang et al. “Deep learning approach for network intrusion detection in software defined networking” In 2016 international conference on wireless networks and mobile communications (WINCOM), 2016, pp. 258–263 IEEE
- [13] Sadegh Momeni Milajerdi et al. “HOLMES - Real-Time APT Detection through Correlation of Suspicious Information Flows.” In IEEE Symposium on Security and Privacy (SP), IEEE Symposium on Security and Privacy (SP), 2019
- [14] Qi Wang et al. “You Are What You Do: Hunting Stealthy Malware via Data Provenance Analysis” In Network and Distributed System Security Symposium (NDSS), Network and Distributed System Security Symposium (NDSS), 2020
- [15] Xueyuan Han et al. “UNICORN: Runtime Provenance-Based Detector for Advanced Persistent Threats”, Network and Distributed System Security Symposium (NDSS), 2020
- [16] Md Nahid Hossain, Sanaz Sheikhi and R. Sekar “Combating Dependence Explosion in Forensic Analysis Using Alternative Tag Propagation Semantics” In IEEE Symposium on Security and Privacy (SP) 00, IEEE Symposium on Security and Privacy (SP), 2020, pp. 1139–1155
- [17] Xueyuan Han et al. “SIGL: Securing Software Installations Through Deep Graph Learning” In USENIX Security Symposium (SEC), USENIX Security Symposium (SEC) USENIX Association, 2021, pp. 2345–2362
- [18] Thomas N Kipf and Max Welling “Semi-supervised classification with graph convolutional networks” In arXiv preprint arXiv:1609.02907, 2016
- [19] Petar Veličković et al. “Graph attention networks” In arXiv preprint arXiv:1710.10903, 2017
- [20] Jiaqi Yan, Guanhua Yan and Dong Jin “Classifying malware represented as control flow graphs using deep graph convolutional neural network” In 2019 49th annual IEEE/IFIP international conference on dependable systems and networks (DSN), 2019, pp. 52–63 IEEE
- [21] Hisham Alasmary et al. “Soteria: Detecting adversarial examples in control flow graph-based malware classifiers” In 2020 IEEE 40th International Conference on Distributed Computing Systems (ICDCS), 2020, pp. 888–898 IEEE
- [22] Zikai Zhang et al. “Spectral-based directed graph network for malware detection” In IEEE Transactions on Network Science and Engineering 8.2 IEEE, 2020, pp. 957–970
- [23] Ahmed Abusnaina et al. “Dl-fhmc: Deep learning-based fine-grained hierarchical learning approach for robust malware classification” In IEEE Transactions on Dependable and Secure Computing IEEE, 2021
- [24] Stephen Ranshous et al. “Anomaly detection in dynamic networks: a survey” In Wiley Interdisciplinary Reviews: Computational Statistics 7.3 Wiley Online Library, 2015, pp. 223–247
- [25] Kaize Ding, Jundong Li, Rohit Bhanushali and Huan Liu “Deep anomaly detection on attributed networks” In Proceedings of the 2019 SIAM International Conference on Data Mining, 2019, pp. 594–602 SIAM
- [26] Li Zheng et al. “AddGraph: Anomaly Detection in Dynamic Graph Using Attention-based Temporal GCN.” In IJCAI, 2019, pp. 4419–4425
- [27] Ailin Deng and Bryan Hooi “Graph neural network-based anomaly detection in multivariate time series” In Proceedings of the AAAI Conference on Artificial Intelligence 35.5, 2021, pp. 4027–4035
- [28] Vendor “Endpoint Detection and Response (EDR) Solutions Reviews 2022 | Gartner Peer Insights” (Accessed on 05/01/2022), https://www.gartner.com/reviews/market/endpoint-detection-and-response-solutions, 2022
- [29] Palo Alto Team “What is XDR? - Palo Alto Networks” (Accessed on 05/01/2022), https://www.paloaltonetworks.com/cyberpedia/what-is-xdr, 2022
- [30] Wajih Ul Hassan et al. “NoDoze: Combatting Threat Alert Fatigue with Automated Provenance Triage.” In Network and Distributed System Security Symposium (NDSS), Network and Distributed System Security Symposium (NDSS), 2019
- [31] Zachary C Lipton “The mythos of model interpretability: In machine learning, the concept of interpretability is both important and slippery.” In Queue 16.3 ACM New York, NY, USA, 2018, pp. 31–57
- [32] Aditya K. Sood and Sherali Zeadally “Drive-By Download Attacks: A Comparative Study” In IT Professional 18.5, 2016, pp. 18–25 DOI: 10.1109/MITP.2016.85
- [33] “What Is a Drive-by Download Malware Attack?” (Accessed on 02/07/2023), https://www.makeuseof.com/what-is-a-drive-by-download/
- [34] The MITRE Corporation “Structured Threat Information eXpression (STIX™) 1.x Archive Website” URL: https://stixproject.github.io/
- [35] “YARA - The pattern matching swiss knife for malware researchers” (Accessed on 02/07/2023), https://virustotal.github.io/yara/
- [36] Zhitao Ying et al. “Gnnexplainer: Generating explanations for graph neural networks” In Advances in neural information processing systems 32, 2019
- [37] Dongsheng Luo et al. “Parameterized explainer for graph neural network” In Advances in neural information processing systems 33, 2020, pp. 19620–19631
- [38] Hao Yuan et al. “On explainability of graph neural networks via subgraph explorations” In International Conference on Machine Learning, 2021, pp. 12241–12252 PMLR
- [39] Jerome Dinal Herath, Priti Prabhakar Wakodikar, Ping Yang and Guanhua Yan “CFGExplainer: Explaining Graph Neural Network-Based Malware Classification from Control Flow Graphs” In 2022 52nd Annual IEEE/IFIP International Conference on Dependable Systems and Networks (DSN), 2022, pp. 172–184 IEEE
- [40] Frederick Barr-Smith et al. “Survivalism: Systematic Analysis of Windows Malware Living-Off-The-Land” In IEEE Symposium on Security and Privacy (SP) 00, IEEE Symposium on Security and Privacy (SP), 2021, pp. 1557–1574
- [41] Yushan Liu et al. “Towards a Timely Causality Analysis for Enterprise Security” In Network and Distributed System Security Symposium (NDSS), Network and Distributed System Security Symposium (NDSS), 2018
- [42] Samuel T King and Peter M Chen “Backtracking intrusions”, USENIX Symposium on Operating Systems Design and Implementation (OSDI), 2003 DOI: 10.1145/945445.945467
- [43] Manos Antonakakis et al. “From throw-away traffic to bots: detecting the rise of DGA-based malware” In 21st USENIX Security Symposium (USENIX Security 12), 2012, pp. 491–506
- [44] Karel Bartos, Michal Sofka and Vojtech Franc “Optimized invariant representation of network traffic for detecting unseen malware variants” In 25th USENIX Security Symposium (USENIX Security 16), 2016, pp. 807–822
- [45] Yonatan Striem Amit and Elan Pavlov “Method and apparatus for classifying and combining computer attack information” US Patent 9,413,773 Google Patents, 2016
- [46] Yonatan Striem Amit “Method and apparatus for computer intrusion detection” US Patent 9,679,131 Google Patents, 2017
- [47] Md Amran Siddiqui et al. “Detecting Cyberattack Entities from Audit Data via Multi-View Anomaly Detection with Feedback”, 2018
- [48] CrowdStrkie “ENDPOINT DETECTION AND RESPONSE (EDR)”, 2020
- [49] Thomas N. Kipf and Max Welling “Variational Graph Auto-Encoders”, 2016 arXiv:1611.07308 [stat.ML]
- [50] Shirui Pan et al. “Adversarially Regularized Graph Autoencoder for Graph Embedding”, 2019 arXiv:1802.04407 [cs.LG]
- [51] Hao Yuan, Haiyang Yu, Shurui Gui and Shuiwang Ji “Explainability in graph neural networks: A taxonomic survey” In IEEE Transactions on Pattern Analysis and Machine Intelligence IEEE, 2022
- [52] Scott M Lundberg and Su-In Lee “A unified approach to interpreting model predictions” In Advances in neural information processing systems 30, 2017
- [53] Rich Caruana et al. “Intelligible models for healthcare: Predicting pneumonia risk and hospital 30-day readmission” In Proceedings of the 21th ACM SIGKDD international conference on knowledge discovery and data mining, 2015, pp. 1721–1730
- [54] Yaochen Xie et al. “Task-Agnostic Graph Explanations” In arXiv preprint arXiv:2202.08335, 2022
- [55] Hao Yuan, Jiliang Tang, Xia Hu and Shuiwang Ji “Xgnn: Towards model-level explanations of graph neural networks” In Proceedings of the 26th ACM SIGKDD International Conference on Knowledge Discovery & Data Mining, 2020, pp. 430–438
- [56] Wenbo Guo et al. “LEMNA: Explaining Deep Learning Based Security Applications” In ACM conference on Computer and Communications Security (CCS), ACM conference on Computer and Communications Security (CCS) New York, NY, USA: Association for Computing Machinery, 2018, pp. 364–379 DOI: 10.1145/3243734.3243792
- [57] Arthur S Jacobs et al. “AI/ML for Network Security: The Emperor has no Clothes” In ACM Conference on Computer and Communications Security (CCS), ACM Conference on Computer and Communications Security (CCS), 2022, pp. 1537–1551
- [58] Mark Craven and Jude Shavlik “Extracting tree-structured representations of trained networks” In Advances in neural information processing systems 8, 1995
- [59] Osbert Bastani, Carolyn Kim and Hamsa Bastani “Interpreting blackbox models via model extraction” In arXiv preprint arXiv:1705.08504, 2017
- [60] Zili Meng et al. “Interpreting deep learning-based networking systems” In Proceedings of the Annual conference of the ACM Special Interest Group on Data Communication on the applications, technologies, architectures, and protocols for computer communication, 2020, pp. 154–171
- [61] Mohammed J Zaki, Wagner Meira Jr and Wagner Meira “Data mining and analysis: fundamental concepts and algorithms” Cambridge University Press, 2014
- [62] Konstantinos P Grammatikakis et al. “Understanding and mitigating banking trojans: From zeus to emotet” In IEEE International Conference on Cyber Security and Resilience (CSR), 2021, pp. 121–128 Institute of ElectricalElectronics Engineers (IEEE)
- [63] Alexander Küchler et al. “Does Every Second Count? Time-based Evolution of Malware Behavior in Sandboxes”, Network and Distributed System Security Symposium (NDSS) Internet Society, 2021 DOI: 10.14722/ndss.2021.24475
- [64] Erin Avllazagaj et al. “When malware changed its mind: An empirical study of variable program behaviors in the real world” Copyright Usenix. Personal use of this material is permitted. The definitive version of this paper was published in USENIX 2021, 30th USENIX Security Symposium, 11-13 August 2021, Virtual Conference and is available at : In USENIX Security Symposium (SEC), USENIX Security Symposium (SEC) USENIX Association, 2021
- [65] “The MyDoom worm: history, technical details, and defense” (Accessed on 02/01/2023), https://nordvpn.com/blog/mydoom-virus/
- [66] “VB2015 paper: It’s A File Infector… It’s Ransomware… It’s Virlock” (Accessed on 02/01/2023), https://www.virusbulletin.com/virusbulletin/2016/12/vb2015-paper-its-file-infector-its-ransomware-its-virlock/
- [67] “Trojan:Win32/Scar.C” (Accessed on 02/01/2023), https://www.microsoft.com/en-us/wdsi/threats/malware-encyclopedia-description?Name=Trojan:Win32/Scar.C
- [68] Akul Goyal, Xueyuan Han, Gang Wang and Adam Bates “Sometimes, You Aren’t What You Do: Mimicry Attacks against Provenance Graph Host Intrusion Detection Systems” In 30th ISOC Network and Distributed System Security Symposium (NDSS’23), 2023
- [69] Kunal Mukherjee et al. “Evading Provenance-Based ML Detectors with Adversarial System Actions” In USENIX Security Symposium (SEC), 2023
- [70] “Cuckoo Community - Repository of modules and signatures contributed by the community)”, https://github.com/microsoft/CodeBERT
- [71] “VirusTotal” (Accessed on 07/25/2022), https://developers.virustotal.com/
dropper7579103 \keyaliasdropper2WhatIsaD3:online \keyaliasgatvelivckovic2017graph \keyaliasgrammatikakis2021understandinggrammatikakis2021csr \keyaliasguo2018lemnalemna2018ccs \keyaliasjacobs2022aitrustee2022ccs \keyaliaskuchler2021doeskuchler2021ndss \keyaliasnodozehassan2019ndss \keyaliasprovdetectorwang2020ndss \keyaliasvirustotalVirusTot47:online \keyaliasyaraYARAThep44:online
Appendix A Appendix
A.1 Data collection pipeline
Our data collection module can operate on both Linux and Windows systems to accommodate most industrial servers. The system-level data is stored in a PostgresSQL database using the Windows ETW and Linux auditd frameworks to collect relevant system calls regarding files, processes and network sockets. These include system calls for (1) file operations (e.g., read(), write(), unlink()), (3) network socket operations (e.g., connect(), accept()), (3) process operations (e.g., create(), exec(), and exit()).
A.2 Dataset Statistics
| Program | Categories | Description |
| svchost.exe | wlidsvc | Microsoft Account Sign-in Assistant which enables user to sign-in through Microsoft account identity services. |
| WaaSMedicSvc | Windows Update Medic Service fixes any damages suffered by the Windows Update component. | |
| wuauserv | Windows Update Service enables the detection, download, and installation of updates for Windows. | |
| ClipSVC | Client License Service provides infrastructure support for the Microsoft Store. | |
| BITS | Background Intelligent Transfer Service downloads files from or uploads files to HTTP web servers and SMB file shares. | |
| rundll32.exe | DispatchAPICall | Call an API function within a DLL file mainly used for executing system commands. |
| ShellRefresh | Refresh the Windows Universal App Package cache to resolve issues related to the installation, update, or removal of Universal Windows Platform (UWP) apps. | |
| StateRepositoryDoMaintenanceTasks | Perform maintenance tasks on the Windows state repository to resolve issues related to the state repository. | |
| PcaPatchSdbTask | Performing patching or updating system software or drivers. | |
| python | cerbot | Program is a ssl certificate management/update utility program. |
| update-apt-xapian-index | System programs that rebuild the indexes index to sorts of extra information, such as Debtags tags, and package ratings. | |
| unattended-upgrade | System program that updates the linux distribution without user interface | |
| decompyle3 | Custom python decompilation program that recovers the source code of python programs from their compiled bytecode instructions. | |
| cuckoo | Sandbox utility that lets the user run programs inside a sandbox and capture the system level interactions. |
| Program | Categories | Avg Nodes / Edges | Graphs |
| Windows | |||
| svchost.exe | wlidsvc | 14.6/ 16.3 | 3404 |
| WaasMedicSVC | 29.5/ 30.4 | 3810 | |
| wuauserv | 18.4/ 20.7 | 2814 | |
| ClipSVC | 19.6/ 21.4 | 2584 | |
| BITS | 25.3/ 24.3 | 2386 | |
| rundll32.exe | DispatchAPICall | 56.7/ 61.2 | 952 |
| ShellRefresh | 63.3/ 66.3 | 736 | |
| StateRepositoryDoMaintenanceTasks | 33.2/ 31.2 | 693 | |
| SusRuPcaPatchSdbTasknTask | 35.7/ 33.8 | 675 | |
| Linux | |||
| python | certbot | 68.4/ 69.2 | 3397 |
| update-apt-xapian-index | 53.7/ 55.3 | 4037 | |
| unattended-upgrade | 43.4/ 51.2 | 4631 | |
| decompyle3 | 80.4/ 88.7 | 4644 | |
| cuckoo | 96.6/ 98.4 | 3797 | |
| Average | 45.6 / 47.7 | 2754.3 | |
With the approval and oversight of our university’s Institutional Review Board (IRB), we solicited written informed consent from volunteers to participate in a long running provenance data collection project. Using Linux kernel audits and Windows ETW event tracing, we collected provenance data involving file, process, and network events. Our volunteers performed a variety of workloads as students, researchers, developers, and administrators. In aggregate, our volunteers have helped us collect system event data from 54 Windows hosts and 32 Linux hosts over 13 months, yielding 17TB of system event data for our benign dataset. The provenance graphs for classification generated from the benign system programs contained 45.63 vertices, 47.74 edges and 2754.3 graphs on average (Table 5).
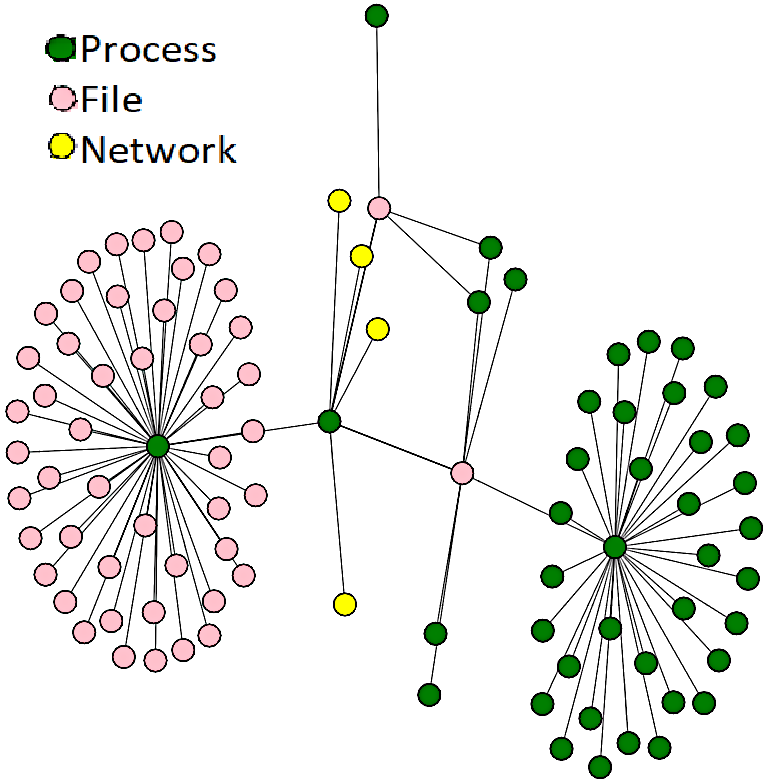
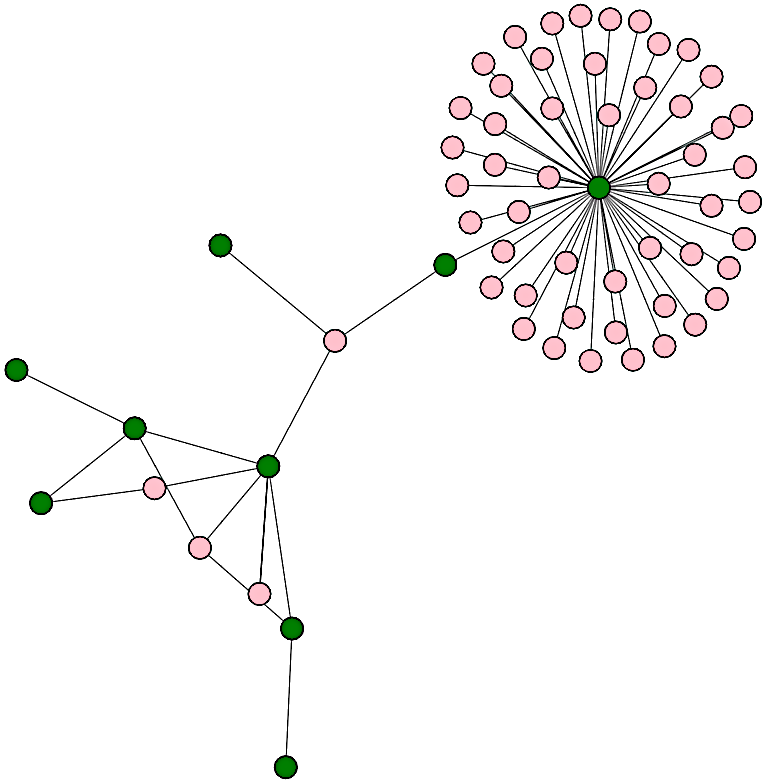
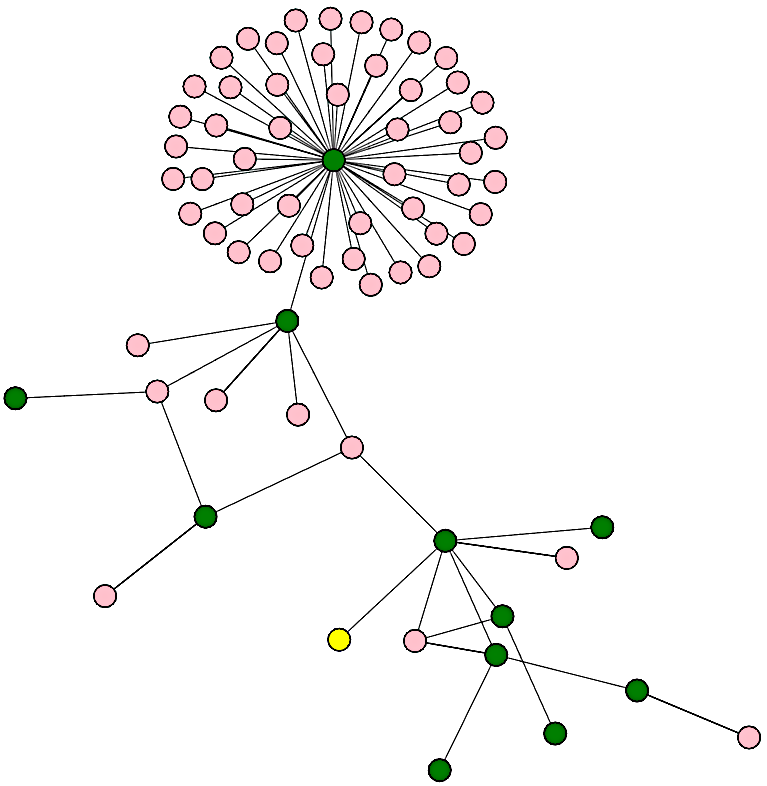
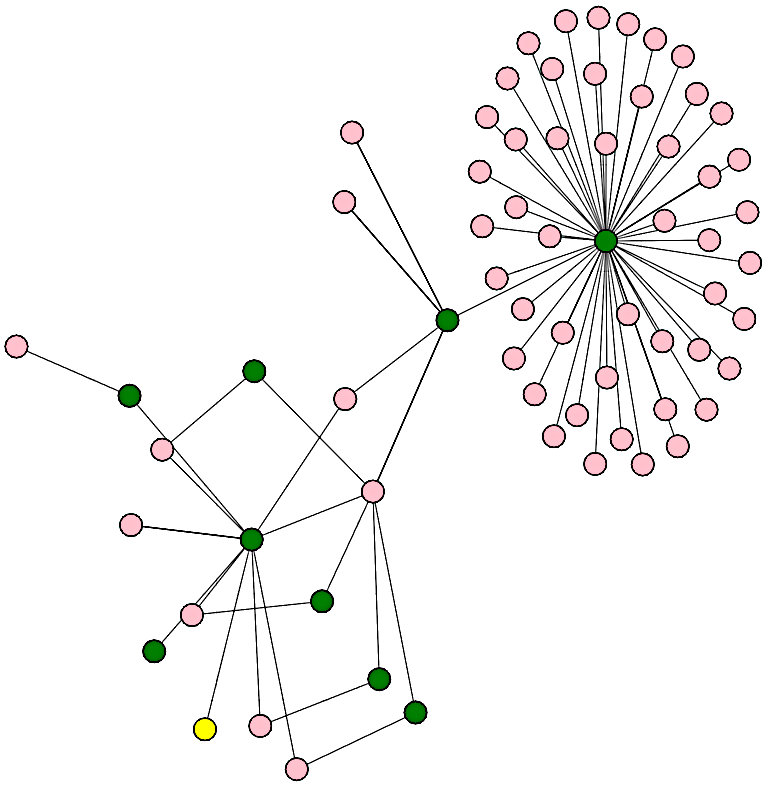
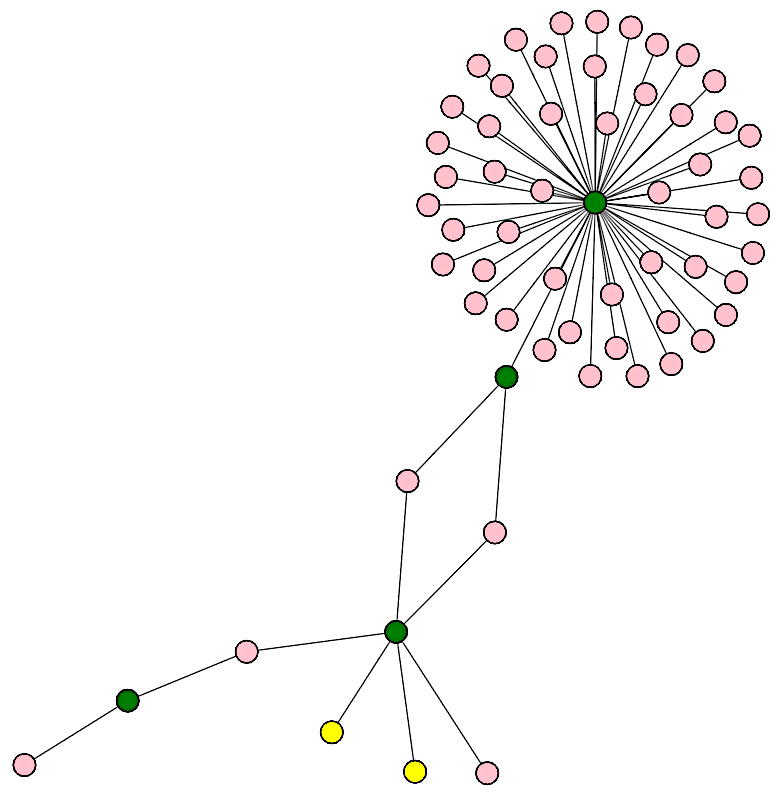
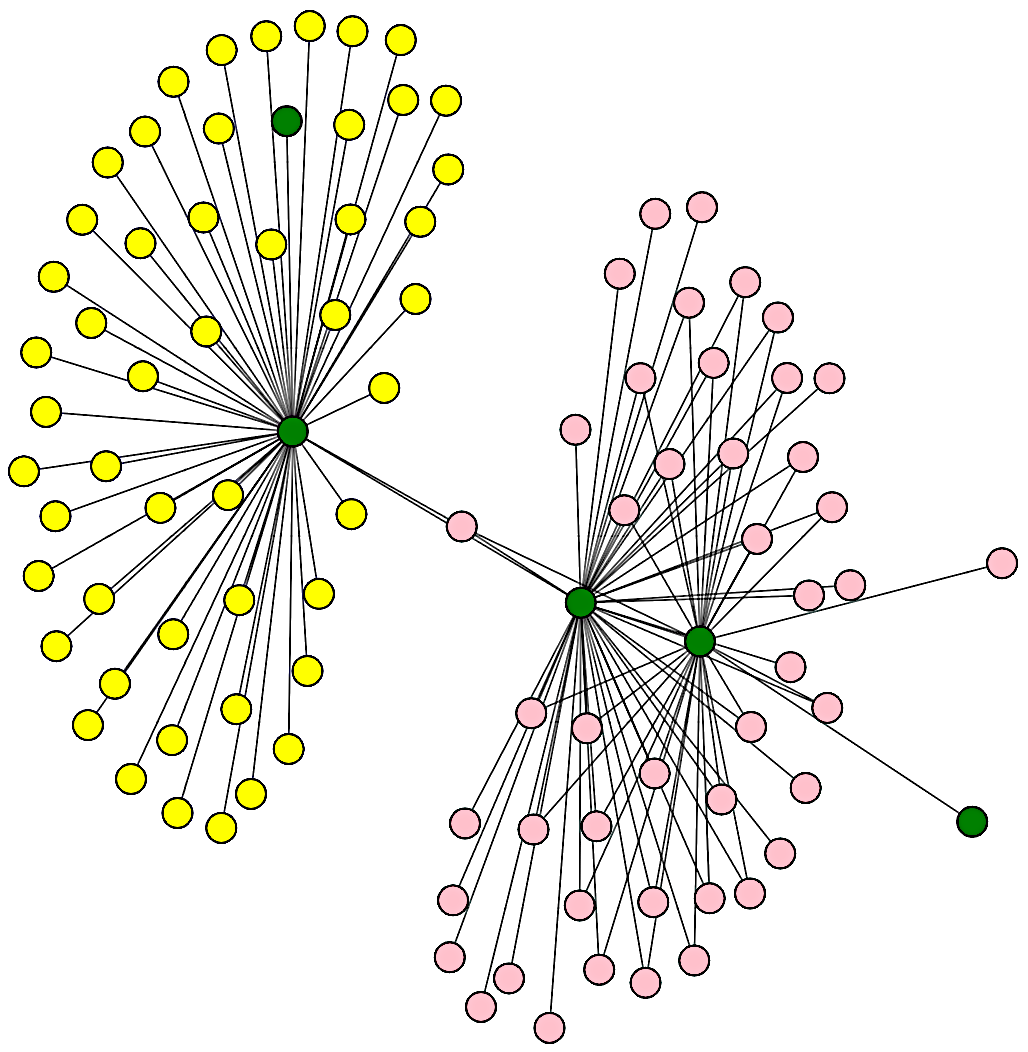
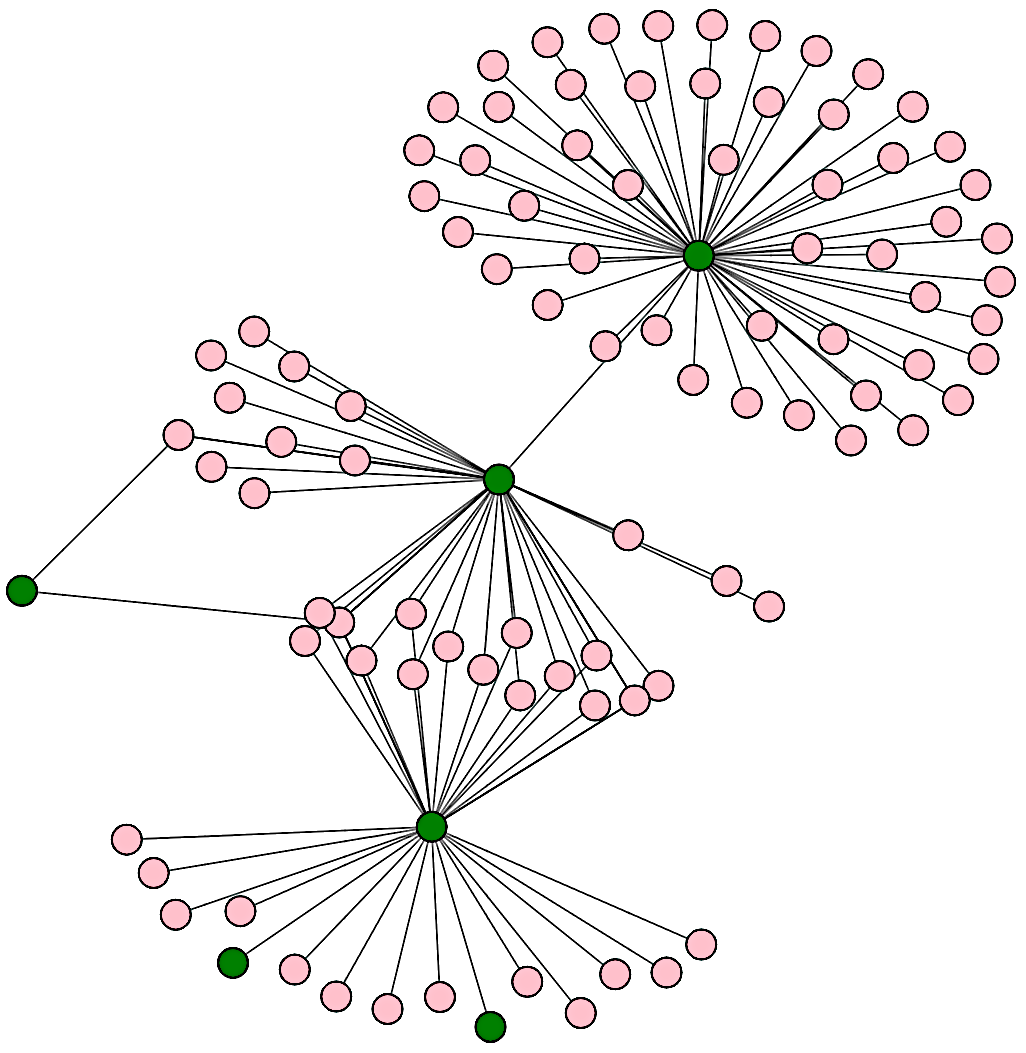
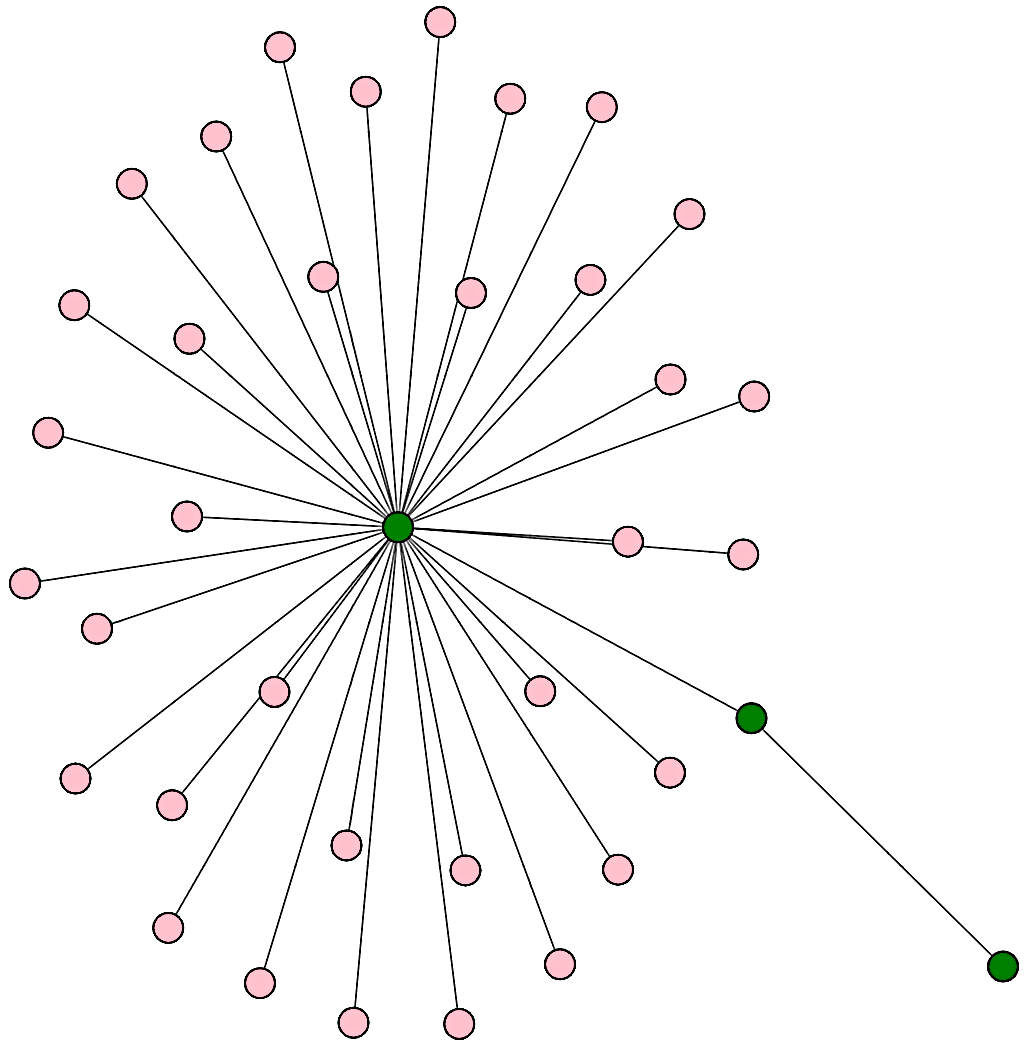
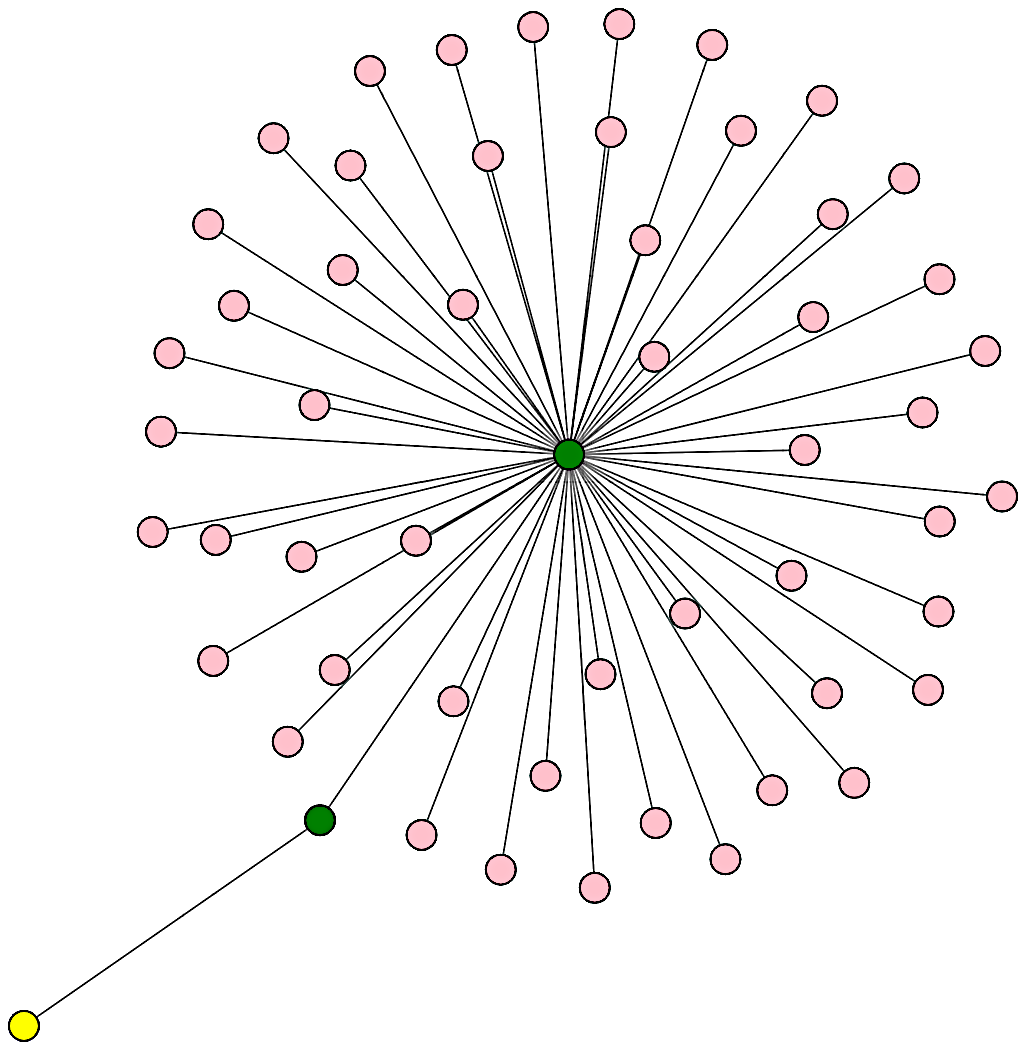
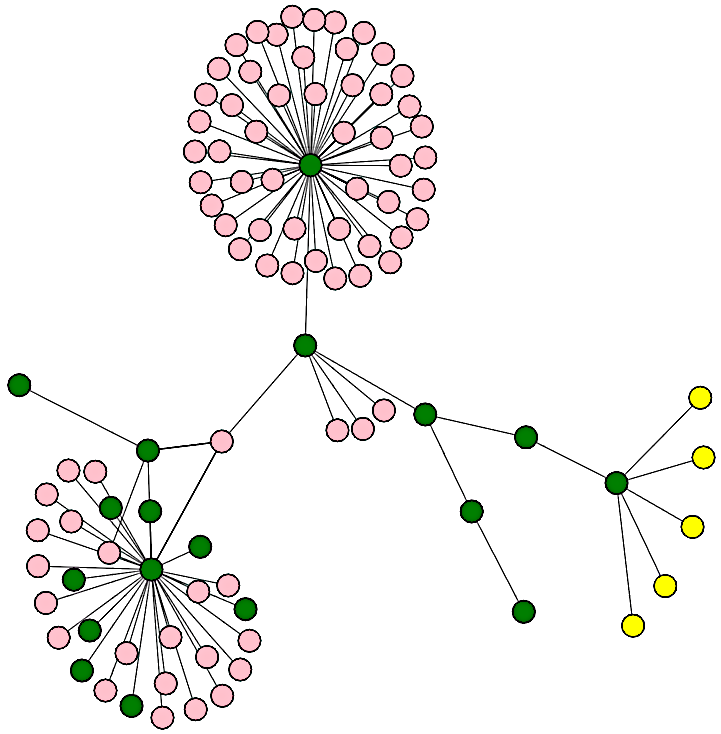
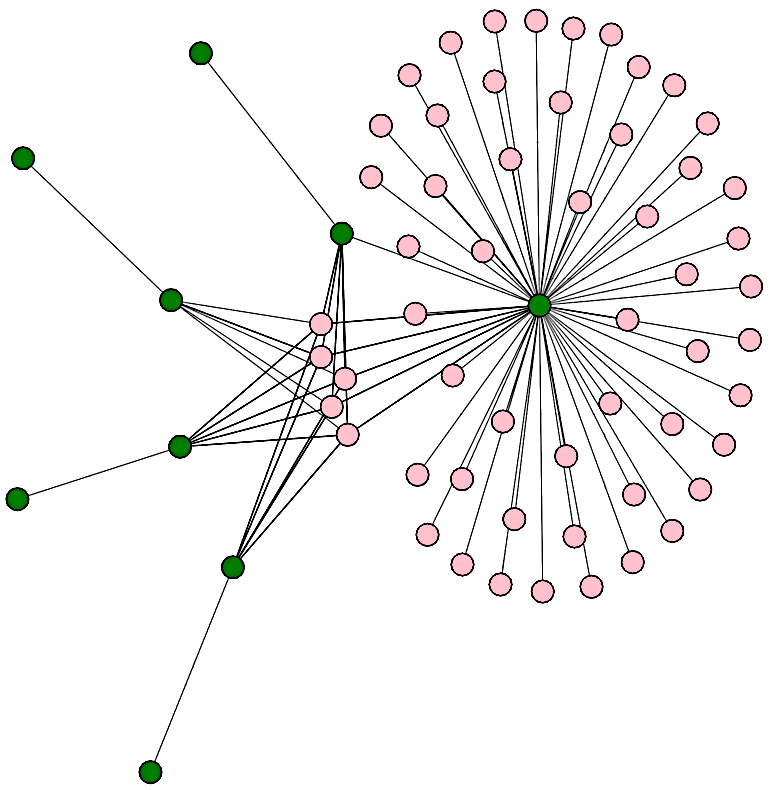
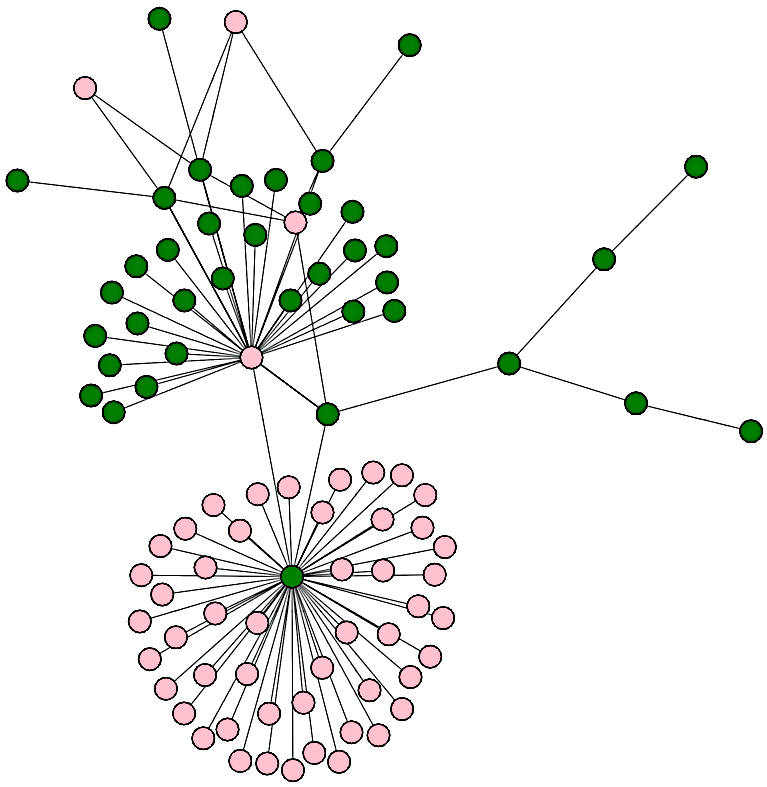
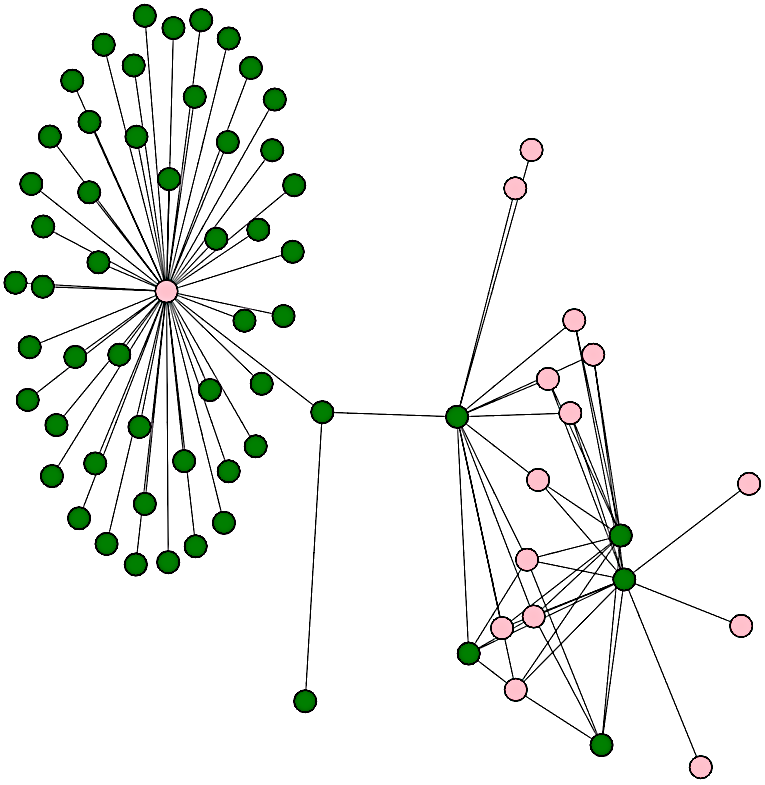
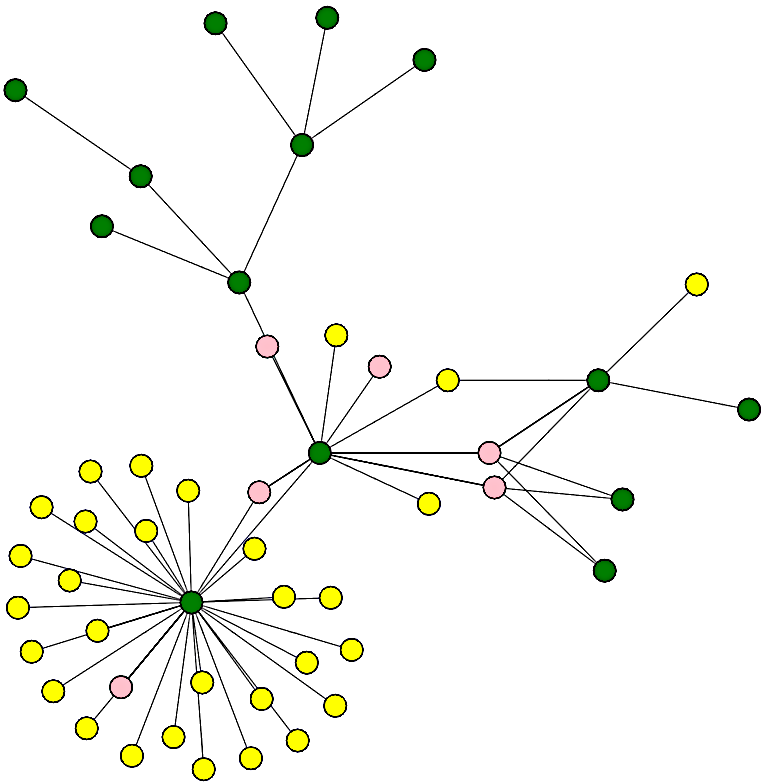
python. We chose python as the linux program to do our classification evaluation, since python is an interpreted language and the behavior of python depends on the arguments that are supplied to the program. We chose five different classes of python programs as shown in Figure 4: certbot 4(j), apt-xapian-index 4(k), unattended-upgrade 4(l), decompyle3 4(m) and cuckoo 4(n). certbot is a ssl certificate management/update utility program, apt-xapian-index and unattended-upgrade are system programs that rebuild the indexes and updates the linux distribution without user interface, respectively. cuckoo [70] is a sandbox utility that lets the user run programs inside a sandbox and capture the system level interactions.
From the program description is clear each type of program has distinctive behavior. certbot and cuckoo will have several outgoing network connections, but certbot’s outbound network connection will have higher number of connection to external ips as compared to cuckoos. apt-xapian-index and unattended-upgrade, even though they are system utilities, behave differently in the sense that unattended-upgrade reads from many shared files such as .lock files and writes to specific .log files, but apt-xapian-index reads a lot of shared .so and .DB files; apt-xapian-index also creates children who read from the same file .DB files, so there is information transfer.
svchost.exe. One of the most prominent system program misused by malwares mentioned in [40] is svchost.exe. In Table 6, we can see that svchost.exe contains the largest number of anomaly graphs. Therefore, we decided to focus on svchost.exe, as shown in Figure 4 in our Windows classification tasks. A typical svchost.exe is svhost.exe -k netsvcs -p -s wlidsvc. Like python, svchost works like an interpretable language where it looks at the -s flag to execute the requested service. We chose five services that are found to be prevalent in our event database: wlidsvc 4(a), WaaSMedicSvc 4(b), wuauserv 4(c), ClipSVC 4(d) and BITS 4(e). wlidsvc or Microsoft Account Sign-in Assistant which enables user to sign-in through Microsoft account identity services. WaaSMedicSvc or Windows Update Medic Service fixes any damages suffered by the Windows Update component. wuauserv or Windows Update Service enables the detection, download, and installation of updates for Windows. ClipSVC or Client License Service provides infrastructure support for the Microsoft Store. Finally, BITS or Background Intelligent Transfer Service downloads files from or uploads files to HTTP web servers and SMB file shares.
Using the program description, it is clear that BITS and wuauserv both will have lot of network interactions and the socket closeness centrality and betweenness centrality will be non-zero, but since the svchost.exe graphs are smaller than those of python, the values of the centrality measures may not be directly comparable. WaaSMedicSvc and ClipSVC both read many .dll and .mui files and usually write to a .log file. Therefore, the information flows from parent process to child process using files, which will increase the file betweenness centrality and process closeness centrality. wlidsvc graphs are small as the task itself is very simple: read shared .dll files and write to .etl, .log and .db.wal files. wlidsvc creates a process chain where multiple process in the chain write to different files, so write edges are more prominent than in ClipSVC, but its behavior of writing to files is similar to WaaSMediSvc and wuauserv. The kind of similar behavior is the reason why the performance of classifying the svchost.exe data decreases significantly as compared to python. However, as we will see in the evaluation, ProvExplainer is still a useful tool for explaining GNN predictions and identifying potential shortcut learning.
rundll32.exe. Rundll32.exe is a vital component of the Windows operating system that is responsible for executing Dynamic Link Library (DLL) files. The main function of rundll32.exe is to dispatch API calls (e.g., DispatchAPICall 4(f)), which allows it to run commands within a DLL file. This enables it to execute system commands and perform a variety of tasks, including the execution of system processes and maintenance activities.
Another key tasks performed by rundll32.exe is the refresh (e.g., ShellRefresh 4(g)) of the Windows Universal App Package cache. This is done to resolve any issues related to the installation, update, or removal of Universal Windows Platform (UWP) apps. It is responsible for updating the cache and ensuring that all UWP apps are functioning correctly. This helps to maintain the stability of the operating system and resolve any issues related to app installation, updates, or removal. It also performs maintenance (e.g., StateRepositoryDoMaintenanceTasks 4(h)) tasks on the Windows state repository. The state repository is a critical component of the operating system that stores information about the state of various system components. Rundll32.exe is responsible for performing maintenance tasks on the state repository to resolve any issues related to its functioning. Additionally, rundll32.exe can also be used to perform patching (e.g., PcaPatchSdbTask 4(i)) or updating of system software or drivers, ensuring that the system is up-to-date and functioning optimally.
Rundll32.exe can also be used by malware to execute malicious code on a victim’s machine. Malware authors can create malicious DLL files and use the rundll32.exe process to execute them, thereby bypassing security measures and compromising the system. Attackers create a malicious file with the same name as the legitimate rundll32.exe process in an attempt to deceive users and evade detection.
The different graph behavioral patterns seen within the different categories: DispatchAPICall is used to call an API function within a DLL file, so it will interact with the specified DLL file and other related DLL files that are required to execute the API function. So, we expect to see process multiple reading multiple files and it is used for Windows Universal App updates, so network connection using standard network protocols, such as the Server Message Block (SMB) protocol or the Remote Procedure Call (RPC) protocol is created. ShellRefresh is used to refresh the Windows Universal App Package cache, so it will interact with all the cache files and any related system resources, such as the file system or registry. Since it is a cache file update, there will be a process chain where each process in the chains will be doing multiple file read operations.
StateRepositoryDoMaintenanceTasks is used to perform maintenance tasks on the Windows state repository, so it will interact with the state repository but since it is doing maintenance it will connect to the external socket to get patches or send diagnostic infirmation. PcaPatchSdbTask is used to perform patching or updating of system software or drivers, so it will interact with the relevant drivers and file system. It may also establish network connections to download updates or retrieve information from a server.
Fileless malware
| Applications | Avg Benign Nodes / Edges | Avg Anomaly Nodes / Edges | # of Benign Graphs | # of Anomaly Graphs |
| explorer.exe | 37.1/ 37.7 | 145.4/ 166.3 | 1057 | 673 |
| netsh.exe | 34.2/ 44.1 | 117.9/ 122.5 | 1023 | 537 |
| nslookup.exe | 42.8/ 50.3 | 100.8/ 126.1 | 879 | 281 |
| python.exe | 26.2/ 32.3 | 168.4/ 227.4 | 3621 | 822 |
| rundll32.exe | 39.6/ 46.5 | 145.5/ 144.9 | 2462 | 821 |
| schtasks.exe | 14.3/ 19.7 | 134.9/ 223.0 | 1429 | 329 |
| svchost.exe | 5.62/ 4.76 | 176.4/ 220.6 | 1147 | 734 |
| Average | 28.5 / 33.6 | 141.3 / 175.8 | 1659.7 | 599.6 |
| Malware name | Impersonation target | Description |
| blackmoon (§ 7.1) | svchost.exe | Banking trojan that has multi-phase downloader framework to stealthily browse and extract user files. Emotet [grammatikakis2021understanding] and Zeus [grammatikakis2021understanding] are similar notable trojans. |
| ulise (§ 7.2) | nslookup.exe | DDoS malware that is capable of opening a stealthy backdoor and monitor system activity. |
| mydoom (§ 7.2) | rundll32.exe | Computer worm affecting Windows devices by replicating itself and sends itself via email. Mydoom was designed to carry out a distributed denial-of-service (DDoS) attack against a particular company. |
| virlock (§ 7.3) | explorer.exe | Ransomware installer attempts to lock users out of their device while infecting other files on the system. |
| scar (§ 7.3) | svchost.exe | Malware installer [67] that drops malware with the purpose of modifying the local HOSTS file to redirect browsing of certain websites. |
Fileless malware. The fileless malware dataset used for anomaly detection is seen in Table 7. The fileless malwares were downloaded from [virustotal] and selected from [62, 63, 64, 40]. The provenance graphs for anomaly detection generated contained 84.9 vertices, 104.7 edges and 1129.6 graphs on average (Table 6).
The malwares in Table 7 can be broadly classified into different attack categories: banking trojans, DDoS trojans, and malware installer. Banking trojans such as Zeus [grammatikakis2021understanding], emotet [grammatikakis2021understanding] and Blackmoon [kuchler2021does] are used to steal banking credentials. They spread through spam and compromised download links. To camouflage their interactions with .dlls and writes and read from temporary files, they masquerade as svchost.exe.
Distributed-Denial-of-service Ulisse [kuchler2021does] and MyDoom [65] is a multi-purpose trojan whose primary focus is to conduct campaign against a victim server’s local network or another target server using the infected server. It can establish remote access connections, capture keyboard input, collect system information, download/upload files, drop other malware into the infected system. Because it usually interacts with network sockets and has many file activity, Ulisse masquerades as nslookup.exe, and MyDoom masquerades as explorer.exe.