[datatype=bibtex] \map[overwrite] \step[fieldsource=doi, final] \step[fieldset=eprint, null] \step[fieldset=url, null] \DeclareSourcemap \maps[datatype=bibtex,overwrite=true] \map \pernottypeinproceeding \step[fieldsource=Collaboration, final=true] \step[fieldset=usera, origfieldval, final=true]
![[Uncaptioned image]](/html/2305.04759/assets/x1.png)
BELLE2-CONF-2023-004
Search for lepton-flavor-violating decays in 2019-2021 Belle II data
Abstract
We report a search for lepton-flavor-violating decays () at the Belle II experiment, using a sample of electron-positron data produced at the SuperKEKB collider in 2019-2021 and corresponding to an integrated luminosity of 190 fb-1. We use a new untagged selection for events, where the signal is searched for as a neutrinoless final state of a single charged lepton and a meson and the other is not reconstructed in any specific decay mode, in contrast to previous measurements by the BaBar and Belle experiments. We find no evidence for decays and obtain upper limits on the branching fractions at 90% confidence level of 23 and 9.7 for and , respectively.
1 Introduction
In the Standard Model (SM), lepton flavor is only accidentally conserved. The observation of neutrino oscillations not only introduces direct violation of neutrino flavor, but also charged-lepton flavor violation (LFV) through weak interaction charged currents. Decays that involve LFV are predicted to occur at rates close to [1, 2], far beyond the reach of current and future experiments. The observation of LFV decays would therefore provide indisputable evidence of non-SM physics.
Over the past four decades, CLEO II, experiments at the factories, and at the LHC have searched for LFV decays of the tau lepton, . The most stringent upper limits on the branching fractions of several hypothetical tau decays are of the order of 10-8 [3]. Among these are limits on the decays to final states with a lepton, either electron or muon, and a vector meson. In particular, in recent years there has been great interest in (charge-conjugated decays are implied throughout the paper) due to the meson anomalies reported by LHCb [4, 5] and -factory experiments [3, 6, 7]. These measurements hint at potential lepton-flavor-universality violation in and transitions, which might indicate a special role of the third lepton generation, with large enhancements of tau LFV decays. Specifically, leptoquark models that could accommodate both anomalies predict branching fractions for in the range from 10-11 to a few times 10-8 [8, 9], potentially accessible by the Belle II experiment with a data set of several inverse attobarns. The limits previously obtained by the BaBar and Belle experiments, using respectively 451 fb-1 and 854 fb-1 of data, are given in Table 1 [10, 11]. Both experiments relied on the reconstruction of events where one tau decays as and the other tau decays into a final state with a single charged particle (1-prong tagging).
Here, we report on a search for the decays based on an untagged selection, in which, in contrast to the previous searches, only the signal tau decay mode is explicitly reconstructed. Background events are suppressed by a set of requirements on topological and kinematic variables followed by a selection based on a boosted decision tree (BDT) algorithm that also includes kinematic variables and quantities related to the tracks and clusters not associated with the signal tau decays (rest-of-event variables). The signal is searched for in a two-dimensional plane , with where and are respectively the reconstructed energy in the center-of-mass (c.m.) frame and the invariant mass of the signal candidate, and is the collision energy. In cases where no significant signal is observed, upper limits are derived using the CLs method [12, 13].
2 The Belle II detector and Data Set
Belle II [14] is a particle physics experiment operating at the SuperKEKB asymmetric-energy electron-positron collider, located at KEK in Tsukuba, Japan. The energies of the electron and positron beams are respectively 7 GeV and 4 GeV with a boost of the c.m. frame = 0.28 relative to the laboratory frame. The detector is composed of multiple layers of subdetectors arranged in a cylindrical structure with a central barrel and forward and backward endcaps. The axis of the laboratory frame is defined as the symmetry axis of the solenoid, pointing approximately along the incoming electron beam. The innermost component is the vertex detector, consisting of two inner layers of silicon pixels and four outer layers of silicon strips. The second pixel layer is partially installed, covering one sixth of the azimuthal angle. The main tracking subdetector is a large helium-based small-cell drift chamber (CDC) that also provides measurements of ionization-energy losses used for charged-particle identification. Outside the drift chamber, a Cherenkov-light imaging and time-of-propagation detector provides charged-particle identification in the barrel region, complemented in the forward endcap by a proximity-focusing, ring-imaging Cherenkov detector with an aerogel radiator. An electromagnetic calorimeter (ECL) consists of a barrel and two endcap sections made of CsI(Tl) crystals. A uniform 1.5 T magnetic field aligned with the beams is provided by a superconducting solenoid situated outside the calorimeter. Multiple layers of scintillators and resistive-plate chambers, located between the magnetic flux-return iron plates, constitute the and muon identification system (KLM).
The data used in this analysis are collected from electron-positron collisions at a c.m. energy GeV between March 2019 and July 2021 and correspond to an integrated luminosity of 190 fb-1.
In order to define a selection to suppress backgrounds and estimate the signal efficiencies, we use simulated samples. For the study of the signal processes, we use 2 million events for each mode, where one tau decays into the LFV channel and the other into a known final state. In addition, we use simulated background samples consisting of events generated with KKMC [15] in which tau decays are handled by TAUOLA [16] and their radiative corrections by PHOTOS [17]; generated with EvtGen [18]; continuum events generated with KKMC and quarks hadronization simulated with PYTHIA [19]; generated with KKMC and Bhabha-scattering background generated with BABAYAGA.NLO [20, 21]. The total generated luminosity corresponds to 6 ab-1 for tau pairs and continuum samples, 1 ab-1 for the and dimuon final states and 100 fb-1 for Bhabha events.
3 Candidate reconstruction and event selection
This search exploits an online event selection (trigger) mainly relying on information provided by the ECL. Events are required to satisfy a minimal set of requirements on the energy depositions in the ECL (clusters) and their minimum energies. The most relevant is the requirement to have at least three ECL clusters, of which at least one is above 300 MeV. Moreover, events consistent with Bhabha scattering are rejected by a dedicated trigger veto based on the energies and angles of two clusters in the ECL.
The lepton pairs produced in annihilations are back-to-back in the c.m. frame. Their decay products are well separated into two opposite hemispheres, defined by the plane perpendicular to the thrust axis , which is the vector maximizing the quantity
| (1) |
where is the momentum of final state particle , including both charged and neutral particles.
In the offline reconstruction, charged-particle trajectories (tracks) are required to come from the interaction point (IP), with transverse () and longitudinal () projections of the distance of the closest approach respectively less than 1 and 3 cm in absolute value.
Identification of muons relies mostly on charged-particle penetration depth in the KLM for momenta larger than 0.7 GeV/ and on information from the CDC and ECL otherwise. Particle-identification likelihoods are obtained by combining information from the relevant subdetectors. The ratio between the muon likelihood and the sum of the likelihoods of all particle hypotheses is required to exceed 0.99, resulting in 86.9% efficiency for selecting muon candidates with momenta in the range GeV/and within the KLM barrel acceptance. The rate for a pion to be misidentified as a muon is 2.8%.
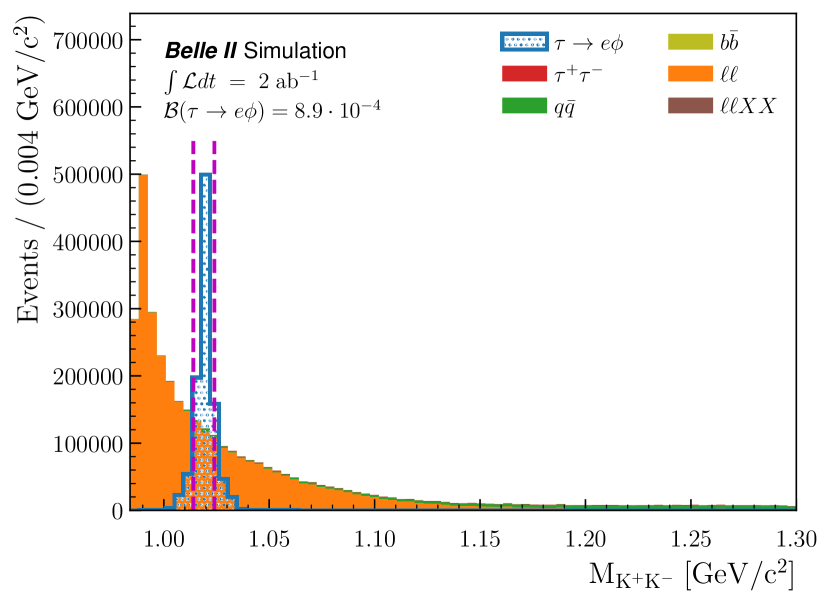
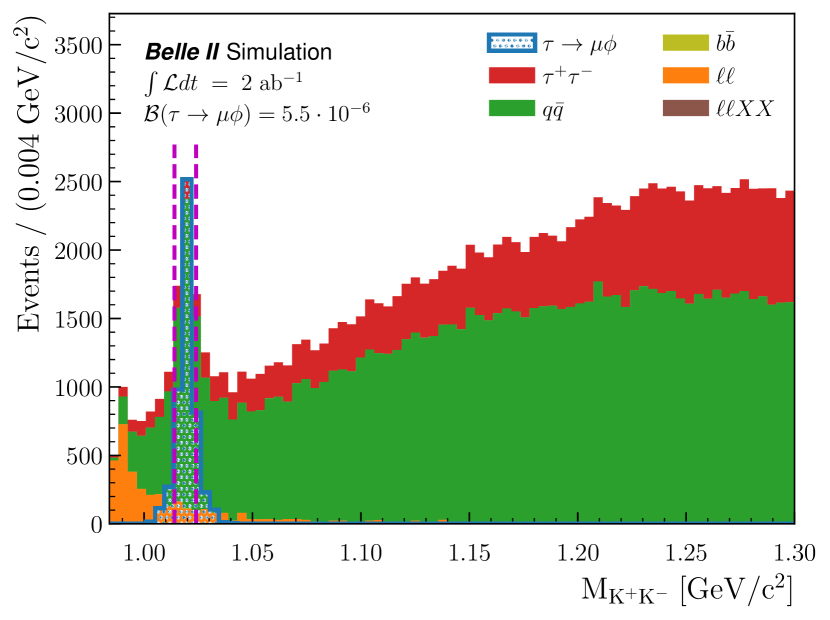
Electrons are primarily identified by comparing momenta measured by tracking with energies of associated ECL depositions. This information and additional measurements characterizing the calorimeter clusters are used as input to a boosted decision tree (BDT) classifier that combines ECL-based measurements with the other subdetectors’ normalized likelihoods. For charged-particle momenta in the range GeV/, the rate for pions to be misidentified as electrons is 0.1% at 90% selection efficiency for electron candidates. Additionally, electrons are corrected for bremsstrahlung losses by summing the four-momenta of any photon found within a 0.15 radian wide cone around the direction of the electron momentum and with a minimum energy of 20 MeV. Kaons are selected as tracks coming from the IP consistent with the kaon mass hypothesis. For the kaon with the highest transverse momentum, we require that the ratio between the kaon likelihood and the sum of the likelihoods of all particle hypotheses is greater than 0.5. A candidate is then reconstructed as a pair of oppositely charged kaons with an invariant mass GeV/. The selected mass region, indicated by the vertical dashed red lines in Figure 1, is optimized by maximizing the Punzi figure of merit [25], configured for a search sensitivity at 3 level (in units of one-sided Gaussian).
The signal candidate is reconstructed as one lepton candidate, either electron or muon, which defines the search channel mode, and one candidate belonging to the same hemisphere. The total number of reconstructed tracks in the event is required to be smaller or equal to six. No attempt is made to explicitly reconstruct the other lepton. Instead we use the inclusive properties of all other particles in the event to suppress backgrounds.
Photons are reconstructed from ECL clusters within the CDC acceptance and not associated with any track. Photons used for reconstruction are required to have an energy deposit of at least 0.1 GeV. Neutral pions are then identified as photon pairs with masses within GeV/. Photons used to reconstruct candidates are not considered for electron bremsstrahlung correction. Photons that satisfy the above conditions, but are not used for bremsstrahlung correction, nor in the reconstruction, and with energies greater than 0.2 GeV are used to define the thrust and the CLEO cones [26]. The latter are variables computed from the momentum flow of the reconstructed particles binned in 10∘ cones around a given axis (e.g. the collision or thrust axis) [27].
All the tracks and clusters that are not used in the signal reconstruction form the rest of the event (ROE), whose kinematic properties are exploited for further background suppression. The following criteria must be satisfied to be retained as part of the ROE: photons are required to have energies of at least 50 MeV and tracks must have a transverse momentum higher than 50 MeV with and .
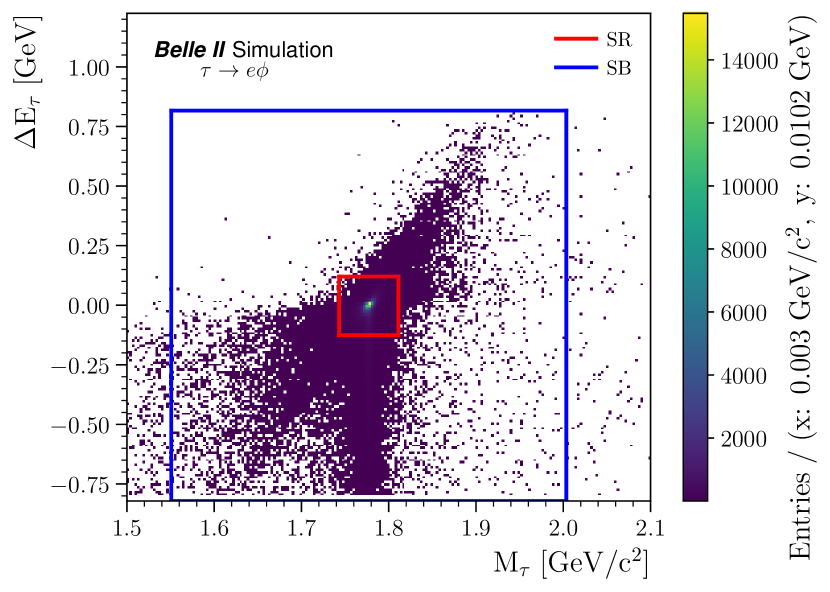
We define rectangular regions in the two-dimensional plane (). The distribution of is expected to peak at zero for correctly reconstructed signal candidates and peaks at the known mass [28]. The rectangular boxes are centered at the signal peak in the () plane, with side lengths equal to multiples of their resolutions . For each variable, is estimated by fitting the sum of a Crystal Ball and two Gaussian functions to the signal distribution, and then taking the weighted average of the three respective widths. Their values are reported in Table 2.
| Mode | Variable | |
A wide rectangular region is used for the selection optimization on simulation, while all reconstructed events outside this box in the (, ) plane are rejected. The and boxes are used as signal regions (SR) for the final signal-yield extraction in the electron and muon modes, respectively. Events inside the above-defined signal regions in data are hidden during the optimization of the selection to avoid introducing experimental bias. These regions are illustrated in Figure 2. Structures due to the initial and final state radiation, seen respectively as longer tails in the negative and directions, are visible in the plots. Final state radiation affects mainly the electron mode and it is corrected for in the event reconstruction by taking into account the bremsstrahlung losses.
4 Background suppression
The background originates from radiative dilepton and four-lepton final states (low-multiplicity), incorrectly reconstructed SM and continuum hadronization processes from events. To remove the low-multiplicity background, we exploit the zeroth order CLEO cone; the angle between the momentum of the reconstructed signal and the closest track (); and the opening angle between the two reconstructed kaons () for the electron mode. We require the zeroth CLEO cone to be less than GeV/; larger than 0.02 rad, and less than 0.01 rad, respectively. We select events with thrust axis magnitude for the muon mode. The reconstruction and selection described above reject 97.9% of the total simulated background for the electron channel and 86.3% for the muon channel, and retain 11% and 9% of signal candidates inside the and the signal regions for the electron and muon modes, respectively.
The remaining background events are mainly from continuum processes and are further suppressed by combining event-shape variables, kinematic properties of the signal candidate, of the reconstructed resonance, of the final-state particles, and variables related to the ROE, into a binary BDT classifier implemented with the XGBoost library [29]. The BDT is trained over a portion of the simulated signal and background events. The optimal selection on the BDT output is determined by minimizing the upper limit computed from the expected number of background events in the simulation in the wide boxes in the (, ) plane.
After the application of the BDT selection, there is a significant contribution to the remaining background observed in data control regions for the electron mode from the -photoproduction process . No simulation of this process is available. Therefore we devise a data driven veto to reject this contribution: events reconstructed in the electron mode are rejected if they have more than one electron candidate in the final state or the second-order CLEO cone with respect to the collision axis is larger than 0.4 or the cosine of the angle between the reconstructed signal momentum and its direction of flight is smaller than zero.
The signal efficiency, extracted from the remaining independent sample as the ratio between events passing the selections inside the signal region and the total generated events, is corrected for the measured discrepancies in the particle-identification efficiency between data and simulation. The final efficiencies for the electron and muon modes are respectively and , where the quoted uncertainty is the total systematic uncertainty computed from the list in Table 4.
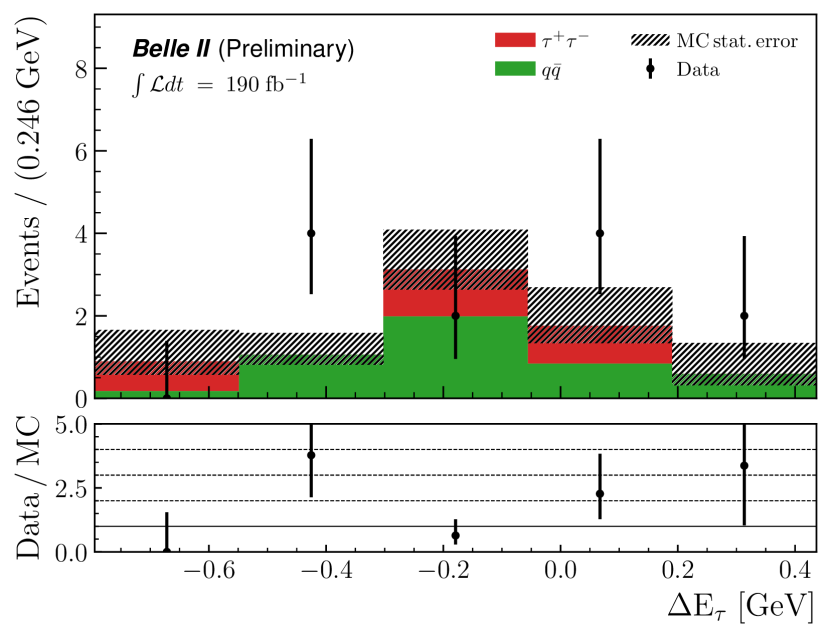
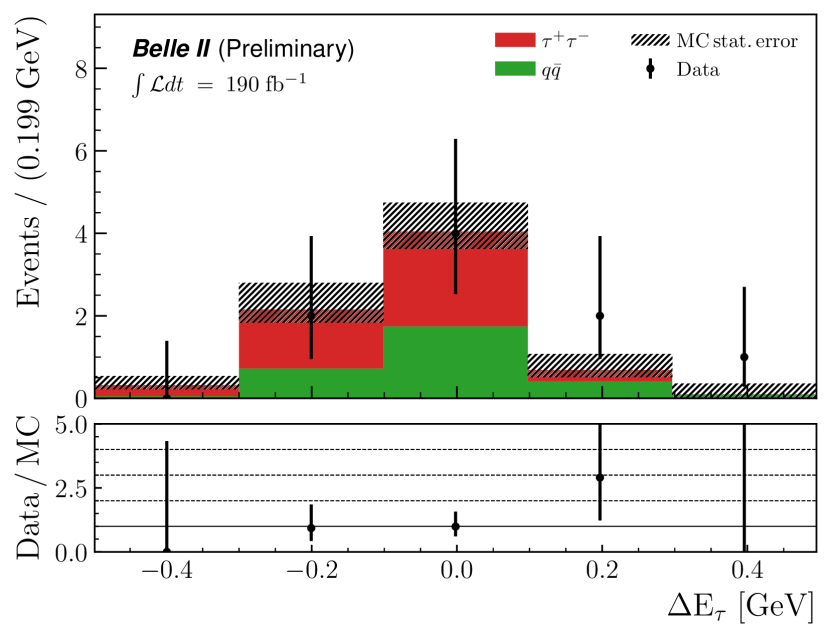
The agreement between data and simulation after the final selections is validated by using the region outside the signal boxes in the (, ) plane, from for the electron and from for the muon mode up to , corresponding to the area outside the red box and inside the blue one in the plots in Figure 2. The and distributions in the sideband regions after the final selections on data and simulation are shown in Figure 3. The simulated samples are scaled to data luminosity and corrected for the differences observed between data and simulation in particle identification efficiencies. The numbers of expected background events from the simulation are 7.4 and 7.3 for the electron and muon modes, where the associated asymmetric errors are statistical; in data, we observe 12.0 and 9.0 events, respectively. This results in ratios between data and simulation of, respectively, 1.6 and 1.2, which shows a data and simulation agreement compatible with unity.


5 Yield extraction
We estimate the final yields in a Poisson-experiment approach by counting the number of observed events in data inside the SR. To estimate the number of expected background events inside the SR, we use the sidebands within the band, defined as reduced sidebands (RSB). Therefore, the expected background is
| (2) |
where is the yield in the data inside the RSB regions and is the ratio measured on simulation between the events inside the signal box and those retained in the RSB region.
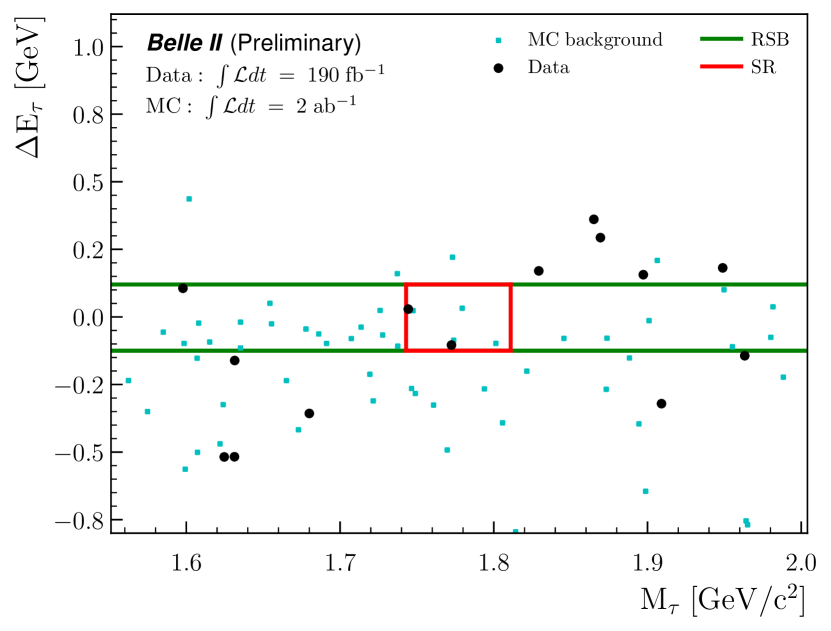
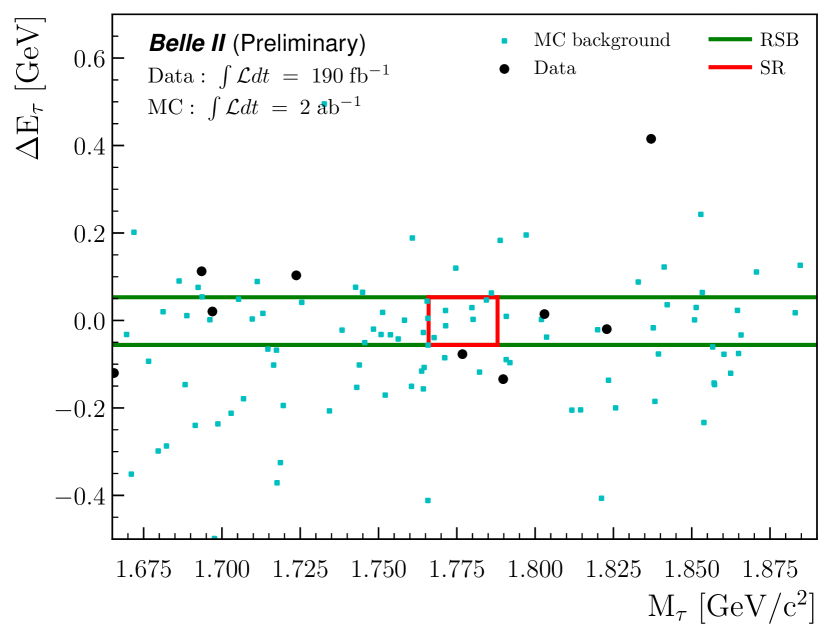
The MC ratios are respectively and for the electron and muon channels, where the associated uncertainties are statistical only, since we assume that any possible systematic contribution due to the simulation, reconstruction, or selections cancel out in the computed ratio. Having observed one and three events in the data RSB for the electron and muon modes, respectively, we compute the expected background in the signal boxes to be 0.23 for the electron mode and 0.36 for the muon mode. The results are summarized in Table 3. Figure 4 shows the remaining events in the (, ) plane for data and simulated samples after the final selections.
Quantity Region Mode Signal efficiency SR (6.1 0.9)% (6.5 0.6)% SR / RSB RSB 1.0 3.0 SR 0.23 0.36 SR 2.0 0.0
6 Upper limit computation
The 90% confidence level (C.L.) upper limits on the branching fractions are computed as
| (3) |
where is the corresponding 90% C.L. upper limit on , the difference between the observed and expected data yields. The other inputs to Equation 3 are the integrated luminosity of the analyzed data sample; the -pair production cross section and the signal efficiency . The selection of a specific final state for the candidate reconstructed as is already included in the total signal efficiency , as the simulated samples allow for any possible known decays of the . Therefore no normalization to is needed in Equation 3.
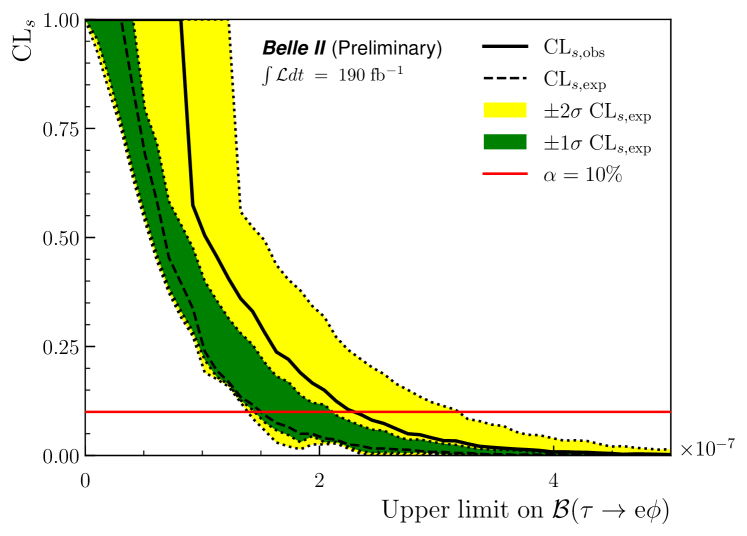
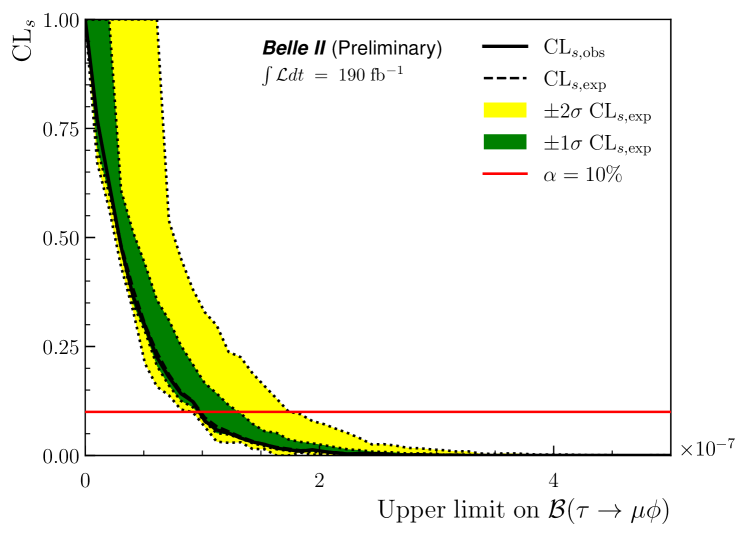
We estimate upper limits with the CLs [12, 13] method in a frequentist approach implemented in the pyhf library [30, 31]. We generate toys at 50 points distributed uniformly in the branching fraction range . Results in Table 3 are taken as inputs to Equation 3 and used to compute the branching fraction value at each scan point. The total statistical and systematic uncertainties affecting each of the experimental inputs are combined in quadrature. The total relative uncertainty on is 15% for the electron channel and 8.7% for the muon, as discussed in Section 7. The dominant uncertainty on is statistical and is reported in Table 3 for each analyzed channel. Figure 5 shows the curves computed as a function of the upper limit on the branching fractions. The dashed black line shows the expected and the green and yellow bands give the and contours, respectively. The expected limits for the and modes are and , respectively.
7 Systematic uncertainties
Systematic uncertainties arise from detector effects and differences between data and simulation, due to possible mismodeling in the generation and reconstruction of the simulated samples. A summary of considered systematic uncertainties on each parameter entering the measurement is provided in Table 4.
Contributions to the systematic uncertainty on the total signal efficiency arise from uncertainties is particle-identification performance, trigger efficiency, track reconstruction efficiencies, and possible differences between data and simulation in signal distributions of variables used in the background-suppression selections.
Discrepancies in particle identification for leptons and charged hadrons between data and simulation are measured in control samples and the derived corrections are applied to the reconstructed events in simulation. The applied corrections are then varied within their statistical and systematic uncertainties, and the final selection efficiency for each configuration is calculated. We assign the maximum relative difference with respect to the nominal efficiency as the systematic contribution due to particle identification. This corresponds to a relative uncertainty of 0.8% and 0.3% for the electron and the muon modes, respectively.
The difference between data and simulation in the track-reconstruction efficiency is measured with tau-pair events and yields a 0.3% systematic uncertainty per track. We assign a relative uncertainty of 0.9% on the signal efficiency due to tracking.
The trigger efficiencies in data and simulation agree to better than the 1% level. We assign an uncertainty estimated from the signal simulation due to a possible bias in the method to compare trigger efficiencies between data and simulation. The absolute trigger efficiency, defined as the number of events in signal simulation that meet the ECL trigger selections required for this analysis divided by the total generated, cannot be measured directly in the data. Only the efficiency relative to orthogonal trigger lines with respect to those used for the signal selection can be accessed. The latter is calculated as the fraction of events passing the ECL trigger selections among all events selected by independent trigger selections based on CDC information. The differences of the ratios of these two efficiencies from unity are assigned as 0.4% and 0.9% systematic uncertainties for the electron and muon modes, respectively.
Potential differences in distributions between data and simulation of variables used in the selection may lead to a systematic uncertainty affecting the total signal efficiency. This is estimated from two control samples, and to ensure the maximum kinematic overlap with signal samples for the variables entering the BDT. Variables showing the largest discrepancies between data and simulation are corrected bin-by-bin using the control samples. We then retrain a BDT on the corrected samples and recompute the signal efficiency. We assess the systematic uncertainty as the difference with respect to the nominal efficiency values quoted in Table 3. This procedure gives the largest contribution to the estimated systematic uncertainty, that is 15.2% and 8.5% for the electron and muon modes, respectively. To compensate for the imperfections of the magnetic-field map used in the event reconstruction, misalignment of the detector, and mismodeling in the density and type of detector and beam-pipe material, we scale the charged-particle momenta by a correction factor, measured from the shift observed in data on the invariant mass of relative to its known value [28]. The corresponding systematic uncertainty is obtained by varying the correction factor according to its uncertainty, which leads to different data yields in the sideband region, and thus different numbers of expected events . The resulting systematic uncertainty, taken as the difference with the nominal value, is 0.6% (0.4%) for the electron (muon) mode. The systematic uncertainty on the integrated luminosity , measured on two samples of Bhabha and diphoton events [32], is evaluated from the difference observed between the results from the two methods and amounts to 0.6% relative uncertainty. We also assign an uncertainty of 0.003 nb on the -pair production cross section at the c.m. energy of 10.58 GeV, according to Ref. [33].
| Affected quantity | Source | Mode | |
| Particle identification | 0.8% | 0.3% | |
| Tracking efficiency | 0.9% | ||
| Trigger efficiency | 0.4% | 0.9% | |
| Signal variable mismodeling | 15.2% | 8.5% | |
| Momentum scale | 0.6% | 0.4% | |
| Luminosity | 0.6% | ||
| Tau-pair cross section | 0.3% | ||
8 Results and conclusions
In 190 fb-1 data, after the final selections, we observe two and zero events for the electron and muon channels, respectively, inside the and signal regions, as shown in the scatter plots in Figure 4. Data yields are compatible with expectations in Table 3. Figure 5 shows the observed curves in agreement with the expected within the yellow band. In the absence of any significant signal excess, we determine the 90% C.L. upper limits on the branching fractions to be < and < . In contrast to the one-prong tag technique used by previous searches at Babar and Belle, this analysis demonstrates the successful first application of the new untagged approach, combined with a background suppression via BDT classifiers, in the reconstruction of tau pairs events at Belle II. With this method, we obtain twice the final signal efficiency for the muon mode.
Acknowledgements
This work, based on data collected using the Belle II detector, which was built and commissioned prior to March 2019, was supported by Science Committee of the Republic of Armenia Grant No. 20TTCG-1C010; Australian Research Council and research Grants No. DE220100462, No. DP180102629, No. DP170102389, No. DP170102204, No. DP150103061, No. FT130100303, No. FT130100018, and No. FT120100745; Austrian Federal Ministry of Education, Science and Research, Austrian Science Fund No. P 31361-N36 and No. J4625-N, and Horizon 2020 ERC Starting Grant No. 947006 “InterLeptons”; Natural Sciences and Engineering Research Council of Canada, Compute Canada and CANARIE; Chinese Academy of Sciences and research Grant No. QYZDJ-SSW-SLH011, National Natural Science Foundation of China and research Grants No. 11521505, No. 11575017, No. 11675166, No. 11761141009, No. 11705209, and No. 11975076, LiaoNing Revitalization Talents Program under Contract No. XLYC1807135, Shanghai Pujiang Program under Grant No. 18PJ1401000, Shandong Provincial Natural Science Foundation Project ZR2022JQ02, and the CAS Center for Excellence in Particle Physics (CCEPP); the Ministry of Education, Youth, and Sports of the Czech Republic under Contract No. LTT17020 and Charles University Grant No. SVV 260448 and the Czech Science Foundation Grant No. 22-18469S; European Research Council, Seventh Framework PIEF-GA-2013-622527, Horizon 2020 ERC-Advanced Grants No. 267104 and No. 884719, Horizon 2020 ERC-Consolidator Grant No. 819127, Horizon 2020 Marie Sklodowska-Curie Grant Agreement No. 700525 "NIOBE" and No. 101026516, and Horizon 2020 Marie Sklodowska-Curie RISE project JENNIFER2 Grant Agreement No. 822070 (European grants); L’Institut National de Physique Nucléaire et de Physique des Particules (IN2P3) du CNRS (France); BMBF, DFG, HGF, MPG, and AvH Foundation (Germany); Department of Atomic Energy under Project Identification No. RTI 4002 and Department of Science and Technology (India); Israel Science Foundation Grant No. 2476/17, U.S.-Israel Binational Science Foundation Grant No. 2016113, and Israel Ministry of Science Grant No. 3-16543; Istituto Nazionale di Fisica Nucleare and the research grants BELLE2; Japan Society for the Promotion of Science, Grant-in-Aid for Scientific Research Grants No. 16H03968, No. 16H03993, No. 16H06492, No. 16K05323, No. 17H01133, No. 17H05405, No. 18K03621, No. 18H03710, No. 18H05226, No. 19H00682, No. 22H00144, No. 26220706, and No. 26400255, the National Institute of Informatics, and Science Information NETwork 5 (SINET5), and the Ministry of Education, Culture, Sports, Science, and Technology (MEXT) of Japan; National Research Foundation (NRF) of Korea Grants No. 2016R1D1A1B02012900, No. 2018R1A2B3003643, No. 2018R1A6A1A06024970, No. 2018R1D1A1B07047294, No. 2019R1I1A3A01058933, No. 2022R1A2C1003993, and No. RS-2022-00197659, Radiation Science Research Institute, Foreign Large-size Research Facility Application Supporting project, the Global Science Experimental Data Hub Center of the Korea Institute of Science and Technology Information and KREONET/GLORIAD; Universiti Malaya RU grant, Akademi Sains Malaysia, and Ministry of Education Malaysia; Frontiers of Science Program Contracts No. FOINS-296, No. CB-221329, No. CB-236394, No. CB-254409, and No. CB-180023, and No. SEP-CINVESTAV research Grant No. 237 (Mexico); the Polish Ministry of Science and Higher Education and the National Science Center; the Ministry of Science and Higher Education of the Russian Federation, Agreement No. 14.W03.31.0026, and the HSE University Basic Research Program, Moscow; University of Tabuk research Grants No. S-0256-1438 and No. S-0280-1439 (Saudi Arabia); Slovenian Research Agency and research Grants No. J1-9124 and No. P1-0135; Agencia Estatal de Investigacion, Spain Grant No. RYC2020-029875-I and Generalitat Valenciana, Spain Grant No. CIDEGENT/2018/020 Ministry of Science and Technology and research Grants No. MOST106-2112-M-002-005-MY3 and No. MOST107-2119-M-002-035-MY3, and the Ministry of Education (Taiwan); Thailand Center of Excellence in Physics; TUBITAK ULAKBIM (Turkey); National Research Foundation of Ukraine, project No. 2020.02/0257, and Ministry of Education and Science of Ukraine; the U.S. National Science Foundation and research Grants No. PHY-1913789 and No. PHY-2111604, and the U.S. Department of Energy and research Awards No. DE-AC06-76RLO1830, No. DE-SC0007983, No. DE-SC0009824, No. DE-SC0009973, No. DE-SC0010007, No. DE-SC0010073, No. DE-SC0010118, No. DE-SC0010504, No. DE-SC0011784, No. DE-SC0012704, No. DE-SC0019230, No. DE-SC0021274, No. DE-SC0022350; and the Vietnam Academy of Science and Technology (VAST) under Grant No. DL0000.05/21-23.
These acknowledgements are not to be interpreted as an endorsement of any statement made by any of our institutes, funding agencies, governments, or their representatives.
We thank the SuperKEKB team for delivering high-luminosity collisions; the KEK cryogenics group for the efficient operation of the detector solenoid magnet; the KEK computer group and the NII for on-site computing support and SINET6 network support; and the raw-data centers at BNL, DESY, GridKa, IN2P3, INFN, and the University of Victoria for offsite computing support.
References
- [1] Tong Li et al. “Charged lepton flavor violation in light of the muon magnetic moment anomaly and colliders” In Eur. Phys. J. C 81.09, 2021, pp. 811 DOI: 10.1140/epjc/s10052-021-09569-9
- [2] G. Hernández-Tomé et al. “Flavor violating leptonic decays of and leptons in the Standard Model with massive neutrinos” [Erratum: Eur. Phys. J. C 80, 438 (2020)] In Eur. Phys. J. C 79.1, 2019, pp. 84 DOI: 10.1140/epjc/s10052-019-6563-4
- [3] Yasmine Sara Amhis “Averages of b-hadron, c-hadron, and -lepton properties as of 2021” In Phys. Rev. D 107.5, 2023, pp. 052008 DOI: 10.1103/PhysRevD.107.052008
- [4] Roel Aaij “Measurement of -Averaged Observables in the Decay” In Phys. Rev. Lett. 125.1, 2020, pp. 011802 DOI: 10.1103/PhysRevLett.125.011802
- [5] R. Aaij “Test of lepton universality with decays” In JHEP 08, 2017, pp. 055 DOI: 10.1007/JHEP08(2017)055
- [6] J.. Lees “Measurement of an Excess of Decays and Implications for Charged Higgs Bosons” In Phys. Rev. D 88.7, 2013, pp. 072012 DOI: 10.1103/PhysRevD.88.072012
- [7] M. Huschle “Measurement of the branching ratio of relative to decays with hadronic tagging at Belle” In Phys. Rev. D 92.7, 2015, pp. 072014 DOI: 10.1103/PhysRevD.92.072014
- [8] Andrei Angelescu et al. “Single leptoquark solutions to the B-physics anomalies” In Phys. Rev. D 104.5, 2021, pp. 055017 DOI: 10.1103/PhysRevD.104.055017
- [9] Claudia Cornella et al. “Reading the footprints of the B-meson flavor anomalies” In JHEP 08, 2021, pp. 050 DOI: 10.1007/JHEP08(2021)050
- [10] Bernard Aubert “Improved limits on lepton flavor violating tau decays to l phi, l rho, l K* and l anti-K*” In Phys. Rev. Lett. 103, 2009, pp. 021801 DOI: 10.1103/PhysRevLett.103.021801
- [11] Y. Miyazaki “Search for Lepton-Flavor-Violating tau Decays into a Lepton and a Vector Meson” In Phys. Lett. B 699, 2011, pp. 251–257 DOI: 10.1016/j.physletb.2011.04.011
- [12] Thomas Junk “Confidence level computation for combining searches with small statistics” In Nucl. Instrum. Meth. A 434, 1999, pp. 435–443 DOI: 10.1016/S0168-9002(99)00498-2
- [13] Alexander L. Read “Presentation of search results: The CL(s) technique” In J. Phys. G 28, 2002, pp. 2693–2704 DOI: 10.1088/0954-3899/28/10/313
- [14] T. Abe “Belle II Technical Design Report”, 2010 arXiv:1011.0352 [physics.ins-det]
- [15] S. Jadach et al. “The precision Monte Carlo event generator for two-fermion final states in collisions” In Computer Physics Communications 130.3 Elsevier (BV), 2000, pp. 260–325 DOI: 10.1016/s0010-4655(00)00048-5
- [16] S. Jadach et al. “The tau decay library TAUOLA: Version 2.4” In Comput. Phys. Commun. 76, 1993, pp. 361–380 DOI: 10.1016/0010-4655(93)90061-G
- [17] Elisabetta Barberio and Zbigniew Was “PHOTOS: A Universal Monte Carlo for QED radiative corrections. Version 2.0” In Comput. Phys. Commun. 79, 1994, pp. 291–308 DOI: 10.1016/0010-4655(94)90074-4
- [18] D.. Lange “The EvtGen particle decay simulation package” In Nucl. Instrum. Meth. A 462, 2001, pp. 152–155 DOI: 10.1016/S0168-9002(01)00089-4
- [19] Torbjörn Sjöstrand et al. “An introduction to PYTHIA 8.2” In Computer Physics Communications 191 Elsevier (BV), 2015, pp. 159–177 DOI: 10.1016/j.cpc.2015.01.024
- [20] C.M. Calame et al. “Large-angle Bhabha scattering and luminosity at flavour factories” In Nuclear Physics B 584.1-2 Elsevier (BV), 2000, pp. 459–479 DOI: 10.1016/s0550-3213(00)00356-4
- [21] G. Balossini et al. “Photon pair production at flavour factories with per mille accuracy” In Physics Letters B 663.3 Elsevier (BV), 2008, pp. 209–213 DOI: 10.1016/j.physletb.2008.04.007
- [22] S. Agostinelli “GEANT4–a simulation toolkit” In Nucl. Instrum. Meth. A 506, 2003, pp. 250–303 DOI: 10.1016/S0168-9002(03)01368-8
- [23] T. Kuhr et al. “The Belle II Core Software” In Computing and Software for Big Science 3.1 Springer ScienceBusiness Media (LLC), 2018 DOI: 10.1007/s41781-018-0017-9
- [24] Belle II collaboration “Belle II Analysis Software Framework (basf2)”, https://doi.org/10.5281/zenodo.5574115
- [25] Giovanni Punzi “Sensitivity of searches for new signals and its optimization” In eConf C030908, 2003, pp. MODT002 arXiv:physics/0308063
- [26] D.. Asner “Search for exclusive charmless hadronic decays” In Physical Review D 53.3 American Physical Society (APS), 1996, pp. 1039–1050 DOI: 10.1103/physrevd.53.1039
- [27] A.. Bevan “The Physics of the B Factories” In Eur. Phys. J. C 74, 2014, pp. 3026 DOI: 10.1140/epjc/s10052-014-3026-9
- [28] R.. Workman “Review of Particle Physics” In PTEP 2022, 2022, pp. 083C01 DOI: 10.1093/ptep/ptac097
- [29] Tianqi Chen and Carlos Guestrin “XGBoost: A Scalable Tree Boosting System” In Proceedings of the 22nd ACM SIGKDD International Conference on Knowledge Discovery and Data Mining, KDD ’16 San Francisco, California, USA: ACM, 2016, pp. 785–794 DOI: 10.1145/2939672.2939785
- [30] Lukas Heinrich et al. “pyhf: v0.6.3” https://github.com/scikit-hep/pyhf/releases/tag/v0.6.3 DOI: 10.5281/zenodo.1169739
- [31] Lukas Heinrich et al. “pyhf: pure-Python implementation of HistFactory statistical models” In Journal of Open Source Software 6.58 The Open Journal, 2021, pp. 2823 DOI: 10.21105/joss.02823
- [32] F. Abudinén “Measurement of the integrated luminosity of the Phase 2 data of the Belle II experiment” In Chinese Physics C 44.2 IOP Publishing, 2020, pp. 021001 DOI: 10.1088/1674-1137/44/2/021001
- [33] Swagato Banerjee et al. “Tau and muon pair production cross-sections in electron-positron annihilations at GeV” In Phys. Rev. D 77, 2008, pp. 054012 DOI: 10.1103/PhysRevD.77.054012