Combining Vision and Tactile Sensation for Video Prediction
Abstract
In this paper, we explore the impact of adding tactile sensation to video prediction models for physical robot interactions. Predicting the impact of robotic actions on the environment is a fundamental challenge in robotics. Current methods leverage visual and robot action data to generate video predictions over a given time period, which can then be used to adjust robot actions. However, humans rely on both visual and tactile feedback to develop and maintain a mental model of their physical surroundings. In this paper, we investigate the impact of integrating tactile feedback into video prediction models for physical robot interactions. We propose three multi-modal integration approaches and compare the performance of these tactile-enhanced video prediction models. Additionally, we introduce two new datasets of robot pushing that use a magnetic-based tactile sensor for unsupervised learning. The first dataset contains visually identical objects with different physical properties, while the second dataset mimics existing robot-pushing datasets of household object clusters. Our results demonstrate that incorporating tactile feedback into video prediction models improves scene prediction accuracy and enhances the agent’s perception of physical interactions and understanding of cause-effect relationships during physical robot interactions.
Index Terms:
Deep learning in robotics and automation, perception for grasping and manipulation, physical robot interaction, video prediction, force and tactile sensing.I Introduction
Physical interaction is an essential aspect of human life. As robots are pushed into the real world and their tasks become more complex, physical robot interactions (PRI) will become an increasingly essential feature. An agent’s understanding of physical cause-effect relationships underpins its performance in PRI tasks. Without this cause-effect understanding, an agent is unable to distinguish and filter between promising or unfavourable candidate actions.
Visual and tactile sensations are essential to building physical interaction perception in humans [14], in particular, human tactile cognition helps with a series of interactive tasks [22] like grasping, manipulating an object, in-hand manipulation, tactile exploration, object pushing, and human-to-human physical collaboration. Tseng et al. [34] and Thoroughman et al. [32] showed humans use predictive models to perform such complex physical interaction tasks.
In robotics, physical interaction tasks are typically performed with deep neural network video prediction models [25] and bench-marked with object-pushing datasets such as the BAIR dataset [8]. These prediction architectures use optical sensation to perceive their environment. However, unlike the multi-modal systems humans use for environment perception, this single-modality approach results in more latent variables and prediction uncertainty. We believe the integration of other sensing modalities, such as tactile sensation, into these physical interaction perception models will improve an agent’s cause-effect predictions during PRI.

This work aims to explore and develop physical perception forward models that take advantage of both visual and tactile sensations. A forward model in the context of human neuro-cognitive science [39] refers to a predictive model of a physically interactive task. In robotics, this is an action-conditioned predictive model that uses a history of sensory readings and robot states, as well as planned future robot movements, to generate the predicted sensory readings in the prediction horizon. To combine these two modalities, we introduce tactile sensation to a state-of-the-art video prediction architecture (Stochastic Video Generator [7]) with a variety of approaches. We explore these approaches within the context of object pushing, where the prediction system must predict the future image frames of a scene, given previously seen frames and a known robot action. We believe our unsupervised tactile-visual learning approach could be beneficial to other aspects of physical-robot interaction such as grasping, in-hand manipulation, human-robot interaction, and soft tissue manipulation.
Contribution 1: In this article, we propose a novel array of action-conditioned multi-modal (tactile and visual) prediction models for physical interaction perception. Our proposed model, Simultanious Prediction of Optical and Tactile Sensations (SPOTS), outperforming other state-of-the-art models. It uses a dual pipeline prediction architecture that enables two bespoke network architectures dedicated to the prediction of the individual sensation. Crossover connections between the two pipelines capture the correlation between tactile and optical sensation and enable multi-modal learning. This bio-inspired approach mimics the structure and interaction between the visual, somatosensory and auditory primary cortexes in the mammalian brain [11] (Fig. 1). For instance, humans have individual cortexes for processing a given sensing modality, but crossover between the cortexes enables cross-sensation processing [11].
Contribution 2: We generate two novel datasets111The two datasets and the model code is available for download and use here: https://github.com/imanlab/SPOTS_IML as there are no available PRI datasets that contain tactile and visual data. Our first novel dataset contains visually identical objects with different friction properties. The second is a large household object clusters dataset replicating standard vision-only benchmarks. The datasets contain RGB-D image data of the scene, robot state and tactile sensations from a magnetic-based sensor (Xela uSkin XR1944 [28]).
Contribution 3: We present a set of comparative studies using the datasets to test the different potential multi-modal models presented in this article, exploring the quantitative and qualitative performance impact of integrating tactile sensation to PRI video prediction models. We use this comparison study to explore how best to perform the integration of tactile and visual sensation within recurrent neural networks. We show that within these datasets, the tactile-enabled prediction models outperform their vision-only counterparts both quantitatively and qualitatively. Further, we show that the multi-modal prediction system also enables accurate tactile predictions during physical interactions. The results shown in this paper indicate that as robotics pushes into the real-world, accurate and safe PRI should be rooted in multi-modal physical perception models.
II Related Works
Video Prediction
Video prediction, the task of predicting future video frames, is a core technology challenge in enhancing robotic systems to perform human-like manipulation tasks and it imposes an interesting scientific problem. Early video prediction models focused on predicting raw pixel intensities without modelling the scene dynamics [27]. To perform predictions over longer time horizons, Srivastava et al. [31] introduced autoencoders and LSTM units to model the temporal coherence. Action-conditioned video prediction models provide further information to the prediction model [9, 23] for use in reinforcement learning and enabling model predictive control with video prediction systems [8]. Villegas et al. [36] split frames into content and motion streams and devolved the problem into predicting the pose and dynamics of landmarks [37]. More recent methods have applied a stochastic assumption to the video prediction problem, stating that there are multiple possible outputs for a single given input, due to a set of latent variables. To reduce uncertainty, which manifests as image blur [1], and produce sharper prediction image quality, recent models have estimated and sampled from these latent variables. Babaeizadeh et al. [1] applied this method to the optical flow method proposed in [9]. Denton et al. [7] proposed a similar approach but with a simpler model using only basic layers, which was later built upon by [35] for larger high-fidelity video prediction. Lee et al. [16] also built upon the method in [9] by appending adversarial training techniques. The existing video prediction models do not use the tactile sensation and assume the changes caused by PRI are fully observed in visual information and/or the models provide a prediction with high uncertainty.
Physical Robot Interaction
Opera et al. [25] considered three categories for video prediction model benchmarks (i) human prediction tests (e.g. [13, 29, 2]), (ii) driving and road tests, where the objective is to predict how the state of a road might change (e.g. [3, 10, 12]) and (iii) robot pushing datasets, (e.g. [9, 8, 6]) where the objective is to predict the environment change from a robot’s actions during physical robot interaction. Unlike the other video prediction benchmark tests, robot-pushing datasets contain physical interaction. The tactile sensation can provide features important to video prediction models that are not available from visual sensation. Current state-of-the-art methods apply a stochastic assumption to video prediction, assuming that variables such as the centre of mass, object friction, and object dynamics are unknowable. Tactile sensation during physical interaction may give access to many of these latent variables which is the concept behind integrating tactile sensation into video prediction models. In this article, we build new datasets as the available pushing datasets lack tactile sensation.
Tactile Sensation
Tactile sensors are hardware devices that obtain tactile information through physical interaction with the environment. Tactile information typically attributes such as temperature, vibration, softness, texture, shape, composition and normal & shear forces [33]. In the context of object pushing, we require normal and shear force features. Tactile sensors available from both industry and literature that can generate these features typically make trade-offs between resolution, affordability and sensitivity. Image-based tactile sensors222Such technology includes a camera capturing the deformation of a membrane., such as the Optical wave-guide-based sensors [41, 24] and marker-based sensors such as the TacTip [38], are high-resolution tactile sensors. However, they require significant processing [30].
Magnetic-based [42] sensors, like the Xela Uskin 333The uSkin sensor by xelarobotics.com, provide low spatial resolution and high-frequency data at each Taxel with tri-axial readings. The Xela Uskin sensor has magnetic-based cells each measuring non-calibrated normal and shear forces. In this work, we use the Xela uSkin magnetic sensor as it’s (1) simple and easy to use, (2) low cost, and (3) it generates high-frequency readings. This sensor is used for tactile predictive models [20] and for data-driven model predictive control for slip-free robotic manipulation [21].
Vision and Touch
The combination of touch and vision is in its infancy. The relationship between vision and touch during PRI has been explored with translation tasks. For instance, [17] and [4] used adversarial networks to translate between material surfaces and touch with a vision-based touch sensor and a pen accelerometer, respectively. Li et al. [19] used ResNet Encoders and adversarial training to (i) synthesise plausible temporal tactile signals from visual inputs of touch with a static scene and (ii) translate from tactile signals to a single image output of the scene. Lee et al. [18] combined vision, haptic (wrist force/torque sensor) and proprioceptive data to encode a multi-modal representation using a set of surrogate tasks. Encoded data is then used to generate a policy for reinforcement learning (a peg-in-hole task). This work showed that the multi-modal representation outperforms single-modality models. Pinto et al. [26] show how physical interactions enable agents to better classify and categorise objects through pushing, poking and grasping. However, a model that captures the correlation between touch and visual sensing to predict visual and/or tactile sensing during PRI has not been explored in the literature.
We present the combined tactile and video prediction models in this paper for effective PRI task completion (Fig. 2).
III Problem Formulation
The objective of this work is to provide an improved video prediction by a model that simultaneously predicts tactile and video frames during physical robot interactions. This improved video prediction through integrated tactile sensation can be used for effective control of highly non-linear PRI tasks where the existing methods fail [21]. We build our models based on our previous work of tactile prediction models [20].
Given (i) a set of context frames , which are the previously seen images during the trial, with a context sequence length of and (ii) a prediction horizon with a length of (which is how many frames into the future a model will predict for), a video prediction model can be defined as 444We use , x and to denote variables either vector or matrix, a set of those variables and the corresponding predicted values., where is the predicted video frames. The aim is to optimise the following objective function:
| (1) |
for each prediction horizon , where is the pixel space loss function, for example or , defining the difference between predicted and observed video frames.
As we are predicting within the physical robot interaction space, we are focused on the model developing a cause-effect understanding of the robot. To do so, we action-condition the prediction model with past actions and known future robot actions . Within the context of visual model predictive control, the future robot actions will be a batch of candidate actions, allowing a discriminator to decide on the best action based on the most desirable predicted scene. The prediction model is therefore:
| (2) |
We chose the stochastic video prediction model SVG (presented in [7]) as the baseline architecture to build our multi-modal system from. SVG does not make the assumptions about the input data that other video prediction models like SAVP and SV2P do, making the system more generalisable [35] and hence more suitable to a multi-modal approach. It’s simple architecture also allows us to change the models structure more without a negative or destructive impact.
SVG applies a stochastic assumption to the prediction model, where the objective is to sample from . Within the base video prediction architecture, we build our models from, video prediction is split into sub-modules: (i) a frame prediction network, (ii) a prior network, and (iii) a posterior network, which is used to train the prior network only [7].
Within video prediction for PRI, latent variables are used to estimate unknown physical properties: ‘when a robot’s arm pushes a toy on a table, the unknown weight of that toy affects how it moves [1]’. Intuitively, we believe that tactile sensation should provide the model with more accurate representations of the object’s physical values. However, we still use the stochastic assumption and include the use of latent variable estimation as other features in the environment are still difficult to estimate even with tactile sensation.
SVG conditions the frame prediction network on the estimated latent variables z, . The latent variables are distributed according to the prior network , where is the current time-step in the prediction sequence. Learning then involves training the parameters of factors of the factorised model:
| (3) |
The learned prior network is trained using Kullback-Leibler divergence [15] on the output of the posterior network . Both networks output the parameters of a conditional Gaussian distribution
The prior network can then be trained jointly with the frame prediction model by maximising Eq. 4. For further information on stochastic video prediction look to [1] and [7].
| (4) |
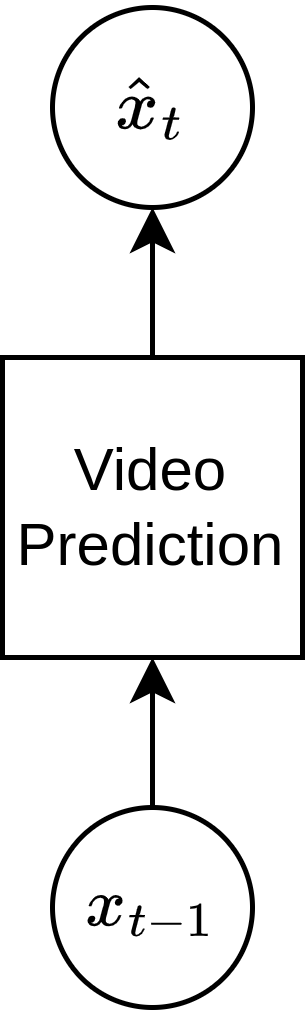
To integrate tactile sensation, , into video prediction models there are a variety of potential methods. In the following sections, we discuss the different methods we used to apply tactile integration into the above video prediction architecture (Fig. 3).

IV Combining Vision and Tactile Sensation for Video Prediction
As images of the environment and tactile sensation can both be viewed as images, we will state a useful change in variable names to remove ambiguity. We will refer to the visual image of the environment as the scene image and to the tactile image as such.
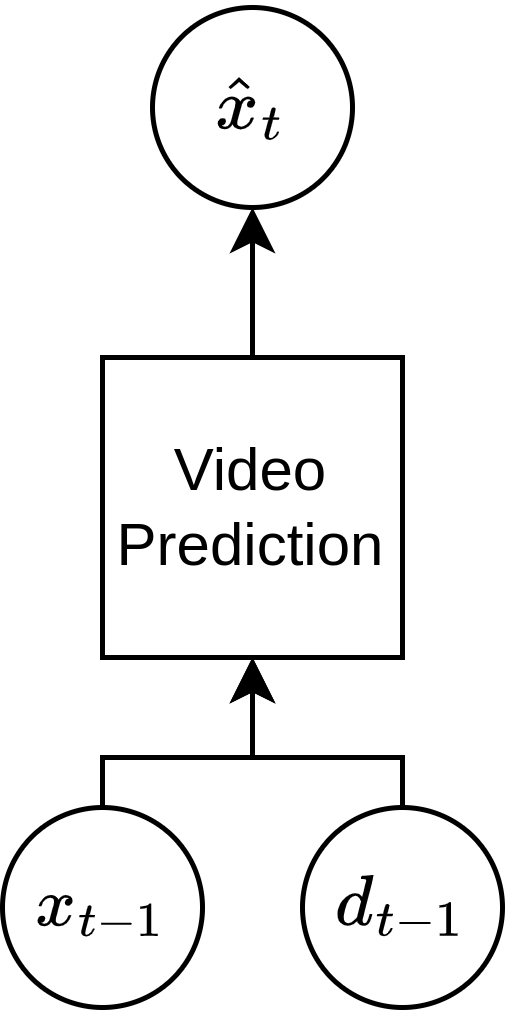
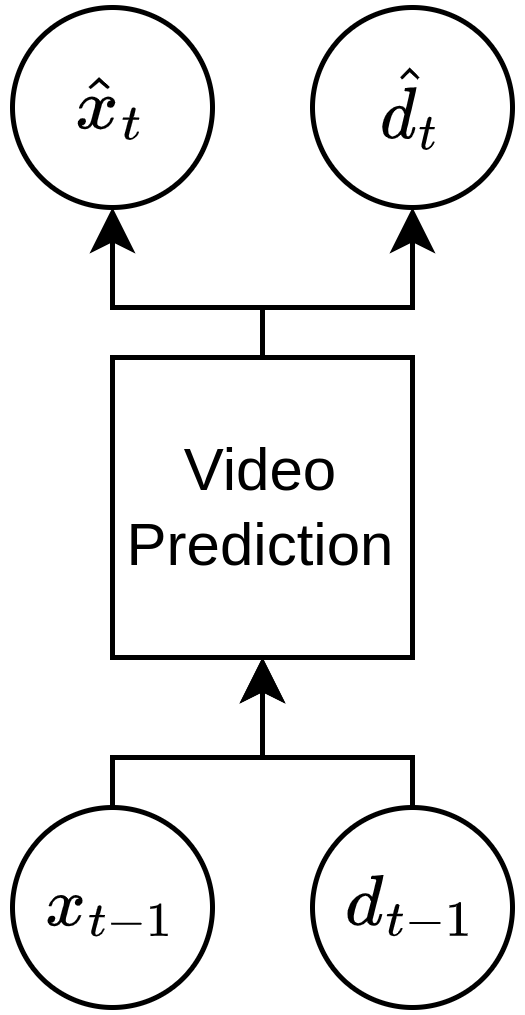
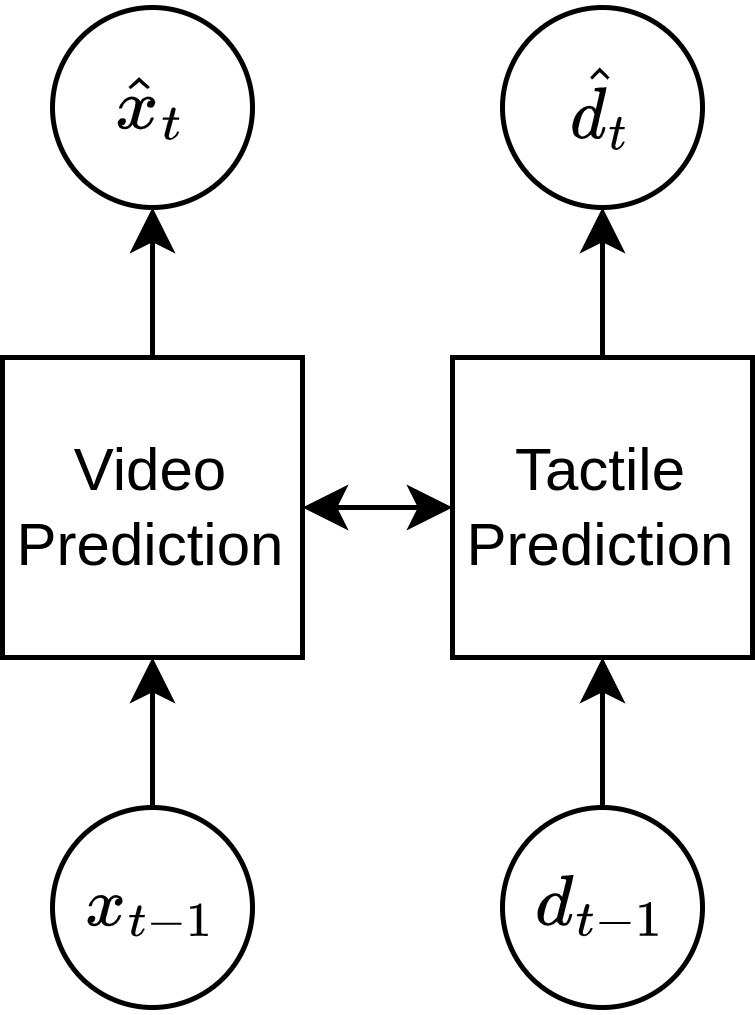
To introduce tactile sensation to video prediction models we have three base approaches (shown in Fig. 2): (A) the SVG model is conditioned with the context tactile data (Fig. 3); (B.1) the scene and tactile data can be concatenated together and then passed to the prediction model, which predicts both touch and scene (Fig. 4 (a)); (B.2) the scene and tactile data can be passed to bespoke modality prediction models, with a crossover between the two (Fig. 4 (b)). In the following sections, we describe the three key integration approaches within the SVG model architecture. We describe the overall design of these methods, the key features, and the potential layers that make up our comparison study in Section VI.
In all models, the robot action data, , and the robot state (robot start position), (we use for robot planned action in prediction horizon and the past states), are concatenated together [9] and input to the LSTM chain in the Frame Prediction Model alongside the other feature vectors.
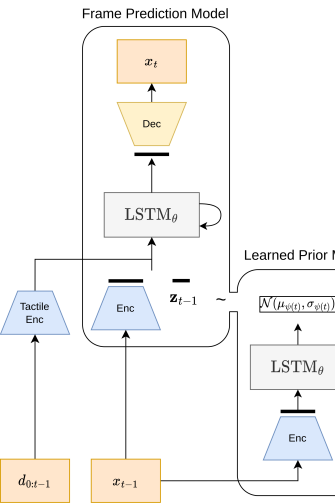
IV-A Tactile-Conditioned Video Prediction
The simplest method of integration is to flatten the context tactile frames, from into , then encode it into a feature vector and pass it as input to the Frame Prediction Models LSTM chain through concatenation with the robot action data, the learned latent values and the scene feature vector. This model, titled Tactile Enhanced Stochastic Video Generation (SVG-TE), is shown in Fig. 3. In this model, the tactile feature vector is not used in the latent variable calculation.
Training this model is to learn the frame prediction networks weights , the learned prior networks weights and the posterior network weights . The final factorised frame prediction model shown in Eq. 5 with the optimisation function to learn and shown in Eq. 6.
| (5) |
| (6) |
IV-B Simultaneous Tactile and Video Prediction
The following two architectures predict both tactile and scene frames simultaneously. We adapt our model to sampling from , as shown in Fig. 2 (c) and 2 (d). With this style of approach, we can factorise these models to Eq. 7 with the full model training being a function of the loss shown in Eq. 8
| (7) |
| (8) |
We hypothesise that these predicted tactile frames can be utilised by the scene frame predictor network to improve prediction performance, beyond the boost provided through the context tactile data. Furthermore, predicting tactile sensation allows for more complex use within a model predictive control scenario, enabling, for example, proactive slip control [21].
We perform the above optimisation through the two proposed architectures presented in Fig. 4 (a) Stochastic Video and Tactile Generator (SVTG) and Fig. 4 (b) Simultaneous Prediction of Optic and Touch Sensations (SPOTS. Below we discuss additional layers and key features of the models we developed with this approach.
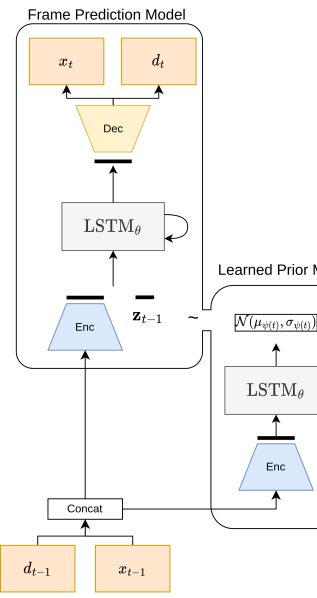
IV-B1 Stochastic Video and Tactile Generation (SVTG)
This architecture concatenates the scene and tactile data together before encoding (Fig. 4 (a)). The tactile data is reshaped from to where the three channels represent the normal, shear x and shear y forces555Xela sensor is used in this paper with 4 x 4 sensing cells where each cell provides normal, shear x and shear y reading at each taxel.. Although this architecture is simple to implement, the SVG architecture has been shown to predict re-scaled tactile data poorly [20]. To enable the processing of the tactile data with a separate, more tactile data-oriented architecture, we also implemented SPOTS, shown below.
IV-B2 Simultaneous Prediction of Scene and Touch Sensation (SPOTS)
This model uses two Frame Predictor Models, one for each modality, as shown in Fig. 4 (b). The SVG’s frame predictor model is used for the scene and a bespoke tactile prediction architecture (Action-Conditioned Tactile Prediction [20]) is used for the tactile frame predictor model. Crossover connections between the encoded tactile data and the encoded scene data give each pipeline access to the other sensor modality.
We split the prediction network into a scene pipeline and a tactile pipeline, for the following reasons: (i) It enables changes to model structure that can only be applied to a single sensation, for example using optical flow for video prediction but not for tactile prediction; (ii) The structure enables the integration of more modalities that may require unique architectures, for example auditory and olfactory sensations [11]; (iii) The split architecture is easier to adjust for specific domain problems, if one aspect of the scene prediction network requires change, it will not impact the integral tactile prediction performance, and vice versa.
There are a few adjustments we made to support this change, each key change is discussed below:
Multi-Modal Fusion Model (MMFM)
Inspired by [18], the combination of the two sensing modalities can be performed with an MMFM. The MMFM layer consists of two simple linear layers, with batch normalisation and tanh activation functions. The best multi-modal representation may be different for the given network modality, so in the SPOTS architecture, each pipeline has its own MMFM layer. The MMFM layer is included prior to the LSTM chain in the two pipelines and takes as input the encoded scene and tactile values.
Scene only learned prior
The latent variables generated through the learned prior network reduce scene prediction blur by estimating latent values. Although this produces results that perform better on performance metrics that correlate well with human-based image similarity scores such as Structural Similarity Index (SSIM) and Peak Signal-to-Noise Ration (PSNR), it is unknown if this is required for the tactile prediction network, and the encoded uncertainty produced by deterministic tactile predictions may be more beneficial for the scene predictions. We test this option with SPOTS-SOP (SPOTS Scene-Only Prior)
Action-Conditioned Tactile Prediction Network
The dual pipeline system enables tailoring the pipeline for a given modality and allows a more detailed exploration of the integration problem. Tactile prediction (of the same Xela uSkin sensor) during physical robot interaction can be performed with video prediction architectures like SVG by resizing the tactile data, however, this was shown to produce poor results. We adjust the tactile prediction pipeline to use the best-performing tactile prediction model, i.e. Action-Condition Tactile Predictor (ACTP) [20].
V Experiment setup: Robot and Task
To train and test the tactile integrated models shown above, we built two new object-pushing datasets that contain both tactile sensation and scene videos. Object-pushing datasets have been widely used to benchmark video prediction [25], unlike other existing benchmarks like driving and urban scene understanding datasets, they specifically test physical robot interaction and so are perfect for testing our prediction models.
Previous PRI video prediction research focuses on datasets that test generalisation across household objects and clusters [9, 8, 6]. We mimic the process of these datasets, performing random robot pushing actions through household object clusters. The datasets consists of: (i) robot proprioception data in joint and task space, enabling action conditioning (ii) tactile data from the pushing finger of the gripper (iii) RGBD video frames from 3 perspectives of the scene (). The synchronised data was collected at 10 frames per second.
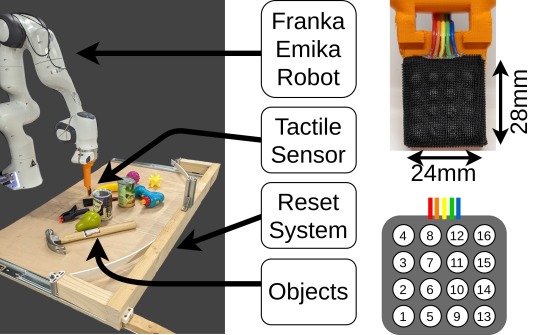
We introduce tactile sensation by appending the Xela uSkin magnetic tactile sensor to the pushing fingertip. The Xela uSkin tactile sensor contains 16 sensing elements arranged in a 4 by 4 square grid, each outputting non-calibrated shear x, shear y and normal forces, i.e. the readings are proportional to a normal and two shear forces. The Xela sensor has previously been used to predict tactile sensation during pick and move tasks [20] and so is appropriate for use in our scene and tactile prediction models. A vision based sensor such as the GelSight sensor [40] could also be used in this setting.
We used the Franka Emika Panda robot for pushing and collected scene frames with the Intel RealSense D345 camera. Some previous robot-pushing datasets contain random object pushes. However, for these datasets, we used straight line pushes as: (i) the straight line push ensures that the tactile sensor is facing the objects and (ii) the straight line pushes provide more continuous interactions with an object over time. For example, during random motions, the objects are often touched but not completely pushed through. Pushing through the object ensures the maximum change in the objects’ location, and thus provides the complex pushing actions we require for testing.
V-A Pushing dataset
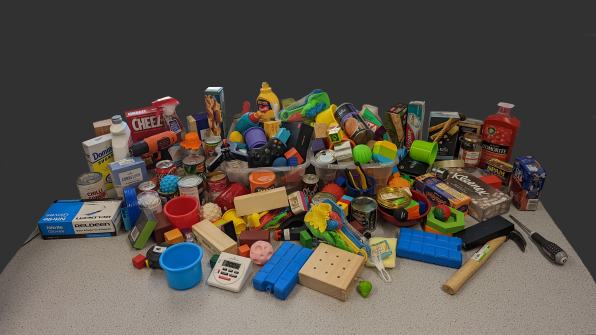
Household object clusters: This dataset contains 5,500 pushing trials of clusters with 100’s household objects (Fig. 5 (b)). The dataset consists of objects from the YCB dataset [5], with other objects added for more thorough generalisation testing. The objects used are shown in Fig. 5 (b). Each pushing trial lasts 4 seconds. The test data is split into two sets: (i) seen object clusters, which contain new clusters made of objects within the training dataset and (ii) unseen object clusters, which contain objects not present in the training dataset. Each test set contains 250 trials.
The collection of this dataset was semi-automated. 20 pushes of the object clusters were followed by an automated resetting procedure, in which the robot pulled an ellipse-shaped barrier toward itself, pushing all objects back toward a central location. This ensured that a higher percentage of pushes involved object contact. This setup is shown in Fig. 5 (a). The arena also contained boundaries outside of the pushing range, resulting in a low number of pushes where the object is forced into a barrier (typically only the largest objects could hit the edges).
Visually Identical Dataset In this dataset we use the same object, with friction markers placed at different places on the objects’ contact surface. This test is bespoke to our task and allows us to qualitatively test the impact of tactile integration on an agent’s understanding of the scene. If the model is unable to utilise the tactile sensation, it will be unable to predict the correct direction of the objects’ motion during pushing as there are no visual indications of the high friction location.
This dataset contains 1000 training interactions and 600 test interactions. This dataset contains a single object, with high weight (1.1 [kg] and 16.1 x 10.1 x 4.9 cm (LxWxH)), friction is altered by applying ‘60 grit’ sandpaper to different parts of the object resulting in the different outcomes of pushing interactions with the same visual scene (Fig. 6). The different locations of the sandpaper are the centre, the 4 corners, and the middle of the 4 edges of the box. The test set consists of 550 pushes with unseen friction locations and 50 pushes with previously seen friction locations. We use coloured markers to quantify object location and orientation during performance evaluation.
| Model name | TE | TP | SOP | MMFM | Model Size |
|---|---|---|---|---|---|
| SVG | 18’010’027 | ||||
| SVG-TE | ✓ | 18’115’327 | |||
| SVTG | ✓ | ✓ | 38’766’766 | ||
| SPOTS | ✓ | ✓ | 21’051’051 | ||
| SPOTS-small | ✓ | ✓ | 18’250’180 | ||
| SPOTS-SOP | ✓ | ✓ | ✓ | 21’026’475 |
Edge case subset We identified that in many cases the impact of object friction location does not have a large enough impact on the future position and orientation of the object during short pushing actions. Nonetheless, we speculate that the impact of friction on longer interactive tasks will be significant. It is in edge cases, typically where the object is being pushed for 4 seconds in the middle that the impact of the friction location creates an unknowable scenario for the vision-alone system. These edge cases are essential for the exploration of our problem and so we create a simple subset of 4 test cases shown in figure 6. The test cases contain the object at the same location, with the friction location at each corner of the box respectively. Despite the exact same robot action, the final location of the object is drastically different, producing a good test case for qualitative analysis.
| Model | MAE | PSNR | SSIM |
|---|---|---|---|
| SVG | 0.0100 4.8 | 81.1243 2.8 | 0.9809 1.4 |
| SVG-TE | 0.0100 9.3 | 81.1274 5.4 | 0.9808 2.9 |
| SVTG | 0.0109 3.2 | 80.3639 1.7 | 0.9783 1.0 |
| SPOTS | 0.0099 4.3 | 81.1979 2.5 | 0.9812 1.3 |
| SPOTS-small | 0.0099 1.7 | 81.2247 9.8 | 0.9812 5.1 |
| SPOTS-SOP | 0.0100 4.5 | 81.1424 2.6 | 0.9809 1.3 |
| MAE t+5 | PSNR t+5 | SSIM t+5 | |
| SVG | 0.0112 5.9 | 79.5207 3.3 | 0.9766 1.8 |
| SVG-TE | 0.0112 2.2 | 79.5484 2.2 | 0.9767 8.9 |
| SVTG | 0.0129 5.5 | 78.6714 1.7 | 0.9715 2.0 |
| SPOTS | 0.0113 4.8 | 79.5417 1.5 | 0.9766 1.4 |
| SPOTS-small | 0.0112 5.0 | 79.5703 3.7 | 0.9767 1.1 |
| SPOTS-SOP | 0.0114 7.8 | 79.5014 3.5 | 0.9764 2.5 |
VI Evaluation
In this section, we aim to answer if the inclusion of tactile sensation during physical robot interactions can improve an agent’s cause-effect understanding during PRI. To test this, we compare the same video prediction system, SVG, with and without tactile integration. The tactile integrated versions of SVG are described in section IV and all the versions of models we test are summarised in the table I. With these models, we perform a comparative study on the key features and layers of the developed prediction models.
The key objective of this research is to investigate if the inclusion of tactile sensation can improve an agent’s scene predictions. To do so, we use the two action-conditioned tactile pushing datasets to evaluate the different models proposed above, making comparisons to non-tactile included methods to evaluate improved performance. The goals of our experiments are to:
-
1.
Evaluate the overall performance of the proposed video prediction models in comparison to the non-tactile video prediction model counterpart.
-
2.
Test how the models generalise to new, unseen objects.
-
3.
Compare the different multi-modal prediction models and evaluate which architecture develops the best physical interaction perception.
-
4.
Explore the impact of tactile sensation during test cases through anaesthetisation of the multi-modal models.
-
5.
Evaluate the predicted tactile features of the multi-modal prediction models.
Evaluation metrics: We perform an evaluation using 3 different metrics: Peak Signal-to-Noise Ration (PSNR), Structural Similarity (SSIM), and Mean Absolute Error (MAE). These provide a pixel-wise comparison between predicted frames and ground truth frames. The marked object dataset enables a performance metric that uses the ground truth and predicted marker centroids. In practice, however, the model predictions do not recreate these markers within their predicted scenes, so a marker-based performance metric is not applicable. In addition, we present and evaluate the performance of models qualitatively. For this, we focus on the edge case subset, which enables specific analyses of key details that amplify and highlight differences between the models.
Training and Test Procedure The scene images are resized to . The models are trained end-to-end with the method shown in [7], replacing the inference model used during training with the learned prior for testing. Models were written in PyTorch with training and testing performed on two Nvidia RTX A6000 GPU’s.
| Model | MAE | MAE t+5 | PSNR | SSIM |
|---|---|---|---|---|
| Visually Identical Dataset | ||||
| SVG | 0.0100 9.73 | 0.0122 1.59 | 78.7258 5.65 | 0.9647 3.52 |
| SVG-TE | 0.0098 9.37 | 0.0120 1.96 | 78.9524 6.61 | 0.9659 4.05 |
| SVTG | 0.0109 1.33 | 0.0129 3.33 | 79.0638 6.99 | 0.9630 3.14 |
| SPOTS | 0.0099 1.89 | 0.0119 2.39 | 79.0778 1.20 | 0.9661 8.34 |
| SPOTS-small | 0.0099 1.39 | 0.0120 2.19 | 79.0938 1.32 | 0.9660 7.93 |
| SPOTS-SOP | 0.0099 6.82 | 0.0119 1.37 | 79.1263 8.09 | 0.9662 5.50 |
| Visually Identical Edge Case Subset | ||||
| SVG | 0.0104 1.19 | 0.0129 4.71 | 77.5338 1.18 | 0.9586 9.95 |
| SVG-TE | 0.0095 2.34 | 0.0116 4.10 | 78.6620 2.69 | 0.9650 1.62 |
| SVTG | 0.0101 2.30 | 0.0115 3.04 | 78.8688 4.18 | 0.9627 2.20 |
| SPOTS | 0.0093 3.33 | 0.0113 5.49 | 79.1245 2.32 | 0.9666 1.24 |
| SPOTS-small | 0.0091 2.30 | 0.0110 2.11 | 79.2577 2.38 | 0.9671 1.07 |
| SPOTS-SOP | 0.0092 1.66 | 0.0111 3.11 | 79.1381 1.54 | 0.9666 5.37 |
| Visually Identical Edge Case Subset - Anaesthetised | ||||
| SVG | 0.0104 1.19 | 0.0129 4.71 | 77.5335 1.18 | 0.9586 9.95 |
| SVG-TE | 0.0113 6.34 | 0.0145 1.13 | 76.8562 5.58 | 0.9542 4.10 |
| SVTG | 0.0217 4.69 | 0.0271 9.01 | 72.4685 1.80 | 0.9014 2.12 |
| SPOTS | 0.0108 2.86 | 0.0131 6.85 | 77.5330 2.59 | 0.9575 1.73 |
| SPOTS-small | 0.0113 6.27 | 0.0135 8.44 | 77.1867 4.48 | 0.9549 3.60 |
| SPOTS-SOP | 0.0110 8.38 | 0.0132 1.04 | 77.4204 6.48 | 0.9568 4.59 |
VI-A Quantitative Scene Analysis
We show the performance of each model in Table II and III for the Household Cluster and Visually Identical datasets respectively. Each table shows both the average performance over the prediction horizon and the prediction performance at the last time step in the prediction horizon. Each model is trained 10 times with different seeds, the 95% confidence intervals are shown alongside.
Small deviations in test performance on the Household Cluster Dataset indicate little difference between the tactile-enabled models and the vision-only model. SPOTS-small performs best over the whole prediction horizon and the last time frame.
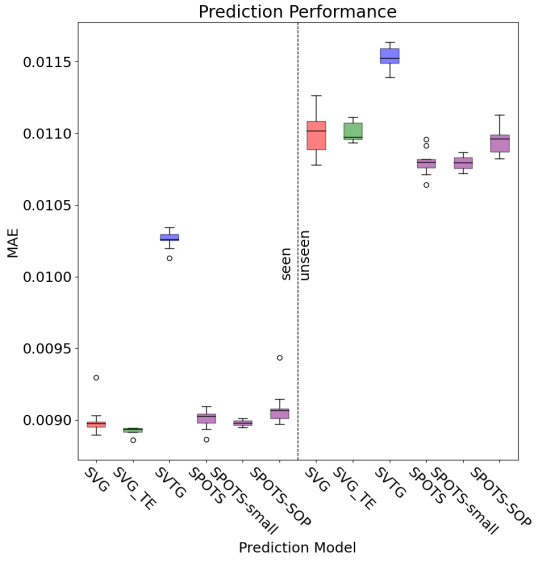
The performance of the models is broken down in Fig. 7. Here the tests are split into clusters with seen and unseen objects. For objects seen in the training set, SVG, SVG-TE, and the SPOTS models are able to perform to a similar level. However, for new object clusters (meaning the clusters consist of unseen objects), the SPOTS systems outperform SVG and SVG-TE. This suggests that the tactile-enabled and disabled models are capable of similar predictions on objects they have already seen because they have an understanding of the objects’ physical properties from experience, but the SPOTS models are capable of also generating this physical understanding on new objects it has not seen before, thus producing more accurate predictions. These test results also highlight the importance of tactile prediction (SPOTS) over tactile conditioning (SVG-TE) when an agent is predicting with new objects. There is also shown to be a significant negative impact from performing simultaneous tactile and scene prediction with a single pipeline approach (SVTG).
The prediction results in Table III are across the Visually Identical test dataset and the Edge Case test subset. These results complement the Household Cluster dataset results. Showing that multi-modal models outperform the vision-only model (other than SVTG). Testing on the edge case subset shows significant increases in the performance of the same tactile-enabled models, suggesting the tactile-enabled models are capable of physical interactions in identical visual scenes that have different physical properties. The parameter size differences between the tactile-enabled models appear to have little impact, SPOTS-small has roughly the same number of weights as SVG but is capable of prediction in these visually identical settings. Furthermore, results suggest smaller model size has a beneficial impact as the smaller SPOTS model has improved performance in comparison to its larger, identical SPOTS model.
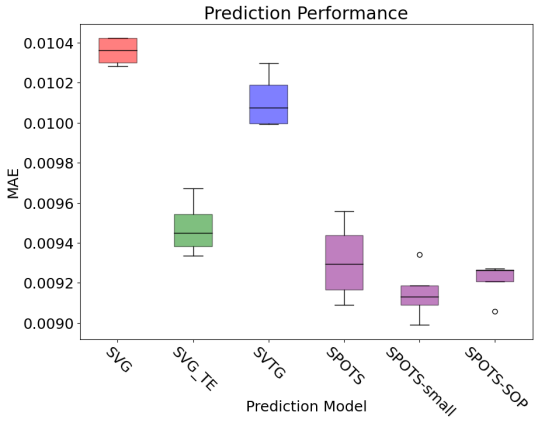
The single pipeline multi-modal prediction system SVTG performs worse than SVG across the whole household dataset but outperforms SVG on the visually identical dataset. This indicates that although the model produces poor visual predictions in scenes where tactile sensation is not required, the system is still capable of utilising tactile sensation for scenes where it is required. Thus, the poor visual prediction performance from this model indicates high object blur, not poor physical interaction understanding. These results are highlighted by the box and whisker plots in Fig. 8, showing the ability of the dual pipeline systems (SPOTS, SPOTS-STP, and SPOTS-small) to outperform other scene prediction methods, showing an improved understanding of the physical dynamics in the system.
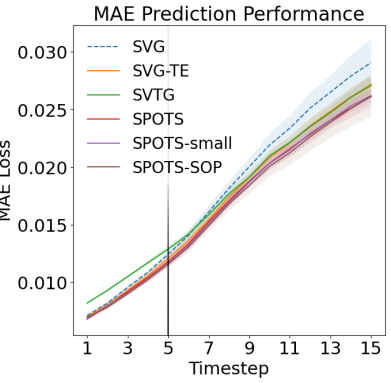
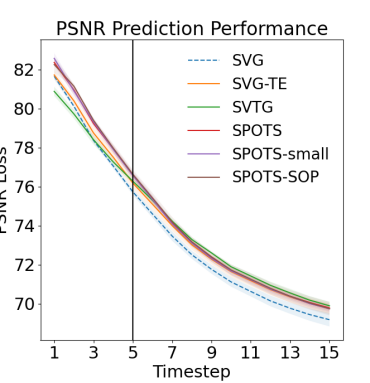
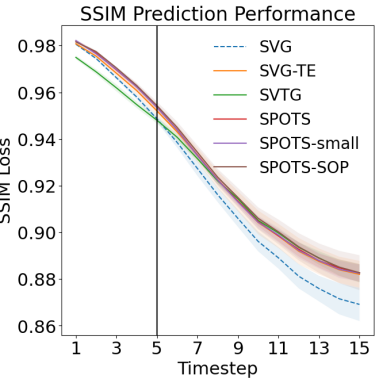
We show the test performance over extended prediction horizons in Fig. 9. These graphs are applied to the edge case subset and show that prediction of the performance of the tactile-enabled models become progressively more robust in comparison to the non-tactile model SVG. As uncertainty increases over the time horizon, these results show that although the non-tactile-enabled model produces similar performance at the beginning, its limited cause-effect understanding creates worsening predictions at extended prediction lengths. Likewise, the plots show that our model SVTG, despite producing significantly worse predictions during early time steps, it improved cause-effect understating enabling the system to outperform SVG over longer time horizons.
Overall, quantitative analysis across the two datasets shows:
-
1.
The inclusion of tactile sensation into physical robot interaction prediction models improves the agent’s physical cause-effect understanding and interaction perception.
-
2.
The bio-inspired dual pipeline approach SPOTS, outperforms other methods of tactile integration, even with the same number of parameters.
-
3.
Tactile integration in the right way leads to better generalisation to new objects and prediction in edge cases such as visually identical objects with different physical properties.
-
4.
Tactile integration enables models to generate increasingly positive prediction performance in comparison to the non-tactile-enabled model over extended prediction horizons.
VI-B Qualitative Scene Analysis
Although quantitative analysis provides general insight into prediction performance, the performance metrics evaluate the whole image on a pixel-to-pixel comparison. To evaluate an agent’s physical interaction perception and understanding we can perform qualitative analysis. The key performance feature we are looking to observe is the location of the interacted object. Although in some applications, the crispness and overall look of an object are more important than its location in the scene, for physical interaction perception, predicted object location is the essential task.
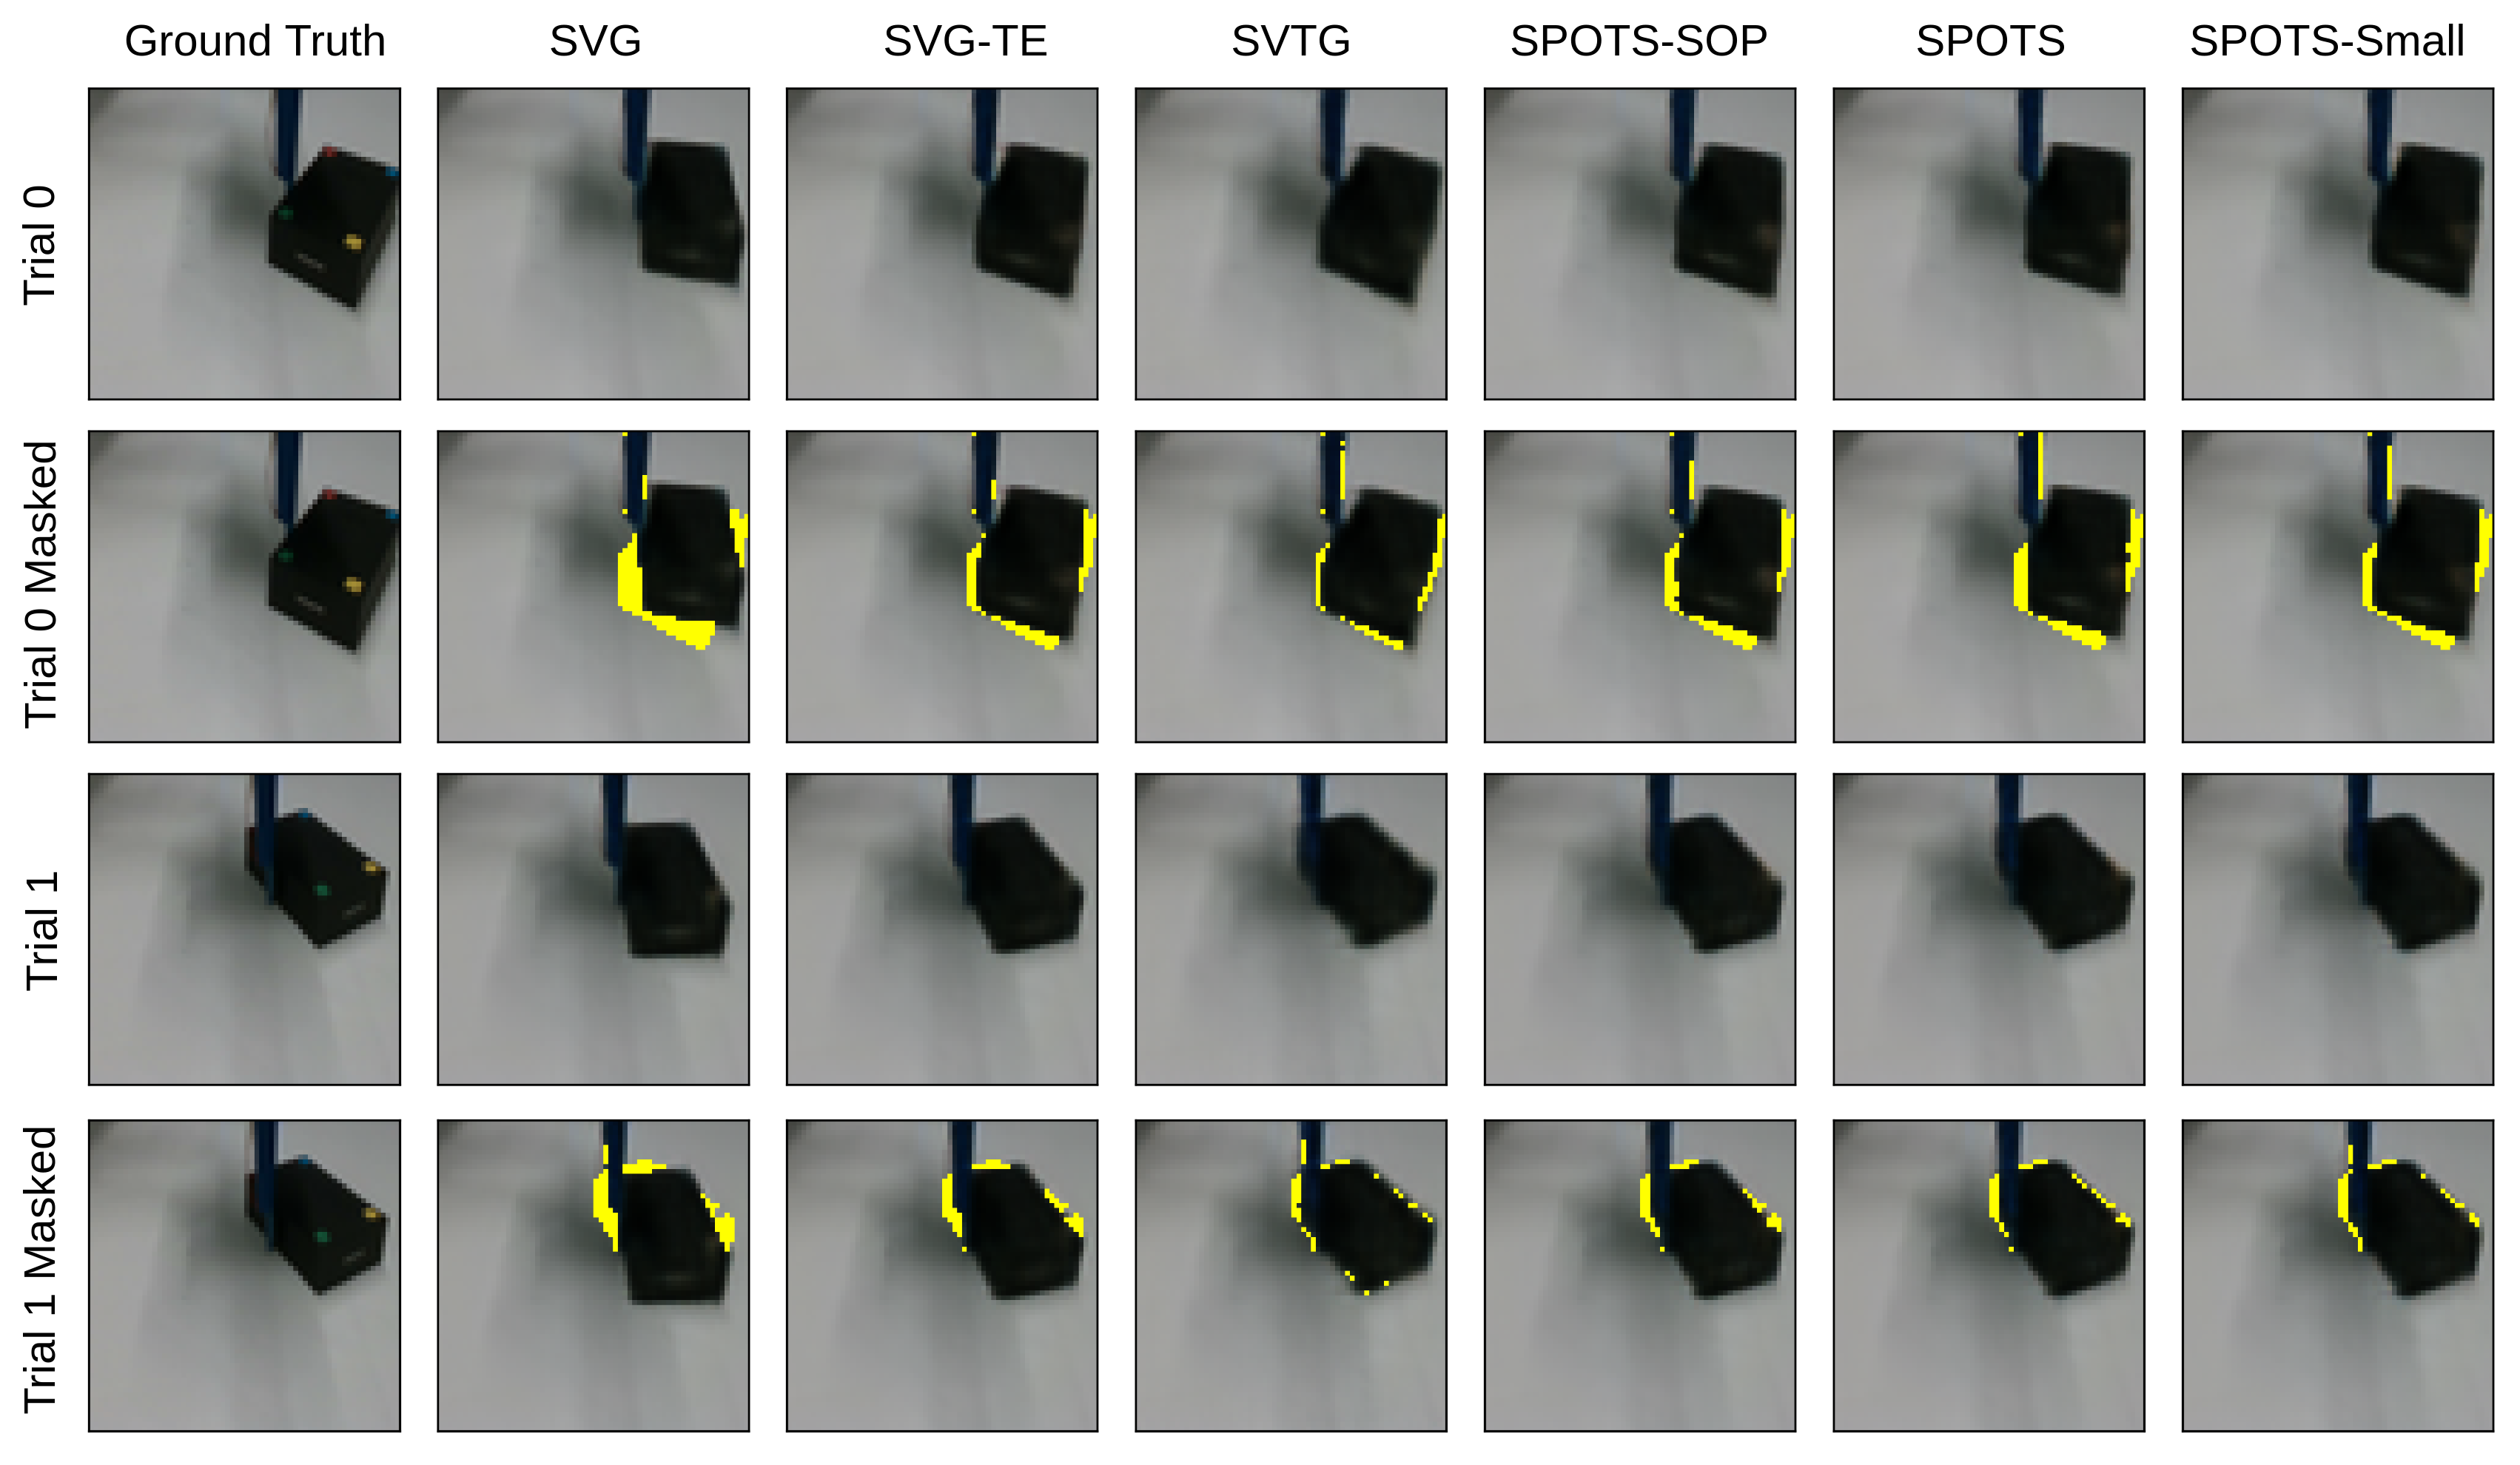
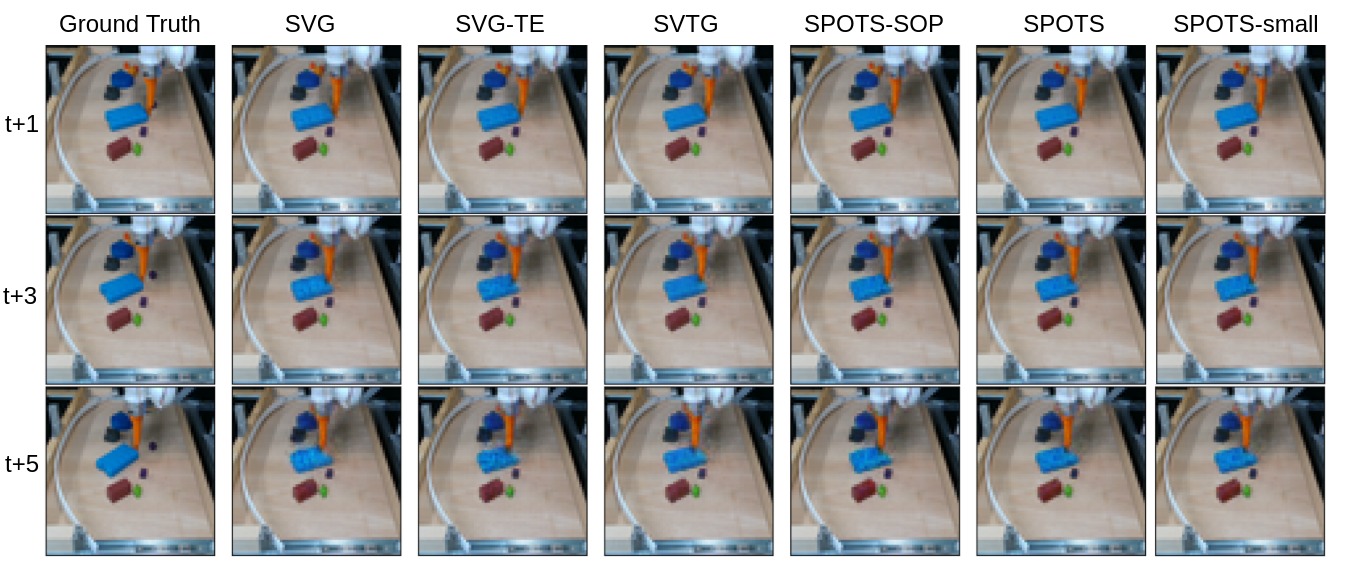
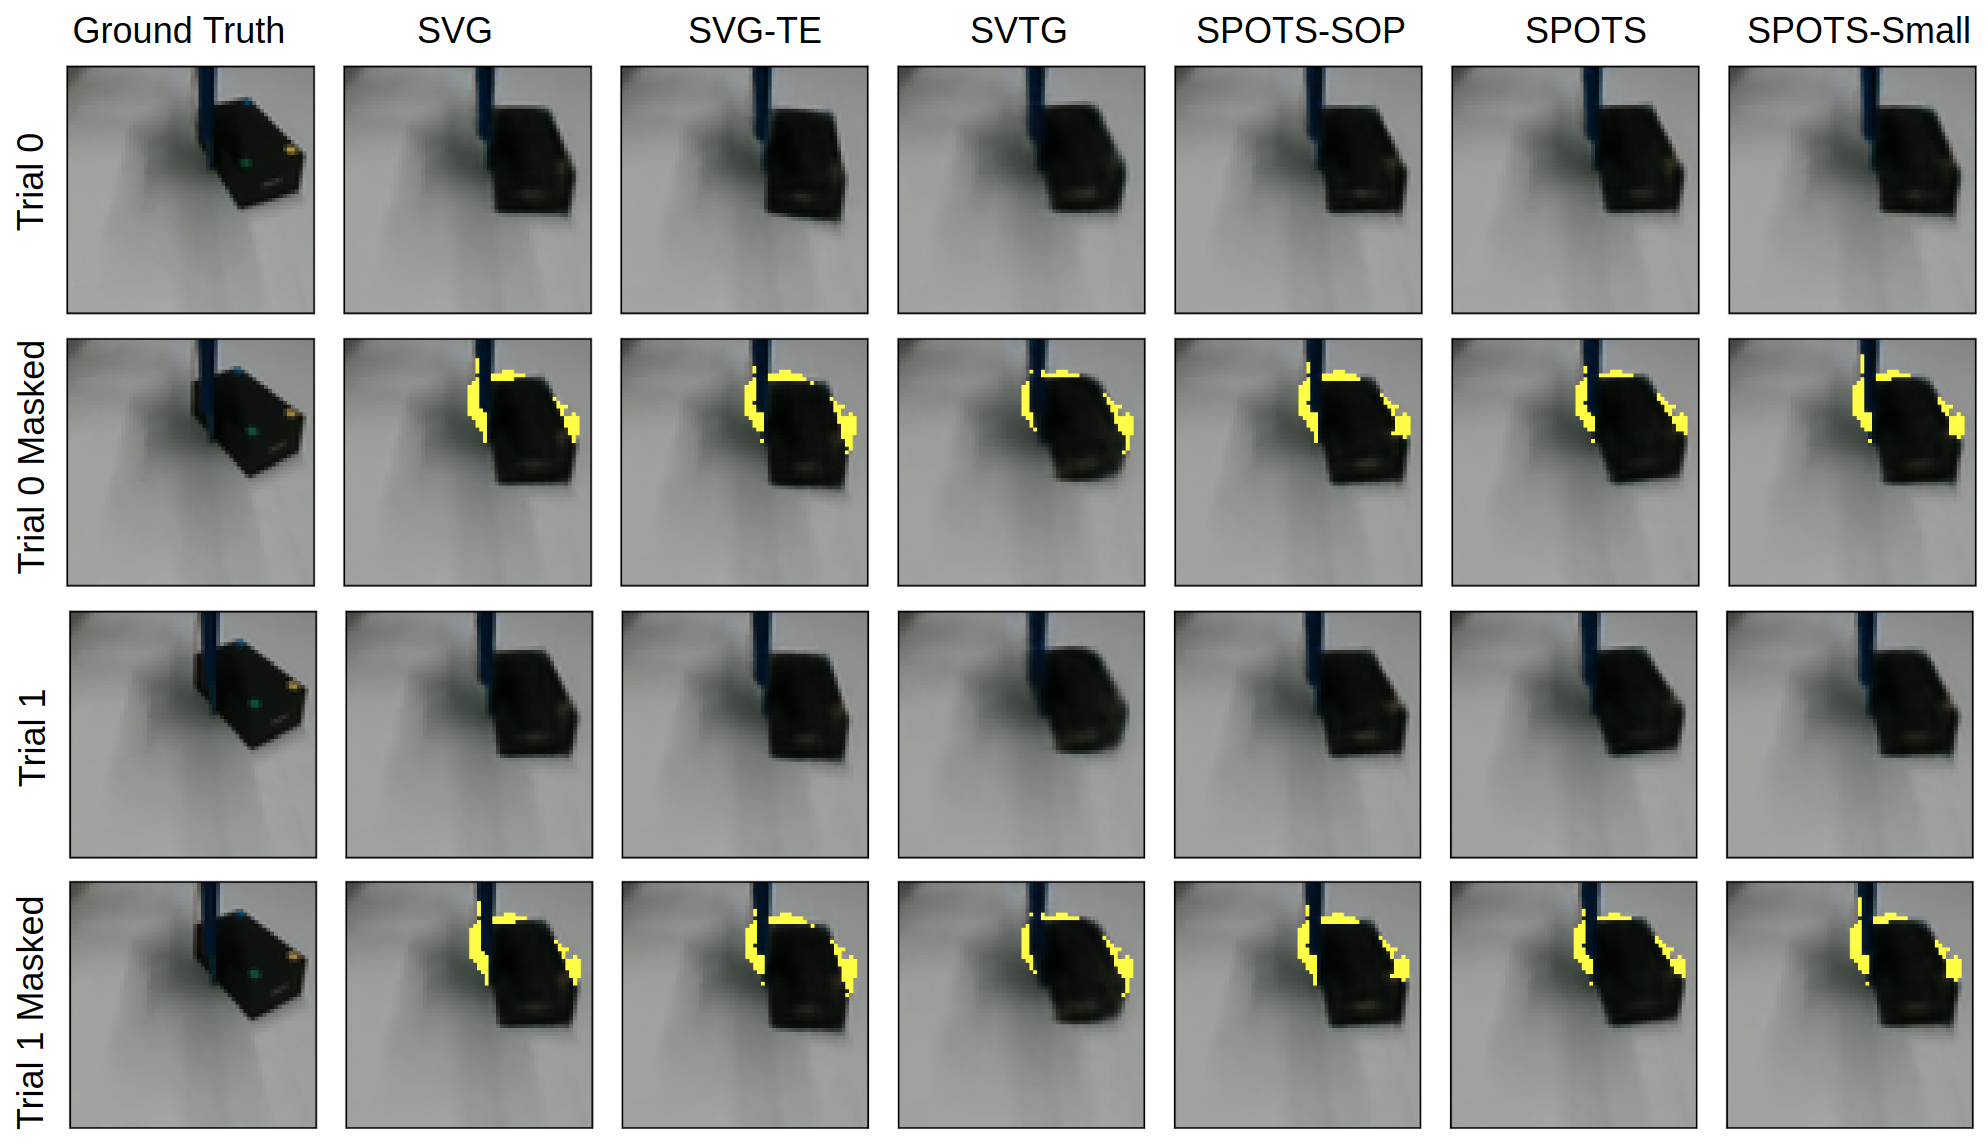
Fig. 11 shows the performance of models on the household clusters dataset. Similar to the quantitative analysis of the household cluster dataset, there is little deviation between prediction performance which makes qualitative analysis unreliable. However, the visually identical dataset and the edge case subset provide a more clear insight into the models’ physical interaction perception. Shown in Fig. 10 are the prediction results for each model at t+5 for the edge case trials shown in Fig 6. Rows 2 and 4 show the ground truth object location at t+5 in the prediction horizon highlighted in yellow, behind the given those models predicted the location of the object. These rows highlight the error in the predicted object location. The smaller the yellow region, the more overlap there is between the predicted object location and the true object location.
Within this task, we can visually see that the tactile-enabled models are capable of creating more accurate object location predictions. SVG is incapable of understanding the physical properties of the object. Despite poor performance metric scores, SVTG predicts the most accurate object locations, suggesting that although the model produces more inaccurate predictions with respect to our performance metrics, its overall physical interaction perception is more accurate.
As shown in the quantitative analysis, model size appears to have little impact on physical interaction perception, with both SPOTS and SPOTS-small producing similar strong predictions.
Overall, we observe that the impact of tactile sensation has a significant positive impact on video prediction performance. Despite better prediction scores of SPOTS, SVTG shows a slightly better performance qualitatively. Nonetheless, all tactile-enabled models display significant improvements in comparison to the non-tactile video prediction model. The comparison of the household object cluster dataset indicates that the tactile-enabled models perform to a similar standard within the context of predicting object location.
VI-C Anaesthetisation of Prediction Models
To further analyse the impact of tactile sensation on physical interaction perception at test time, we test each model with tactile data replaced with tactile values without contact. By anaesthetising the agent’s fingers, the system is unable to utilise the tactile features. The qualitative results of this test are shown in Fig. 12 and quantitative results in Table III. Qualitative analysis of the predictions at test time for the final time-step in the prediction horizon is shown as well as the overlaid prediction with the ground truth object location masked in yellow. Both quantitative and qualitative results show that the prediction performance of the tactile-enabled models is equal to the non-tactile-enabled comparison model, SVG.
This experiment shows that the impact of tactile sensation on an agent’s cause-effect understanding of the hidden state of robot-object interaction due to its ability to update its internal understanding in real-time. From context tactile sensation, the tactile-enabled models are capable of performing improved predictions. This experiment shows that the unsupervised learning process does not improve tactile-enabled models’ ability to estimate the physical properties of an object from visual sensation alone. For evidence of improved visual understanding, we would expect to see the tactile-enabled models still performing more accurate predictions during tactile occlusion.
This experiment indicates the requirement of tactile sensation for an agent’s physical interaction perception at test time, not just during the training process.
VI-D Tactile Prediction in Physical Robot Interactions
In this section, we explore the tactile prediction aspect of some of the models implemented. Tactile prediction, although not the purpose of the simultaneous scene and tactile prediction models, is a key extracted feature that we wish to explore. Tactile prediction is a new area of research and has been shown to enable physical robot interactions to proactively adapt during manipulation tasks [21]. When analysing tactile prediction with the Xela uSkin tactile sensor, quantitative analysis like MAE, PSNR, and SSIM, does not provide insight into tactile prediction performance, showing that qualitative analysis represents a more realistic representation of prediction performance [20]. We show both but the discussion is focused on qualitative analysis.
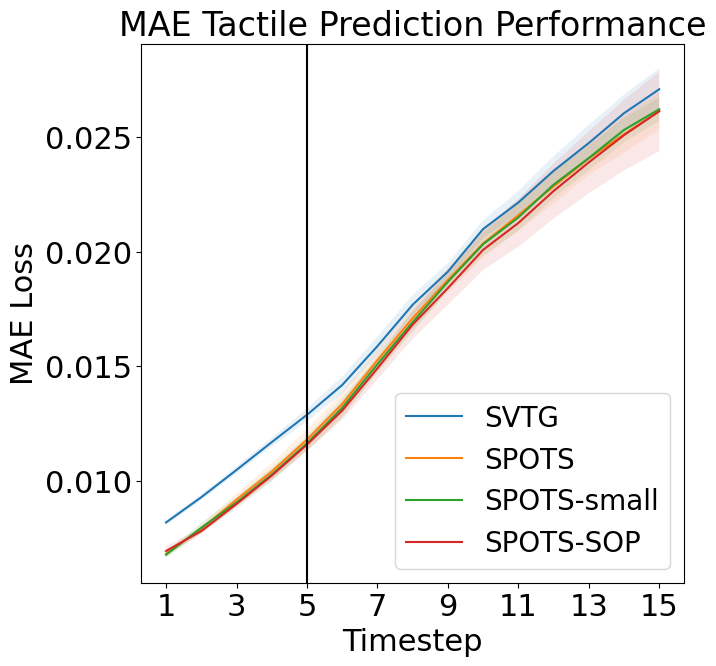
Fig. 13 (c) shows the Mean Absolute Error, for the models that predict tactile sensation, for an extended time horizon of 15 frames on the edge-case subset. This problem provides a complex setting for tactile prediction as the physical properties of the object have not been previously seen. The tactile prediction performances are similar, however, there is a slight decrease in the performance of the single pipeline prediction system SVTG. This is most likely due to the impact of using the same prediction pipeline for both modalities. SVG has been shown to be a worse tactile prediction model than the ACTP model used in SPOTS [20]. Although the impact of multi-modality appears to positively impact tactile prediction with the SVG architecture, it is still worse than the ACTP system. This finding highlights the benefit of the dual pipeline architectures, which allow separate architectures for the given modality. In future work, if other sensations like sound are to be integrated, we believe the same approach would help for auditory prediction as well as to have a positive impact on scene prediction.
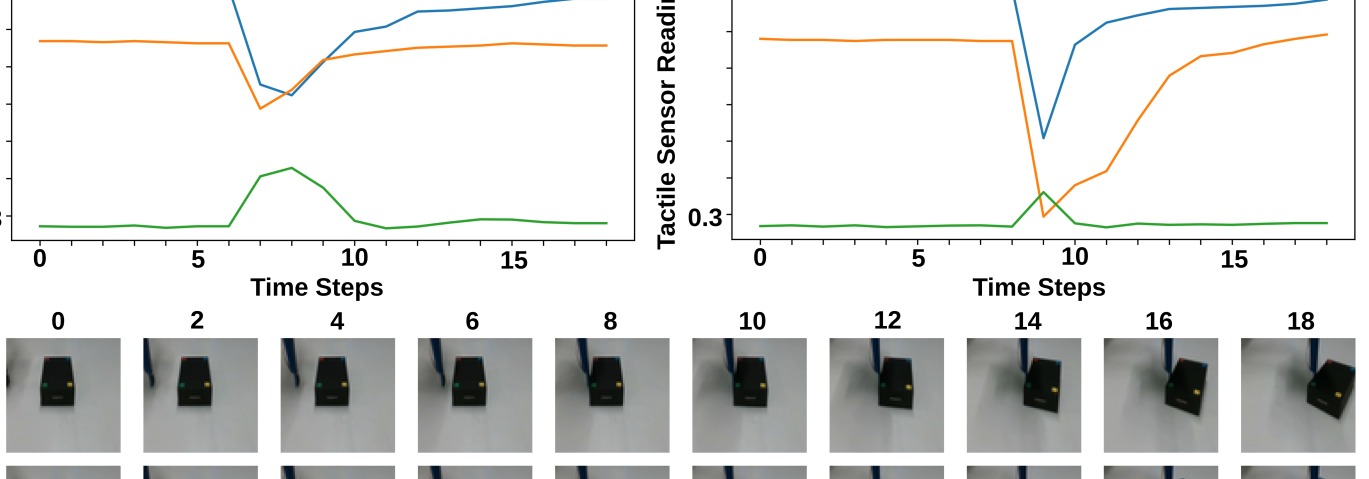
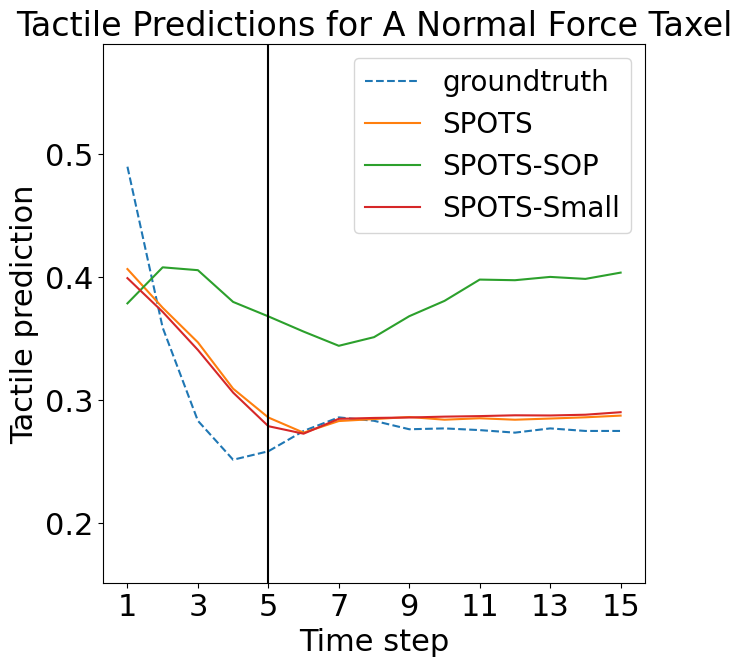
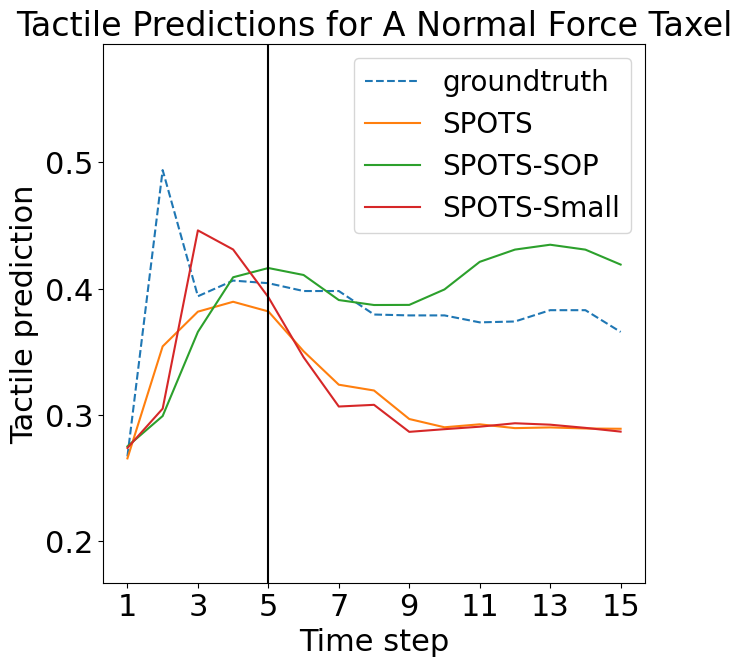
Qualitative prediction of SVTG and the SPOTS architectures is not possible as the two use different representations of the tactile data (SVTG uses a scaled-up image representation where as SPOTS uses a flattened vector). Fig. 13 (a) and 13 (b) show tactile prediction of a single feature in the predicted tactile feature vector representing a normal force. Although over the longer time horizons, the predictions are not accurate to the ground truth, for the trained length (5 frames) and a few after, the predictions show an ability to predict tactile sensation. Predicting both peaks (Fig. 13 (b)) and troughs (Fig. 13 (a)) in tactile sensation shows the models can predict the impact their future pushing action will have on the sensation they will feel. SPOTS-SOP appears to have slightly worse predictions during the early stages of the prediction horizon. This may be because the learned prior is only a representation of the scene data, instead of both scene and tactile, this lack of latent variable prediction in the tactile modality may negatively impact general tactile understanding and hence tactile prediction.
Overall, we find that both quantitatively and qualitatively the SPOTS model is capable of generating realistic tactile predictions across short prediction horizons. Indicating our multi-modal approach may further enable robotics in physical interaction tasks as predicted tactile sensation can be used for more robust and safer physical interactions through model predictive tactile control approach [21].
VI-E Discussion and Limitations
Although we use a simple low-resolution sensor, we believe research into which features and attributes of tactile sensation are useful for physical interaction perception is an interesting and required avenue for future research.
Both quantitative and qualitative results show that the inclusion of tactile sensation in visual prediction models produces more accurate scene predictions and an overall improved physical interaction perception.
Quantitative analysis, which assesses the accuracy of images on a pixel-by-pixel basis, shows the SPOTS multi-modal prediction architecture produces the most accurate predictions. SPOTS was also capable of better generalisation to new objects.
We believe SPOTS performs well at this level because the dual pipeline system enables the processing of tactile sensation to be external to the visual processing system, thus enabling the visual processing pipeline to produce more crisp predictions. This is evident as the single pipeline version, SVTG, produces significantly worse results by attempting to combine each of the modalities into one multi-modal prediction architecture.
Qualitative analysis allows us to assess the physical interaction perception of the models by analysing predicted object location, we observed that all the tactile integrated prediction architectures were capable of more accurate prediction when presented with visually identical scenes with objects of different physical properties. In the qualitative analysis section, we observe that SVTG, the worst-performing architecture in the quantitative analysis, performed best. Suggesting that there is a trade-off between realistic visual predictions and physical interaction perception. SVTG’s objects’ location prediction is the best, but the objects’ physical structure was the least visually realistic.
Overall, the best architecture depends on the downstream application. For realistic visual predictions, the SPOTS architecture is best. But for the best physical interaction perception, SVTG is best. Independent of the downstream application, these experiments show that an agent’s physical robot interactions should utilise tactile sensation as it improves an agent’s physical interaction perception.
The household cluster dataset produced poor prediction results from all models tested. The conclusion of the benefits of tactile sensation in physical interaction perception was mostly drawn from the second dataset. Improved models to predict the future scene frames for the household cluster dataset remain open for future work. Moreover, increasing the size of this dataset may contribute to the better performance of the models. The household cluster dataset contains 240’000 frames, however, similar datasets can be as large as 1’500’000 frames [8]. Furthermore, although objects in the dataset had complex geometry, they often contained uni-material surfaces, with evenly distributed weight, by including other objects the task may become more applicable to the tests. Finally, as dataset size can impact the rate of development and the multi-modal approach to physical interaction perception is novel, reducing the number of objects could enable meaningful comparison whilst allowing fast training for development.
Parameter size has an impact on prediction performance. The SPOTS-small model achieved better performance in comparison to SPOTS, suggesting that reduced parameter size can result in beneficial prediction. SVTG has a larger model size to account for the new modality (the hidden layers were doubled from 256 to 512 within the frame prediction network). Unlike SVTG, the SPOTS system uses the ACTP prediction model for its tactile prediction pipeline, which is a very small network (making up of the network parameters). One limitation of this study is that the large parameter size of the SVTG model may be negatively impacting its qualitative performance, in future work, a smaller hidden layer size may produce better results. Moreover, future works include investigating an optimal model size.
VII Conclusion
In conclusion, we presented a novel approach to improve video prediction accuracy in physical robot interactions by utilising tactile sensation as a second sensory modality. Our multi-modal approach was explored with a variety of possible model architectures, and we showed that the inclusion of tactile sensation has a positive impact on video prediction accuracy during robot pushing. Moreover, we demonstrated that the simultaneous prediction of tactile and image data has the greatest positive impact, suggesting that multi-modal prediction models are able to utilise the predictions of the opposite modality to boost performance and physical interaction perception performance.
While our work presents baseline approaches, we believe that the increased benefit of prediction understanding with multi-modal prediction systems can be explored in all physical robot interaction tasks, such as object grasping and manipulation, human-robot interaction, and tactile exploration. We also believe that the introduction of auditory sensation to these prediction systems may further increase an agent’s physical interaction perception and cause-effect understanding, enabling interaction in even more complex scenes.Furthermore, another direction for work may also be exploring the wide range of tactile sensing devices and their attributes like temperature, vibration, and texture sensing.
Our approach to video prediction in physical robot interaction enables a wide range of future works, and we believe that the unsupervised learning approach makes the development of models in this setting simple and cost-effective, further enabling future work in physical interaction domains such as robotic surgery, human-robot interaction, elderly care, and food processing and harvesting. Overall, our work highlights the potential of multi-modal prediction models for physical interaction perception and presents exciting opportunities for future research in this field.
Acknowledgments
Thank you to Jon Flynn, Karoline Heiwolt and Kiyanoush Nazari for your important discussions on this work.
VIII References Section
References
- [1] Mohammad Babaeizadeh, Chelsea Finn, Dumitru Erhan, Roy H Campbell, and Sergey Levine. Stochastic variational video prediction. arXiv preprint arXiv:1710.11252, 2017.
- [2] Matteo Bregonzio, Shaogang Gong, and Tao Xiang. Recognising action as clouds of space-time interest points. In 2009 IEEE conference on computer vision and pattern recognition, pages 1948–1955. IEEE, 2009.
- [3] Gabriel J Brostow, Julien Fauqueur, and Roberto Cipolla. Semantic object classes in video: A high-definition ground truth database. Pattern Recognition Letters, 30(2):88–97, 2009.
- [4] Shaoyu Cai, Kening Zhu, Yuki Ban, and Takuji Narumi. Visual-tactile cross-modal data generation using residue-fusion gan with feature-matching and perceptual losses. IEEE Robotics and Automation Letters, 6(4):7525–7532, 2021.
- [5] Berk Calli, Arjun Singh, Aaron Walsman, Siddhartha Srinivasa, Pieter Abbeel, and Aaron M Dollar. The ycb object and model set: Towards common benchmarks for manipulation research. In 2015 international conference on advanced robotics (ICAR), pages 510–517. IEEE, 2015.
- [6] Sudeep Dasari, Frederik Ebert, Stephen Tian, Suraj Nair, Bernadette Bucher, Karl Schmeckpeper, Siddharth Singh, Sergey Levine, and Chelsea Finn. Robonet: Large-scale multi-robot learning. arXiv preprint arXiv:1910.11215, 2019.
- [7] Emily Denton and Rob Fergus. Stochastic video generation with a learned prior. In International Conference on Machine Learning, pages 1174–1183. PMLR, 2018.
- [8] Frederik Ebert, Chelsea Finn, Alex X Lee, and Sergey Levine. Self-supervised visual planning with temporal skip connections. In CoRL, pages 344–356, 2017.
- [9] Chelsea Finn, Ian Goodfellow, and Sergey Levine. Unsupervised learning for physical interaction through video prediction. arXiv preprint arXiv:1605.07157, 2016.
- [10] Andreas Geiger, Philip Lenz, Christoph Stiller, and Raquel Urtasun. Vision meets robotics: The kitti dataset. The International Journal of Robotics Research, 32(11):1231–1237, 2013.
- [11] Julia Henschke, Toemme Noesselt, Henning Scheich, and Eike Budinger. Possible anatomical pathways for short-latency multisensory integration processes in primary sensory cortices. Brain structure & function, 220, 01 2014.
- [12] Xinyu Huang, Xinjing Cheng, Qichuan Geng, Binbin Cao, Dingfu Zhou, Peng Wang, Yuanqing Lin, and Ruigang Yang. The apolloscape dataset for autonomous driving. In Proceedings of the IEEE conference on computer vision and pattern recognition workshops, pages 954–960, 2018.
- [13] Catalin Ionescu, Dragos Papava, Vlad Olaru, and Cristian Sminchisescu. Human3.6m: Large scale datasets and predictive methods for 3d human sensing in natural environments. IEEE Transactions on Pattern Analysis and Machine Intelligence, 36(7):1325–1339, 2014.
- [14] Roland S Johansson and J Randall Flanagan. Coding and use of tactile signals from the fingertips in object manipulation tasks. Nature Reviews Neuroscience, 10(5):345–359, 2009.
- [15] Solomon Kullback and Richard A Leibler. On information and sufficiency. The annals of mathematical statistics, 22(1):79–86, 1951.
- [16] Alex X Lee, Richard Zhang, Frederik Ebert, Pieter Abbeel, Chelsea Finn, and Sergey Levine. Stochastic adversarial video prediction. arXiv preprint arXiv:1804.01523, 2018.
- [17] Jet-Tsyn Lee, Danushka Bollegala, and Shan Luo. “touching to see” and “seeing to feel”: Robotic cross-modal sensory data generation for visual-tactile perception. In 2019 International Conference on Robotics and Automation (ICRA), pages 4276–4282. IEEE, 2019.
- [18] Michelle A Lee, Yuke Zhu, Peter Zachares, Matthew Tan, Krishnan Srinivasan, Silvio Savarese, Li Fei-Fei, Animesh Garg, and Jeannette Bohg. Making sense of vision and touch: Learning multimodal representations for contact-rich tasks. IEEE Transactions on Robotics, 36(3):582–596, 2020.
- [19] Yunzhu Li, Jun-Yan Zhu, Russ Tedrake, and Antonio Torralba. Connecting touch and vision via cross-modal prediction. In Proceedings of the IEEE/CVF Conference on Computer Vision and Pattern Recognition, pages 10609–10618, 2019.
- [20] Willow Mandil, Kiyanoush Nazari, and Amir Ghalamzan E. Action conditioned tactile prediction: a case study on slip prediction. In Robotics: Science and Systems (RSS), 2022.
- [21] Kiyanoush Nazari, Willow Mandil, et al. Proactive slip control by learned slip model and trajectory adaptation. arXiv preprint arXiv:2209.06019, 2022.
- [22] Jude Nicholas. From Active Touch to Tactile Communication: What’s Tactile Cognition Got to Do with It? Danish Resource Centre on Congenital Deafblindness, 2010.
- [23] Junhyuk Oh, Xiaoxiao Guo, Honglak Lee, Richard L Lewis, and Satinder Singh. Action-conditional video prediction using deep networks in atari games. Advances in neural information processing systems, 28, 2015.
- [24] Masahiro Ohka, Hiroaki Kobayashi, and Yasunaga Mitsuya. Sensing characteristics of an optical three-axis tactile sensor mounted on a multi-fingered robotic hand. In 2005 IEEE/RSJ International Conference on Intelligent Robots and Systems, pages 493–498. IEEE, 2005.
- [25] Sergiu Oprea, Pablo Martinez-Gonzalez, Alberto Garcia-Garcia, John Alejandro Castro-Vargas, Sergio Orts-Escolano, Jose Garcia-Rodriguez, and Antonis Argyros. A review on deep learning techniques for video prediction. IEEE Transactions on Pattern Analysis and Machine Intelligence, 2020.
- [26] Lerrel Pinto, Dhiraj Gandhi, Yuanfeng Han, Yong-Lae Park, and Abhinav Gupta. The curious robot: Learning visual representations via physical interactions. In European Conference on Computer Vision, pages 3–18. Springer, 2016.
- [27] MarcAurelio Ranzato, Arthur Szlam, Joan Bruna, Michael Mathieu, Ronan Collobert, and Sumit Chopra. Video (language) modeling: a baseline for generative models of natural videos. arXiv preprint arXiv:1412.6604, 2014.
- [28] Xela Robotics. Xela robotics uskin magnetic tactile sensor. https://xelarobotics.com/, High-density 3-axis tactile sensor, 4x4 array, 2020.
- [29] Christian Schuldt, Ivan Laptev, and Barbara Caputo. Recognizing human actions: a local svm approach. In Proceedings of the 17th International Conference on Pattern Recognition, 2004. ICPR 2004., volume 3, pages 32–36. IEEE, 2004.
- [30] Umer Hameed Shah, Rajkumar Muthusamy, Dongming Gan, Yahya Zweiri, and Lakmal Seneviratne. On the design and development of vision-based tactile sensors. Journal of Intelligent & Robotic Systems, 102(4):1–27, 2021.
- [31] Nitish Srivastava, Elman Mansimov, and Ruslan Salakhudinov. Unsupervised learning of video representations using lstms. In International conference on machine learning, pages 843–852. PMLR, 2015.
- [32] Kurt A Thoroughman and Reza Shadmehr. Learning of action through adaptive combination of motor primitives. Nature, 407(6805):742–747, 2000.
- [33] Mohsin I Tiwana, Stephen J Redmond, and Nigel H Lovell. A review of tactile sensing technologies with applications in biomedical engineering. Sensors and Actuators A: physical, 179:17–31, 2012.
- [34] Ya-weng Tseng, Jörn Diedrichsen, John W Krakauer, Reza Shadmehr, and Amy J Bastian. Sensory prediction errors drive cerebellum-dependent adaptation of reaching. Journal of neurophysiology, 98(1):54–62, 2007.
- [35] Ruben Villegas, Arkanath Pathak, Harini Kannan, Dumitru Erhan, Quoc V Le, and Honglak Lee. High fidelity video prediction with large stochastic recurrent neural networks. Advances in Neural Information Processing Systems, 32:81–91, 2019.
- [36] Ruben Villegas, Jimei Yang, Seunghoon Hong, Xunyu Lin, and Honglak Lee. Decomposing motion and content for natural video sequence prediction. arXiv preprint arXiv:1706.08033, 2017.
- [37] Ruben Villegas, Jimei Yang, Yuliang Zou, Sungryull Sohn, Xunyu Lin, and Honglak Lee. Learning to generate long-term future via hierarchical prediction. In international conference on machine learning, pages 3560–3569. PMLR, 2017.
- [38] Benjamin Winstone, Gareth Griffiths, Chris Melhuish, Tony Pipe, and Jonathan Rossiter. Tactip—tactile fingertip device, challenges in reduction of size to ready for robot hand integration. In 2012 IEEE International Conference on Robotics and Biomimetics (ROBIO), pages 160–166. IEEE, 2012.
- [39] Daniel M Wolpert and J Randall Flanagan. Motor prediction. Current biology, 11(18):R729–R732, 2001.
- [40] Wenzhen Yuan, Siyuan Dong, and Edward H Adelson. Gelsight: High-resolution robot tactile sensors for estimating geometry and force. Sensors, 17(12):2762, 2017.
- [41] Hanafiah Yussof, Jiro Wada, and Masahiro Ohka. Sensorization of robotic hand using optical three-axis tactile sensor: Evaluation with grasping and twisting motions. 2010.
- [42] Xingru Zhou, Zheng Zhang, Xiaojun Zhu, Houde Liu, and Bin Liang. Learning to predict friction and classify contact states by tactile sensor. In 2020 IEEE 16th International Conference on Automation Science and Engineering (CASE), pages 1243–1248. IEEE, 2020.
IX Biography Section
![[Uncaptioned image]](/html/2304.11193/assets/Willow-Mandil-180x180.jpg) |
Willow Mandil received the B.Eng degree in robotics from the University of the West of England, UK, in 2017 and the M.Sc in Robotics and Automation from the University of Lincoln, UK, in 2022. He is currently a Ph.D. student at the University of Lincoln, Uk. His research is in physical robot interaction and manipulation, with a focus to agricultural technology. His research interests are machine learning, physical robot interaction, tactile sensation, computer vision, robot manipulation and control. |
![[Uncaptioned image]](/html/2304.11193/assets/Amir-180x180.jpg) |
Amir Ghalamzan Esfahini holds a B.Sc. and M.Sc. in Mechanical engineering (Urmia University and IUST, IRAN), an M.Sc. (Second level Specialisation-graduated cum laude) in Automatic Control Engineering (Politecnico di Torino, Italy) and a PhD in Information Technology-Robotics (Politecnico di Milano, Italy). He was a Senior Research Fellow at the University of Birmingham, UK, for three years. He is an now Associate Professor of Robotics at Lincoln Agri-Robotics, University of Lincoln, UK. |