Digging deeper into NGC 6868 I: stellar population
Abstract
We use Gemini integral field unit observations to map the stellar population properties in the inner region ( pc2) of the galaxy NGC 6868. In order to understand the physical and chemical properties of the stellar content of this galaxy, we performed stellar population synthesis using the starlight code with the MILES simple stellar population models. We measured the absorption line indices Fe4383, Mg2, Mgb, Fe5270, Fe5335 for the whole FoV, and used them to derive Fe3 and [MgFe]’. These indices were used to derive [\textalpha/Fe]. This galaxy is dominated by old metal-rich populations (12.6 Gyr; 1.0 and 1.6 Z⊙) with a negative metallicity gradient. We also found a recent ( Myr) metal-rich (1.6 Z⊙) residual star formation in the centre of the galaxy. A dust lane with a peak extinction in the V band of 0.65 mag is seen. No signs of ordered stellar motion are found and the stellar kinematics is dispersion dominated. All indices show a spatial profile varying significantly along the FoV. Mg2 shows a shallow gradient, compatible with the occurrence of mergers in the past. Mgb and Fe3 profiles suggest different enrichment processes for these elements. We observe three distinct regions: for R<100 pc and R>220 pc, Mg2, Mgb anti correlate with respect to Fe3 and [MgFe]’, and for 100 pc<R<220 pc, they correlate, hinting at different enrichment histories. The [\textalpha/Fe] profile is really complex and has a central value of dex. We interpret this as the result of a past merger with another galaxy with a different [\textalpha/Fe] history, thus explaining the [\textalpha/Fe] maps.
keywords:
galaxies: individual (NGC 6868), galaxies: nuclei, galaxies: elliptical and lenticular, cD, galaxies: stellar content1 Introduction
Galaxies can widely be defined as either passive, that are not actively forming stars and host a red and old stellar population, and star-forming galaxies, that are blue, hosting large fractions of young stellar populations. This bi-modality was found in many studies over the years (e.g. Kauffmann et al., 2003; Baldry et al., 2004; Noeske et al., 2007; Wetzel et al., 2012; van der Wel et al., 2014), even at high redshifts ( Brammer et al., 2009; Muzzin et al., 2013, for example). However, it is not yet clear which mechanisms are regulating star formation and transforming the blue galaxies into red-and-dead ones. A major challenge in modern astrophysics is to determine the physical mechanism acting in quenching star formation in galaxies.
Nowadays, it is established that active galactic nuclei (AGN) feedback plays an important role in regulating the star formation (SF) of its host galaxy (Di Matteo et al., 2005; Hopkins & Elvis, 2010; Harrison, 2017; Storchi-Bergmann & Schnorr-Müller, 2019; Riffel et al., 2021; Ellison et al., 2021). The gas inflowing, responsible for SF, also feeds the supermassive black hole (SMBH), triggering the AGN episode that can either heat (or expel) the gas, thus shutting down the SF (Fabian, 2012; King & Pounds, 2015; Zubovas & Bourne, 2017; Trussler et al., 2020). In cosmological simulations without including AGN and supernova (SN) feedback, the observed luminosity function of galaxies cannot be reproduced: the larger and smaller galaxies end up with higher masses than observed in the present-day universe (Springel et al., 2005). Also, the ages of the stars from the most massive galaxies are underestimated when compared with observations (Croton et al., 2006). These results show that some form of gas striping or heating must be taking place in these objects. However, distinguishing the nature of such processes is still challenging, once the simulations cannot reach the physical scales involved and use ad hoc prescriptions to account for these mechanisms (Schaye et al., 2015). In order to really disentangle the effects of SN feedback and AGN we need to look at the vicinity of SMBH and trace the star formation history (SFH) of that population in order to understand the effect of the AGN in the stellar population (Riffel et al., 2021).
Past studies have tried to establish this link, but the results have been controversial. Despite SF being common in AGNs (Riffel et al., 2009; Ruschel-Dutra et al., 2017; Mallmann et al., 2018; Riffel et al., 2021; Burtscher et al., 2021; Dahmer-Hahn et al., 2021; Riffel et al., 2022), the time scale for starting the star formation ( Myr, Hickox et al., 2014; Burtscher et al., 2021) is far greater than for the AGN triggering ( Myr, Novak et al., 2011; Schawinski et al., 2015), preventing us from connecting the two. Some studies show a correlation between the fraction of young populations and the AGN luminosity, where the most luminous sources present the highest fraction (Riffel et al., 2009; Ruschel-Dutra et al., 2017; Zubovas & Bourne, 2017; Mallmann et al., 2018). However, the hard X-ray (14-195 keV) luminosity from the galaxies does not seem to correlate with the fraction of young populations (Burtscher et al., 2021). Instead, mass loss from intermediate-age stars seems to be important in AGN feeding (Riffel et al., 2022).
Most of the previous studies have been done on relatively bright objects. However, the most common form of AGN in the local Universe is low luminosity AGN (LLAGN) in massive galaxies (Ho, 2008). Most of them are classified as low-ionization nuclear emission-line region (LINER) objects (Heckman, 1980). However, despite their significance, the physical nature of these objects is still poorly understood. Since their discovery, many mechanisms have been proposed to explain the LINER signature beyond the LLAGN paradigm (Ferland & Netzer, 1983; Halpern & Steiner, 1983), once many other physical processes can mimic the same spectral signatures without the LLAGN (these objects are known as LIERs Cid Fernandes et al., 2011; Belfiore et al., 2016) such as shocks (Heckman, 1980), hot low-mass evolved stars (HOLMES) (Binette et al., 1994; Yan & Blanton, 2012; Papaderos et al., 2013; Singh et al., 2013; Belfiore et al., 2016; Oliveira et al., 2022) and starbursts with ages between 3 and 5 Myr, dominated by Wolf-Rayet stars (Barth & Shields, 2000). With current observational technology, one can disentangle the different ionization mechanisms by performing detailed spatially resolved studies analysing both the stellar population and the ionized gas components.
Even in the LLAGN hypothesis, the effects of such objects in their host galaxy are still uncertain as most studies focusing on the AGN impact over galaxies are performed with high-luminosity AGN (e.g. Seyferts and quasars, e.g. Nayakshin & Zubovas, 2012). With the rising importance of LINERs, new studies have been analysing such impacts, although a complete picture is yet to be drawn and further research is needed.
Integral Field Unit (IFU) spectroscopy has expanded our view towards early-type galaxies, their formation, and evolution. This technique allows one to perform spatially resolved studies of stellar populations and better constrain the kinematical structure of these objects, with, for example, the emergence of kinematically distinct cores (KDCs), counter-rotating stellar discs (see Cappellari, 2016, for a review). Despite previous studies being able to reproduce the stellar population parameters of ETGs with a rapid in-situ conversion of gas into stars (e.g. Chiosi & Carraro, 2002) including a fully consistent chemical evolution (e.g. Vazdekis et al., 1997), the emergence of these structures has been seen as evidence for the importance of merger processes in ETG formation. Dry minor mergers have already been established as a subsequent growth pathway for ETGs (the two phases of galaxy formation Oser et al., 2010; Navarro-González et al., 2013), however, they rarely affect the central regions of galaxies. Therefore, studying these structures in galactic cores may help us further elucidate the formation and evolution of ETGs (e.g. Krajnović et al., 2015).
From the above, detailed studies thoroughly analysing the nuclear regions of galaxies probing the stellar population and gas content are fundamental to elucidate the impact of the AGN with respect to the galaxy evolution. In this sense, an "artisanal" approach is better at analysing the details that would otherwise be missed in large surveys. With this in mind, here we present a detailed GMOS IFU study of the galaxy NGC 6868, a nearby ( Mpc, Tully et al., 2013) elliptical galaxy (E2, de Vaucouleurs et al., 1991). Some basic parameters extracted from NED can be seen in table 1 and three images from NGC 6868 in different scales are shown in Fig. 1. NGC 6868 is the brightest member of the Telescopium group. Rickes et al. (2008) have shown that NGC 6868 exhibits LINER emission in its centre, which has been attributed to a combination of photoionization by an LLAGN and shocks. They also investigate this galaxy’s metallicity distribution and ionized gas by means of long-slit spectroscopy and stellar population synthesis. According to the authors, Lick indices present a negative gradient indicating an overabundance of Fe, Mg, Na and TiO in the central parts with respect to the external regions. Mg2 correlates with Fe5270 and Fe5335, suggesting that these elements probably underwent the same enrichment process in NGC 6868. The lack of correlation between computed galaxy mass and the Mg2 gradient suggests that this elliptical galaxy was formed by merger events. The stellar population synthesis shows the presence of at least two populations with ages of 13 and 5 Gyr old. The fact that this galaxy apparently has multiple ionization scenarios and also shows signs of complex star formation history makes NGC 6868 an excellent candidate to further investigate the mechanisms behind LINER emission and the processes involved in the evolution of early-type galaxies.
| Parameter | NGC 6868 |
|---|---|
| RA (J2000) | 20h09m54s.07 |
| Dec. (J200) | -48∘22´46.4´´ |
| Morphologya | E2 |
| R (mag)b | 7.91 |
| M (mag)b | -24.7 |
| Diameter (kpc)c | 73.0 |
| L (erg s-1)d | |
| Nuclear Activitye | LINER |
| Radio classificationf | Flat-Spectrum Radio Source |
| A (mag)g | 0.152 |
| Radial Velocity (km s-1)h | 2854 |
| Distance (Mpc)i | 27.70 |
| Redshift (z)h | 0.00952 |
| Velocity dispersion (kms-1) j | 250 |
| Data available in NED111The NASA/IPAC Extragalactic Database (NED) is operated by the Jet Propulsion Laboratory, California Institute of Technology, under contract with the National Aeronautics and Space Administration | |
| ade Vaucouleurs et al. (1991) | bCarrasco et al. (2006) |
| cLauberts & Valentijn (1989) | dBabyk et al. (2018) |
| eRickes et al. (2008) | fHealey et al. (2007) |
| gSchlafly & Finkbeiner (2011) | hRamella et al. (1996) |
| iTully et al. (2013) | jWegner et al. (2003) |

NGC 6868 was already observed in different wavelengths. Machacek et al. (2010) using X-ray data found strong evidence of a past encounter between NGC 6868 and NGC 6861, displaying tidal tails and shells. Moreover, they found X-ray cavities, indicative of past AGN activity. Hansen et al. (1991) studied NGC 6868 using CCD images and an International Ultraviolet Explorer (IUE) low-resolution spectrum, and they found a dust lane in the centre of the galaxy with an extended dust component with spiral features. A series of papers have reported the presence of ionized gas, finding a disturbed morphology and complex kinematics for the galaxy with a possible counter-rotating disc (Buson et al., 1993; Zeilinger et al., 1996; Macchetto et al., 1996). Caon et al. (2000) have analysed long-slit observations with distinct position angles (PAs). They reported a rotating disc of ionized gas, in agreement with the stellar velocity field. However, in a different PA, a counter-rotating gas disc with respect to the stars is found, displaying an inner component that shows a counter-rotation. Also, a KDC was seen where the kinematical break radius is at 3”. Bregman et al. (1998) using IRAS data confirmed the presence of cold dust. NGC 6868 has been observed in the radio by Slee et al. (1994) at 2.3, 5, and 8.4 GHz and Mauch et al. (2003) at 843 MHz and Healey et al. (2007) reported a low-power flat spectrum radio source in its centre (). The brightness, temperature and spectral slope are inconsistent with HII regions, so an AGN was the most likely source of the radio emission. Rose et al. (2019) using ALMA observations detected molecular gas in the centre of NGC 6868 drifting in non-circular motions. Also, they reported an HI absorption.
In this paper, the first of a series aimed at studying in detail this object, we will focus on the stellar content of NGC 6868. It is organized as follows: in § 2, we describe the observations and the reduction procedures; in § 3, we present the employed methodology; in § 4, the results are presented and a comparison with data from other studies. Discussion of the results is made in § 5 and the conclusion and summary are made in § 6. Throughout this paper, we assume that solar metallicity corresponds to (Girardi et al., 2000).
2 Observation and Data Reduction
NGC 6868 was observed on 2013 May 04 with the Gemini South Telescope using the Gemini Multi-Object Spectrograph (GMOS) in the IFU mode (Allington-Smith et al., 2002; Hook et al., 2004). This object is part of the DIVING3D survey, which made observations of the central regions of all 170 galaxies in the Southern hemisphere with and (see Steiner et al. 2022 for more details). The one slit set-up was used for the observations, resulting in an FoV of 5.0 × 3.5 arcsec2. The B600-G5323 grating was used with a central wavelength of 5620 Å and a spectral range from 4260 Å to 6795 Å. The spectral resolution is 1.8 Å, estimated with the O i 5577Å sky line. Flat-field exposures, bias and CuAr lamp spectra were acquired for calibration and correction purposes. The seeing of observation was estimated using stars that are present in the acquisition image of the galaxy, taken with the GMOS imager in the r-band (SDSS system). Moreover, the DA white dwarf EG 274 (Hamuy et al., 1992) was observed in order to perform the spectrophotometric calibration. These and some other basic information regarding the observation are given in table 2.
Standard IRAF procedures (Tody, 1986, 1993) were followed to reduce the data using the tasks contained in the Gemini IRAF package. Bias, flat-fields, wavelength calibration, dispersion correction, and flux calibration procedures were applied to the science data. To remove cosmic rays, we used the lacos software (van Dokkum, 2001). The data cube was constructed with a spatial sampling of 0.05 arcsec.
After the standard reduction procedures, other data treatments were applied by means of improving the visualization of the data as described in Menezes et al. (2019): removal of the high spatial noise using a Butterworth filter, the correction of the differential atmospheric refraction (DAR), instrumental fingerprint removal through PCA Tomography and Richardson-Lucy deconvolution.
The removal of high-frequency noise from the spatial dimension was performed by convolving each image of the data cube with a Butterworth filter (Gonzalez & Woods, 2008; Ricci et al., 2014). The filter order used was and the cut-off frequency was where is the Nyquist frequency, corresponding to 0.5 spaxel-1. This cut-off frequency was chosen to remove only spatial frequencies higher than the PSF of the data cube, assuring that no valid scientific information was lost in this process.
The correction of the differential atmospheric refraction (DAR) consists of spatially shifting the wavelength planes of the data cube so that the spectrum of a given point in the galaxy occupies always the same position at all wavelengths. The correction of the differential refraction effect on the data cube of NGC 6868 was performed using the equations from Bönsch & Potulski (1998) and Filippenko (1982), which assume a plane parallel atmosphere and calculate the displacement of the centroid of the galaxy for each wavelength as a function of the zenith distance, the refraction index and other atmospheric parameters.
The PCA Tomography technique (Steiner et al., 2009, and references therein) applies Principal Component Analysis (PCA) to data cubes. This procedure searches for spectro-spatial correlation across a given data cube. The results are the eigenvectors (or eigenspectra), which show the correlations between the wavelengths caused by some physical phenomenon or an instrumental fingerprint, and the tomograms, which correspond to the projection of the data cube onto each eigenvector. This is an orthogonal transform meaning it can be reversed. The eigenvectors are ordered by how much of the variance in the data cube they are able to explain, meaning the first eigenvector explains most of the variance and so on. Using this technique, the instrumental fingerprints may appear as one of the eigenvectors that would otherwise be entangled with the data. This instrumental signature may be isolated by building a data cube containing only this issue. In the end, we subtract this fingerprint from the science data cube.
After the removal of the instrumental fingerprints, the reddening caused by the dust within the Milky Way was corrected using the CCM law (Cardelli et al., 1989) and mag (Schlafly & Finkbeiner, 2011). The telluric lines were also removed and the spectra were brought to the rest frame using the redshift shown in Table 1.
Lastly, the Richardson-Lucy deconvolution (Richardson, 1972; Lucy, 1974) is an iterative process that aims at reconstructing the image of the galaxy before its convolution with the PSF when it passes through the atmosphere and the optical apparatus of the telescope. After 10 iterations, the final estimated PSF was 0.71 arcsec, estimated from a spatial profile obtained along the red wing of the broad H\textalpha emission. An image from the continuum of NGC 6868, extracted from the final data cube, is shown in Fig. 1.
| Parameter | NGC 6868 |
|---|---|
| Observation date | 2013 May 04 |
| Gemini Programme | GS-2013A-Q-52 |
| Seeing (arcsec) | 0.77 |
| Airmass | 1.056 |
| T (s) | 1800 |
| Number of exposures | 1 |
3 Methodology
3.1 Stellar population synthesis
In order to derive the SFH (star formation history), we used the starlight code (Cid Fernandes et al., 2004; Cid Fernandes et al., 2005; Cid Fernandes et al., 2013; Cid Fernandes, 2018) which fits the continuum spectra by combining in different proportions the contribution from different simple stellar populations (SSPs), taking into account reddening and kinematical parameters. In other words, it tries to match the observed spectrum () with a modelled one (), described by
| (1) |
where is the flux in a predetermined normalization wavelength, is the number of elements in the SSP base, is the j-th component of the population vector () that stores the light contribution from each SSP (with respect to the normalization wavelength222We normalized our spectra in the 5700 Å region, due to the lack of significant stellar absorption bands and having good S/N in the whole FOV., ). is the spectrum of the j-th component, is the reddening factor, defined by ) and , where is the extinction law evaluated at . Lastly, there is a convolution with a Gaussian distribution to take into account the line-of-sight velocity distribution (LOSVD) of the stellar component in the spectra, where is the line-of-sight stellar velocity and is the stellar velocity dispersion. To determine the best fit, the code tries to minimize a defined by
| (2) |
where is the weight. Using this parameter, we are able to mask () spurious features or contributions from other non-stellar components (e.g. emission lines from the ionized gas) or give more weight to important regions of our spectra (e.g. characteristic adsorptions that allow better kinematical predictions, if that is the intended objective). Along with the emission lines present in our spectra, the Mg i absorption (an \textalpha element) was masked during the synthesis in order to minimize possible degeneracies that can be introduced by the \textalpha-enhancement effects in the determination of the galaxy metallicity (the [\textalpha/Fe] is derived in § 3.2).
One of the fundamental ingredients in this method is the SSPs used in the fit. We constructed our base with the models developed by Vazdekis et al. (2016, hereafter E-MILES), using the evolutionary tracks of Girardi et al. (2000) and the Kroupa (2001) initial mass function. These models were chosen because their wavelength range overlaps with our data and have a better spectral resolution (2.51 Å FWHM) when compared to other stellar population models (e.g. Bruzual & Charlot, 2003; Maraston & Strömbäck, 2011; Conroy et al., 2009)333The high resolution is fundamental to precisely modelling the stellar absorptions, allowing a detailed study of the gas kinematics when discounting the stellar component. This allows a self-consistent analysis that will be pursued in a future paper (Benedetti et al., in preparation).. Moreover, MILES is a modern empirical stellar library spanning a wide range of stellar parameters, therefore, allowing us to better explore different stellar population properties in our object. The final SSPs span 15 ages (0.0631, 0.1, 0.16, 0.28, 0.50, 0.89, 1.26, 1.41, 2.51, 3.98, 6.31, 7.94, 10.0, 11.2, 12.6 Gyr) and six metallicities (0.005, 0.02, 0.2, 0.4, 1.0, 1.6 Z⊙).
The E-MILES models, however, lack really young and hot stars, having only SSPs with ages greater than Myr. In order to assess the possibility of such a young population in NGC 6868, we performed stellar synthesis with the Bruzual & Charlot (2003) models, which include stars as young as 0.1 Myr in the whole FoV. We found no contribution from components with less than Myr.
Since this object has no ongoing star formation, we decided to use the reddening law from Cardelli et al. (1989) to model the dust attenuation (AV) intrinsic to our object. To account for a possible featureless continuum (FC) emission of an AGN, we followed Riffel et al. (2009) and a power-law spectrum with was added to the base. In other test runs, we have included FC with different exponents, ranging from -1.75 to -1.0, however, no significant contribution from any of these components was found.
Finally, to better understand the age and metallicity spatial distribution, we calculated the light-weighted mean stellar age (), as
| (3) |
and the light-weighted mean stellar metallicity(, Cid Fernandes et al., 2005), as
| (4) |
is used in the computation of because the ages of the stellar population span many other orders of magnitude from to .
To optimize the data management, we used the megacube tool (Mallmann et al., 2018; Riffel et al., 2021) which takes as input the data cube and prepares the data for the synthesis procedure, executes the synthesis and also performs the preliminary analysis (e.g. calculate the equations 3 and 4) as well as mounting the maps with the important parameters.
3.2 Indices measurements and Alpha-enhancement
To better constrain the assembly history of NGC 6868, especially the \textalpha-enhancement, we have measured indices for the absorption lines. We measured the indices for Fe4383, Mg2, Mgb, Fe5270, Fe5335 using the definitions presented in Riffel et al. (2019) which are based on Worthey et al. (1994) and were subsequently used to derive Fe3444 (Kuntschner, 2000) and [MgFe]’555 (Thomas et al., 2003). All spaxels were corrected to the rest frame using the line-of-sight Doppler shift velocity derived by starlight. At first, we decide not to correct the effects due to the velocity dispersion.
The in-house pacce code (Riffel & Borges Vale, 2011) was used to perform the equivalent widths (EW) measurements of these indices. The code uses predefined continuum bands around a given line and fits a pseudo-continuum line. Once the line is fitted, the EW is calculated through
| (5) |
being the measured EW of the line, and are the integrated areas below the absorption and below the pseudo-continuum, respectively, and and are the predetermined final and initial wavelength of the absorption feature. The trapezium integration method is used and the calculation of Wλ is iterated over the whole cube.
A problem we faced during these measurements was the contamination from the weak [N i] Å emission line which is located between the Mg i absorption and the pseudo continuum definition of Mgb. We were able to work this around by modelling the emission line profile and subtracting this contribution from the spaxels. In order to properly model this component, we discounted the previously derived stellar spectra and fitted the remaining continuum with a high-order polynomial. Afterwards, we adjusted this line using the ifscube package (Ruschel-Dutra & Oliveira, 2020). We modelled the [N i] Å emission line using two Gaussian components and coupled its kinematics with the [N ii] Å. Additional details on emission line fitting will be presented in Benedetti et al. (in preparation). Once the lines were properly fitted we were able to discount this emission and remeasure the Mg i indices.
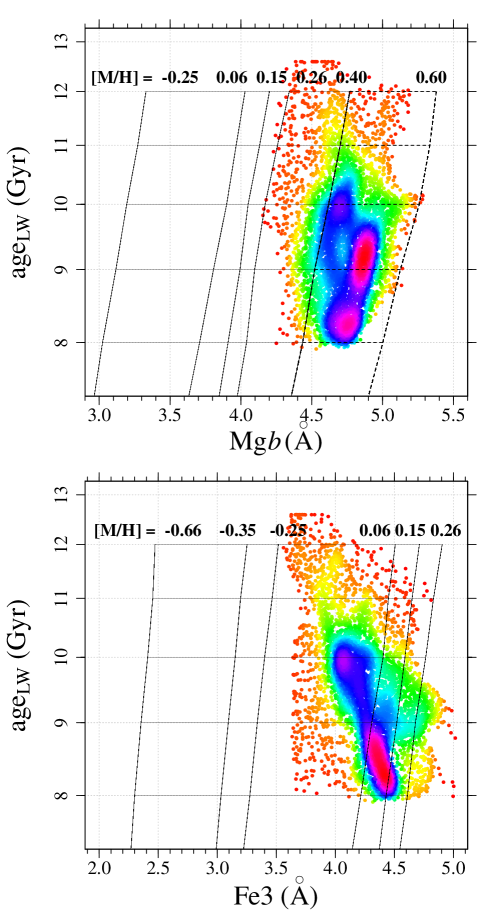
Aimed at constraining the assembly history of NGC 6868, we derived the [\textalpha/Fe] of the stellar population. Following the approach described in La Barbera et al. (2013) using the indices Mg, Fe3 and the luminosity-weighted age derived from starlight to obtain ZMg and ZFe3. To measure the Mg and Fe3 indices, we first broadened our spectra convolving with a Gaussian to match the spectral resolution of MILES models (2.51 Å FWHM, Vazdekis et al., 2015) and the measured indices were corrected by the velocity dispersion following the prescriptions by de la Rosa et al. (2007). We then interpolated the Vazdekis et al. (2015) models grids by fixing the stellar population age to obtain ZMg and ZFe3, as illustrated in Fig. 2. As mentioned in La Barbera et al. (2013), one may need to extrapolate the grids in \textalpha-enhanced populations. This is represented as the dotted lines in the same figure. Afterwards, we calculated the proxy [ZMgb/ZFe3]= ZMgb-ZFe3 which finally can be used to get (Vazdekis et al., 2015):
| (6) |
4 Results
4.1 Stellar population synthesis
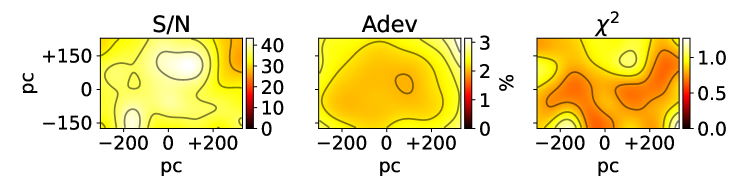
We present an example of the fits for an individual, nuclear spaxel in Fig. 3. A good matching between the observed (black) and modelled (red) spectra can be seen. The quality of the fits over the full FoV is ensured by the signal-to-noise (S/N) ratio map and can be certified in the and Adev666Adev is the Allan deviation and serves as a quality indicator of the fit. It corresponds to the percentage mean deviation over all fitted pixels. maps (Fig. 4).
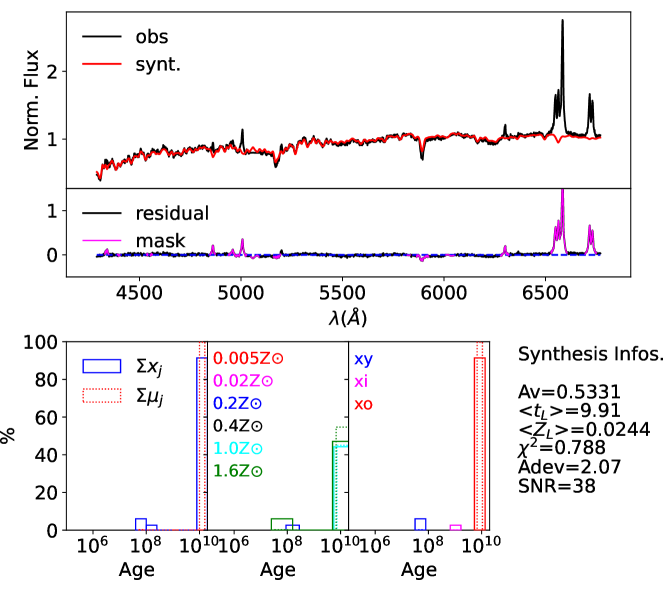
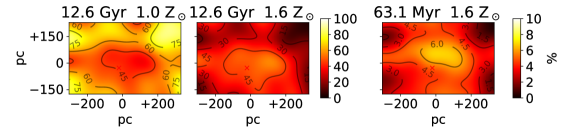
The resulting stellar population derived over the full FoV by the fitting procedure resulted in a contribution of mainly 3 components: two old metal-rich (12.6 Gyr; 1.0 and 1.6 Z⊙) and a smaller contribution of a young also metal-rich (63.1 Myr; 1.6 Z⊙). The spatial distribution of each component is shown in Fig. 5. It is clear that the central region is dominated by an old stellar population ( Gyr), as is to be expected for massive early-type galaxies. However, this contribution is divided into two different components with different metallicities, having 1.0 and 1.6 Z⊙ each. They also exhibit a distinct spatial distribution, with more metal-rich stars dominating the central region of our FoV. The same distribution is seen for the mass fractions derived for each component. The 1.0 Z⊙ SSP has a mean relative mass fraction of % ranging from % to %. On the other hand, the 1.6 Z⊙ SSP has a mean relative mass fraction of % ranging from % to %.
Rickes et al. (2008) have also conducted stellar population synthesis studies in NGC 6868 in a larger scale ( arcsec) and also found an ubiquitous old population. However, they also report an intermediate-age stellar population of 5 Gyr which peaks in the centre of the galaxy, contradicting our findings. However, their data ranges from Å therefore lacking the bluer end of the spectrum in order to constrain the presence of intermediate and young stars. Also, their SSP base consists of very few elements, that most likely do not portray all the different SFH a galaxy can have. Therefore, the discrepancies seen are most likely the result of better data employed here (larger wavelength coverage and S/N) and the improvement of the synthesis method.
Despite the different FCs we tried in our base, we did not find any contribution from an AGN. As this is a galaxy classified as a LINER, the supermassive black hole is likely accreting at a really low rate, making its contribution to the continuum undetectable.
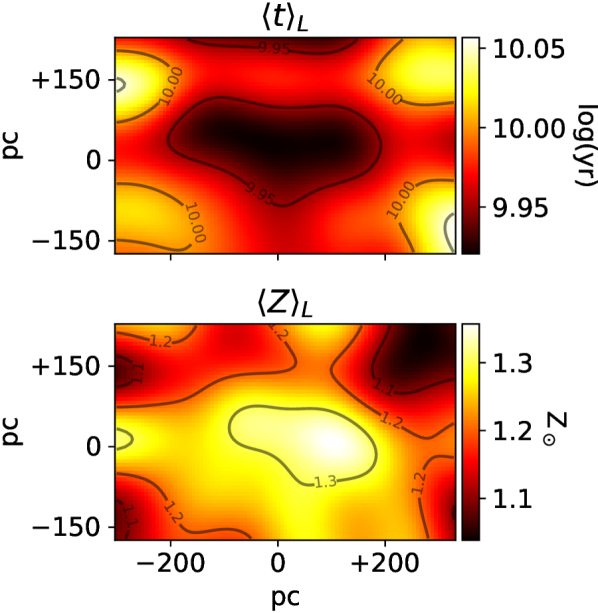
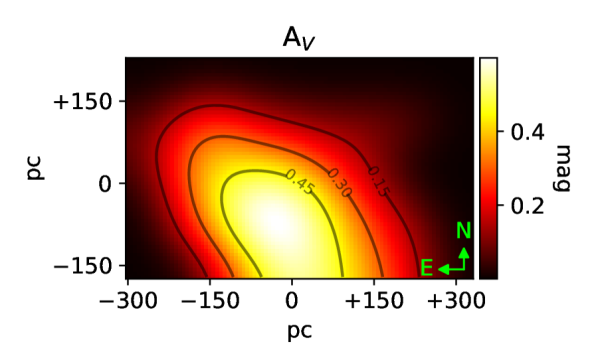
In order to represent the galaxy’s age and metallicity in a single map, we have derived the and maps, which are shown in Fig. 6. In these maps, one can observe that the galaxy’s mean age is slightly smaller and the metallicity higher in the nucleus. Finally in Fig. 7 we show the reddening map (AV). It reaches a peak of 0.65 mag in the centre of the image and its morphology resembles a dust lane embedded in the centre of the galaxy. This is in agreement with literature results (e.g. Veron-Cetty & Veron, 1988; Hansen et al., 1991; Buson et al., 1993).
starlight also outputs the line of sight velocity and velocity dispersion. These maps are shown in Fig. 8. It is evident that NGC 6868 does not display a rotation profile or any ordered motion. Instead, it appears that the stars are in random motions, as can be seen in the distribution, showing a clear peak km s-1 in the centre of the galaxy. In order to verify our results, we have also performed the fits using pPXF (Cappellari & Emsellem, 2004; Cappellari, 2017) with the same SSP base and got the exact same results. Using the spectral resolution from our data and 5000 Å as our reference wavelength, we come to the conclusion that we are not able to distinguish any velocities with less than kms-1. Therefore, we would need data with a better spectral resolution to properly characterize the kinematics of the central region of NGC 6868.
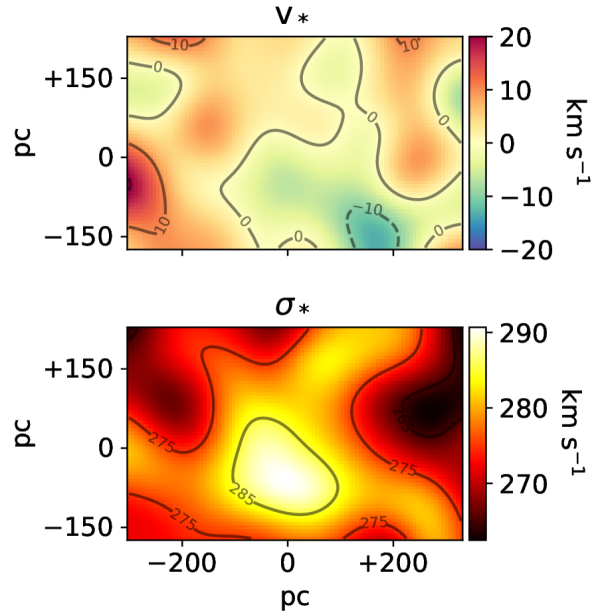
In past studies (Caon et al., 2000), the stellar kinematics was measured using long-slit data and they found (1) a shallow rotation profile with a peak velocity of km s-1 at a radius of 42 arcsec ( kpc); (2) a KDC which exhibits a counter rotation with respect to the outer regions and; (3) a drop in velocity dispersion at the centre of the galaxy, only seen in one of their PAs. However, in the inner part (<150 pc) of NGC6868 we are not detecting any sign of rotation nor drop in reported. Moreover, comparing the derived velocity dispersion profiles from other PAs in their data, there is also no evidence of this behaviour. This is also the case for the KDC, where the velocities within it reach at most 10 km s-1. The most probable explanation for these mixed findings is the high variation between different PAs as can be seen in Fig. 8. Depending on the angle observed, a rotation (or counter-rotation) can or cannot be observed, due to the high-velocity dispersion in that region, making precise determinations of the velocity challenging. Moreover, an important caveat is that a KDC can only be detected when comparing the core and the outer parts of a galaxy. The FoV of our data does not allow such a comparison, therefore, in the present paper, we are unable to clearly say whether this object hosts a KDC or not.
4.2 Absorption line indices
The maps for the absorption line indices calculated in the Lick/IDS resolution are shown in Fig. 9. All the values shown were corrected by the intrinsic velocity dispersion found with starlight, except for the Mg2 index because it is almost insensitive to Doppler broadening. In our case, this correction would be smaller than the intrinsic error of the method (< 0.003, e.g. Kuntschner, 2000), so we chose not to apply any correction. This is not the case for the other indices. The correction factors for each spaxel follow the spatial distribution from the velocity dispersion (Fig.8). The derived correction factors for the Mgb index are in the range 1.09-1.14; Fe4383, 1.12-1.17; Fe5270, 1.23-1.29; Fe5335, 1.40-1.54. The maximum error found for each index was Mg2: 0.0044 mag, Mgb: 0.15 Å, Fe4383: 0.36 Å, Fe5270: 0.14 Å, Fe5335: 0.18 Å, Fe3: 0.14 Å e [MgFe]’: 0.17 Å. These errors leave all the following reported gradients unaffected.
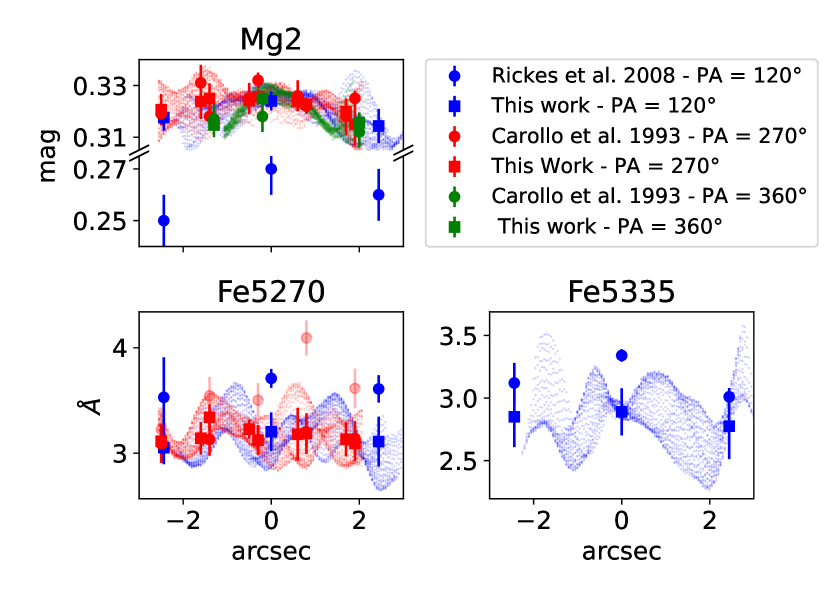
In order to assess the confidence of our results, we made extractions at PAs from the literature (Carollo et al., 1993; Rickes et al., 2008) matching the spatial extent of our data. This comparison can be seen in Fig. 10 and the error bars displayed for the values derived in this work are the standard deviation measured within each bin which is greater than the systematic errors. Mg2 presents an offset of at least -0.5 mag between Rickes et al. (2008) and our extractions, with both showing a negative gradient. The likely explanation for this offset is the different ways to measure the continuum applied in each work: they chose custom continuum bands and we followed Riffel et al. (2019). Carollo et al. (1993), on the other hand, matches all our data within the error bars for both of their PAs. Fe5270 and Fe5335 also present an offset between Rickes et al. (2008) and our measurements, again preserving gradients probably related to the continuum definitions, as previously said. Carollo et al. (1993) measured Fe5270 (transparent points in Fig. 10) and verified it was not in the Lick system. Therefore they derived a correction to be applied for their data in the form , resulting in Å. The corrected points are the full circles in Fig. 10 which, once again, match all our data within the error bars. Carollo et al. (1993) did not measure Fe5335.
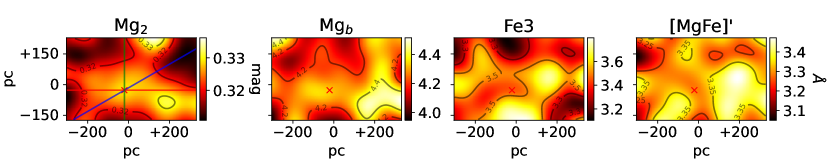
In contrast to the parameters derived in the stellar population synthesis (Fig. 6), the spatial variation of the measured indices is far more intricate. Therefore to gauge the mean behaviour of each index, in Fig. 11 we plot the median of each index in circular apertures of arcsec (7 pc) using the peak in Mg2 as the origin. Mg2 has the clearest spatial behaviour when compared to all the other indices, monotonically decreasing across the majority of the FoV. Two peculiar regions deviate from this trend, however: one at NW (+120 pc,+175 pc) in the border of the FoV, and another one SW at (+170 pc, -140 pc). Unfortunately, we do not have any literature results in these areas, nevertheless, given that our method resulted in an excellent agreement with past studies, we are convinced of this detection. The Mgb profile closely resembles Mg2 also showing the distinct regions previously cited. Fe3 is particularly interesting because it does not follow the metallicity map as previously shown (Fig. 6), already a hint of \textalpha-enhancement processes at play. The most curious result is that in the same SW region previously mentioned, there is a depletion of this index. The [MgFe]’ map closely resembles the map indicating that the centre of this galaxy really is metal-rich and exhibits a negative gradient.

One curious behaviour that can easily be seen in Fig. 11 is that for pc the Mg2 and Mgb anti-correlate with Fe3 and [MgFe]’ reaching their peaks at pc away from the centre. Until pc we actually observe a correlation between the two indices which turns again into an anti-correlation beyond pc, however shallower when compared to the inner region.
Rickes et al. (2008) found that Mg2 and Fe5270 or Fe5335 establish a strong correlation which led them to conclude that the elements traced by both of these indices suffered the same enrichment processes. This can be the case for bigger scales, but in our FoV, we observe a distinct behaviour.
4.3 Alpha-enhancement
The grids used to derive the [\textalpha/Fe] are seen in Fig. 2 as well as our measurements. As we only find old stellar populations, the most significant variation is given by the indices. Using these values, the [\textalpha/Fe] map is shown in Fig. 12. It is clear that the whole FoV presents \textalpha-enhanced stellar populations with values between and +0.24 dex. Also, we find a really structured profile with diverse morphology. Using once again the peak in Mg2 as our reference, we plot the median profile of the [\textalpha/Fe] using circular apertures that can also be seen in Fig. 12. What becomes apparent is that the centre of NGC 6868 shows a peak in \textalpha-enhancement followed by a region of shallower [\textalpha/Fe] which again is followed by another region with values as big as the ones in the centre, producing the "U" shape found in the median profile.
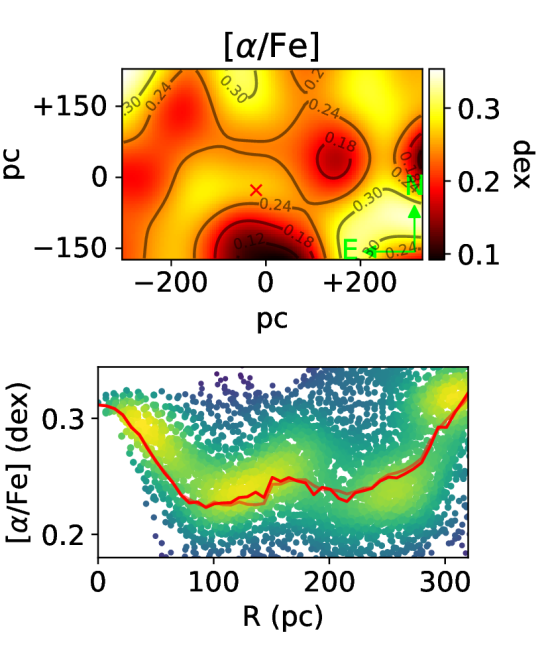
The only other paper where there is a measurement of the [\textalpha/Fe] from NGC 6868 is Rickes et al. (2008). According to them, the central parts of NGC 6868 present lower [\textalpha/Fe], between -0.3 and 0.0 dex and an above-solar metallicity ([Z/Z⊙] dex. Moreover, the external parts present higher [\textalpha/Fe] values ( dex) and lower metallicities ([Z/Z⊙] dex). In order to obtain these values, they use the Mg2, Fe5270 and Fe5335. However, as we already showed in § 4.2, these indices, despite agreeing with the gradients found in other studies, the values present a normalization problem probably due to the continuum bands used to compute the indices. If this shift in measurements were accounted for, the values of [\textalpha/Fe] would increase, reaching the \textalpha-enhanced region in their diagram, thus matching our observations. This would not affect the negative gradient in metallicity nor the positive gradient in [\textalpha/Fe] which are in agreement with observations of other early-type galaxies (e.g. Kuntschner et al., 2010).
5 Discussion
5.1 Stellar population synthesis
NGC 6868 is an early-type galaxy and so what is expected is that it had a fast phase of intense SF that suddenly stopped, forming the bulk of its stellar mass with a subsequent growth attributed to dry minor mergers. Therefore it is expected that the isophotes are not severely disturbed by the accreted galaxies. However, as we will present in the forthcoming paper (Benedetti et al. in preparation), the photometric centre of NGC6868 has an offset with respect to the outer parts indicating a recent encounter with the NE dwarf companion galaxy. NGC 6868 at first inspection appears to deviate from this hypothesis, exhibiting a significant distortion in its continuum image (Fig. 1). When corrected by the stellar reddening found in the synthesis procedure, the actual morphology is revealed as an undisturbed spheroidal, as shown in Fig. 13.
According to our analysis, the SFH of this galaxy is characterized by a short burst in the early Universe with no major episodes of star formation since then (Fig. 6). This means that NGC 6868 probably did not experience any encounters with star-forming galaxies as they would leave signatures in the SFH from this galaxy.
The interpretation of the young metal-rich component (63.1 Myr; 1.6 Z⊙) is tricky. For instance, it can be due to residual star formation which can be found in some elliptical galaxies. How common they are is still a matter of debate. Salvador-Rusiñol et al. (2020) have detected young stars in massive red galaxies probably related to recycled material within the galaxy with mass fraction up to 0.5 per cent (see also de Lorenzo-Cáceres et al., 2020; Salvador-Rusiñol et al., 2021; Salvador-Rusiñol et al., 2022). On the other hand, Simonian & Martini (2017) interpreted early-type galaxies which typically are UV-weak as lacking younger components with HOLMES stars being responsible for this residual UV emission. Also, Bica et al. (1996) using IUE spectra classified NGC 6868 as a UV-weak source and found no contribution from young stellar populations. In addition, Cid Fernandes & González Delgado (2010) interpreted this young component as an artefact of the fitting process, and due to the lack of an old blue population, probably related to the horizontal branch, that current stellar population models do not account for.
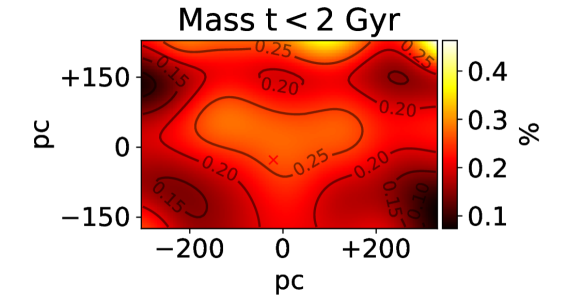
In order to better understand the behaviour of this young component, we have used the M/L from the E-MILES models, and summing over the contributions from all SSPs with 2 Gyr or less, we get the map available in Fig. 14 with a median mass contribution in our FoV of percent. There is a gradient for this component with higher values towards the nucleus of the galaxy (the same behaviour as reported by Salvador-Rusiñol et al., 2020). In addition, this is a metal-rich (1.6 ) stellar population, thus most likely being formed from recycled material of former stellar generations. Taking this all together, we interpret that the 63 Myr contribution we found is due to a recent generation of stars, most likely formed from recycled gas from stellar evolution. However, it is worth mentioning that the present data do not allow us to completely rule out other mechanisms (e.g. HOLMES stars) that may also be enough to account for this fraction we found when fitting the data.
It is worth mentioning that, as said in § 3.1, we have tested for the presence of younger components in this object by using different SSP models that account for these younger stars in order to perform the stellar population synthesis. We found no evidence for the presence of younger components than 63 Myr.
The mean metallicity map (, Fig. 6) is consistent with the scenario where massive early-type galaxies are able to retain the material expelled by SN, thus fixating the elements produced during stellar evolution into new stars, also creating a gradient where central regions tend to be more metal-rich when compared to outer regions. This is the case for the majority of early-type galaxies (Kuntschner et al., 2010). They also show that for fast-rotators characterized by only old populations (>9 Gyr), a stellar disc is embedded in the stellar population of the galaxy characterized by higher metallicity and lower [\textalpha/Fe], including the central regions.
The dust found in our data (Fig. 7) is probably related to the cannibalism of a small gas-rich companion as proposed by Hansen et al. (1991). The molecular (Rose et al., 2019), atomic (Rose et al., 2019) and ionized gas (e.g. Buson et al., 1993) detected are probably related with this event. For instance, as can be seen in figure 2 of Hansen et al. (1991), there are dust filaments with spiral features that can be followed in a ring-like structure around the galaxy centre with a connection at NE which is aligned with the dust lane detected in the present study (Fig. 7). The ring is also connected to a stellar-like object in NW that they proposed is a cannibalised galaxy. In fact, we found some recent, metal-rich, star-formation in this galaxy, as pointed out in § 4.1 this residual star formation is most likely formed from material ejected from the previous generation of stars. In fact, the triggering/enhancing of AGN activity/luminosity has been related to an extra amount of gas that is added to the regular flow and is most likely originated from stellar evolution processes (Riffel et al., 2022). This gas (from the filaments + stellar evolution mass-loss) is most likely the reason behind the triggering of the AGN which is producing the LINER emission that is detected in the centre of the galaxy. This however is highly speculative and a thorough analysis of the ionized gas component will be carried out in an upcoming paper (Benedetti et al. in preparation).
In the synthesis, despite including an FC component and testing with different exponents, the code does not find any significant contribution of an AGN to the continuum. This however does not mean there is not an AGN in the centre of NGC 6868 as the emission can be obscured by dust, or the SMBH might not be accreting matter at a sufficiently high rate. As was already pointed out, this galaxy presents AGN evidence from past studies in radio (Slee et al., 1994; Mauch et al., 2003). We already know this is a LINER source, therefore the SMBH cannot be accreting at high rates. However, it is already known that when comparing AGN detection in the radio and optical the ratio of detection is not a 1:1 relation (Comerford et al., 2020).
The kinematic revealed by starlight matches what is expected for a cD galaxy, having above 250 kms-1. We do not find any clear sign of rotation or strong ordered motion. Actually, the v∗ map displays values that are below our uncertainty (see § 4.1, Fig. 8). It is clear that our whole FoV presents values for the velocity in the line-of-sight which we are not able to confirm, however, for completeness we decided to show it in Fig. 8. The velocity dispersion, on the other hand, does not face this problem as all values derived are kms-1. Despite past studies reporting a KDC in this object, we cannot confirm this result due to our small FoV. What remains clear is the fact that the central region of NGC 6868 is really dispersion dominated and no kinematically distinct structure is found.
5.2 Absorption line indices and alpha-enhancement
Analysing the profiles derived for the indices (Fig. 9), it is clear that they are far more structures when compared to the ones derived in the synthesis (Fig. 6). Moreover, the variation in each index is heavily dependent on the PA one decides to look at. This hints at a more chaotic assembly history when compared to what is derived in the synthesis that shows only contributions from old metal-rich populations. The [MgFe]’ resembles the profile probably because we were able to partially isolate the sensitivity to the \textalpha-enhancement processes from the synthesis.
This hypothesis is further endorsed by Fig. 11, where at least three distinct chemically enrichment regimes are clear, with two anti-correlations (R pc and R pc) and a correlation (R pc and R pc), clearer in the Mgb-[MgFe]’ plot. What this tells us, again is that only a simple monolithic collapse cannot explain all our findings, otherwise we would expect the elements sensitive to the indices measured would have followed similar enrichment processes, thus producing matching gradients. This appears to be the case for larger scales (Rickes et al., 2008), however, this is not true for our FoV. A deviation from past studies that [MgFe]’ reveals is a slight dip in the metallicity of the galaxy towards the very centre (R<100 pc, Fig. 11) that is also apparent in Fe3. As this index is insensitive to [\textalpha/Fe] what we observe is that the central region is depleted in metals with respect to the outer (100 pc < R <220 pc) region. This behaviour is unexpected as shown by past studies (e.g. Kuntschner et al., 2010).
The fact that we are able to detect such gradients using our observations is another reason why detailed studies on stellar populations on ETGs like the one presented here are necessary to further understand these objects. As shown here, despite these gradients naturally appearing in our data, in long-slit studies, as presented in Rickes et al. (2008) they are not able to detect any sign of this effect as their analysis is restricted to one PA.
One way of distinguishing the formation scenario, as noted by Carollo et al. (1993) is measuring the Mg2 gradient (d Mg2/d log r). Using only r>1 arcsec we find a gradient of d Mg2/d log r-0.024, which is a shallow gradient, incompatible with the monolithic collapse scenario according to the authors.
The [\textalpha/Fe] map (Fig. 12) also presents a complex profile. However, looking at the median curve we see a much clear behaviour. The central (R<100 pc) and outer (R>260 pc) regions appear to be significantly more \textalpha-enhanced than the intermediate region. These regions agree with our findings from the indices. What becomes clear is that the signatures in the stellar populations of the centre of NGC 6868 cannot be described only by a burst of star formation in the early universe with a passive evolution since then.
In order to test if the dilution by young stellar component was affecting our [\textalpha/Fe] estimates, we followed the same procedure as described in § 3.2 and estimated the [\textalpha/Fe] measuring the indices only in the synthetic spectrum. We found that the effects of the young population are only able to change at a maximum of 0.04 dex the [\textalpha/Fe] values. Therefore, we conclude that the young component is not able to explain the spatial variation found in Fig. 12.
5.3 Possible formation scenario for NGC 6868
From our findings, NGC 6868 presents compelling evidence that its assembly history was not just comprised of a single burst of star formation without any significant evolution ever since. The [\textalpha/Fe] map is especially suited to understanding this galaxy. A close inspection reveals that the regions where it is smaller are also the more metallic regions. Kuntschner et al. (2010) found stellar populations with these exact same features (high metallicity and low [\textalpha/Fe]) in discs of fast-rotator early-type galaxies. Some of these discs show signs of recent star formation, however, they also find these characteristics in galaxies depleted of gas and dominated only by old stellar populations (<9 Gyr).
Therefore, our hypothesis is that in the past NGC 6868 could have suffered an episode of merger with another galaxy with lower [\textalpha/Fe], such as the ones previously described. This would explain why we see such structured maps in [\textalpha/Fe], the slight increase in metallicity outside from the centre and the absence of a detectable subsequent star formation episode or a lack of gradient in the mean age across our FoV. The fact that we do not observe any clear kinematical signature is probably because we are looking at a really small region and cannot compare with outer regions, despite a KDC being previously reported (Caon et al., 2000). However, we do find an imprinted chemical signature. We emphasize that, in this hypothesis, the accreted galaxy could not have a mass comparable with NGC 6868, because, despite different maps showing structured profiles, Mg2 shows a (shallow) negative gradient. Therefore, this enrichment process must have disturbed the stars from NGC 6868 only to a certain extent. Simulations could be used to test our predictions, however, this analysis is beyond the scope of this paper.
Finally, this might not be the only disturbance NGC 6868 has suffered. We notice some regions that stand out, mainly in the SW in the [\textalpha/Fe] map which displays a dex and, as can be seen in the Fe3 map (Fig. 9) it is depleted in [Fe/H]. This can be a recently captured small galaxy, however, this is unlikely due to its scale and the region it is encountered. We would need more data to properly characterize this region
6 Concluding remarks
In this paper, we analysed GMOS-IFU data of the inner region of the ETG NGC 6868 mapping for the first time the physical and chemical properties of the stellar content of this source. This, together with an absorption-line indices analysis has allowed us to constrain the assembly history of this object. Our results can be summarized as follows:
-
•
This galaxy is dominated by an old metal-rich (12.6 Gyr; 1.0 and 1.6 Z⊙) stellar population and presents a negative gradient in metallicity. This is further endorsed by the [MgFe]’.
-
•
We found a recent ( 63 Myr) metal-rich () stellar population in the center of the galaxy. We suggest that this component is most likely due to stars being formed from recycled material of former stellar generations.
-
•
The apparent distortion in the continuum image is due to a dust lane embedded in the centre of the galaxy and reaches a peak in AV mag. This structure is coincident with the one found in other studies.
-
•
No evidence of an FC continuum is found, probably meaning the AGN in the centre of NGC 6868 is accreting at really low rates.
-
•
The kinematics in the centre of NGC 6868 is characterized by high dispersion velocities and no apparent circular motion of the stars is seen.
-
•
The indices Mg2, Mgb, Fe3 and [MgFe]’ all present structured profiles, with Mg2 presenting the steepest negative gradient. However, it is too shallow to support a formation history due to a monolithic collapse.
-
•
Three distinct regions can be found when cross-correlating the indices: anti-correlations for R pc and R pc and a correlation for 100 pcR pc. This reveals different enrichment histories in these regions.
-
•
The [\textalpha/Fe] map also does not present a clear gradient. However, the median appears to also show three distinct regions: the central (R<100 pc) and outer (R>260 pc) regions appear to be significantly more \textalpha-enhanced than the intermediate region.
These findings suggest that NGC 6868 was not formed on a single collapse and has passively evolved since then. Rather we propose that it has suffered a past merge with another galaxy. This can explain the findings in the \textalpha-enhancement and the different regions in the indices correlations together with the stellar population synthesis ones, such as the metallicity gradient and ubiquitous old ages. We do not find evidence of a distinct kinematic component either because this merger supposedly happened too long ago or we would need a larger FoV to asses if this region really is a KDC as other studies have previously reported.
Acknowledgements
We thank the anonymous referee for the very useful comments and suggestions that helped to improve the manuscript. We also thank Alexandre Vazdekis for the insightful discussions. This work was supported by Brazilian funding agencies Conselho Nacional de Desenvolvimento Científico e Tecnológico (CNPq) and Coordenação de Aperfeiçoamento de Pessoal de Nível Superior (CAPES) and by the Programa de Pós-Graduação em Física (PPGFis) at UFRGS. JPVB acknowledges financial support from CNPq and CAPES (Proj. 0001). RR acknowledges support from the Fundación Jesús Serra and the Instituto de Astrofísica de Canarias under the Visiting Researcher Programme 2023-2025 agreed between both institutions. RR, also acknowledges support from the ACIISI, Consejería de Economía, Conocimiento y Empleo del Gobierno de Canarias and the European Regional Development Fund (ERDF) under grant with reference ProID2021010079, and the support through the RAVET project by the grant PID2019-107427GB-C32 from the Spanish Ministry of Science, Innovation and Universities MCIU. This work has also been supported through the IAC project TRACES, which is partially supported through the state budget and the regional budget of the Consejería de Economía, Industria, Comercio y Conocimiento of the Canary Islands Autonomous Community. RR also thanks to Conselho Nacional de Desenvolvimento Científico e Tecnológico ( CNPq, Proj. 311223/2020-6, 304927/2017-1 and 400352/2016-8), Fundação de amparo à Pesquisa do Rio Grande do Sul (FAPERGS, Proj. 16/2551-0000251-7 and 19/1750-2), Coordenação de Aperfeiçoamento de Pessoal de Nível Superior (CAPES, Proj. 0001). TVR thanks CNPq for support under grant 306790/2019-0. MT thanks the support of CNPq (process 312541/2021-0) and the programme L’Oréal UNESCO ABC Para Mulheres na Ciência. RAR acknowledges the support from Conselho Nacional de Desenvolvimento Científico e Tecnológico and Fundação de Amparo à Pesquisa do Estado do Rio Grande do Sul. ARA acknowledges Conselho Nacional de Desenvolvimento Científico e Tecnológico (CNPq) for partial support to this work through grant 312036/2019-1. JAHJ acknowledges support from FAPESP, process number 2021/08920-8.
Based on observations obtained at the international Gemini Observatory and processed using the Gemini iraf package, a programme of NSF’s NOIRLab, which is managed by the Association of Universities for Research in Astronomy (AURA) under a cooperative agreement with the National Science Foundation on behalf of the Gemini Observatory partnership: the National Science Foundation (United States), National Research Council (Canada), Agencia Nacional de Investigación y Desarrollo (Chile), Ministerio de Ciencia, Tecnología e Innovación (Argentina), Ministério da Ciência, Tecnologia, Inovações e Comunicações (Brazil), and Korea Astronomy and Space Science Institute (Republic of Korea).
Data Availability
The data are publicly available on gemini archive under the project GS-2013A-Q-52.
References
- Allington-Smith et al. (2002) Allington-Smith J., et al., 2002, Publications of the Astronomical Society of the Pacific, 114, 892
- Babyk et al. (2018) Babyk I. V., McNamara B. R., Nulsen P. E. J., Hogan M. T., Vantyghem A. N., Russell H. R., Pulido F. A., Edge A. C., 2018, The Astrophysical Journal, 857, 32
- Baldry et al. (2004) Baldry I. K., Glazebrook K., Brinkmann J., Ivezić Ž., Lupton R. H., Nichol R. C., Szalay A. S., 2004, The Astrophysical Journal, 600, 681
- Barth & Shields (2000) Barth A. J., Shields J. C., 2000, Publications of the Astronomical Society of the Pacific, 112, 753
- Belfiore et al. (2016) Belfiore F., et al., 2016, Monthly Notices of the Royal Astronomical Society, 461, 3111
- Bica et al. (1996) Bica E., Bonatto C., Pastoriza M. G., Alloin D., 1996, Astronomy and Astrophysics, 313, 405
- Binette et al. (1994) Binette L., Magris C. G., Stasińska G., Bruzual A. G., 1994, Astronomy and Astrophysics, 292, 13
- Bönsch & Potulski (1998) Bönsch G., Potulski E., 1998, Metrologia, 35, 133
- Brammer et al. (2009) Brammer G. B., et al., 2009, The Astrophysical Journal, 706, L173
- Bregman et al. (1998) Bregman J. N., Snider B. A., Grego L., Cox C. V., 1998, The Astrophysical Journal, 499, 670
- Bruzual & Charlot (2003) Bruzual G., Charlot S., 2003, Monthly Notices of the Royal Astronomical Society, 344, 1000
- Burtscher et al. (2021) Burtscher L., et al., 2021, Astronomy & Astrophysics, 654, A132
- Buson et al. (1993) Buson L. M., et al., 1993, Astronomy and Astrophysics, 280, 409
- Caon et al. (2000) Caon N., Macchetto D., Pastoriza M., 2000, The Astrophysical Journal Supplement Series, 127, 39
- Cappellari (2016) Cappellari M., 2016, Annual Review of Astronomy and Astrophysics, 54, 597
- Cappellari (2017) Cappellari M., 2017, Monthly Notices of the Royal Astronomical Society, 466, 798
- Cappellari & Emsellem (2004) Cappellari M., Emsellem E., 2004, Publications of the Astronomical Society of the Pacific, 116, 138
- Cardelli et al. (1989) Cardelli J. A., Clayton G. C., Mathis J. S., 1989, The Astrophysical Journal, 345, 245
- Carollo et al. (1993) Carollo C. M., Danziger I. J., Buson L., 1993, Monthly Notices of the Royal Astronomical Society, 265, 553
- Carrasco et al. (2006) Carrasco E. R., de Oliveira C. M., Infante L., 2006, The Astronomical Journal, 132, 1796
- Chiosi & Carraro (2002) Chiosi C., Carraro G., 2002, Monthly Notices of the Royal Astronomical Society, 335, 335
- Cid Fernandes (2018) Cid Fernandes R., 2018, Monthly Notices of the Royal Astronomical Society, 480, 4480
- Cid Fernandes & González Delgado (2010) Cid Fernandes R., González Delgado R. M., 2010, Monthly Notices of the Royal Astronomical Society, 403, 780
- Cid Fernandes et al. (2004) Cid Fernandes R., Gu Q., Melnick J., Terlevich E., Terlevich R., Kunth D., Rodrigues Lacerda R., Joguet B., 2004, Monthly Notices of the Royal Astronomical Society, 355, 273
- Cid Fernandes et al. (2005) Cid Fernandes R., Mateus A., Sodré L., Stasińska G., Gomes J. M., 2005, Monthly Notices of the Royal Astronomical Society, 358, 363
- Cid Fernandes et al. (2011) Cid Fernandes R., Stasińska G., Mateus A., Vale Asari N., 2011, Monthly Notices of the Royal Astronomical Society, 413, 1687
- Cid Fernandes et al. (2013) Cid Fernandes R., et al., 2013, Astronomy & Astrophysics, 557, A86
- Comerford et al. (2020) Comerford J. M., et al., 2020, The Astrophysical Journal, 901, 159
- Conroy et al. (2009) Conroy C., Gunn J. E., White M., 2009, The Astrophysical Journal, 699, 486
- Croton et al. (2006) Croton D. J., et al., 2006, Monthly Notices of the Royal Astronomical Society, 365, 11
- Dahmer-Hahn et al. (2021) Dahmer-Hahn L. G., et al., 2021, Monthly Notices of the Royal Astronomical Society, 509, 4653
- Di Matteo et al. (2005) Di Matteo T., Springel V., Hernquist L., 2005, Nature, 433, 604
- Ellison et al. (2021) Ellison S. L., et al., 2021, Monthly Notices of the Royal Astronomical Society: Letters, 505, L46
- Fabian (2012) Fabian A., 2012, Annual Review of Astronomy and Astrophysics, 50, 455
- Ferland & Netzer (1983) Ferland G. J., Netzer H., 1983, The Astrophysical Journal, 264, 105
- Filippenko (1982) Filippenko A. V., 1982, Publications of the Astronomical Society of the Pacific, 94, 715
- Girardi et al. (2000) Girardi L., Bressan A., Bertelli G., Chiosi C., 2000, Astronomy and Astrophysics Supplement Series, 141, 371
- Gonzalez & Woods (2008) Gonzalez R. C., Woods R. E., 2008, Digital Image Processing, 3rd ed edn. Prentice Hall, Upper Saddle River, N.J
- Halpern & Steiner (1983) Halpern J. P., Steiner J. E., 1983, The Astrophysical Journal, 269, L37
- Hamuy et al. (1992) Hamuy M., Walker A. R., Suntzeff N. B., Gigoux P., Heathcote S. R., Phillips M. M., 1992, Publications of the Astronomical Society of the Pacific, 104, 533
- Hansen et al. (1991) Hansen L., Jorgensen H. E., Norgaard-Nielsen H. U., 1991, Astronomy and Astrophysics, 243, 49
- Harrison (2017) Harrison C. M., 2017, Nature Astronomy, 1, 1
- Healey et al. (2007) Healey S. E., Romani R. W., Taylor G. B., Sadler E. M., Ricci R., Murphy T., Ulvestad J. S., Winn J. N., 2007, The Astrophysical Journal Supplement Series, 171, 61
- Heckman (1980) Heckman T. M., 1980, Astronomy and Astrophysics, 87, 152
- Hickox et al. (2014) Hickox R. C., Mullaney J. R., Alexander D. M., Chen C.-T. J., Civano F. M., Goulding A. D., Hainline K. N., 2014, The Astrophysical Journal, 782, 9
- Ho (2008) Ho L. C., 2008, Annual Review of Astronomy and Astrophysics, 46, 475
- Hook et al. (2004) Hook I. M., Jørgensen I., Allington-Smith J. R., Davies R. L., Metcalfe N., Murowinski R. G., Crampton D., 2004, Publications of the Astronomical Society of the Pacific, 116, 425
- Hopkins & Elvis (2010) Hopkins P. F., Elvis M., 2010, Monthly Notices of the Royal Astronomical Society, 401, 7
- Kauffmann et al. (2003) Kauffmann G., et al., 2003, Monthly Notices of the Royal Astronomical Society, 341, 54
- King & Pounds (2015) King A., Pounds K., 2015, Annual Review of Astronomy and Astrophysics, 53, 115
- Krajnović et al. (2015) Krajnović D., et al., 2015, Monthly Notices of the Royal Astronomical Society, 452, 2
- Kroupa (2001) Kroupa P., 2001, Monthly Notices of the Royal Astronomical Society, 322, 231
- Kuntschner (2000) Kuntschner H., 2000, Monthly Notices of the Royal Astronomical Society, 315, 184
- Kuntschner et al. (2010) Kuntschner H., et al., 2010, Monthly Notices of the Royal Astronomical Society, 408, 97
- La Barbera et al. (2013) La Barbera F., Ferreras I., Vazdekis A., de la Rosa I. G., de Carvalho R. R., Trevisan M., Falcón-Barroso J., Ricciardelli E., 2013, Monthly Notices of the Royal Astronomical Society, 433, 3017
- Lauberts & Valentijn (1989) Lauberts A., Valentijn E. A., 1989, The Surface Photometry Catalogue of the ESO-Uppsala Galaxies
- Lucy (1974) Lucy L. B., 1974, The Astronomical Journal, 79, 745
- Macchetto et al. (1996) Macchetto F., Pastoriza M., Caon N., Sparks W. B., Giavalisco M., Bender R., Capaccioli M., 1996, Astronomy and Astrophysics Supplement Series, 120, 463
- Machacek et al. (2010) Machacek M. E., O’Sullivan E., Randall S. W., Jones C., Forman W. R., 2010, The Astrophysical Journal, 711, 1316
- Mallmann et al. (2018) Mallmann N. D., et al., 2018, Monthly Notices of the Royal Astronomical Society, 478, 5491
- Maraston & Strömbäck (2011) Maraston C., Strömbäck G., 2011, Monthly Notices of the Royal Astronomical Society, 418, 2785
- Mauch et al. (2003) Mauch T., Murphy T., Buttery H. J., Curran J., Hunstead R. W., Piestrzynski B., Robertson J. G., Sadler E. M., 2003, Monthly Notices of the Royal Astronomical Society, 342, 1117
- Menezes et al. (2019) Menezes R. B., Ricci T. V., Steiner J. E., da Silva P., Ferrari F., Borges B. W., 2019, Monthly Notices of the Royal Astronomical Society, 483, 3700
- Muzzin et al. (2013) Muzzin A., et al., 2013, The Astrophysical Journal, 777, 18
- Navarro-González et al. (2013) Navarro-González J., Ricciardelli E., Quilis V., Vazdekis A., 2013, Monthly Notices of the Royal Astronomical Society, 436, 3507
- Nayakshin & Zubovas (2012) Nayakshin S., Zubovas K., 2012, Monthly Notices of the Royal Astronomical Society, 427, 372
- Noeske et al. (2007) Noeske K. G., et al., 2007, The Astrophysical Journal, 660, L47
- Novak et al. (2011) Novak G. S., Ostriker J. P., Ciotti L., 2011, The Astrophysical Journal, 737, 26
- Oliveira et al. (2022) Oliveira Jr C. B., Krabbe A. C., Hernandez-Jimenez J. A., Dors Jr O. L., Zinchenko I. A., Hägele G. F., Cardaci M. V., Monteiro A. F., 2022, Monthly Notices of the Royal Astronomical Society, 515, 6093
- Oser et al. (2010) Oser L., Ostriker J. P., Naab T., Johansson P. H., Burkert A., 2010, The Astrophysical Journal, 725, 2312
- Papaderos et al. (2013) Papaderos P., et al., 2013, Astronomy & Astrophysics, 555, L1
- Ramella et al. (1996) Ramella M., Focardi P., Geller M. J., 1996, Astronomy and Astrophysics, 312, 745
- Ricci et al. (2014) Ricci T. V., Steiner J. E., Menezes R. B., 2014, Monthly Notices of the Royal Astronomical Society, 440, 2442
- Richardson (1972) Richardson W. H., 1972, JOSA, 62, 55
- Rickes et al. (2008) Rickes M. G., Pastoriza M. G., Bonatto C., 2008, Monthly Notices of the Royal Astronomical Society, 384, 1427
- Riffel & Borges Vale (2011) Riffel R., Borges Vale T., 2011, Astrophysics and Space Science, 334, 351
- Riffel et al. (2009) Riffel R., Pastoriza M. G., Rodríguez-Ardila A., Bonatto C., 2009, Monthly Notices of the Royal Astronomical Society, 400, 273
- Riffel et al. (2019) Riffel R., et al., 2019, Monthly Notices of the Royal Astronomical Society, 486, 3228
- Riffel et al. (2021) Riffel R., et al., 2021, Monthly Notices of the Royal Astronomical Society, 501, 4064
- Riffel et al. (2022) Riffel R., et al., 2022, Monthly Notices of the Royal Astronomical Society, 512, 3906
- Rose et al. (2019) Rose T., et al., 2019, Monthly Notices of the Royal Astronomical Society, 489, 349
- Ruschel-Dutra & Oliveira (2020) Ruschel-Dutra D., Oliveira B. D. D., 2020, Danielrd6/Ifscube: Modeling, Zenodo, doi:10.5281/ZENODO.4065550
- Ruschel-Dutra et al. (2017) Ruschel-Dutra D., Rodríguez Espinosa J. M., González Martín O., Pastoriza M., Riffel R., 2017, Monthly Notices of the Royal Astronomical Society, 466, 3353
- Salvador-Rusiñol et al. (2020) Salvador-Rusiñol N., Vazdekis A., La Barbera F., Beasley M. A., Ferreras I., Negri A., Dalla Vecchia C., 2020, Nature Astronomy, 4, 252
- Salvador-Rusiñol et al. (2021) Salvador-Rusiñol N., Beasley M. A., Vazdekis A., Barbera F. L., 2021, Monthly Notices of the Royal Astronomical Society, 500, 3368
- Salvador-Rusiñol et al. (2022) Salvador-Rusiñol N., Ferré-Mateu A., Vazdekis A., Beasley M. A., 2022, Monthly Notices of the Royal Astronomical Society, 515, 4514
- Schawinski et al. (2015) Schawinski K., Koss M., Berney S., Sartori L. F., 2015, Monthly Notices of the Royal Astronomical Society, 451, 2517
- Schaye et al. (2015) Schaye J., et al., 2015, Monthly Notices of the Royal Astronomical Society, 446, 521
- Schlafly & Finkbeiner (2011) Schlafly E. F., Finkbeiner D. P., 2011, The Astrophysical Journal, 737, 103
- Simonian & Martini (2017) Simonian G. V., Martini P., 2017, Monthly Notices of the Royal Astronomical Society, 464, 3920
- Singh et al. (2013) Singh R., et al., 2013, Astronomy & Astrophysics, 558, A43
- Slee et al. (1994) Slee O. B., Sadler E. M., Reynolds J. E., Ekers R. D., 1994, Monthly Notices of the Royal Astronomical Society, 269, 928
- Springel et al. (2005) Springel V., et al., 2005, Nature, 435, 629
- Steiner et al. (2009) Steiner J. E., Menezes R. B., Ricci T. V., Oliveira A. S., 2009, Monthly Notices of the Royal Astronomical Society, 395, 64
- Steiner et al. (2022) Steiner J. E., et al., 2022, Monthly Notices of the Royal Astronomical Society, 510, 5780
- Storchi-Bergmann & Schnorr-Müller (2019) Storchi-Bergmann T., Schnorr-Müller A., 2019, Nature Astronomy, 3, 48
- Thomas et al. (2003) Thomas D., Maraston C., Bender R., 2003, Monthly Notices of the Royal Astronomical Society, 339, 897
- Tody (1986) Tody D., 1986, in Crawford D. L., ed., Society of Photo-Optical Instrumentation Engineers (SPIE) Conference Series Vol. 627, Instrumentation in Astronomy VI. Crawford, David L., Tucson, p. 733, doi:10.1117/12.968154
- Tody (1993) Tody D., 1993, in Astronomical Data Analysis Software and Systems I. p. 173
- Trussler et al. (2020) Trussler J., Maiolino R., Maraston C., Peng Y., Thomas D., Goddard D., Lian J., 2020, Monthly Notices of the Royal Astronomical Society, 491, 5406
- Tully et al. (2013) Tully R. B., et al., 2013, The Astronomical Journal, 146, 86
- Vazdekis et al. (1997) Vazdekis A., Peletier R. F., Beckman J. E., Casuso E., 1997, The Astrophysical Journal Supplement Series, 111, 203
- Vazdekis et al. (2015) Vazdekis A., et al., 2015, Monthly Notices of the Royal Astronomical Society, 449, 1177
- Vazdekis et al. (2016) Vazdekis A., Koleva M., Ricciardelli E., Röck B., Falcón-Barroso J., 2016, Monthly Notices of the Royal Astronomical Society, 463, 3409
- Veron-Cetty & Veron (1988) Veron-Cetty M.-P., Veron P., 1988, Astronomy and Astrophysics, Vol. 204, p. 28-38 (1988), 204, 28
- Wegner et al. (2003) Wegner G., et al., 2003, The Astronomical Journal, 126, 2268
- Wetzel et al. (2012) Wetzel A. R., Tinker J. L., Conroy C., 2012, Monthly Notices of the Royal Astronomical Society, 424, 232
- Worthey et al. (1994) Worthey G., Faber S. M., Gonzalez J. J., Burstein D., 1994, The Astrophysical Journal Supplement Series, 94, 687
- Yan & Blanton (2012) Yan R., Blanton M. R., 2012, The Astrophysical Journal, 747, 61
- Zeilinger et al. (1996) Zeilinger W. W., et al., 1996, Astronomy and Astrophysics Supplement Series, 120, 257
- Zubovas & Bourne (2017) Zubovas K., Bourne M. A., 2017, Monthly Notices of the Royal Astronomical Society, 468, 4956
- de Lorenzo-Cáceres et al. (2020) de Lorenzo-Cáceres A., Vazdekis A., Falcón-Barroso J., Beasley M. A., 2020, Monthly Notices of the Royal Astronomical Society, 498, 1002
- de Vaucouleurs et al. (1991) de Vaucouleurs G., de Vaucouleurs A., Corwin Herold G. J., Buta R. J., Paturel G., Fouque P., 1991, Third Reference Catalogue of Bright Galaxies. Springer-Verlag, New York
- de la Rosa et al. (2007) de la Rosa I. G., de Carvalho R. R., Vazdekis A., Barbuy B., 2007, The Astronomical Journal, 133, 330
- van Dokkum (2001) van Dokkum P. G., 2001, Publications of the Astronomical Society of the Pacific, 113, 1420
- van der Wel et al. (2014) van der Wel A., et al., 2014, The Astrophysical Journal, 788, 28