Abstract
Since a black hole does not emit light from its interior, nor does it have a surface on which light from nearby sources can be reflected, observational study of black hole physics requires observing the gravitational impact of the black hole on its surroundings. A massive black hole leaves a dynamical imprint on stars and gas close by. Gas in the immediate vicinity of an accreting massive black hole can, due to the presence of the black hole, shine so brightly that it outshines the light of the billions of stars in its host galaxy and be detected across the Universe. By observing the emission from stars and gas and determining their kinematics scientists can extract vital information not only on the fundamental properties of the black holes themselves but also the impact they have on their surroundings. As it turns out, supermassive black holes appear to play a vital role in shaping the Universe as we know it, as they can profoundly impact the star formation history in galaxies. As a consequence, these black holes indirectly impact the cosmic build up of chemical elements heavier than Helium and thus affect when and where life can form. For these reasons alone, observations of massive black holes constitute a very active research area of modern astrophysics.
In this chapter we aim to provide a general overview—fit for a non-expert—of what scientists have learned, and hope to learn, from analyzing observations of massive black holes and the material around them. We deliberately do not provide a review of the vast literature on this topic but refer to relevant sample journal articles or reviews, when available, for readers interested in exploring the topics in greater detail.
Chapter 0 Massive black holes in galactic nuclei: Observations
This chapter is the pre-print of the version currently in production. Please cite this chapter as the following: M. Vestergaard and K. Gültekin. “Massive black holes in galactic nuclei: Observations,” in The Encyclopedia of Cosmology (Set 2): Black Holes, edited by Z. Haiman (World Scientific, New Jersey, 2023)
The Chapter contents are as follows: After an introduction in § 1, we outline the observational evidence for accretion onto massive black holes (§ 2). The next sections cover the measurements of the black hole fundamental properties of mass (§ 3) and spin (§ 4) using various techniques. Section 5 is devoted to a characterization of the black hole environment; here we discuss observations of the central black holes in the Milky Way, Sagitarius A∗, and in the nearby massive elliptical galaxy, Messier 87 (M87). The sections that follow address the co-evolution of massive black holes and their host galaxies (§ 6); black hole fueling at low redshift (§ 7); observational evidence for black hole feedback (§ 8); observations of massive black holes in the high redshift universe (§ 9) and black hole growth over cosmic time (§ 10). Intermediate mass black holes (§ 11) and massive black hole pairs (§ 12) are also covered. Cosmic distance measurements using massive black holes are described in § 13. The Chapter is concluded with a view to the immediate future (§ 14).
1 Where do we see massive black holes in the Universe?
Massive () and supermassive black holes ( ) reside in the centers of galaxies. The nearby dwarf galaxy RGG 118 hosts the least massive black hole known to us, with a secure measurement[1] of 50,000 , while the most massive ones power the luminous quasars in distant young galaxies. Our own galaxy, the Milky Way, is host to a 4 million solar mass black hole (§ 1). When the black hole accretes gas at a sufficiently high rate, it is commonly known as an active galactic nucleus, AGN, because copious amounts of energy are produced from the tiny volume around the black hole, commonly known as the AGN (or black hole) central engine. Since an accreting black hole gains mass, it has long been a working hypothesis that the active phase of a black hole represents an early evolutionary phase of the galaxy hosting the black hole[2] — consistent with AGN and quasars preferentially residing at large cosmic distances where the Universe was much younger than it is today. At later times the massive black hole stops growing and turns quiescent.
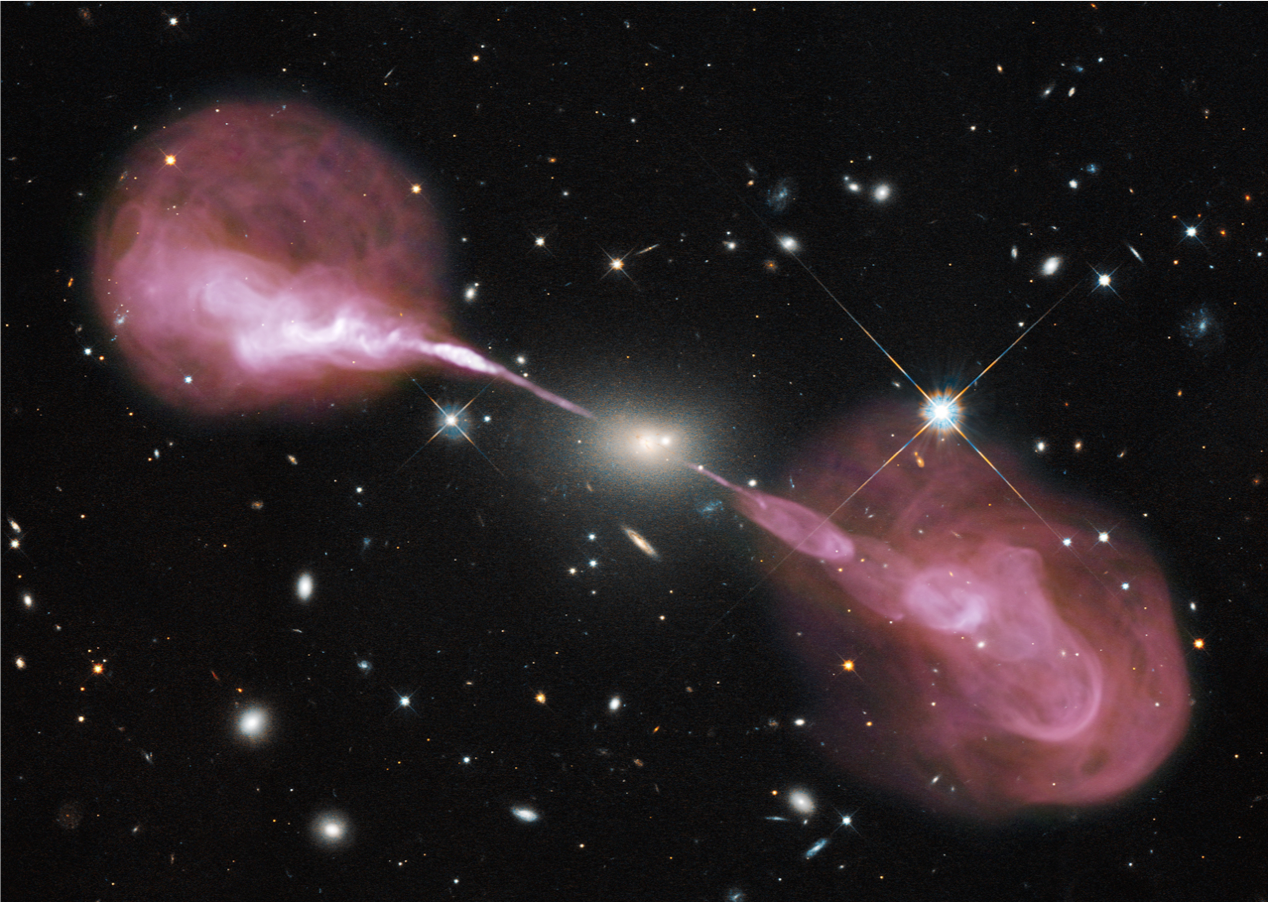
While indisputable evidence for supermassive black holes has only been obtained within the past few years through the detection of the shadow of the central supermassive black hole of, first, the nearby elliptical galaxy Messier 87 (§ 2) and, then, the Milky Way (Sagitarius A∗), astronomers have long suspected their existence. The emergence of radio astronomy in the 1930s, paved the way for discovering, first, radio galaxies in the 1950s (e.g., Cygnus A[3]) and later quasars in the early 1960s (e.g., 3C 273[4, 5]). Quasars were first detected as powerful point-like or compact, single-jetted radio sources[6]. While optical spectroscopic data indicated the presence of a very compact, redshifted source[5] coinciding with the radio source, it took another 20 years to securely connect the quasar phenomenon to the centers of galaxies[7, 8]. Similar to Cygnus A, many galaxies with powerful radio jets reaching far beyond the extent of the stellar body of the galaxy were revealed. An example is Hercules A, shown in Figure 1. The immense power required to eject the relativistic, radio-emitting particles to kilo-parsec scales and the small volume from where the jet emanates from (confirmed by the short variability time scales at X-ray and Gamma-ray energies[6]) suggests a powerful, compact source. Soon after the discovery of radio-jetted objects it became apparent that the most likely source is an accreting massive black hole[9].
Using techniques we detail in §3, nearby galaxies without quasars were examined for their so-called ‘relics’: the massive, quiescent black holes at the galaxy centers. The search was possible only for the nearest galaxies with the angular resolution available on ground-based telescopes. Many galaxies were found to host central black holes. With the angular resolution of Hubble Space Telescope, the volume of space that could be tested grew dramatically. Surprisingly (at the time), it turned out that nearly every galaxy at or above the mass of the Milky Way galaxy has a central black hole[10, 11].
2 Observational evidence for black hole accretion
Supermassive black holes in centers of galaxies not only grow in mass but their activity is also fuelled when gas in the galaxy is transported to the center and onto the black hole. In the following we provide a brief and general description of how this is believed to occur. As material is driven from large galactic scales into the very center of the galaxy, it first settles into a dense, thick planar structure – often referred to as the ‘(obscuring) torus’ – before it moves into a central thin accretion disk. Both structures orbit the black hole. The ‘torus’ is believed to consist of dense molecular gas and dust that obscures our direct view of the nuclear emission at optical, UV and soft X-ray wavelengths[12]. The infalling material loses a lot of its angular momentum and rotation energy, as required if it is to fall onto the black hole, eventually. The original rotation energy can be removed in one of two ways. A large part is dissipated as heat, radiating into space. The heat is generated when the infalling gas collides with the disk material. In addition, the disk gas undergoes differential rotation and is thereby heated through viscous processes: as the radial distance from the black hole decreases, the disk annuli orbit increasingly faster. In addition, angular momentum and rotation energy are removed when material is ejected from the central region, either as winds of plasma or ionized gas[13, 14, 15, 16, 17] or as outflows of radio and X-ray emitting plasma[6]. Jets of molecular gas have even been observed emanating from the center.[18, 19] The powerful radio jets, observed in a subset of AGN, extract rotation energy from the black hole itself via the Blandford-Znajek mechanism[6].
The accretion disk does not extend all the way to the black hole but has an inner radius, the innermost stable circular orbit. Inside this radius the material cannot maintain a stable orbit and it falls directly onto the black hole[20], being heated to a plasma of electrons and protons in the process. The temperature in the disk increases toward the center and the inner parts of the accretion disk are so hot that they emit far-ultraviolet (FUV) photons. Some of these photons are detected directly in the observed spectra of AGN as FUV continuum emission and some travel to ionize gas at large radial distances, known as the broad-line region – as this region emits the broad emission lines, characteristic of AGN, with velocity widths of several thousand . Some of the FUV disk photons scatter off fast-moving electrons, located in the central region, that transfer much of their energy to the photons. In this process, called ‘inverse Compton scattering’, the photons are ‘kicked’ to much higher (keV) energies. We observe these photons in the X-ray wavelength regime[21].
So in short, our observational evidence for black hole accretion is (a) the detection of FUV, UV and optical continuum emission from the accretion disk (direct evidence); and (b) indirect evidence in the form of (i) X-ray emission from the central corona; and (ii) line emission at UV, optical and infrared wavelengths from the broad emission line region. The X-ray emission is often considered direct evidence because it is directly powered by the ionizing photons from the inner accretion disk and the emission signature (the power and the hard spectrum) of the X-ray component is unique. While the broad emission lines are also powered by the FUV ionizing photons, their emission requires the additional presence of broad-line gas.
In the following sections we describe in more detail some of the key observational properties of galaxies with accreting supermassive black holes.
1 Emission is linked to the mass accretion rate
The luminosity of an AGN is directly linked to the mass accretion rate of the central black hole: , where is the energy conversion efficiency and is the light speed. Black holes are eminent at converting mass to energy with in the range of 10% – 40%, and even higher if the black hole is spinning[22]. The integrated light over cosmic history (known as the Sołtan argument; § 10) implies an average value of 10% with values up to 15% reported[23, 24, 25].
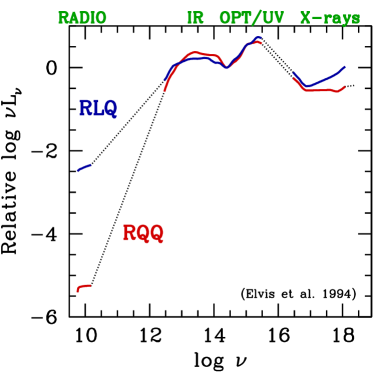
The emission from AGN spans the entire electromagnetic spectrum from radio to gamma ray emission. The typical observed spectral energy distribution (SED) of AGN is shown in Figure 2. While these observations were made of X-ray bright AGNs (so to be well detected in X-rays) they hold true to first order for all relatively bright AGN[26, 27]. The SED shows four main components in the continuum emission: (a) an X-ray power-law; (b) an optical-UV bump dominated by emission from the central accretion disk that feeds the black hole; (c) an infrared bump of emission from dust at a range of temperatures (here dust from the host galaxy may also contribute); (d) radio emission. Some ( 5% – 20%, depending on source redshift[28]) display powerful non-thermal emission from radio jets while most emit only weakly at radio wavelengths. The nature (thermal versus non-thermal, stellar versus non-stellar origin) of this radio emission is still debated.[29].
AGNs that deviate from this general picture are LINERs (Low-Ionization Narrow Emission-line Regions) and blazars (§ 5). LINERs display an extremely weak UV continuum relative to the amplitude of the non-thermal X-ray power-law component, indicating that the mass accretion rate is extremely low[30]. The observed emission of blazars, highly polarized and highly variable, is dominated by relativistically Doppler-boosted and -beamed emission as we view these objects within a few degrees of the jet axis. An overview of the physics of blazars and the vast literature on this subject can be obtained via a recent review of Madejski & Sikora[31].
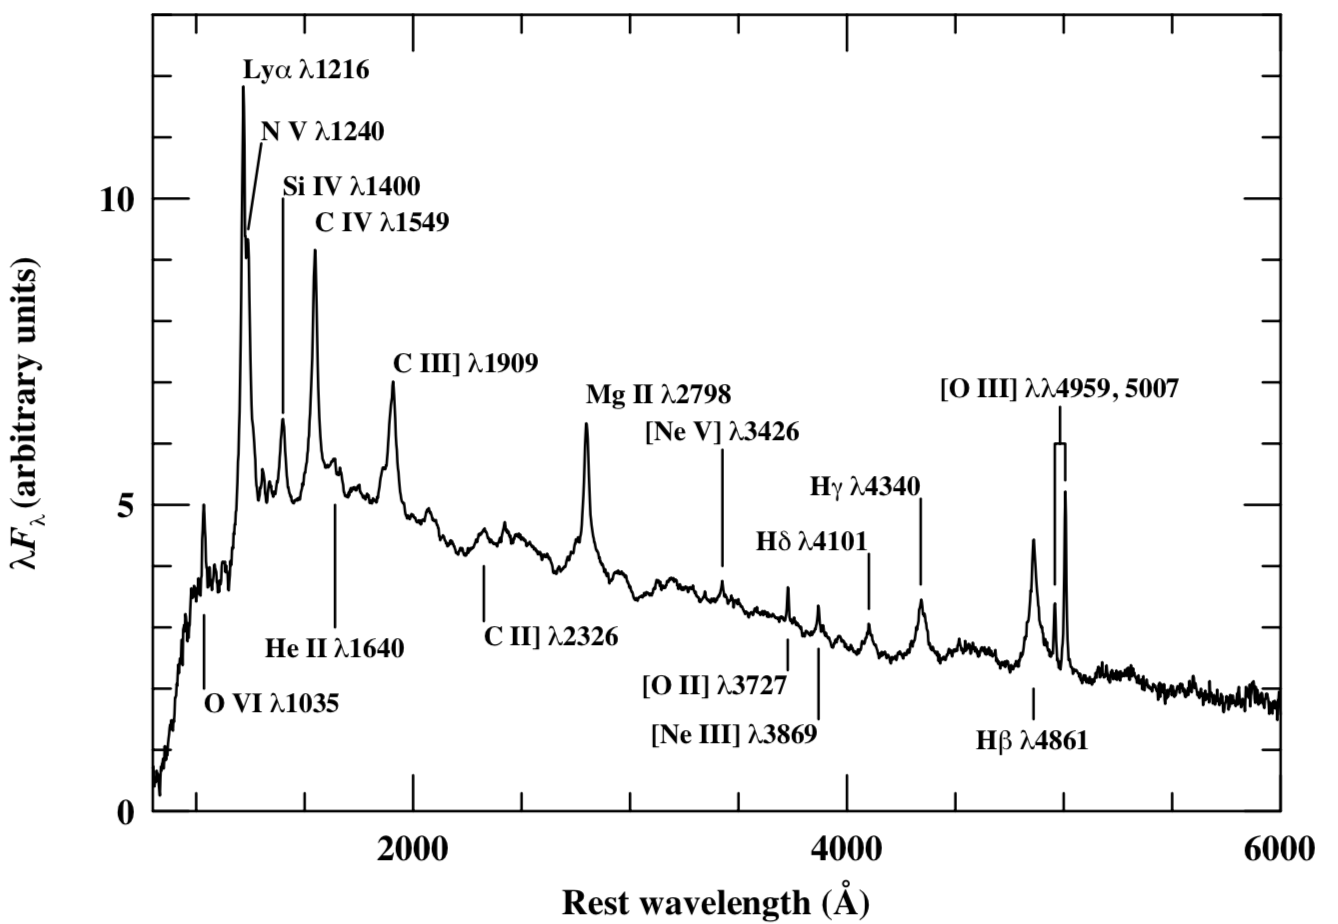
In addition to the power-law continuum emission from the central accretion disk, the UV-optical spectra of AGN and quasars are littered with broad and narrow emission lines of varying strength (Figure 3). The broad emission lines with widths of several thousand km s-1 originate in the broad-line region, a dense gas region located somewhere inside the obscuring torus. Narrow lines with widths less than 1000 km s-1 are emitted from a diffuse and extended gas region located beyond the torus on kilo parsec scales. To first order, the UV-optical spectra appear somewhat similar, even when compared across redshifts of 0.5 to 4.5 for a given luminosity[32]. However, there are also object-to-object variations. A few dominant trends and correlations have been identified. The decreasing equivalent width of the broad C iv 1549 emission line with increasing AGN luminosity is known as the Baldwin Effect[33, 32]. In early 1990s, Boroson & Green[34] identified the strongest spectral line correlation known (dubbed ‘Eigenvector 1’) that links the strength of the [O iii] 5007 emission line, the strength of the optical Fe ii emission complex and the broad H emission line asymmetry. The second strongest correlation connects the strength of the optical luminosity and the He ii 4686 line emission. These two correlations are now understood to be driven by the Eddington luminosity ratio of the central source emission and the mass accretion rate[35]. Subsequent studies (see e.g., ref. [36, 37] and references therein) have added observed properties to the original findings. These correlations are sometimes referred to as the ‘Fundamental Plane of the Broad-line Region’.
2 Observed X-ray properties
Since the launch in 1970 of , the first Earth-orbiting X-ray telescope111https://heasarc.gsfc.nasa.gov/docs/uhuru/uhuru.html, scientists have worked hard to characterize the observed X-ray spectrum of AGN and to understand the underlying physics. The spectrum is a superposition of the emission and absorption of several physical components along our line of sight, each of which vary on their own time scales. Owing to this complexity we still do not have a detailed understanding of the observed X-ray properties, yet a general picture has emerged. The 0.3 80 keV emission spectrum consists of (i) a power-law continuum with a slope from the X-ray corona; (ii) soft X-ray emission at keV, likely thermal in nature, rising steeply above an extrapolation of the power-law continuum at higher energies; (c) a reflection component rising above the power-law continuum at keV; (d) X-ray emission lines of which iron lines – in particular Fe K (at 5–7 keV) – are prominent. As noted earlier, it is commonly thought that extreme-UV photons from the accretion disk scatter off (possibly relativistic) electrons in a corona surrounding the disk, although a thermal origin of the X-ray emission is also a possibility[39]. The X-ray corona is believed to be the origin of the primary X-ray power-law continuum that will irradiate optically thick material in its vicinity, thereby creating spectral signatures of X-ray reflection. Reflection from distant, cold and low-velocity material, such as the purported dense, obscuring, rotating torus will mainly reveal itself as a narrow iron fluorescence line. Reflection from the ionized inner accretion disk is expected to produce a strongly broadened and redshifted Fe K emission line and additional (’excess’) emission at soft (1 keV) and hard (10 keV) energies. The X-ray continuum is expected to have a high-energy roll-over at a few hundred keV. If the emitted spectrum is viewed through disk winds launched off the central accretion disk, the observed X-ray spectrum will also have an absorption spectrum superimposed (with numerous absorption lines and bound-free edges). Absorbing material with intermediate temperatures, also known as warm absorbers, may also be connected to such disk winds.
3 Variability of black hole activity
Gas accretion onto black holes does not occur through a constant, smooth mass flow. As a result, the flux of ionizing photons generated by the central disk changes over time. It can vary from a slow trickle to a gushing flow where even the photons are ’flushed’ into the black hole (‘adiabatic accretion’[44]). Although random and unpredictable, the flux does largely tend to vary by a certain margin around a slowly varying mean luminosity. This is often described as a ‘Damped Random Walk’[45, 46]. The timescale over which the ionizing continuum varies depends on the photon energy—the X-ray flux varies on very short timescales compared to the far-UV flux—and the target source. It appears that supermassive black holes of relatively lower mass, , that power Seyfert galaxies, vary on shorter timescales and with larger amplitudes than the more massive black holes[47, 48, 49]. The (intrinsically) longer time scales and lower variability amplitudes of quasars is considered a manifestation of the larger physical scales in these systems connected with the larger black hole masses.
The variable nature of the accretion process has been utilized over the past few decades to map the physical gas structure in the vicinity of the black hole for a sample of nearby AGN. Starting in the mid to late 1980s scientists formed large scale collaborations to execute monitoring campaigns simultaneously on ground-based telescopes and the space-borne telescope, the International Ultraviolet Explorer (IUE[50, 51, 52, 53]) for their studies. Because the different gas components, located physically away from the inner disk, reprocess the ionizing continuum into emission at other wavelengths, scientists are able to study how each of the X-ray corona and the broad-line region respond to the continuum variations and on what timescale. This form of light echo mapping (a.k.a reverberation mapping; § 3) can be used to establish the structure of the gas components in the central engine. The recent review by Cackett, Bentz & Kara[54] provide a good overview of what is currently possible with this technique.
4 Emission-line diagnostics reveal the growing black hole
Emission line diagnostic diagrams are often used to distinguish between galaxies with star forming regions from galaxies with central AGN activity. Gas will emit emission lines if energy – in the form of heat (e.g., increased pressure due to shocks propagating into the gas) or ionizing radiation – is injected into the gas. The emergent line emission will depend on the gas composition, density and temperature and the shape of the spectral energy distribution of the radiation incident on the gas. High energy photons from high mass stars can photoionize nearby gas, known as ionization nebulae or H ii regions, that in turn emit emission lines. The ionizing radiation from the central engine of an AGN is much more energetic than that produced by stars and is therefore able to ionize and excite gas to much higher energy levels. As a result, AGNs can produce emission from multiply ionized species such as Ne viii 780, C iii 977, O vi 1035, and N v, and the relative strength of the emission lines are also different than those emitted from gas excited by stars. This result of photoionization physics[55, 56] is used to distinguish star-forming galaxies from AGN or to identify the ionizing source of line emitting gas within individual galaxies that may have both star formation and AGN activity[57, 58].
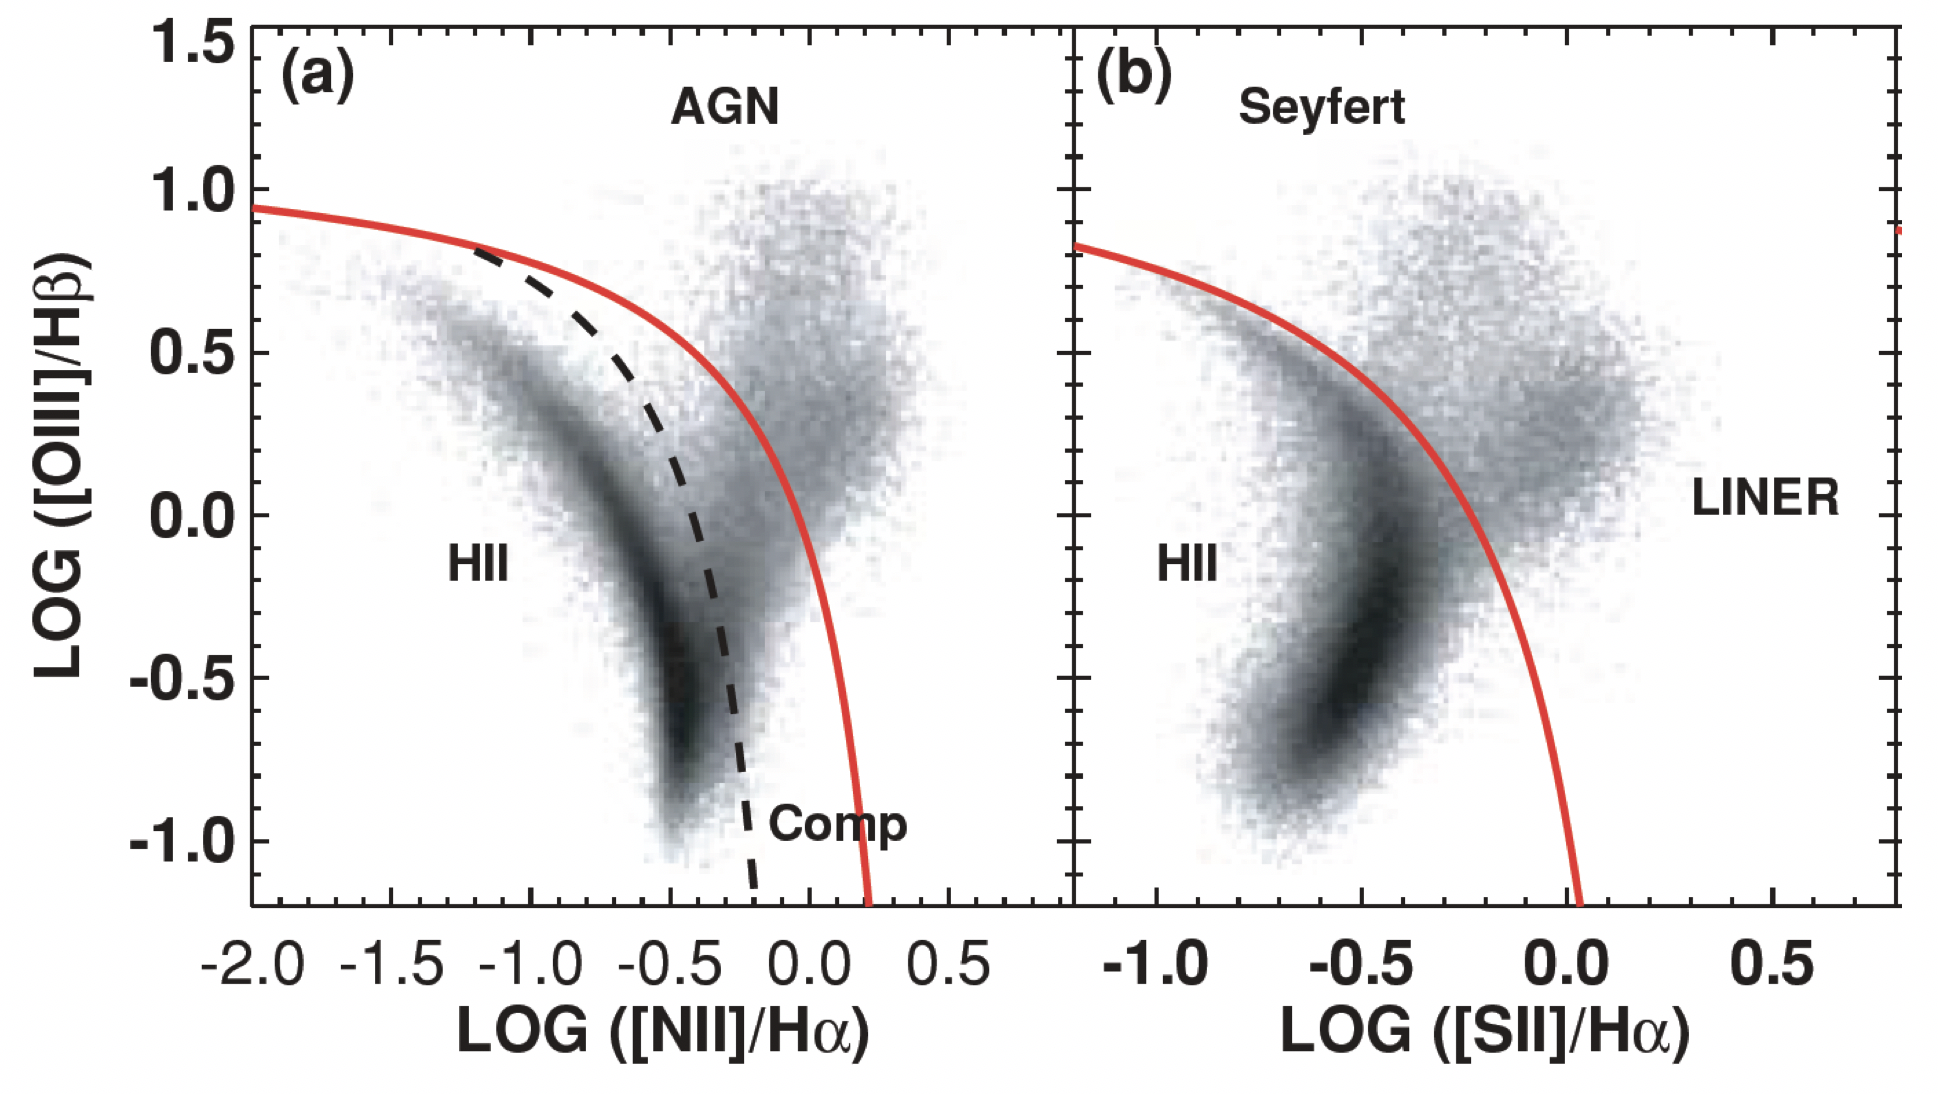
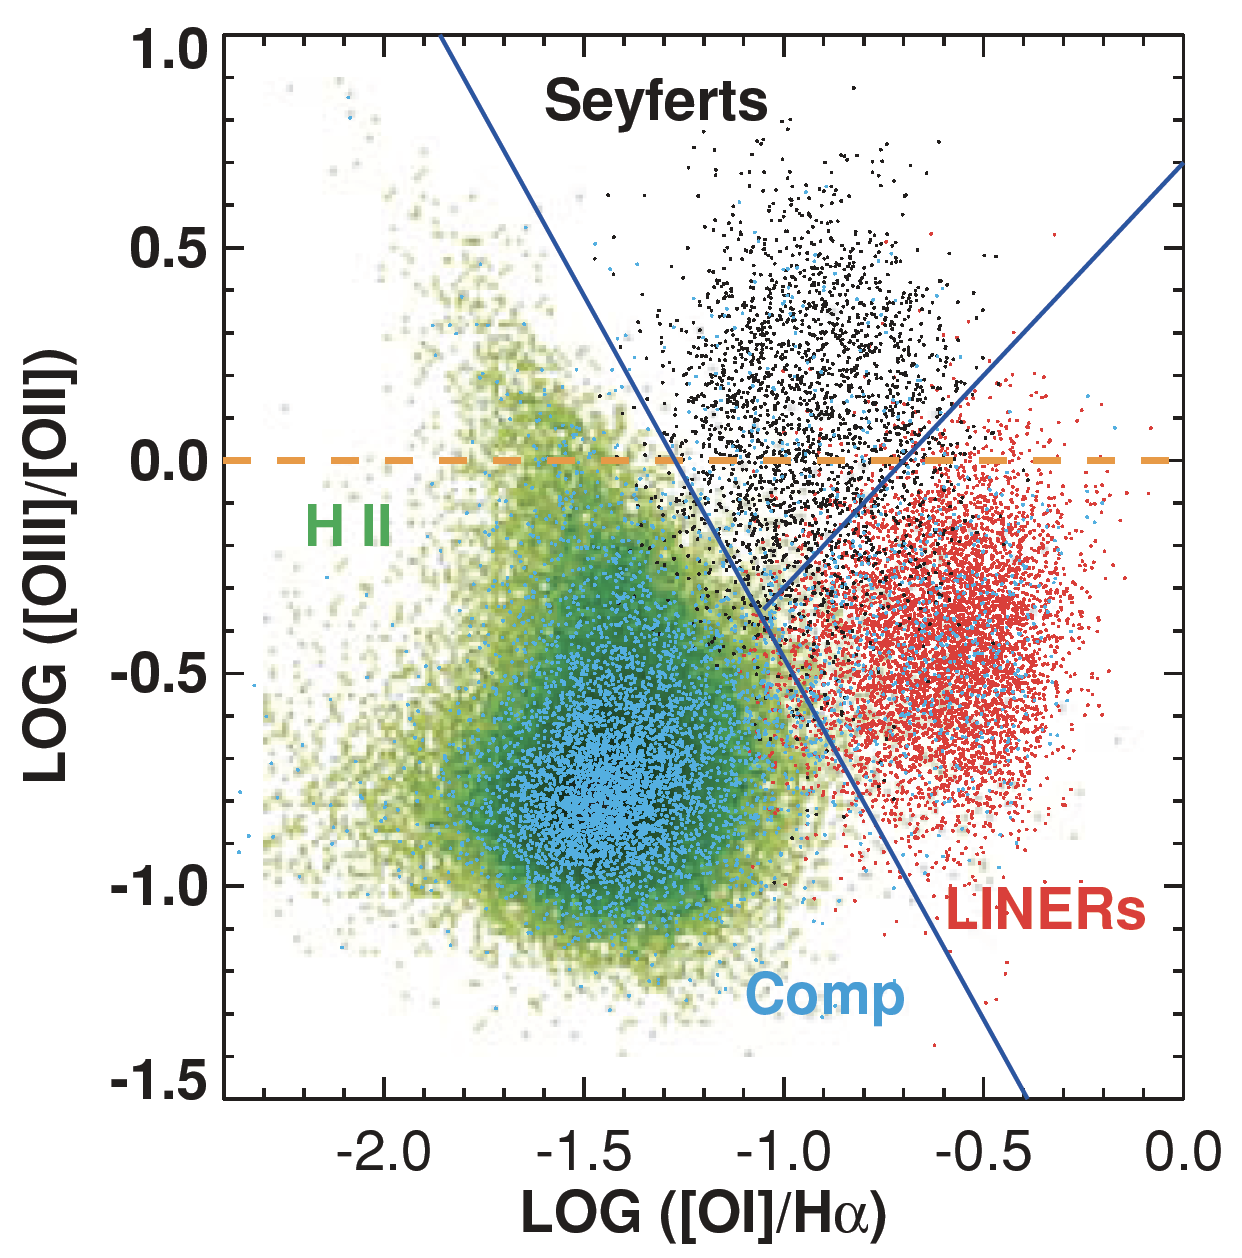
A key diagnostic is the line ratio pair of [O iii] 5007/H and [N ii] 6584/H (Figure 4a,b) where the two different ionizing sources (stars and AGN) are well separated[59, 60]. However, other line ratios (e.g. [S ii] 6717,6731/H , [Oi] 6300/H , [O iii]/[Oii] 3727, are also useful for separating galaxy types[61] such as Seyferts and LINERs. Sample diagrams are shown in Figures 4b,c. Because some galaxies contain both a central, weak AGN and have significant star formation, there is not a sharp division between galaxies classified as AGN and those classified as star forming (H II regions) in this diagram. It is not known if such composite galaxies are in a transition phase from an active black hole phase (AGN) to a quiescent one (or visa-versa), or if they are galaxies that spend their entire lives with a mixture of star formation and nuclear activity. Since a black hole will switch to an active phase whenever it has gas within its gravitational reach, it is quite likely that the class of composite galaxies (labelled ‘comp’ in Figure 4) is a mixture of all three categories (Seyfert, LINER, H ii region).
5 AGN types
The first AGN were discovered before anyone knew what they were. In 1909 Fath [62] detected strong emission lines in spectroscopic observations of the nuclei of two nearby galaxies, NGC 1068 and Messier 81. This was at a time when scientists had yet to discover the expansion of the Universe. Over time, scientists discovered a range of new objects with unusual properties – including spiral and elliptical galaxies with nuclear line and continuum emission that was not understood.
Carl Seyfert[63] presented observations of nearby spiral galaxies with a bright central source emitting strong and extremely broad emission lines of widths 8000 . Such galaxies are now known as Seyfert galaxies. With the emergence of radio astronomy, many new objects were discovered, including radio galaxies: nearby elliptical galaxies with powerful radio emission from their centers and large-scale radio jets emanating from the galaxy center (Figure 1). The radio galaxies that also emit narrow emission lines were called narrow-line radio galaxies, NLRG, and those detected in X-rays were classified as narrow-line X-ray galaxies, NLXG. Large radio surveys, such as the canonical 3C radio survey — the Third Cambridge Catalogue of Radio Sources[64, 65]— turned up a number of radio sources with point-like optical counterparts, that were then classified as quasi-stellar radio sources — QSRS, now known as quasars[66]. Optically luminous, stellar-like sources with very blue spectral slopes and broad emission lines were in subsequent years found in large numbers in optical surveys (e.g., the Palomar-Green Bright Quasar Survey[67]; Durham-AAT[68]; The Large Bright Quasar Survey[69]; the 2dF survey[68]). While these objects appeared to have similar properties to the QSRS, they had no radio counterpart, and were then classified ‘quasi-stellar objects’ (QSOs). In recent years, the term quasar is used for both the radio-loud and the radio-quiet variety. Other types of peculiar sources were since discovered, such as BL Lac objects and optically violent variables, OVVs — collectively known as blazars. These are objects with high-amplitude variability on very short time scales (of order a day) and the emission is highly polarized (up to a few percent). Furthermore, BL Lacs do not have emission lines in their optical-UV spectra. The AGN taxonomy can be confusing, but the many AGN types are the result of scientists not knowing the underlying physics. Yet, it was quite clear that the bright nuclear emission with a rather hard (i.e., blue) spectrum is not of stellar origin (§ 4).
It appears that all massive galaxies contain a central massive black hole. When gas is transported to the center and onto the black hole, the nucleus turn into an AGN. So all the different AGN types are to first order the same type of object, namely a black hole powered source. The object properties that we see depend primarily on our viewing angle, the mass of the central black hole and its available fuel. The angular dependence is described by the Unified Model[70, 12]: Depending on our viewing angle, we may see the central engine directly (a type 1 AGN with broad and narrow emission lines) or our line of sight to the ionizing source goes through the obscuring torus, hiding the broad lines (a type 2 AGN with only narrow emission lines) and absorbing the central optical-UV continuum and the soft X-ray emission. If we view a radio source directly down the jet (to within a few degrees) we will see a blazar[39]. The black hole mass and its fuel supply determine the luminosity of the AGN. The more massive black hole can accrete more gas and thus sustain a higher luminosity, which can eject or ionize gas in a larger central volume of gas — the receding torus scenario — providing a clear view of the central engine over a wider range of viewing angles[71]. The power of the AGN is what sets Seyfert galaxies apart from quasars, the most luminous subset of AGN. While all AGN have relatively similar spectral energy distributions (barring blazars; § 1), they display different luminosities, owing predominantly to the mass accretion rate.
The recent discovery of especially optical ‘changing-look AGN’[72, 73, 74] has emphasized the additional need for a time or evolutionary phase dependence in the Unification model[75]. For these sources, changes in the accretion state or in the properties of the ionizing source occur on timescales between a few years to a few decades[73, 74, 76, 77], presumably due to changes in fuel supply or disk instabilities[75, 78, 79]. In some cases within a matter of a few years, the AGN turns on (NGC 2617[72]) or off (Mrk 590[73, 80]), or even off and on again (NGC 4151[73]; Mrk 590[58]; Mrk 1018[81]). Although changing-look AGN are now found in large numbers[81] we still do not understand the phenomenon. For example, accretion state changes due to a dwindling fuel supply[75] is expected to take place on timescales of millions of years or more[80], not a few years.
6 Fundamental Plane of Black Hole Accretion
The fundamental plane222The fundamental plane described here is different from the ’Fundamental Plane of the Broad-line Region’ mentioned in § 1. of black hole accretion is a less-well understood relation that ties together bulk energetic emission in radio and X-ray, normalized by the mass of the accreting black hole. The term ‘fundamental plane’ is used in astronomy to indicate a two-dimensional manifold, embedded in a three-dimensional space. If any two of the properties are known, then the third can be predicted with the fundamental plane.
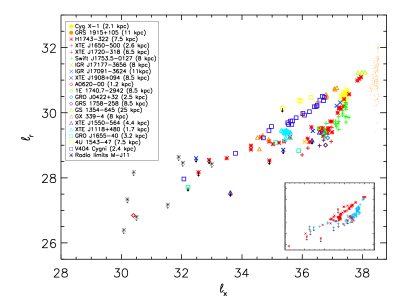
The three dimensions of the fundamental plane of black hole accretion are logarithmic mass (), logarithmic radio luminosity (), and logarithmic X-ray luminosity (). The normalizations are chosen to be reasonable for massive black holes, but the relation applies to black holes of all masses. Typically, the core radio luminosity is calculated as at 5 GHz; and the X-ray luminosity is a bandpass luminosity calculated in a hard X-ray band, usually 2–10 keV. The origins of the fundamental plane of black hole accretion come from studying the relation between and for X-ray binaries[82]. The range of masses in X-ray binaries is small enough to ignore, and for these it was found that . Follow-up work has shown that what appeared as a universal relation may actually be at least two different tracks (Figure 5)[83]. Thus what originally seemed to be a simple, universal relation concerning the regulation of energy emitted in two different bands may be far more complex.
In order to isolate flux coming from an accreting black hole, relatively high spatial resolution is needed, especially at low accretion rates, when low-luminosity AGN (LLAGN) have X-ray luminosities comparable to the brightest X-ray binaries, and in galaxies with high star formation rates, which can produce significant radio emission.
The pioneering studies to examine the fundamental plane of black hole accretion across the mass scale did so with aims to explain the underlying physics. One explanation is that in sub-Eddington jet-dominated systems, both the radio and X-ray emission originate in the jet[85]. In this model, black holes that accrete at higher Eddington rates are not expected to follow the same relation and yet there is evidence that Seyferts do follow it[84]. Another idea is that X-ray emission depends only on the mass accretion rate and jet properties (and, hence, radio emission) depend on the mass of the black hole, the accretion rate, and the distribution of energy of electrons in the jet [86]. The underlying physics of the fundamental plane of black hole accretion is still not understood. Given the large scatter and the wide variety of black holes and accretion modes that can be empirically explained by a three-dimensional fit in logarithmic space, the plane may be a blunt tool for understanding the details of accretion and outflow physics.
The fundamental plane of black hole accretion can be written as
| (1) |
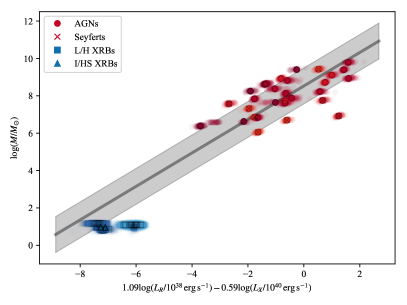
Gültekin et al.[84] used a sample of LLAGN whose black holes had direct, dynamical mass measurements and best-fit parameters of , , . The measured intrinsic scatter of the relation in the direction of mass is Gaussian in shape with the natural logarithm of the dispersion estimated to be . The form of the fundamental plane with mass as the dependent variable, eqn. (1), was used so that measurements of radio and X-ray luminosities could be used to estimate black hole mass, a notoriously difficult quantity to measure (see next section), but with the substantial intrinsic scatter it is only a rough estimate. It is, however, useful for distinguishing between X-ray binaries and massive black holes.
3 Measurements of Fundamental Properties of Black Holes: Mass
In general relativity, the spacetime around a black hole can be described using only three parameters: mass (), spin (), and electrical charge (). In nature, there will always be enough free electrical charges to neutralize a charged black hole. We will consider only how we measure in this section and , in the following section. Mass is always measured, directly or indirectly, by measuring the speeds of material surrounding the black hole. Dimensionally, we have
| (2) |
and we see that we only need to measure , the virial velocity of the material (e.g., the Keplerian velocity), and , the separation of the material from the black hole. For stellar and gas dynamical mass measurements, is measured with superb angular resolution, and for reverberation mapping measurements it is measured by timing the light-travel time from the inner parts of the accretion disk to the gas emitting the broad emission lines, namely the broad-line region, as described in Section 3. In all cases, velocities are measured as radial velocity line widths — the projection of the virial velocity onto our line of sight.
1 Stellar dynamics
Stellar dynamical mass measurement techniques are any that use the motions of stars as the tracer of the black hole’s gravitational potential. The advantage of using stars is that their motions are influenced only by gravity, not by winds or radiation pressure. A complication is that, with exception at the Galactic center, we cannot see individual stars and thus must do something to infer the ensemble kinematics of possibly many different stellar orbits. In general, one wants to be able to have angular resolution capable of isolating stars whose orbits are in a gravitational potential dominated by the black hole and not by the rest of the galaxy. This region is called the black hole’s ‘sphere of influence.’ There are different ways of measuring the size of the black hole’s sphere of influence, but the best is to use the radius at which the enclosed mass of stars is equal to the mass of the black hole: . A commonly used alternative is to define , where is the central stellar velocity dispersion. The equal mass prescription may be much larger than the velocity dispersion prescription in galaxies with shallow central density profiles. Even then, with sufficiently good description of the stellar density, one does not strictly need to resolve the sphere of influence; it is only an order-of-magnitude rule of thumb for resolution requirements.
Schwarzschild Method
The Schwarzschild orbit library method[87] is the most general stellar dynamical equilibrium model of a self-gravitating system that can reasonably be used to measure a black hole mass. First, imaging data of the galaxy is used to measure the stellar surface brightness. Imaging in multiple bands is preferred so as to mitigate extinction by dust. The surface brightness distribution is converted to a stellar luminosity density distribution with assumptions about the geometry and viewing angle. The geometry assumed is usually either axisymmetric or triaxial, though very recently stellar bars have been included. The viewing angle can be parameterized and iterated over for comparison. Then the luminosity density is converted to a mass density with an assumed mass-to-light ratio (). The mass-to-light ratio is typically assumed to be constant and parameterized and iterated over for comparison, but stellar evolution models are also sometimes used to calculate the expected value of . Once the stellar density distribution is calculated, it is converted to a gravitational stellar potential by solving Poisson’s equation. To the stellar gravitational potential, one typically adds a dark matter halo potential and a central point mass. The dark matter halo can be parameterized in multiple different ways, but two common parameterizations are as a Navarro-Frenk-White[88] (NFW) profile or a ’cored logarithmic profile’. The central point mass is the black hole.
Thus, by using imaging data and some assumptions about the geometry and mass-to-light ratio along with a handful of parameters (viewing angles, , dark matter halo parameters, and ) one has a complete mass model of the galaxy. All that remains to be done is to compare the expected velocity profiles of the model to the data. The velocity data are high-spatial-resolution spectra of stellar absorption lines. Typical lines used are the Ca 2 triplet (8498, 8542, and 8662 Å), the CO ‘bandhead’ (i.e., a series of broad stellar absorption lines at 2.3–2.5 ), and the Ca 2 H&K lines (3968.5 and 3933.7 Å). These lines are used as they are strong features in the K- and M-giants that dominate the stellar spectrum. The spectra also need to be taken at large radial distance from the center of the galaxy because the model covers the entire galaxy. When long-slit spectra are used, this is usually done with major and minor axis slit placements; when integral field units (IFUs) are used, spectroscopic data are obtained at each position in the image covering the entire galaxy. Once the spectra are taken, the absorption features are deconvolved to yield the line-of-sight velocity distributions (LOSVDs) in each spatial bin in the spectra.
To create the LOSVDs of the model to compare to the data, a library of orbits is calculated. For each potential considered, one calculates the orbits of representative stars. One must be sure to sufficiently cover orbital parameter space in the geometry. While the orbits are calculated, time and line-of-sight velocity spent in each spatial bin is recorded. The next step consists of weighting each of the calculated orbits such that the sum of the light added to each bin (proportional to the time spent in that bin and the weight assigned) reproduces the observed light distribution of the galaxy. Because typically – orbits are calculated, this is an underconstrained problem: there are many combinations of weights that can reproduce the imaging data. Finally, using the combination of weights that can reproduce the imaging data, the LOSVD of each bin of the model (proportional to the time spent in that bin and the weight assigned to each orbit) is compared to the observed LOSVD. By comparing the goodness-of-fit across parameter space, one may infer the value of black hole mass (and other parameters) that best explains the data, given the model. Note that this Schwarzschild method is self-consistent in that it uses the light of the galaxy to calculate a potential in which orbits are calculated that must, through some weighting, combine to reproduce the potential in which they are calculated.
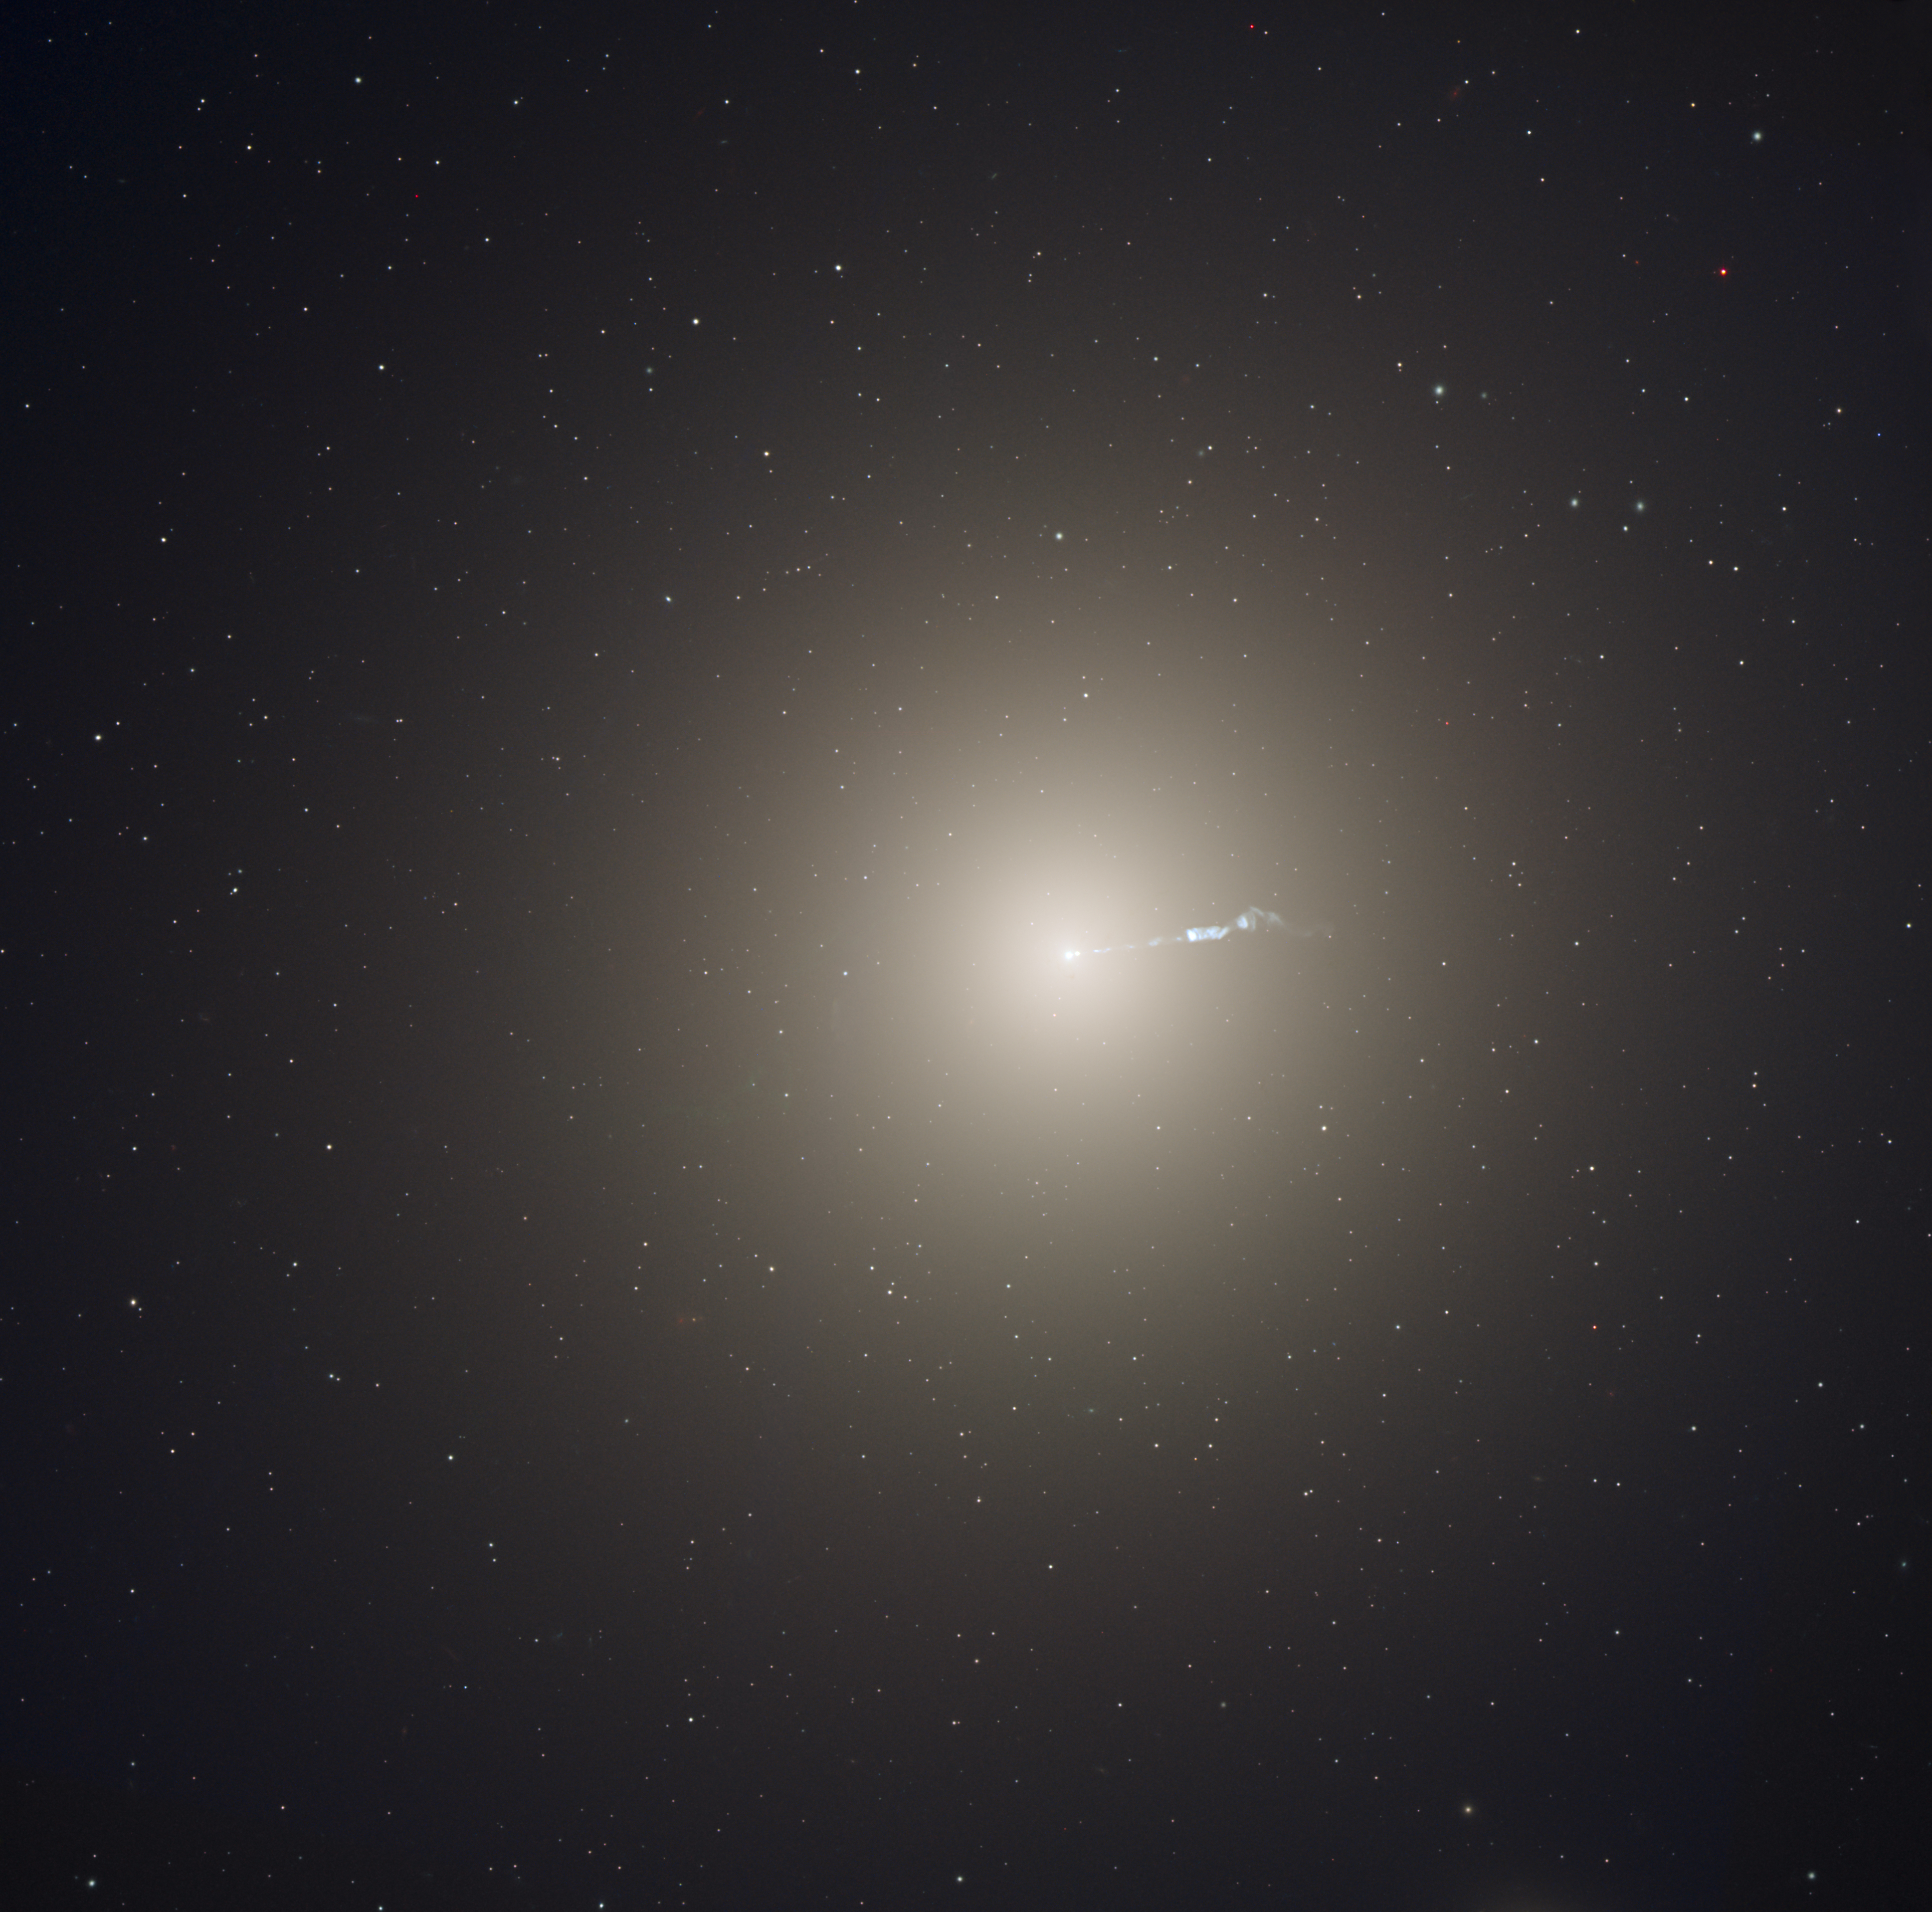
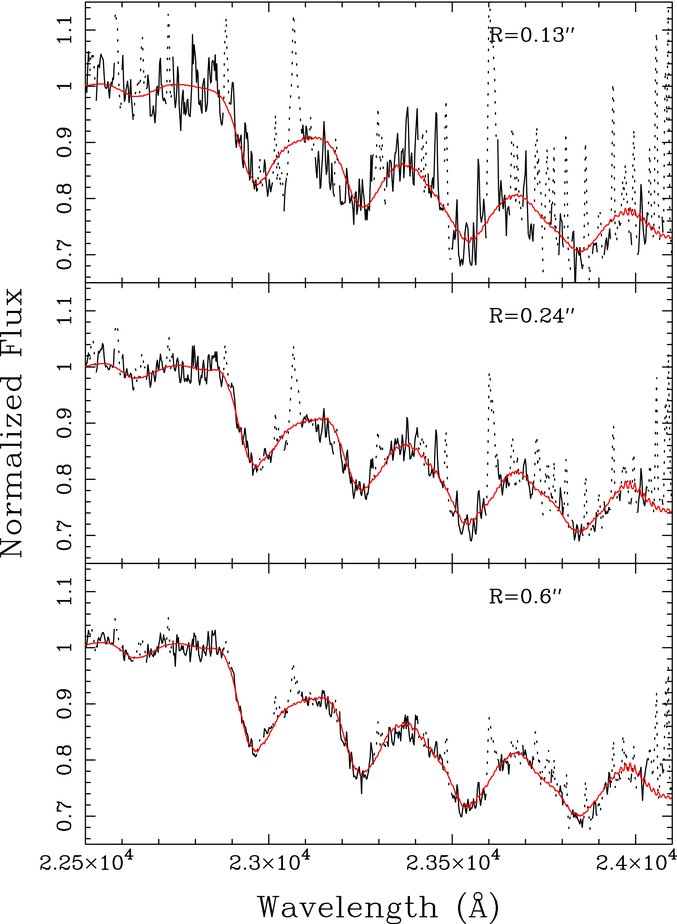
One example of the Schwarzschild method is the measurement of the black hole in M87[89], the giant elliptical in Virgo seen in Figure 6. Measurement of M87’s black hole mass required ground-based spectroscopy with adaptive optics and a large aperture telescope because of the relatively low central surface brightness. Several spectra at different distances from the center of M87 are shown in Figure 6, revealing that the weak AGN contaminated the central spatial bin, reducing the effective angular resolution. The other spatial bins, however, show obvious CO bandheads in absorption that were used to extract the LOSVDs. The complete modeling of the galaxy resulted in a marginalized curve that estimates the black hole mass[89] to be , in agreement with the later mass estimate from the Event Horizon Telescope (§2).
Jeans Anisotropic Modelling
The Jeans anisotropic modelling (JAM) method is an additional stellar dynamical technique for modeling any gravitationally bound system of particles. The modeling can recover a variety of kinematic properties of the systems under investigation, including dynamical mass-to-light ratio. Inference of mass-to-light ratios leads to black hole mass estimates by finding evidence for a central point-source increase in the mass-to-light ratio. This point-source increase in the mass-to-light ratio is then attributed to a black hole, even if a variety of now less plausible alternatives could also potentially explain it. The attribution of a point-source increase in mass-to-light ratio to a black hole is a general feature of all stellar and gas dynamical mass measurements. JAM works by using the Jeans equation solutions to the collisionless Boltzmann equation, but with an extra anisotropy term that parameterizes the kinematic deviations from a perfectly isotropic distribution function. Combined with assumptions about the geometry and the variations in anisotropy, JAM can model high-spatial-resolution spectroscopy to estimate black hole masses that are in strong agreement with the more general Schwarzschild modeling estimates.
2 Gas dynamics
Gas dynamical mass measurement techniques refer to any technique that uses the motions of gas as the tracer of the black hole’s potential. An advantage of using gas is that, since it tends to form a disk of material, the geometry is easy to model. A limitation of using gas is that non-gravitational forces, non-circular motion, and three-dimensional effects can be very difficult to take into account. Another limitation is that while there are almost always stars near a central massive black hole, not all galaxies have nuclear gas disks. This may explain why the best data and analysis of the gas disk around the central black hole in M87 finds a mass estimate a factor of below the stellar dynamical and Event Horizon Telescope estimates [90, 89, 91]. High spatial resolution is still required, and this plays into the strengths of radio interferometers sensitive to molecular gas and megamasers.
Ionized gas
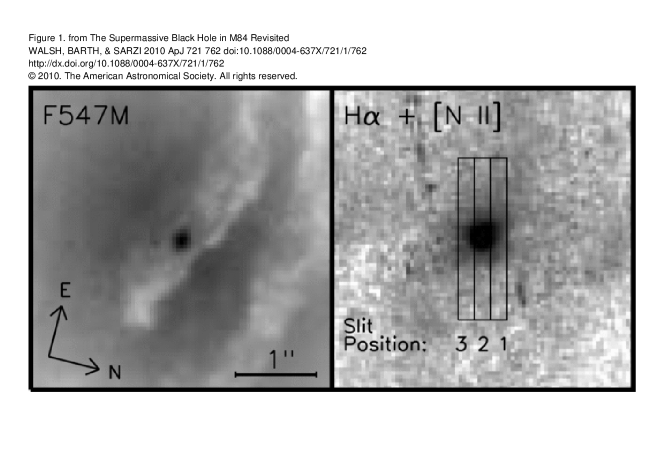
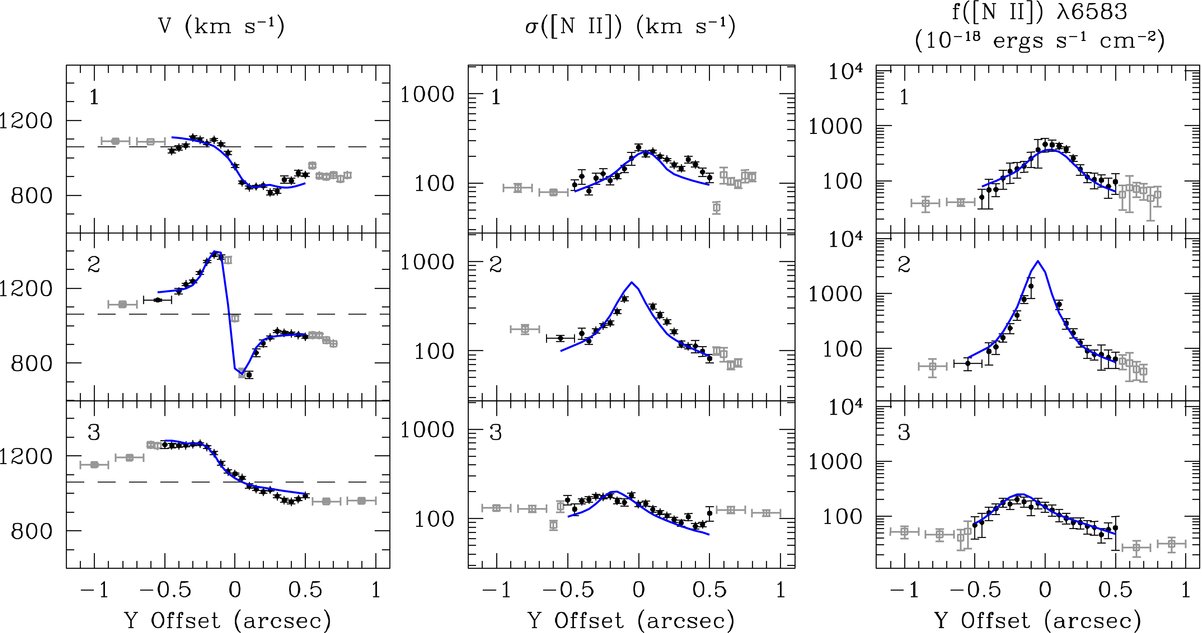
The most widely used gas dynamical technique is ionized gas since the gas may emit brightly. Typical emission lines used are H (6563 Å) and [N 2] (6548 and 6583 Å). To estimate the mass of the black hole, one usually assumes a razor-thin circular disk with an emissivity determined from narrow-band imaging. To account for inclination effects, either IFU or multiple long-slit placements are needed. From the spectra, one obtains line-of-sight velocity and velocity dispersion (and sometimes higher moments of the line profile) at many locations in the ionized gas disk. A model is then calculated for the circular velocity of the gas about the galaxy’s systemic velocity. The circular velocity is a function of enclosed mass, i.e., the sum of the black hole and the stellar mass, which is determined by imaging and a parameterized mass-to-light ratio. Other parameters that need to be included in the model are inclination and position angle of the gas disk as well as an offset to account for sub-pixel localizing of the black hole.
We show an example of ionized gas modeling of M84 using a combination of H and [N 2] emission in Figure 7[92]. The best-fit model is an excellent description of the data and yields a mass estimate of . In order to model the data well, an intrinsic velocity dispersion was included in the gas motions. This intrinsic velocity dispersion would not manifest itself if that gas were (i) only responding to an axisymmetric gravitational force while (ii) in a thin disk with (iii) purely circular motion. At least one of these assumptions is violated, but all have been suggested: (i) nongravitational pressure forces, (ii) flared disks, and (iii) net radial motion from spiral instabilities or significant inflow/outflow.
Molecular gas
The sensitivity and angular resolution of the Atacama Large Millimeter Array (ALMA) has made molecular gas measurements of black hole masses viable for a large number of galaxies. The principle of this measurement and the modeling technique is very similar to the ionized gas case (Fig. 7). With cold molecular gas, however, it is generally assumed that pressure forces are completely subdominant relative to the gravitational forces. The effects of three-dimensional geometry and radial motion, however, still need to be taken into account. Since ALMA came online, this technique has been applied predominantly to cold gas observations of quiescent black holes in centers of elliptical galaxies[93, 94, 95] but also a few dwarf galaxies[96, 97] and a low-luminosity AGN[98].
Megamaser
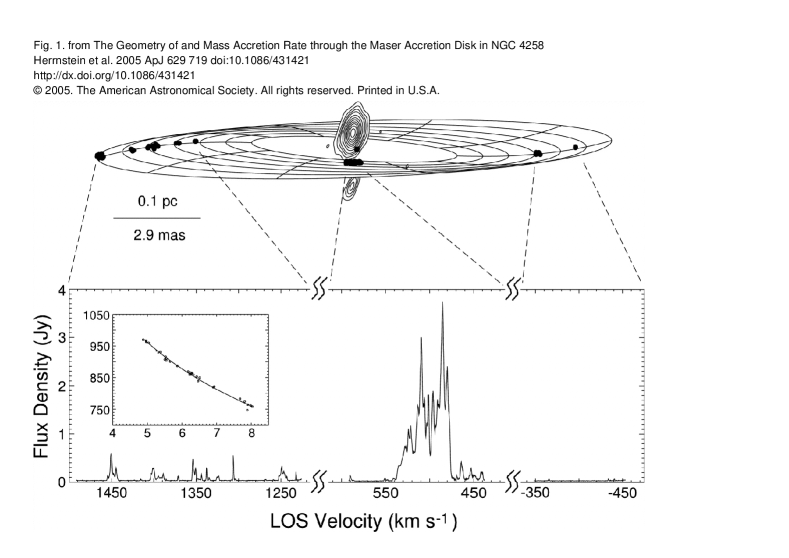
If a gas disk around a black hole is inclined to within a few degrees of edge-on towards our line of sight, it may be visible to us as a water megamaser, which allows precise black hole mass determinations. Megamasers are identified by the 22 GHz water emission line, which is only possible when a high column of water is visible along our line of sight. The megamaser is useful for measuring black hole masses if it can be determined to be in a Keplerian disk. The hallmark signs of a disk (as opposed to, e.g., gas inflow or outflow) in the spectrum are triple sets of emission lines within several hundred of the galaxy’s systemic velocity — one line arising from the approaching side of the disk, one from the receding side, and one dominated by the portion moving tangential to our line of sight. These triple sets can be discovered with wide surveys using low-angular-resolution radio telescopes with good sensitivity. After discovery, observations with high angular resolution (i.e., VLBA observations) can measure precise positions and velocities of individual masing spots. The position–velocity diagram is then modelled as an inclined, warped rotating disk whose motion is dominated by a central gravitating mass, that is, the black hole. The position–velocity diagram fitting does not suffer from degeneracy with inclination angle because the latter is well constrained to be close to edge-on by the mere fact that it is a megamaser. In some cases, multi-epoch observations can measure accelerations of individual masing spots to get a geometrical distance to the source. This later fact is being exploited to measure the Hubble constant. The hallmark target for megamaser observations is NGC 4258 shown in Figure 8[99].
3 Gas Dynamics near Accreting Massive Black Holes
When the supermassive black hole is accreting material, emission is released from the central regions of the galaxy. At a moderate to high accretion rate this emission is so strong that it washes out the faint spectral absorption features (Fig. 6) that are commonly used to measure the kinematics of stars orbiting the black hole. The central glare thus prohibits the use of stellar and ionized gas kinematics (as outlined above) to measure the mass of the black hole for AGN, unless the AGN is particularly weak, and alternative methods are used.
Reverberation mapping
The reverberation mapping (hereafter, RM) technique is currently the most robust black hole mass determination method for powerful AGN. RM does not require high spatial resolution, as do the stellar and gas kinematical methods, but relies on temporal resolution. Therefore, the RM technique has the added advantage of being applicable to black holes residing in galaxies at distances greater than 100 Mpc, that is, beyond our local Universe. The RM method assumes that the motion of the broad emission line gas is virial and is dominated by the black hole gravity:
| (3) |
where is the virial (e.g., Keplerian) velocity of the broad line gas residing at the distance from the black hole and is the gravitational constant. We are unable to measure directly, but we can determine the line-of-sight projection of this velocity in the emission line spectrum as the line width, . Therefore, the approximation is used where is the scaling factor that accounts for our ignorance of the structure and kinematics of the broad line gas. This -factor can be estimated in a couple of ways, addressed in § 3.
The broad line emission is powered by the ionizing radiation from the central continuum source of the inner accretion disk (§ 2). The accretion flow is not smooth (in mass or time) so the emitted continuum flux changes with time. Because the broad-line region is both extended and not co-spatial with the continuum source the light curve of the broad line fluxes is a slightly smeared copy of the continuum light curve, shifted in time. This time delay, , is taken to represent the light travel time of the disk photons, thereby allowing an estimate of the characteristic size of the broad-line region, . Determining is in practise a non-trivial inversion problem involving a so-called transfer function that encompasses the physical processes of the light and matter interaction[100, 101]. The transfer function connects the emission line light curve with the ionizing continuum light curve. The technical details of the RM technique, as described by Blandford & McKee[23], are summarized by Peterson[100].
Since RM measures the distance to the gas that produces the variable emission lines, to measure the black hole mass requires a measure of the velocity of that same gas. From the spectroscopic monitoring data is measured as the width of the broad H emission line in the RMS spectrum (i.e., the one standard deviation relative to the mean spectrum based on all observed spectra during the observing campaign). Early work confirmed that the broad emission line gas kinematics is dominated by the black hole gravity, as several emission lines obey the virial constraint[102, 103] . While there are multiple ways to measure the line width (e.g., the full width at half maximum, the line dispersion or the mean average deviation), the line dispersion is used since it is less susceptible to spectral noise and it is well defined for RMS profiles[104, 105]. Moreover, it appears to be less biased[106].
Over the past 30 years numerous RM monitoring campaigns have reverberation mapped more than 60 AGN in the nearby Universe[104, 107] showing a range of black hole masses between 300,000 and 1 billion and an average of 30 million (almost 8 times more massive than our Milky Way black hole). The smallest black hole in this sample resides in a low luminosity dwarf galaxy NGC 4395 where it accretes at a very low level[108]. The most massive of these black holes is in the center of a local quasar, PG1426+015, discovered in the Palomar-Green survey[67]. For comparison, distant quasars have black hole masses[109, 110, 111] between a billion and ten billion . The exact value of the most massive black hole in the Universe is difficult to assess because for black holes beyond our local Universe we have so far mostly been able to estimate their mass (§ 3) and these estimates have uncertainties of factors of a few[109]. Very massive black holes of this caliber are also known to exist in local giant elliptical galaxies where they have ceased to accrete material. The black hole in the giant elliptical galaxy Messier 87 in the nearby Virgo Cluster (§ 2) is among the most massive known in the Universe at a whopping 6.5 billion solar masses[91].
Until a few years ago, most existing RM studies targeted the H emission line in the restframe optical region because the forbidden [OIII] 5007Å narrow emission line just redward of H offers an excellent way to flux calibrate the observed spectra to high precision. The reason is that the narrow line region emitting the [OIII] line resides at a sufficiently large distance that the [OIII] emission will not vary on the timescales of the duration of the monitoring campaigns[104, 112]. Moreover, because of the low particle density of the narrow-line region the recombination timescale is long, thus suppressing rapid variability. Also, the [OIII] line profile provides a template to correct for the narrow line contribution to the observed H profile. While the H emission line is stronger, observing H is more efficient as in many cases it requires just a single spectral setup.
In addition to H, other strong broad emission lines, such as C iv 1549Å[113, 49] and Mg ii 2800Å[114], have been reverberation mapped. For local AGN these lines require observations with space-based telescopes. Because reverberation mapping campaigns are rather resource intensive they are not trivial to organize with space-based telescopes and as a result, far fewer AGN have been studied at ultraviolet wavelengths. Nonetheless, eight nearby AGN have so far been monitored in the ultraviolet with the International Ultraviolet Explorer (1978 – 1996) and/or the Hubble Space Telescope (launched in 1990); an overview is provided by De Rosa et al.[115] The most extensive and intensive space-based monitoring so far is undertaken in the recent campaigns of the AGN Space Telescope and Optical Reverberation Mapping (AGN STORM; PI: B.M. Peterson) projects targeting NGC 5548 in 2014[115, 116] and Mrk 817 in 2020–2022[117, 118].
The past 10 years have seen a strong increase in RM studies. Monitoring programs of large samples of distant AGN with the aim to determine broad-line region lags (time delays, ) and black hole masses have been launched as part of large surveys, such as the Dark Energy Survey (OzDES[119]) and the Sloan Digital Sky Survey (SDSS-RM[120]). These efforts are now increasing the number of AGN for which the size of the C iv[121, 122, 123, 124] and Mg ii[125, 126, 127, 128] line regions are estimated. While such surveys can monitor a much larger sample of objects at a time, they are often limited to a fixed exposure time for all targets in each survey field, regardless of the luminosity or variability properties of each target. Therefore, robust RM results are not guaranteed for all targets. While these surveys, like the original RM campaigns of local AGN, will preferentially provide results for the brighter and most variable sources, the hope is that these surveys can target a broader and less biased subset of the AGN population[129, 130] than the original sample of RM AGN[104]. Also, if the early predictions[131] are correct, then RM analysis of large samples of distant AGN promise to measure cosmic distances and hence constrain cosmological parameters (§ 13).
Because traditional spectroscopic RM studies are resource intensive a new technique is being developed that is showing quite some promise. This ’photometric reverberation mapping’ method predominantly relies on monitoring observations through broad-band and narrow-band imaging[132, 133], which may prove useful with future telescopes such as the Large Synoptic Survey Telescope coming online.
Determination of the f-factor
If the intrinsic value of the black hole mass is precisely known, the -factor can be determined. At present, the black holes with very precise and independent determinations of the mass – e.g., via the megamaser method (§ 2) or by measuring the extent of the black hole shadow (§ 2) – cannot be weighed with reverberation mapping. For other objects, it is thus only possible to obtain an estimate of . Efforts to use forward modeling of the broad-line region emission[134, 135] have reported estimates for individual AGN, assuming the model is representative of the broad-line region. Spectropolarimetric studies[136, 137, 138] have also contributed to estimates of . Onken et al.[139] determined an empirical sample average estimate of by assuming that the local reverberation mapped black holes are sufficiently close to their final mass due to their low mass-accretion rates. This assumption means that the relationship for AGN should coincide with that of quiescent black holes in the local Universe, allowing for the scaling factor to be constrained.
Velocity-Delay Maps
Given sufficiently high quality spectroscopic and photometric data obtained at high cadence, the RM technique can provide a so-called velocity-delay map, probed by the ionizing photons as they propagate through the broad-line region. This map shows how the broad line gas of a given velocity responds to continuum variations. By connecting the velocity to a given central distance the velocity delay maps hold important information about the three-dimensional structure and kinematics of the broad line gas projected onto our line of sight, as well as its inclination to our sight-line. One advantage of the velocity delay map is that this two-dimensional transfer function (that depends on velocity and time delay) promises to provide black hole mass measurements without the need for the -factor.
The first 1-dimensional velocity-delay maps were gleaned from the International Ultraviolet Explorer monitoring data of NGC 5548, now one of the most well-studied Seyfert galaxies[140, 141]. In recent years the data quality and cadence have improved sufficiently to provide detailed features in the 2-dimensional velocity delay maps, showing clear signs that the broad-line region kinematics can include inflows and outflows in addition to the predominant Keplerian motion[142, 143, 144, 115]. The most detailed and high quality velocity delay maps obtained so far are based on the 6 months campaign on NGC 5548 of AGN STORM[145].
Radius – Luminosity Relationship
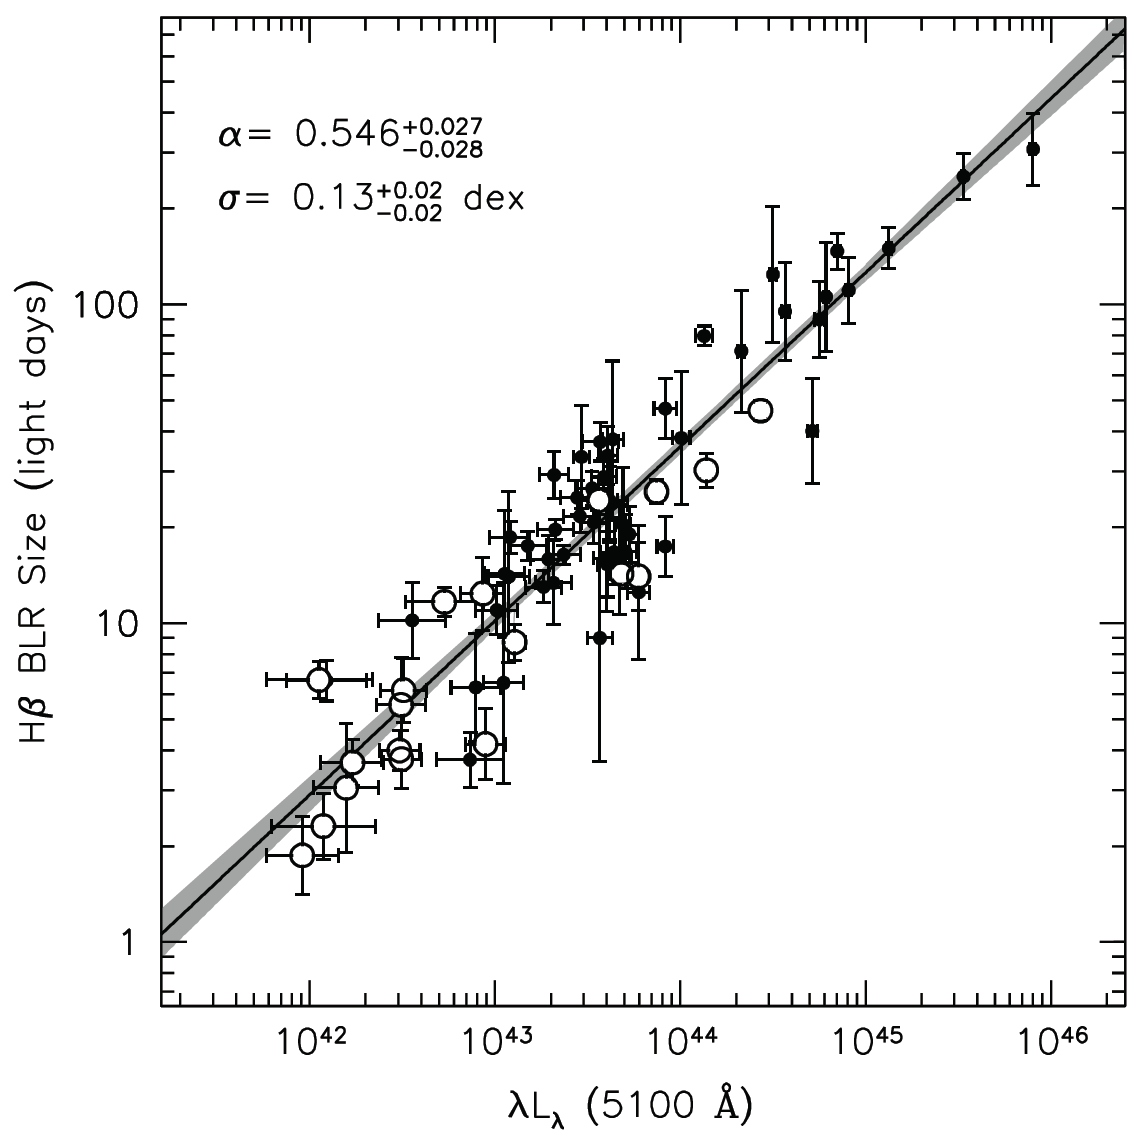
Based on the large body of RM work over the years, the empirical radius ()–luminosity () relationship has been established. It shows that the size of the broad-line region scales[146] with the continuum luminosity: the more powerful the central source, the larger the broad-line region. This is also seen for a single AGN: as the source luminosity changes, the size of the broad-line region changes – known as ’breathing’[147, 148, 149]. With increasing luminosity, the photon flux penetrates further into the broad line gas, changing the ionization structure of the gas, thereby shifting the location at which the gas is most efficiently emitting a given emission line. This consequence of photoionization physics was discussed by Baldwin et al.[150] in the framework of their Locally Optimized Cloud model.
The distance (i.e., radius) to the H broad emission line region correlates strongly with both the optical and the infrared continuum luminosity[151, 152]. The optical relationship for H (Fig. 9, left) turns out to be quite tight once the stellar light in the host galaxy has been corrected and improved distance measurements to the nearest AGN are adopted[153]. Restricting the relationship to the most accurate measurements[154], there is a strong potential for this relationship to measure cosmic distances (§ 13).
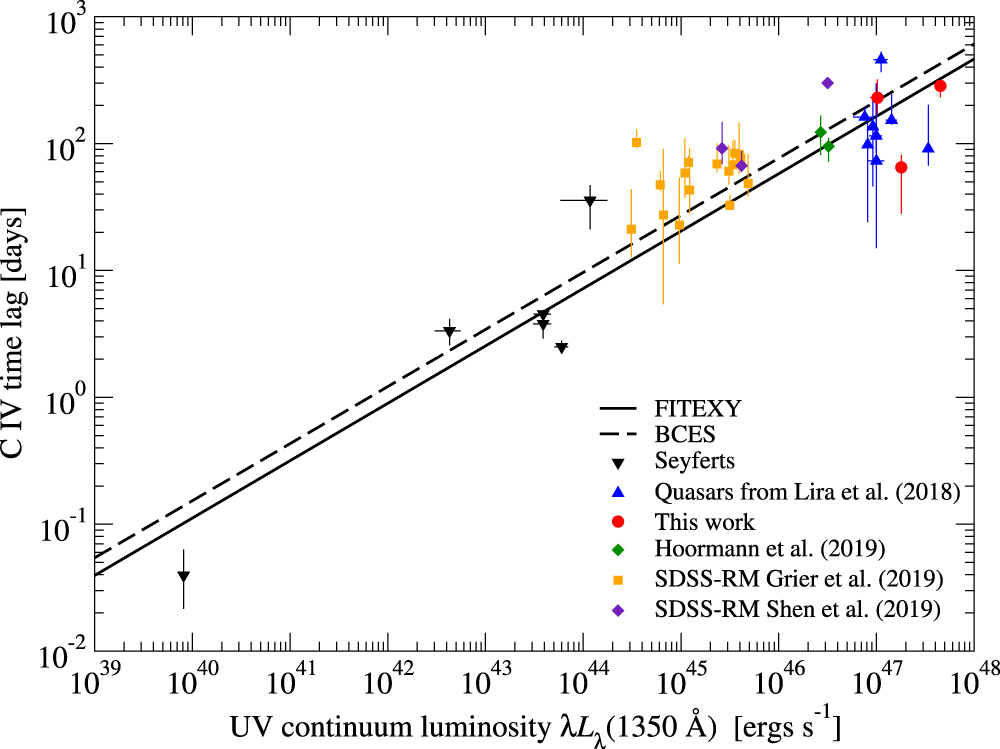
The recent increase in RM studies of distant black holes has provided better statistics to the relationship for C iv (Fig. 9, right), especially at high luminosities[155]. This relationship has a slope consistent with 0.5 , similar to that of H[153]. Although the statistics for Mg ii lags are increasing sufficiently to test for a (Mg ii)– relationship, there is currently a significant scatter[128]. The reasons for this scatter may include the difficulties in determining the 3000 Å luminosity and the Mg ii line flux due to strong blending from Fe ii and the lower responsivity of the Mg ii line[147]. The recent RM surveys show that for the general AGN population the broad-line region size depends not only on black hole mass but also mass accretion rate and perhaps other properties [156, 130]. In particular, distant high-luminosity quasars show H and Mg ii delays that are shorter than expected from the local (H ) relationship[157, 126].
Single-epoch Scaling Relationships
While the RM technique provides the most robust mass determinations of the black holes powering AGN, it is quite resource intensive – requiring large monitoring campaigns of individual targets. Single-epoch scaling relationships offer quick mass estimates based on measurements of an individual spectrum of the target, albeit with uncertainties[158] as large as a factor of several. The single-epoch mass estimates are mere approximations to the RM mass determination. While RM uses the width of the variable emission line and the measured responsivity-weighted distance to the line emitting gas (§ 3), the single-epoch method relies on the width of the line profile in a spectrum obtained at a random luminosity level plus an estimate of from the continuum flux in said spectrum combined with the relation for an estimate of . The method was originally developed for the H and C iv 1549 emission lines[159, 160, 161, 158]. Many authors have since presented their own single-epoch scaling relations for the main emission lines of H , H , Mg ii, C iv, and C iii] [162, 110, 163, 164, 165], each with their own advantages and disadvantages[166, 165].
The large body of work studying line width behavior with luminosity for individual AGN and across the AGN population has shown that the Mg ii and C iv lines do not always behave as well as the H profile[166, 165]. This has created a debate in the literature on the reliability of especially C iv, which also displays blueshifts relative to the systemic velocity[167, 168], perhaps due to central outflows or disk winds[169, 165]. No firm consensus has yet been reached on this issue, in part as results depend on measurement techniques, data quality, and sample selection[170, 166, 171, 130]. However, a positive aspect of these efforts is the increased insight into the physics of the broad-line region that is ultimately obtained. Over the years, significant efforts have been made to decrease the scatter in these relationships and hence improve the accuracy of the mass estimates[105]. An important recent result shows that to avoid biased mass estimates a correction is needed because the FWHM line width depends on the source Eddington luminosity ratio[105] — as does the – relationship[157] (§ 3). While a single spectrum and a single emission line is often used per AGN for mass estimates, the way forward may be to also use multiple emission line estimates (and/or multiple epochs) for each AGN to increase statistics[166], as previously confirmed by the early RM studies[102].
4 Polarization
When photons scatter off electrons or dust, they become polarized. The polarization characteristics depend on the scattering medium. Examining scattered light has allowed scientists to use the scattering medium as a mirror to ’look around the corner’ and thereby reveal hidden broad emission lines in highly inclined AGN[172]. It turns out that photons from the broad-line region, scattered off the dusty obscuring torus, can be used to estimate the black hole mass for AGN with source inclinations between 20∘ and 70∘, since then only one side of the torus is visible along our line of sight, creating a predominantly single scattering surface[173, 174].
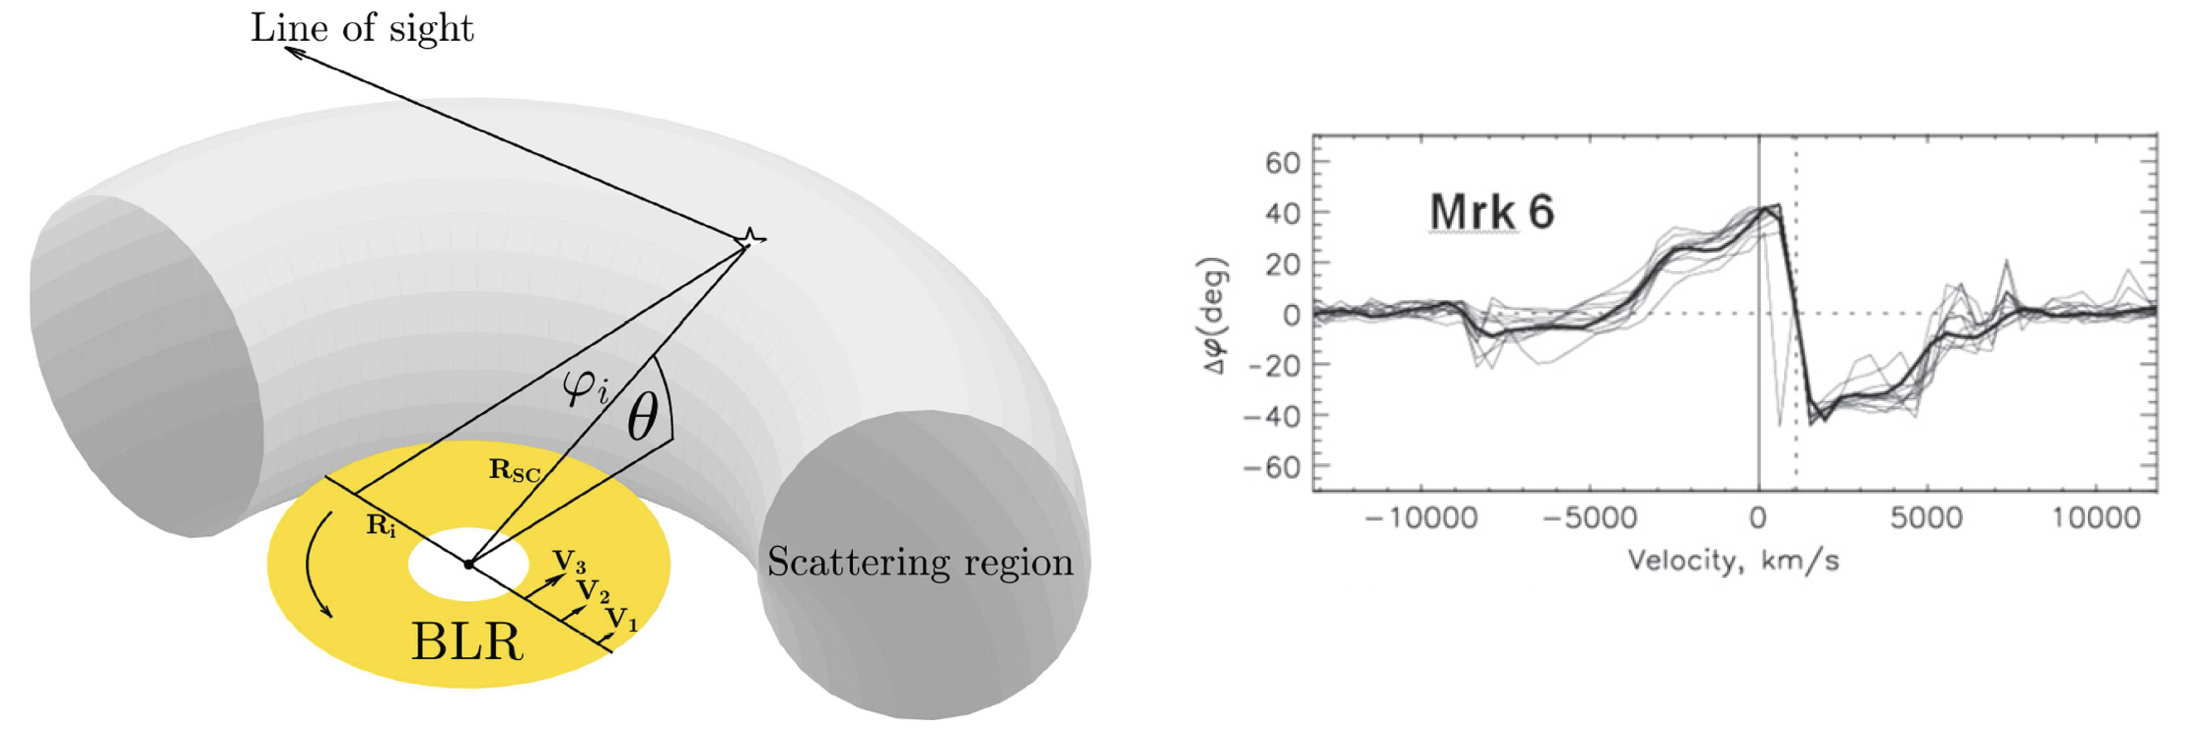
For a Keplerian velocity field in the broad-line region, the polarization angle of the line emission (relative to the polarization angle of the continuum emission) depends on the velocity in the broad-line region. Hence, the observed polarization angle will change across the line profile (denoted by ‘’ in Fig. 10). The angle is related to the velocity of a gas element in the broad-line region via the relation[173, 174]
| (4) |
where is the velocity of gas element in the broad-line region, is the polarization angle of photons from gas element (here and is the polarization angle of the line and continuum emission, respectively), is the gravitational constant, is the declination of the scattering region element of the torus, illuminated by the broad-line region, is the speed of light, and is the radial distance of the scattering element from the ionizing source, i.e. the inner radius of the torus. To estimate the black hole mass, , requires knowledge of , and and . Unless the scale height of the torus exceeds 20∘ solid angle on the sky, using the approximation inflicts an uncertainty in of order 10% or less[173]. While and are measured from the spectropolarimetric observations, can measured from reverberation mapping analysis of direct light at infrared wavelengths[175] or from the empirical relationship between the inner torus radius and the AGN luminosity based on infrared interferometry[176].
Similar to single-epoch scaling relationships, an advantage of this method is that only a single observation is necessary, in contrast to the reverberation mapping technique. In addition, due to the scattering process, the observed velocity of the broad-line region does not depend on the inclination of the broad-line region velocity field to our line of sight. However, this method does assume the broad-line region has a disk-like structure with a Keplerian velocity field. This is an assumption that, at present, is difficult to confirm although previous observations do argue that the CIV and Balmer line emitting broad-line regions predominantly move in a plane[177, 178] and that the Hydrogen emitting regions display a velocity gradient perpendicular to the radio jet axis[179].
So far, the black hole mass of 30 AGN have been estimated by spectropolarimetric observations of the strong H emission line[180] and one AGN by the polarization of the Mg ii line[181]. Despite the unknown torus structure and broad-line region velocity field and the fact that the surface of the torus is not a sharp edge[174], mass estimates based on the Balmer lines are remarkably consistent with those measured from reverberation mapping[180]. While the polarization method is promising for obtaining independent mass estimates of distant quasars for comparison with other methods, one important limitation is the need for the broad-line region gas to move in planar Keplerian orbits and with limited radial motion[174] ( 2000 ). The good news is that any significant radial motion of gas will be evident from the polarized spectra.
5 X-ray variability
It turns out that aspects of how the X-ray flux, as emitted from a volume near an accreting black hole, varies holds information on the black hole mass. In particular, the amplitude of the high-frequency ( 10 Hz) tail in the power density spectrum of X-ray variability – observed for the hard spectral state – scales inversely with black hole mass. This is observed over eight orders of magnitude in mass, from stellar mass black hole binaries to supermassive black holes[182]. This X-ray variability method yields mass measurements consistent with reverberation-based masses albeit with larger measurement uncertainties and some scatter (of a factor 2 – 3 [183]). Interestingly, Gierlinski et al.[182] speculate that the high frequency tail is an imprint of the last stable orbit near the black hole (see e.g., § 4).
6 Tidal Disruption Events
If a star wanders too close to a black hole it will be captured by the black hole’s gravitational potential and devoured by the black hole. Although rare, observations of such events can be used to locate quiescent massive black holes lighter than and determine their mass. This holds exciting prospects as an avenue for finding intermediate mass black holes and low-mass supermassive black holes that are vital for constraining the early formation and evolution of black holes, yet difficult to study with stellar kinematics. This issue is addressed in Section 11.
If the black hole has a mass of or higher, a captured main-sequence star will be swallowed whole[184]. For lower mass black holes the star will be tidally disrupted. In this case, some of the tidal debris will be dispelled from the gravitational potential at high speeds, while the remaining will temporarily form a gas streamer or an accretion disk before it eventually falls on to the black hole. The capture of the tidal debris will cause a luminous flare that can last for a few years[185]. The temporal evolution of the emission from the accreting debris will show a fast increase in intensity until it reaches a peak luminosity and will thereafter fade[185] with time, , as . The shape of this characteristic light curve of the flare (or ‘TDE afterglow’) depends on, among other parameters, the black hole mass and properties of the disrupted star. In particular, the time scale of the initial rise to the peak luminosity correlates strongly with the black hole mass, allowing a relatively accurate mass determination[184]. Of order 100 TDEs have been observed so far.[186]
High cadence monitoring campaigns aimed at identifying supernovae has recently allowed the discovery of a transient event in year 2020 where the start of the flare and thus the initial rise time could be accurately determined. This revealed the fastest initial rise recorded in a TDE to date. The data show the TDE to occur in a nearby dwarf galaxy of similar mass to the Large Magelanic Cloud with a central black hole.[187] This is one of only a few dwarf galaxies with mass estimates independent of reverberation mapping, the single-epoch mass scaling, or stellar dynamical measurements.
4 Measurements of Fundamental Properties of Black Holes: Spin
In addition to being a fundamental property of a black hole, the spin (or angular momentum ) also has astrophysical importance; the unitless spin parameter is defined as , where is the gravitational constant, is the light speed, is the black hole mass. An incredible amount of energy can be stored in the spin and released to drive physical processes, such as the launching and powering of either relativistic radio jets or accretion disk winds. The spin also carries information on the black hole growth history that thus has a ’fossil’ record of how a black hole in the early Universe formed. When material accretes onto a black hole it deposits its angular momentum. Coherent accretion, through a single major accretion event or through a spinning disk, will then spin up or slow down the black hole, depending on its original spin state compared to the spin rate and direction of the infalling material. However, if the black hole attained a significant fraction of its mass through chaotic accretion (i.e., significant gas parcels infalling from random directions and with random angular momentum directions) or chaotic merger of smaller black holes, then the spin is expected to be very low or non existent. Because it is still an open question how the first black holes in the early Universe formed and evolved to the powerful quasars detected within 750 million years of Big Bang (§ 9), there is a strong interest in developing accurate and precise methods for determining the spin of massive black holes.
Because the black hole does not emit light by itself, we can only infer the mass and spin through their effect on the surroundings. For example, plasma orbiting close to the event horizon will move at relativistic speeds. The observed light from this plasma will not be evenly distributed around the black hole, but the approaching plasma will appear brighter. The Event Horizon Telescope image of M87 thus confirms that the central black hole is spinning (Fig. 14). Since the shape of the black hole shadow depends on both and , the spin can in principle be constrained through detailed modeling of the light distribution, especially if the mass is determined independently and accurately[188] (see e.g., Chapter 7 for greater details).
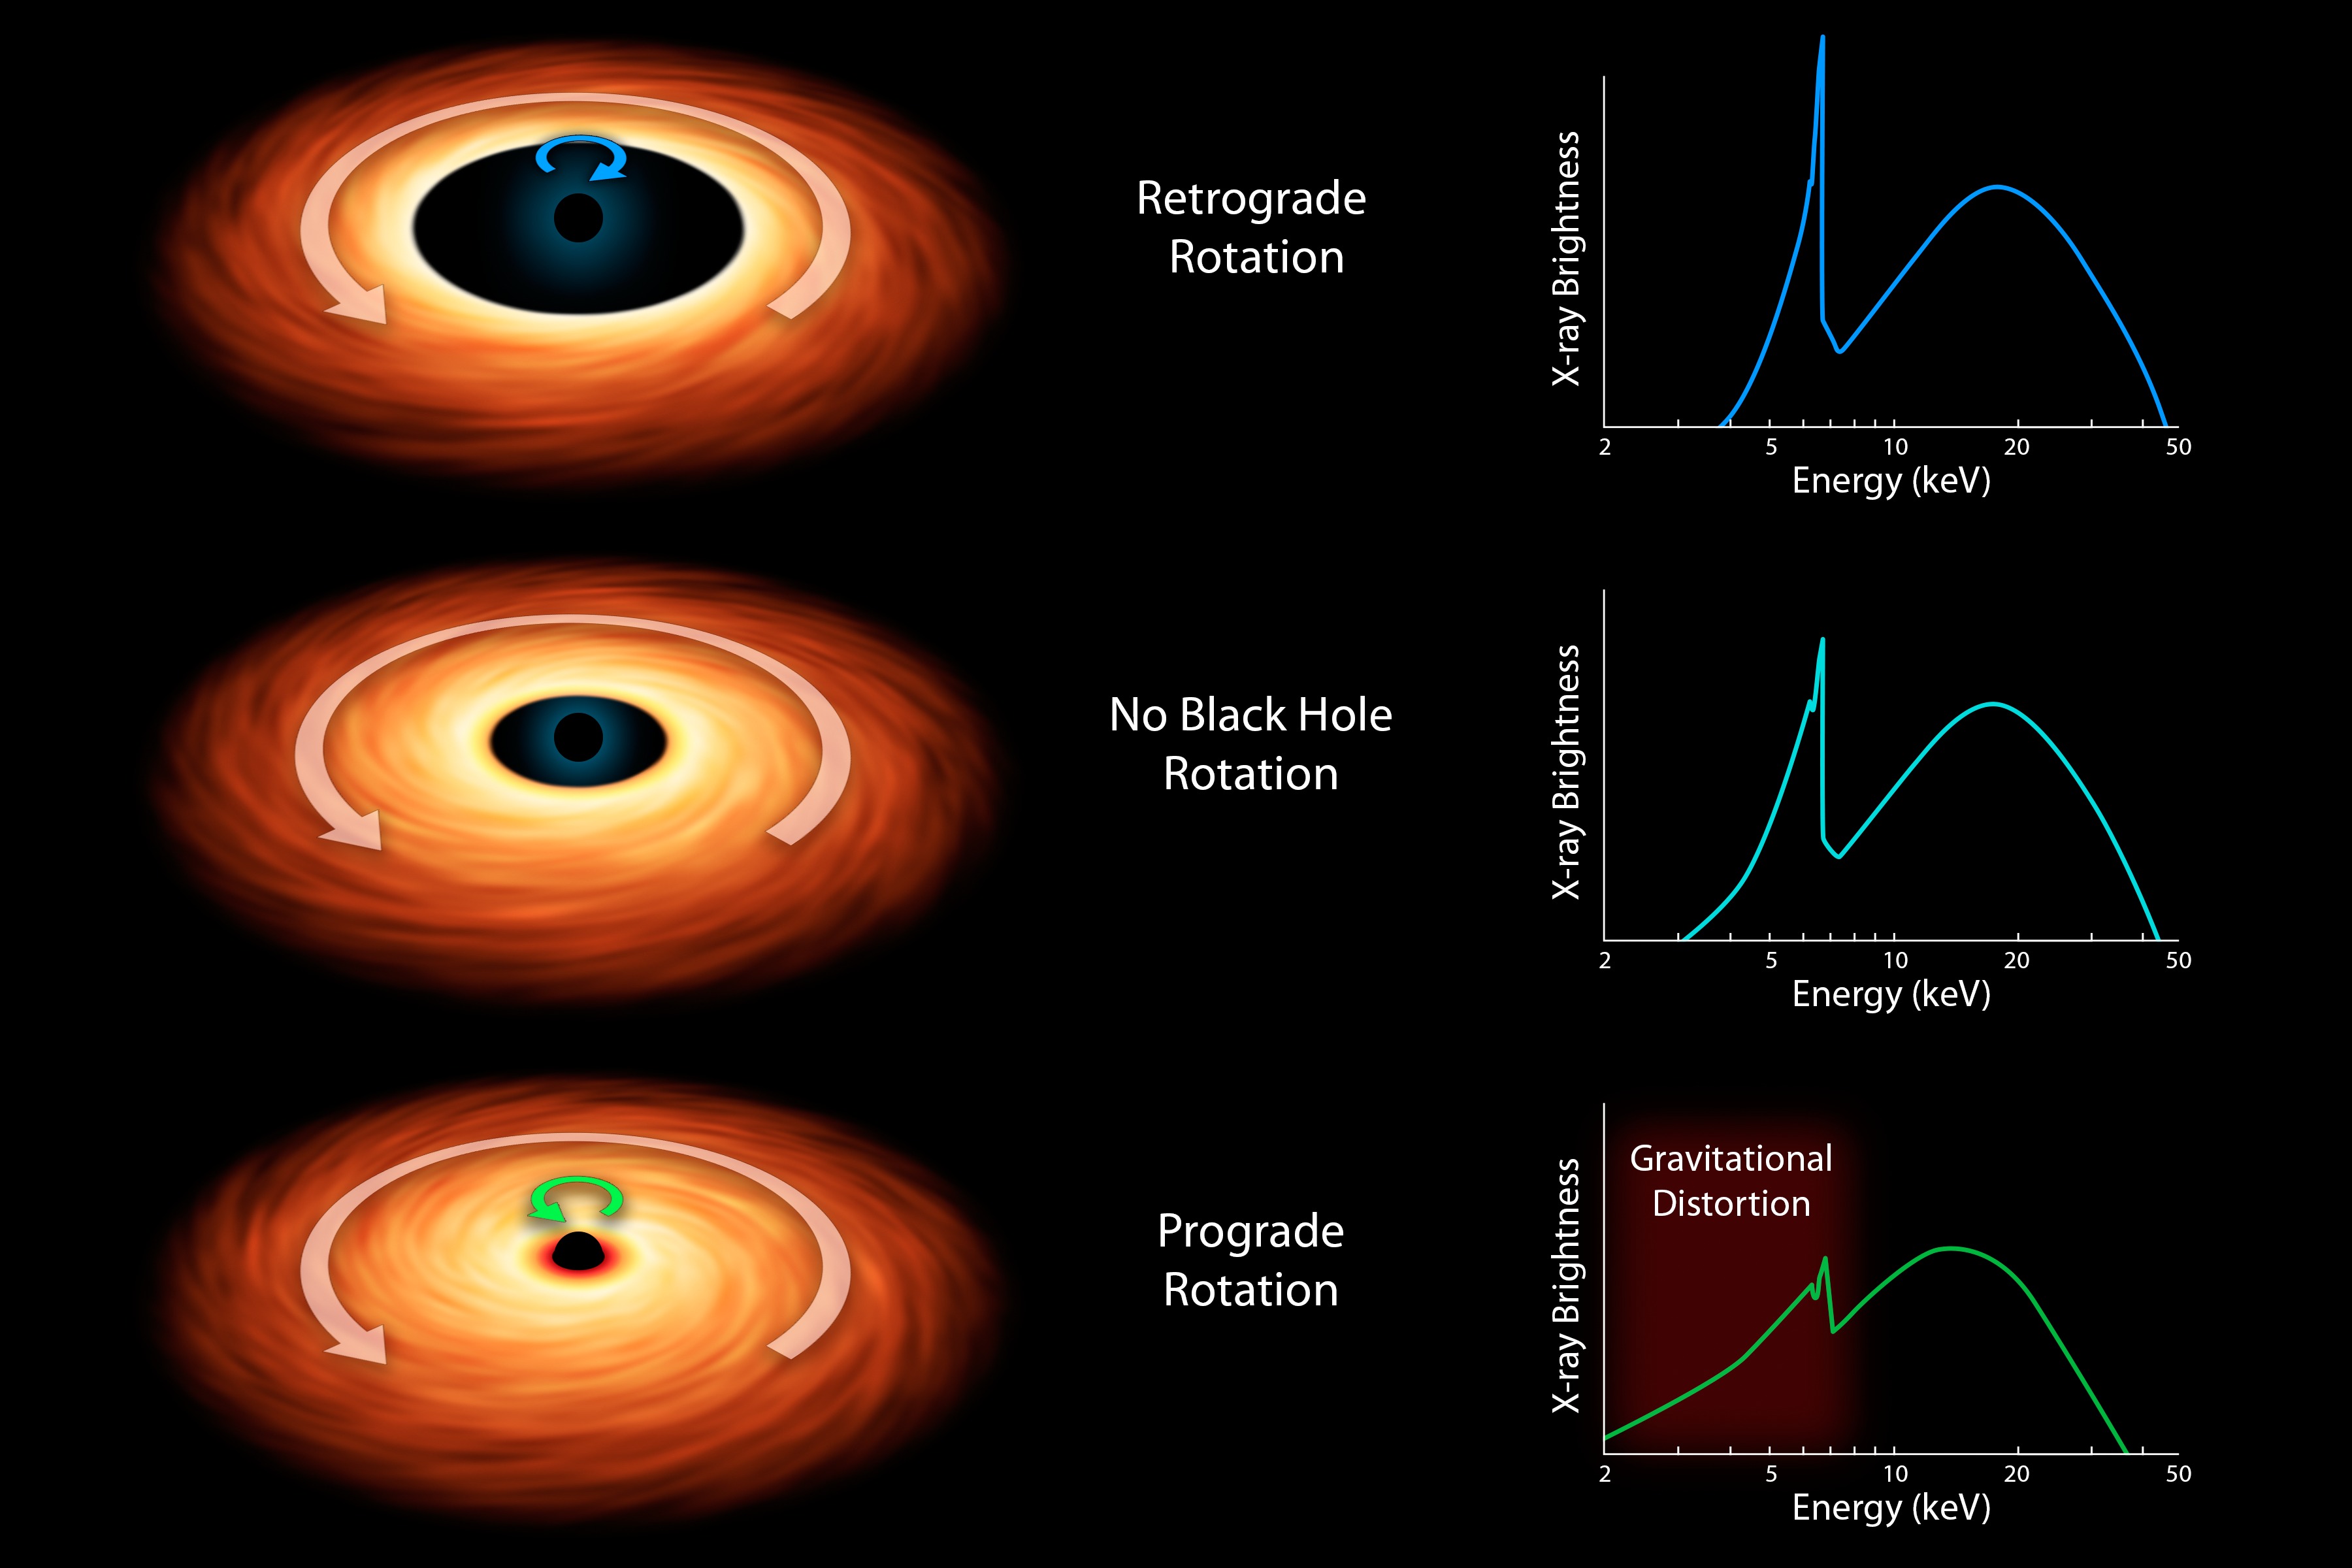
There are multiple additional ways to infer or constrain the spin of a black hole through its effects on its environment[189, 190]. Here, we will mainly focus on the method that so far has provided actual spin estimates for massive black holes. This involves accreting black holes where the effects of the spin can be characterized with existing X-ray instruments. Because the powerful gravitational field of a black hole distorts spacetime, when the black hole spins, it pulls spacetime with it in the rotation, causing ’frame-dragging’. It literally wraps spacetime closer to its central axis (Fig. 11). The innermost stable circular orbit (ISCO) of accreting material will be closer to the black hole for a spinning black hole. This inner edge of the accretion disk will reflect the high energy (X-ray) photons from the central accretion disk corona. Atomic features, such as the iron K- line at 7 keV, act as diagnostics with prominent blueshifts and broad redshifted tails. As the black hole spin increases, the ISCO moves closer to the event horizon, the line profile broadens with a stronger redshifted tail due to the stronger gravitational redshift of the reflecting material (Fig. 11).
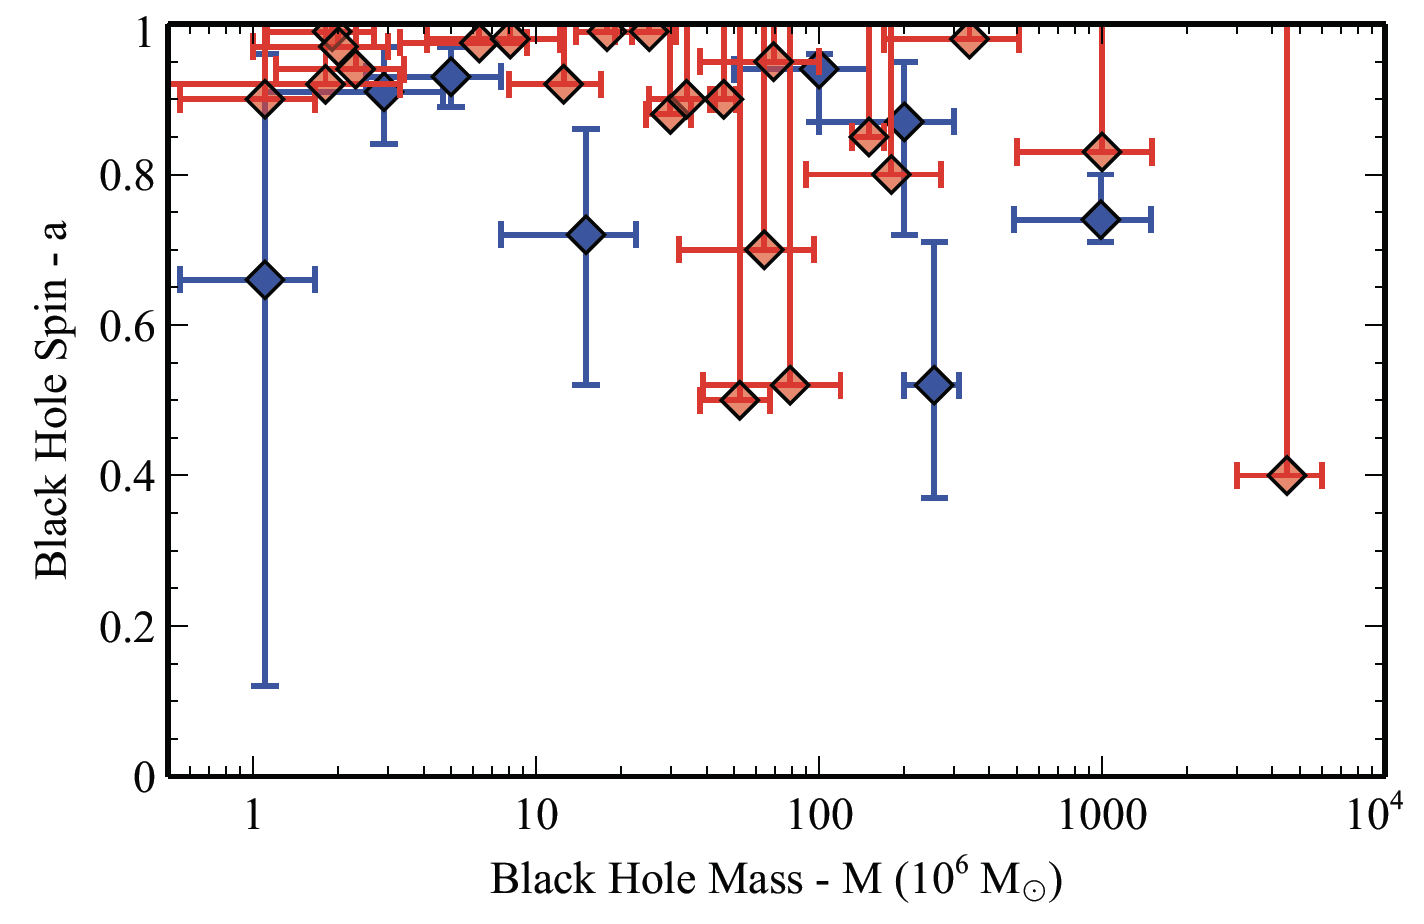
In a recent review, Reynolds[190] notes that over 30 spin measurements have been made over the past couple of decades using the X-ray reflection method. It might seem that black holes lighter than 30 million tend to be fast spinning (), while the most massive are not (Fig. 12). However, we may be seeing biases from how the objects were chosen for study (i.e., selection effects). Firstly, this measurement can only be made for accreting (i.e., growing) black holes and in this case the higher the mass accretion rate, the brighter the AGN and the easier and more reliable is the measurement of . Secondly, the most massive black holes reside at larger cosmic distances resulting in lower fluxes (i.e. lower data quality) and weaker constraints on . Thirdly, for a given mass accretion rate, the accretion disk will liberate more energy for a faster spinning black hole (the radiative efficiency depends on ). As a result, AGN with faster spinning black holes will naturally be over-represented in random, flux-limited samples subject to brightness limits (a common property of many astronomical object samples). Current analysis of these selection biases indicate that the observed number distribution of is consistent with an equal number of black holes with spin values between[189] = 0.4 and = 1.
The gravitational wave signal emitted when two black holes collide and merge are also affected, on the one hand, by the spins of the two initial black holes and, on the other hand, by the spin of the final black hole (in the ’ring-down’ signal; see e.g., Chapter 8). However, extracting this information from the weak signal is challenging[190]. While efforts are underway to improve measurement methods, scientists will have to await the launch of the Laser Interferometer Space Antenna (LISA) to have the hope of measuring the spin of colliding supermassive black holes because ground-based gravitational wave detectors operate at a frequency insensitive to mergers of massive black holes.
5 Characterizing the black hole local environment
Owing to the tiny angular scales of the black hole and its immediate environment, it is only in the last few years that technological advances have allowed extremely high resolution observations that are needed to obtain definitive insight on the structure and physical properties of this environment, so important for how the black hole feeds, grows and generate jets and/or winds that deposit enormous amounts of energy in its host galaxy and beyond. Previously, scientists have had to infer the physics through the observed time variability of the electromagnetic emission and by comparing observations with theoretical models of the physics of the expected emission and absorption components and their properties. For these reasons, our knowledge of the structure and detailed physics of these components, such as the X-ray corona, the accretion disk/flow, the broad emission line region, potential disk winds and/or the launching and collimation of radio jets, is generally limited. In this section, we provide a brief overview of the recent advances obtained through these new technologies.
1 Milky Way / Sgr A*
The proximity of the Galactic Center makes it an unparalleled site to study an individual black hole’s immediate surroundings.
Dynamical Mass Measurement from Individual Stars
As discussed in §3, mass measurements are one of the fundamental measurements we can make of black holes, and the mass of the black hole in the Galaxy can be measured like no other. With adaptive optics and a large aperture telescope, it is possible to measure the positions and proper motions of individual stars in orbit around the black hole. With multiple epochs, the orbits are well mapped out and appear to be ellipses with a common focus. Such orbits describe a Keplerian motion around a point mass. Efforts of two independent research teams[191, 192] using the 10 m Keck telescope in Hawaii and the 8.4 m Very Large Telescope in Chile over almost two decades have provided us with exquisite precision measurements that allow accurate determination of the black hole mass[191, 192] (), confirmation of general relativistic effects such as gravitational redshift[193, 194] and Schwarzchild orbital precession of stellar orbits [195, 196], the distance to the Galactic center[191] () plus novel insight on the small scale environment near the central mass.
RIAF/ADAF
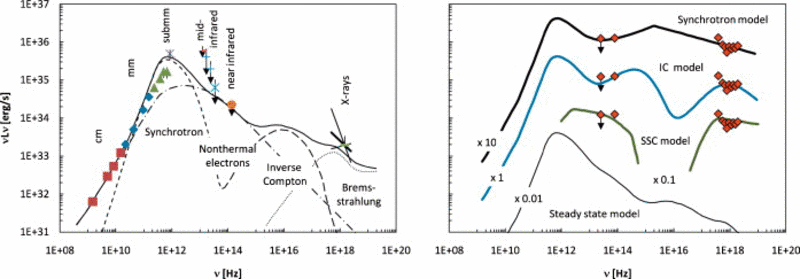
The proximity of Sgr A* allows us to study the accretion physics of a single source at extremely low luminosity. The mode of accretion is thought to be one of a variety of radiatively inefficient accretion flow (RIAF) models, an early example of which is the advection dominated accretion flow (ADAF) model. We show the spectral energy distribution (SED) of Sgr A* and representative models in Fig. 13. Observationally, Sgr A* shows a steady emission from radio to X-ray that is thought to be a contribution of synchrotron emission from thermal and non-thermal electrons plus inverse Compton scatterings by the thermal electrons and free-free emission. In addition to the steady-state emission, Sgr A* is moderately variable and shows flaring activity in the infrared.
There is a qualitative difference in the emission seen in Sgr A* and other extremely low luminosity accreting black holes. The cause of the difference is likely that the temperature of the gas is much higher than is seen in thin-disk or slim-disk accretion. Many RIAF models invoke a two-temperature plasma with ions having much higher temperature than the electrons. For a fuller discussion of accretion flows at very low luminosities, we refer the reader to reviews by Yuan & Narayan[44] and Genzel et al.[192] and Chapter 7 of this volume.
2 Messier 87 & The Event Horizon Telescope
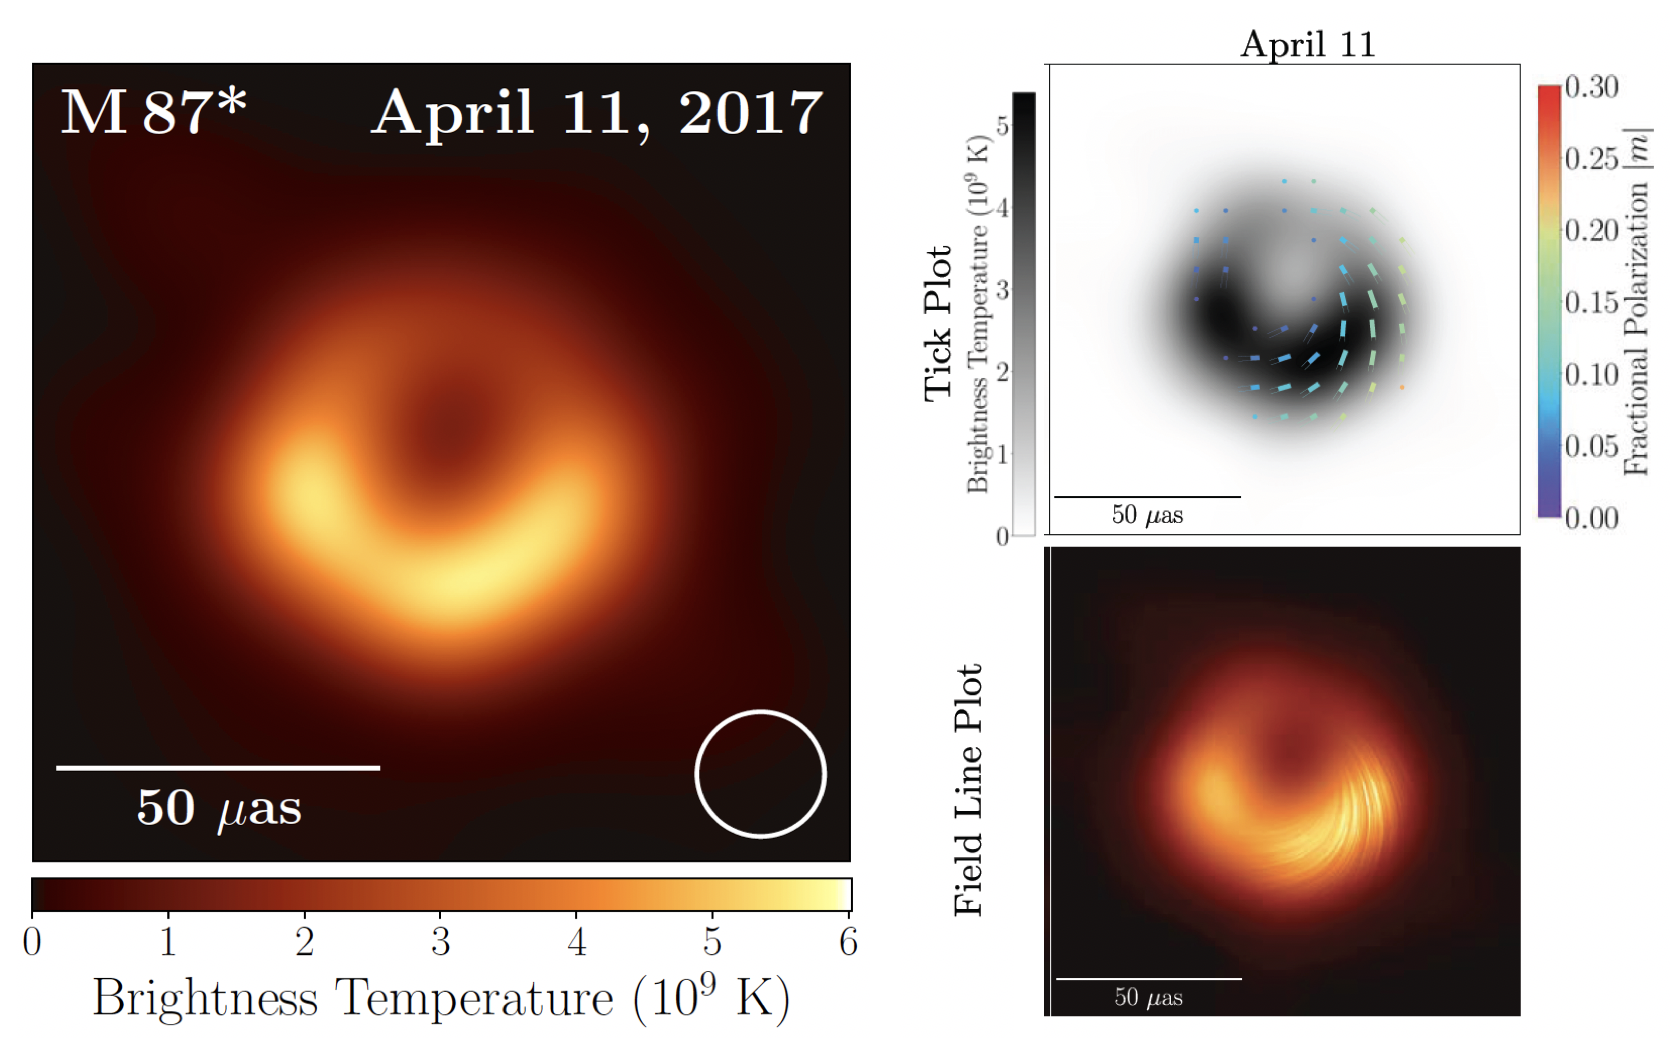
While scientists have long suspected the existence of black holes (§1), the first definitive and direct evidence of the existence of black holes came with the first direct detection in September 2015 of gravitational waves from the merger of two compact objects (Abbott et al. 2016) with a waveform that indisputably confirmed that the collision occurred between two black holes with masses of 36 and 29 (See also Chapter 8). The first direct evidence of the existence of supermassive black holes came with the first spatially resolved image ever obtained of a compact object. The image was synthesized from data obtained with the Event Horizon Telescope (EHT), an international collaboration that uses a global network of sub-millimeter wavelength telescopes333https://eventhorizontelescope.org/ that can work together as a single telescope with the size of Earth, using the technique of interferometry. In April 2017, EHT observed the central compact object in Messier 87 (or M87), a giant elliptical galaxy 53.5 million light years away in the Virgo galaxy cluster, at 1.3 millimeter wavelengths at the exquisite angular resolution[197, 198] of 25 arcsec. The image – presented to the community at an international press conference on April 10, 2019 – shows a clear, central dark shadow surrounded by a glow from plasma accreting onto the black hole (Fig. 14). A high precision measurement of the black hole angular gravitational radius of as and mass of was obtained from the angular size of the shadow[91] ( Mpc is the distance to M87). This confirms that M87 possesses one of the most massive black holes in the Universe known to us. Such large black holes are also seen in the distant powerful quasars detected at cosmic distances (that is, the black holes powering the quasars are active at earlier epochs in the history of our Universe[199] also discussed in Chapter 9). With the clear detection of a radio jet emanating from the center of M87[200], there is little doubt that M87 must have been a powerful quasar earlier in its lifetime.
This independent, high-precision black hole mass measurement from EHT is important as it helps to settle the inconsistency between earlier mass measurements of M87 based on two different dynamical methods, namely based on stars[89] and ionized gas[90]. The EHT measurement lends support to the notion that stellar kinematics provides a more robust mass determination. However, time and further analysis will reveal if also the ionized gas dynamical method can be improved to provide consistent results.
The non-uniform illumination of the glow around the black hole shadow (Fig. 14) is caused by rotation of the black hole[197, 188], which drags spacetime with it at relativistic speeds, causing the plasma approaching us along our line of sight to appear brighter (§ 4). While the axis of rotation is not uniquely determined from the EHT data, it is consistent with a direction parallel to the radio jet observed at parsec scales[200, 203]. The exact mechanism for jet launching has not yet been settled, but the data are consistent[188] with the extraction of spin energy from the black hole by strong magnetic fields through the Blandford-Znajek mechanism[204].
In March 2021 the EHT collaboration published the first image of polarized light from the plasma near the event horizon of the black hole, based on further analysis of the 2017 data[205, 202]. The polarized light carries important information on the strength and direction of the magnetic fields near the black hole event horizon, suspected crucial for the launching of the relativistic radio jet. While analysis of the signal is not trivial, it does show a strong (1–30 Gauss) poloidal (i.e., radial and vertical) magnetic field component, subjected to depolarization (i.e., a weakening of the polarization degree) by electrons in and around the synchrotron-emitting plasma. General relativistic magneto-hydro-dynamical modeling shows that the accreting material is strongly magnetized (a ’magnetically arrested accretion flow’) and that the magnetic field is dynamically very important. The mass accretion rate is inferred to be a feeble /year (i.e., 1 per 10.000 years).
At present, the shadow of supermassive black holes can only be imaged in spatially resolved observations for two galaxies, namely M87 and our Milky Way galaxy444EHT observed the Milky Way black hole, Sgr A*, in 2017 along with M87. The image was presented to the public in a press release on May 12th, 2022. The image reveals a shadow in the center of a bright ring of emission. The image confirms that the central dark object in Sgr A* is indeed a black hole and that the physics of supermassive black holes is similar on the scales of this shadow despite the factor 1600 difference in mass between the M87 and Sgr A* black holes. See Chapter 7 for more.. There are other prospects for similar observations such as using lensing in binary SMBHs[206]. The EHT collaboration is working to improve the resolution by operating more antennas at higher frequencies and by adding further telescopes to the network. While the ability to resolve the black hole shadow in distant galaxies depends strongly on the distance and the mass of the black hole, these upgrades will increase the number of nearby AGN for which we can hope to study the properties of the central radio plasma at scales slightly larger than the event horizon, but still sufficiently close to the black hole to provide new insight on the physics of the central engine.
3 Results from the GRAVITY instruments
The infrared interferometry instrument GRAVITY at the European Southern Observatory’s Very Large Telescope in Chile was one of the instruments used to map the motion of stars near the Milky Way black hole (§ 1). This instrument has also provided ground-breaking insight on the structure of the black hole central engine powered AGN and quasars.
The size and structure of the hot dust component
The first results from observing AGN with GRAVITY were presented on the nearby, archetypical Seyfert type 2 galaxy NGC 1068, a well studied AGN and starburst galaxy located circa 45 million light years away (Fig. 15). The observations, at an unprecedented 0.2 parsec angular resolution at a wavelength of 2 , show the dust-sublimating region (i.e., the hot dust near the sublimation radius) as a thin ring-like structure[207], residing at the inner rim of the thin disk occupied by water masers. This result was quite surprising because it had long been expected that the hot dust, observed at wavelengths longward of the inflection in the spectral energy distribution (Fig. 2), take origin in the inner face of a geometrically thick torus of dense gas and dust (e.g., Fig. 10). This torus blocks our direct view of the central regions in this highly inclined AGN. Instead, a thin disk of dense gas and dust exists inside this torus. This disk is not to be confused with the central accretion disk residing much closer to the black hole, emitting strongly in the UV-optical regime.
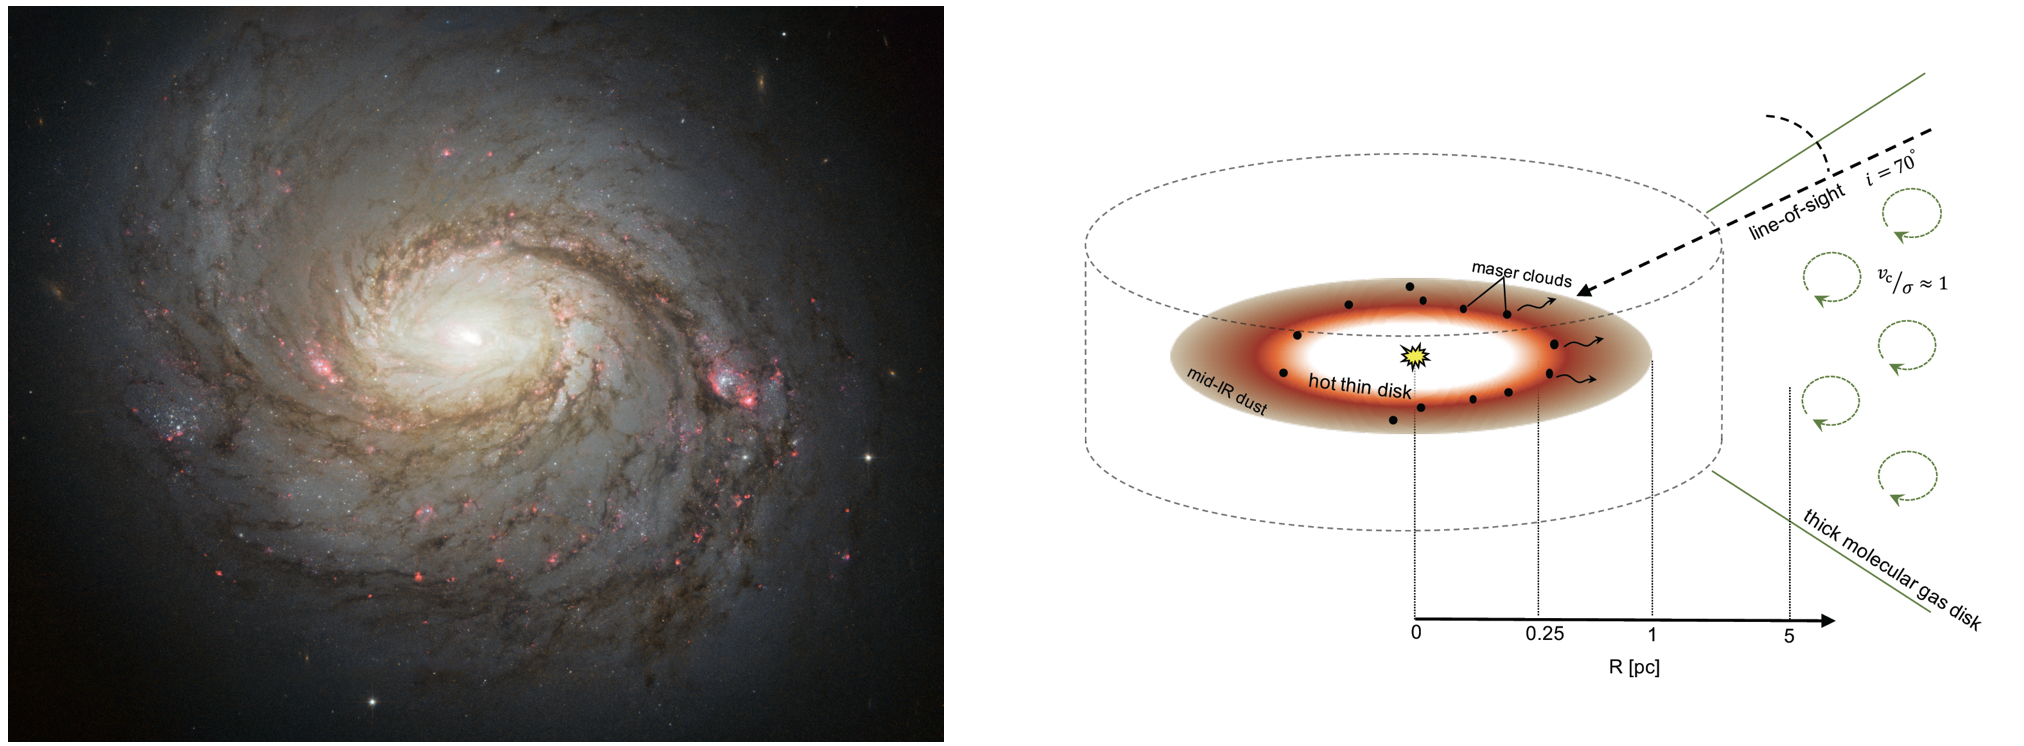
A sample of eight additional nearby AGN were observed with GRAVITY during 2017–2019[208], partially resolving the hot dust emitting region. The measured size of the hot dust region, in the range 0.3 – 0.8 arcsec, is seen to increase with the AGN bolometric luminosity over four orders of magnitude. This confirms that the dust sublimation radius increases with increasing AGN power, as previously established based on measured time delays[209, 175, 210, 211].
Size and velocity structure of the broad emission line region
With a size of less than 0.1 milli-arcsecond for even the most nearby AGN, the broad emission line region is too small to be imaged directly with individual telescopes; its size is expected to be smaller than the dust-sublimation radius. Until recently, scientists were primarily limited to studying the physics of this region through variability of the continuum and line emission (§ 3) or via analysis of spectroscopic data. Given these constraints, the nature of this region, its geometry and kinematics, and its relationship to the rest of the central engine are still unknown. For example, it is still debated whether the broad-line region is (a) the atmosphere of the accretion disk or of the inner face of the obscuring torus, (b) an integral part of the accretion flow; (c) part of an outflowing disk wind; or (d) if it is a separate entity all together. However, observations with GRAVITY are now allowing scientists to peer deeper into the heart of AGN, to map the dominating velocity structure of the broad-line region, providing the first direct measurements of spatially resolved velocity gradients across the broad-line region[179]. The GRAVITY instrument combines the light from the four 8 meter VLT telescopes to obtain interferometric amplitudes and phases. The amplitudes measure the angular extent of the broad-line region while the phase determines the position on the sky.
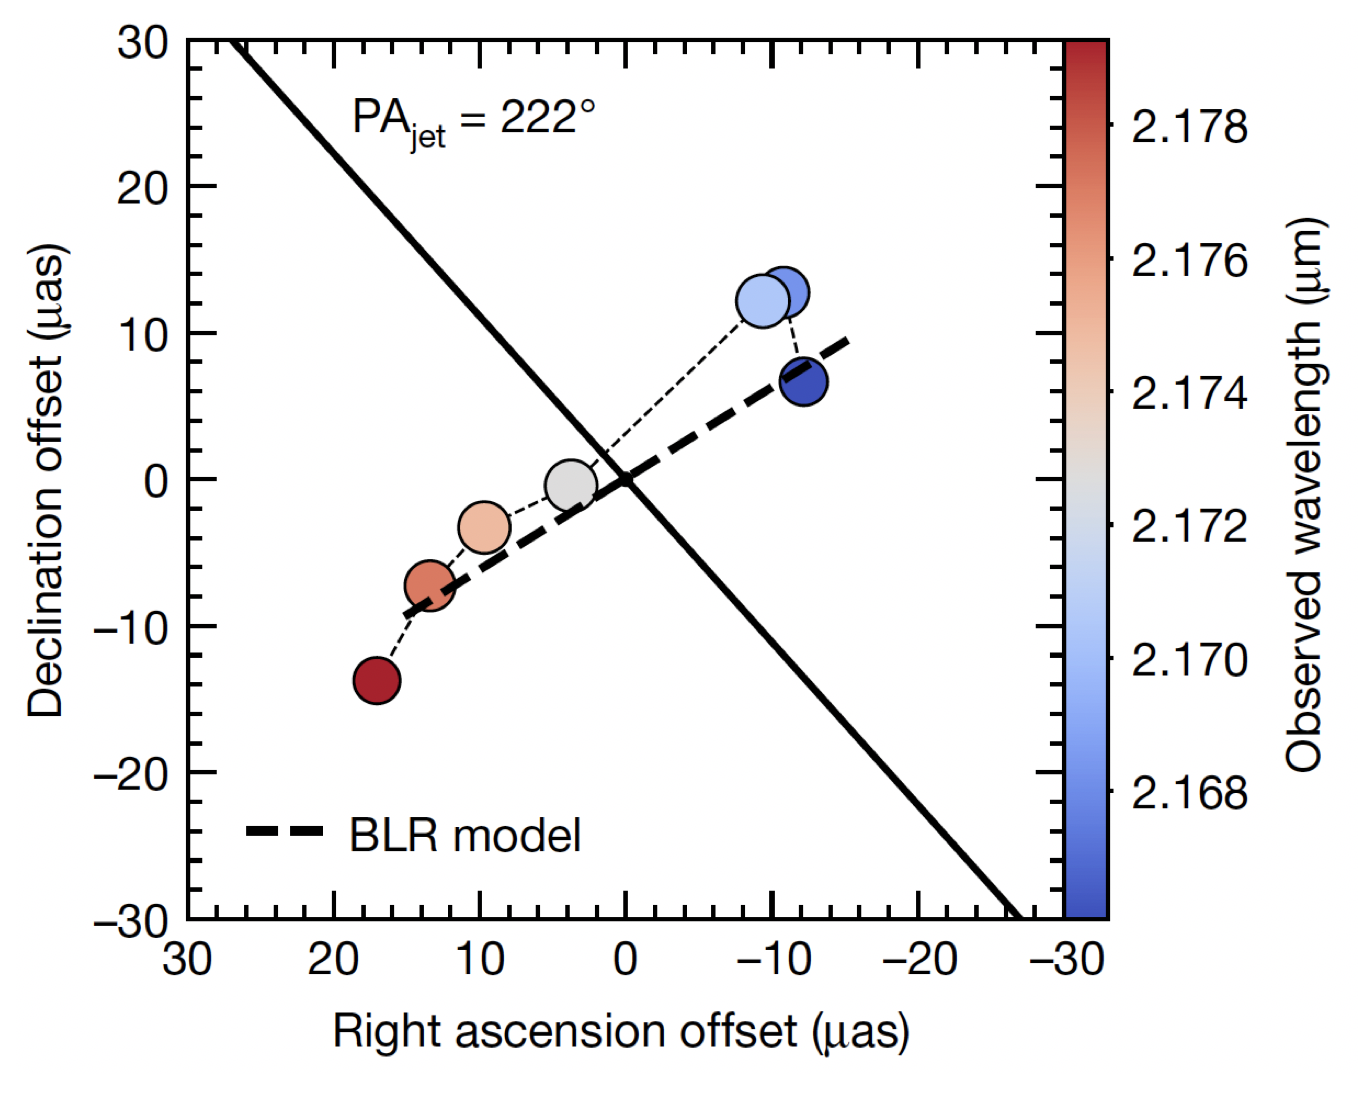
The first GRAVITY observations of a powerful AGN with broad emission lines were made of 3C 273, one of the most powerful radio-loud quasars. As the first quasar to be discovered [4, 5], 3C273 is in our local extragalactic neighborhood (at a redshift of 0.158 or a co-moving distance of 660 million parsec, corresponding to a distance of 2 billion light years). The phase shifts of the Hydrogen Paschen alpha (Pa-) emission line specifically show the broad line gas in ordered rotation around an axis parallel to the radio jet (Fig. 16). This confirms the conclusions reached in previous studies that find larger velocity dispersion in the Hydrogen Balmer beta (H ) and C iv 1549 broad emission lines for radio sources that are more inclined relative to our line of sight[213, 214]. The GRAVITY observations also clearly establish that the broad-line region is physically separated from the obscuring torus. The mean size of the Pa- emitting region is measured to be 0.120.03 parsec with an inner radius of 0.03 0.01 parsec, a factor of 3 smaller than the size of the continuum dust radius measured with the (earlier) VLT interferometry instrument AMBER[212].
The more recent GRAVITY observations of two other AGN, IRAS 09149-6206 and NGC 3783, paint a similar general picture of a disk-like broad-line region in orbit around the black hole[215] that is much more compact than the hot dust emitting region. Dexter et al.[216] also find the broad-line region sizes of five other AGN, observed with GRAVITY, significantly smaller than the hot dust emitting region. It will be interesting to see if future GRAVITY observations can shed more light on the relationship between the hot dust emitting component in the central engine and the broad-line region.
6 Co-evolution of Black Holes and Host Galaxies
Tight correlations between the properties of black holes and the galaxies that host them strongly indicate that the evolution of galaxies and their black holes are strongly entwined. The most compelling set of evidence in favor of co-evolution is the set of scaling relations between the black hole mass and the host galaxy properties. The mass of black holes () can be measured (see §3) and when it is plotted against some galaxy properties, there is a strong positive correlation. These correlations are most important with galaxy bulge luminosity (– relation), galaxy bulge mass (– relation), and galaxy bulge velocity dispersion (– relation).
The relations between black hole mass and host galaxy property are all well described by power laws of the form , where is one of the galaxy properties, is the intercept, and is the power-law index. The best-fit values of and for these relations has been updated many times over the years both with increased numbers of black hole mass measurements and more informed isolation of the sample. The current understanding is that the black hole scaling relations hold best for ellipticals and classical bulges (not pseudo-bulges) while omitting galaxies that are ‘mergers in progress,’ which have not settled into a final elliptical/classical bulge[217]. With such a sample, the -band – relation is
| (5) |
where is the black hole mass in units of and is the bulge -band luminosity[217] in units of . The – relation is
| (6) |
where is the bulge stellar velocity dispersion[217] in units of . Both of these relations have intrinsic scatter measured to be about 0.3 dex.
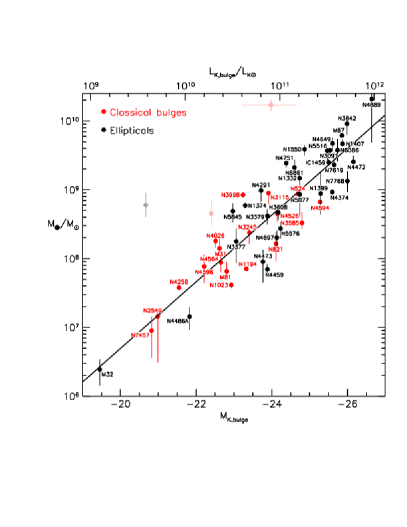
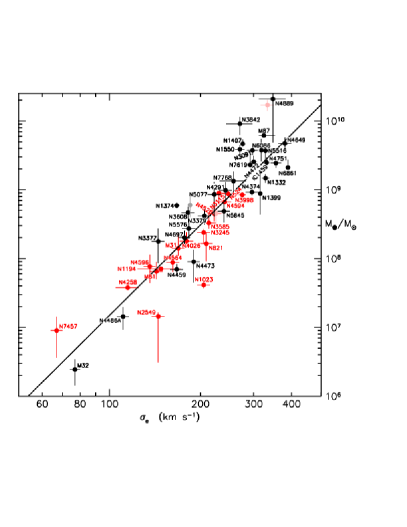
That there is a positive correlation between and any of these is expected: it makes sense that the largest black holes would be in the largest galaxies. What is surprising is the relatively small intrinsic scatter in these relations despite the vast differences in size of black holes and size of galaxy bulges. A black hole has Schwarzschild radius approximately 2 Astronomical Units (AU), and a typical host galaxy of such a black hole would be an elliptical with half-light radius of order kpc. So even though the black hole size is times smaller than the host galaxy, it is possible to predict the black hole mass to within a factor of 2–4 by measuring the host galaxy properties. This leads us to conclude that there is something about the evolution of the two that is tightly coupled.
While the evidence for coevolution in the form of the – relation was originally defined by quiescent black holes in our local Universe, there is evidence that this relationship also holds for actively accreting black holes, as one would expect if they are the same beasts. For the few nearby AGN for which reliable bulge stellar velocity dispersion, , measurements can be made (given the bright nuclear source), the black hole masses determined by reverberation mapping (§ 3) scale with with a similar slope and scatter (0.3 dex) as observed for quiescent galaxies[218, 139]. However, the ’AGN-only relation’ has a slight zero-point shift toward lower black hole mass, consistent with the fact that the black holes are still growing. For convenience, reverberation-based masses are at present bootstrapped to the – relation for quiescent black hole (§ 3).
Most theoretical ideas about the underlying cause of black hole coevolution use some form of self-regulated feedback. As gas in a galaxy halo cools and falls into the stellar component of the galaxy, much of it will form stars, and some of it will fall all the way to the center onto the black hole. This gas thus adds to the stellar mass and light as well as the black hole mass. Both the formation of stars and black hole accretion can lead to processes that prevent further falling of galactic halo gas onto the galaxy. Star formation is accompanied by supernovae, which can heat up and/or expel the gas from the galaxy bulge. Black hole accretion is accompanied by powerful quasars that can drive strong gas outflows or by long-lived jets that continuously deposit energy and momentum into the interstellar medium (see next section for details). Thus black hole accretion can also heat up and/or expel gas from the galaxy bulge. If either process (star formation or black hole accretion) is sufficiently efficient, then it will cut off the supply of cold gas that is forming stars and feeding the black hole – ending the growth of both the stellar component(s) and the black hole. This general picture is likely to be correct in some way, but the details are poorly understood. For example, it is thought that jet-driven feedback is the dominant process in the largest galaxies and that star-formation-driven feedback is dominant in the smallest galaxies. It is possible, however, that even the smallest galaxies require some form of AGN feedback to fully explain the galaxy luminosity function. The final conclusion is the same regardless of the driver of the feedback: the source of mass for the black hole and the stellar bulge is the same (namely, halo gas), and the termination of the mass accretion of black hole and stellar bulge is the same. Thus both black hole and galaxy stellar content have coevolved to their state.
Direct observational evidence of the processes responsible for the co-evolution is lacking. However, some insight into the underlying cause of the scaling relations may be gained by looking at the outliers in the relations. One important category of outliers is pseudobulges. Classical bulges are created relatively quickly out of mergers between disk galaxies and result in kinematically hot and geometrically round distribution of stars at the center of the galaxy. Pseudobulges, however, appear superficially to resemble classical bulges, but were formed over a much longer time through a variety of non-merger secular processes and remain very disky in terms of their kinematics and surface brightness profiles[219]. The black holes in pseudobulges tend to fall below (sometimes far below) the black hole scaling relations when compared to classical bulges and elliptical galaxies. Because classical bulges and elliptical galaxies are the result of mergers, it seems reasonable to look for an underlying connection through the physics of mergers, which are especially efficient at bringing gas from the outer regions of a galaxy to the center.
It is worth noting that our evidence of coevolution comes almost entirely from sources even though the coevolution must have happened over a long timescale. Dynamical black hole mass measurements (§ 3) can only currently be made for the nearest galaxies, and reverberation mapping at present is by and large bootstrapped to the scaling relations (§ 3). On top of this, many low-luminosity AGN are disproportionately found in pseudobulges, which do not follow the same relation. Measurements of the velocity dispersion of CO molecular gas, as a proxy attempt to gauge the bulge velocity dispersion, at early epochs (redshifts 5 – 6) show low velocities, suggesting significantly overmassive black holes[220]. The strong caveat here is that the dynamics of these young systems are not understood. In fact, the gas may not be virialized but still be chaotically infalling as part of the galaxy assembly process[221]. So thus far we have less observational certainty as to what the black hole scaling relations look like at . With the launch of the James Webb Space Telescope and the eventual construction of 30-m class ground-based telescopes with adaptive optics (§ 14), it will be possible to make direct dynamical measurements of black holes out to a redshift of . With such measurements it will be possible to learn whether black holes or the galaxies grow first.
7 Black hole fueling mechanisms at low redshift
What makes a black hole shine as an AGN – and thus be detectable at cosmic distances – is the gas that it feeds on. As noted earlier (§ 1), there is a direct link between the mass accretion rate and the luminosity of the AGN: , where is the energy conversion efficiency and is the light speed. Black holes in local Seyfert galaxies ( ) typically accrete /year while 10 per year is needed to power luminous quasars[39] ( ). Because high spatial resolution is required to study the fueling mechanisms, we predominantly have insight from AGN at low redshifts.
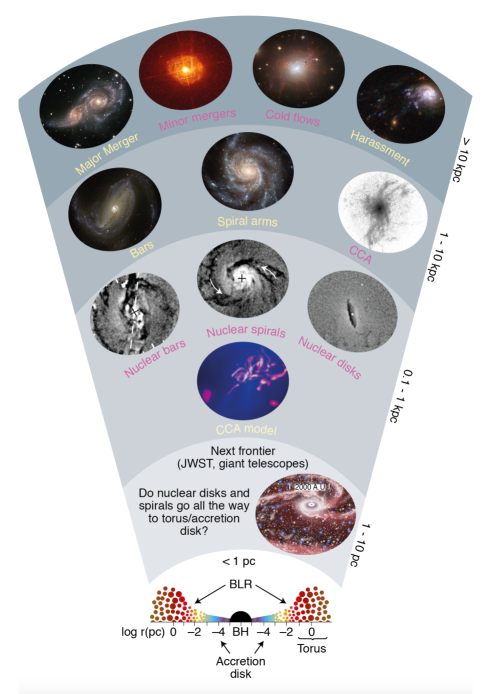
Different mechanisms can drive gas from large spatial scales (in the host galaxy or beyond) down to the immediate black hole vicinity. The specific mechanism in action depends largely on the environment of the host galaxy, whether it resides isolated in the field, in a group of galaxies or in a dense environment, like a galaxy cluster. A black hole in an isolated galaxy can only feed on gas already in the galaxy (or near the galactic halo), while a host galaxy in a denser environment can obtain additional gas through cold gas streamers in the hot intergalactic medium in clusters (a.k.a. chaotic cold accretion) or through galaxy interactions or galaxy mergers[222]. While clusters contain the densest environment with large amounts of gas and a large number of galaxies (up to 1500-2000), most of the gas is hot, radiating in X-rays[223]. A galaxy that falls into a cluster, like the Virgo Cluster where M87 resides (§ 2), is more likely to lose its cold gas through ram pressure stripping and heating by the intergalactic medium[224], than to be able to steal gas from another cluster galaxy[225]. Also, the galaxy velocities are much too high (1000 ) to invoke gravitational gas stripping. These high velocities are induced by the gravitating mass of the cluster, which is typically , a factor 100–10,000 more massive than galaxy groups. It is more likely that a galaxy will accrete new cold gas in a sparser group environment (less than 100 galaxies) through galaxy interactions due to the lower galaxy velocities (about 300–400 ) in the shallower gravitational potential compared to that of a cluster of galaxies. The lower velocities result in a longer duration interaction during fly-bys, allowing gravity to work for longer, thereby invoking the physical process called dynamical friction (an every-day analog is air-resistance against bikers and parachutes). Simple calculations of the exchange of momentum and energy show that the kinetic energy removed when a galaxy is decelerated is transferred to the stars and gas in the other galaxy. This disturbance of the energy balance of the gas and stars can drive the gas – in-situ or new – to the center of the galaxy[226].
The most efficient mechanism for driving cold gas residing in the host galaxy from large galactic scales to the central black hole remains a mystery. Evaluation is challenged by the different dynamical time scales associated with gas on different spatial scales seen in relation to the currently observed black hole activity level. It takes tens of millions of years or more for the gas to travel from galactic scales, so gas that powers an active black hole right now has little (or no) relation to the amount of gas present at the largest spatial scales. Also, if in energetically stable orbits, the gas will not move inward (or outward). So, how much gas is available at large galactic scales is no indication for the current or future black hole activity in a particular galaxy. Indeed, the amount of gas on large scales is observed to be similar for galaxies with quiescent and with active black holes. It turns out that AGNs tend to have relatively more molecular gas within the central 200 parsecs[227]. It makes sense that the shorter dynamical time scales of gas close to the center is more relevant for the activity we see now.
Extensive research on this topic has found that the main mechanisms that drive gas all the way to the galaxy center likely include cold gas streamers, spiral arms and stellar bars on large scales, and on smaller scales nuclear disks, nuclear gas spirals and nuclear bars that can exert negative torques on the orbiting gas and thereby remove angular momentum (i.e., rotational energy) from the gas, making it sink to the center due to the gravitational force of the material within its orbit. Figure 18 provides an overview of the different physical mechanisms thought to be at work at different spatial scales. A comprehensive overview of theoretical and observational studies detailing these results is provided by the review of Storchi-Bergmann & Schnorr-Müller[222].
Observations of nearby galaxies show that not just cold (100 K) and warm (2000 K) molecular gas but also hot (10,000 K) ionised gas flows toward the center at rates of 0.01 – 10 /yr, – /yr, and 0.01 – 3 /yr, respectively. These mass inflow rates should be taken only as guideline estimates because these measurements are difficult and based on studying residuals after subtracting assumed models of ordered rotation and outflows that dominate the kinematics. In fact, the central gas kinematics is quite complex. For example, the warm molecular gas displays complicated central gas kinematics with a mixture of inflows, outflows and ordered orbital motion. This gas is observed within the central 100-200 parsecs in several nearby galaxies[227, 226] and possibly extends all the way to the central torus. Also, since these mass inflow rates are based on a small, select number of galaxies where these measurements are possible, they may not be representative of the AGN population especially beyond our local Universe. Even with the significant uncertainties[222] (factors of 5–10) these numbers do show that much more gas is deposited in the center than is required to fuel the AGN activity (– /yr). This means that there is plenty of gas to fuel the black hole activity as well as circumnuclear star formation, observed in many AGN[228]. However, not all the centrally deposited gas may reach the black hole. The powerful radiation from the central accretion disk will exert radiation pressure on the inflowing gas. Depending on the gas density and temperature of the inflowing gas, parts of this gas may be ejected from the nucleus in powerful outflows that may reach the host galaxy again. These outflows may deposit sufficient kinetic energy and momentum in the interstellar medium of the galaxy to either stimulate or quench star formation, a process known as ’black hole feedback’, addressed in the next section.
8 Observational Evidence for Feedback
The energy generated by accreting black holes can affect the gaseous environment in the host galaxy and between galaxies. Shocks induced by outflows and jets of molecular gas or radio plasma can make molecular gas clouds collapse and fragments to form stars. A good example of such ’positive feedback’ is the jet-triggered star formation observed in the radio galaxy 4C 41.17[229, 230]. However, momentum and heat energy from outflows and shocks plus radiation from the accretion process can also have a profound adverse impact on the black hole environment where the cold gas reservoir is heated, dispersed or ejected from the galaxy and/or the galaxic nucleus, leaving little or no fuel for further star formation and black hole growth. This (positive and negative) feedback is thought to be the underlying physics of the self-regulated black hole growth and star formation[231] manifested in the observed relation (§ 6). Further details of this vast research topic can be obtained from the review articles on observational evidence of AGN feedback from outflows of ionized gas[232] and from cold (atomic and molecular) gas[233].
Two modes of feedback are often considered: radio (or kinetic) mode and quasar (or radiative) mode. In the radio mode, the mechanical energy of radio jets in low-rate accreting AGN heats the surrounding medium. This is common in giant elliptical galaxies where the jet and central engine serve to keep the interstellar and intergalactic medium hot, thereby limiting or preventing star formation. Clear evidence of this feedback is observed in massive () X-ray cooling clusters of galaxies. Cavities (or bubbles) in the hot intracluster medium are created by the jets from the central radio source[223, 232] (Figure 19). Heat dissipation from the central source and the d work of the jets is sufficient to account for the energy deficit[223] thought to exist in the 1980s - 1990s, an issue coined ’the cooling-flow problem’. The vast amount of research on this topic can be accessed through the reviews (and references thereto) covering observations of clusters[223, 232, 234], and theoretical considerations of the underlying physics[231].
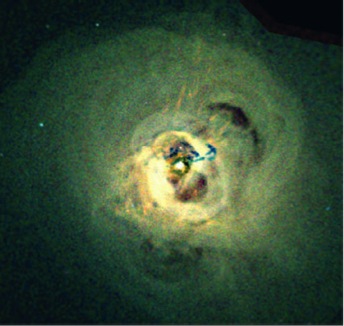
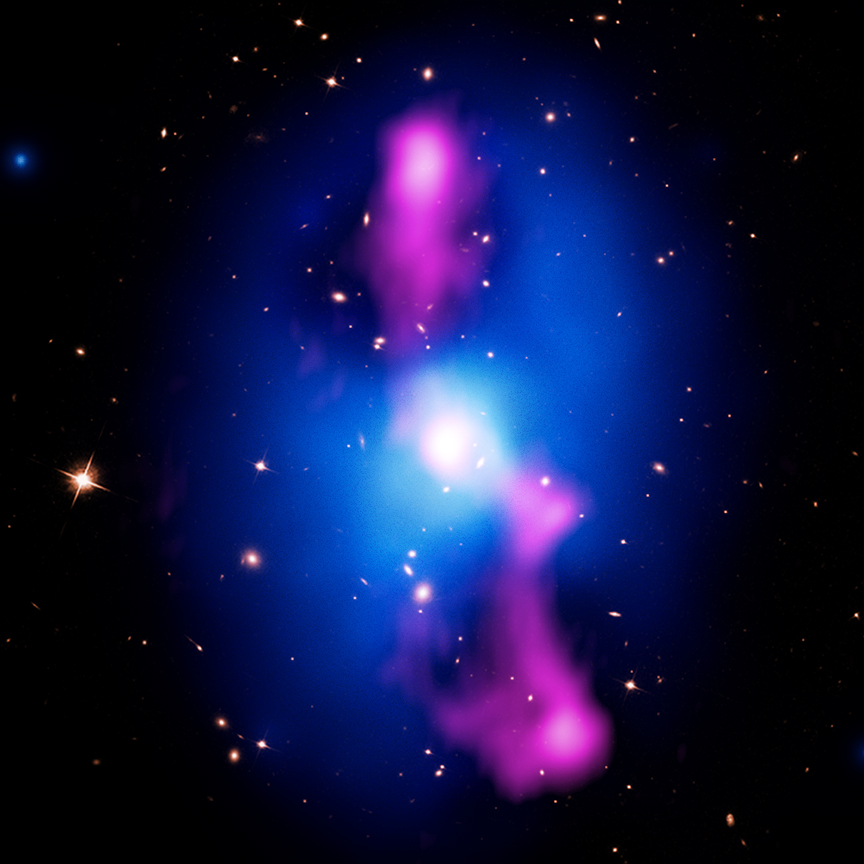
Quasar mode feedback is a powerful process thought to exist at early epochs (redshifts of 2–3) in the evolutionary history of galaxies and AGN and mostly involves pushing around cold gas, vacating it from the center or from the host galaxy through powerful winds of ionized gas[235] or radio plasma[236]. Quasars certainly should have the power[232, 231] to alter and significantly shape the evolution of the host galaxy, but wide-spread direct evidence of this quasar mode feedback in action is harder to come by[232]. While the required ultra-fast winds have indeed been detected in X-rays[237] and at UV wavelengths, the longevity of the winds and the mechanism by which the winds energetically couple to the interstellar medium are still very uncertain. The UV evidence is in the form of broad absorption troughs in the blue wings of UV high-ionization and low-ionization lines (observed in 20% of quasars), covering a wide range in line-of-sight velocities up to tens of thousands of . The troughs are due to radiative acceleration of dense material – seen in absorption along our line of sight to the continuum source – from the vicinity of the black hole[238], perhaps as a wind from the accretion disk[239]. There is evidence that a large fraction of these broad absorption outflows are physically located at distances of 100 parsecs or more from the black hole[240], supporting the notion that the disk winds that are driving these outflows can impact the host galaxy environment (e.g., through a ‘snow plough effect’). Evidence for powerful ionized gas outflows with significant kinetic energy or momentum, as detected in emission at optical and infrared wavelengths, are starting to accumulate[241, 242, 243] for AGN at redshifts 2 – 3. And recent observations confirm that the UV broad absorption lines and the ionized gas outflows, as probed by optical broad and blueshifted [O iii] line emission, in fact trace the same outflows for a sample of extremely red[244] quasars. These AGN are thought to be young quasars, reddened by large amounts of dusty gas along our line of sight, perhaps due to outflows[245].
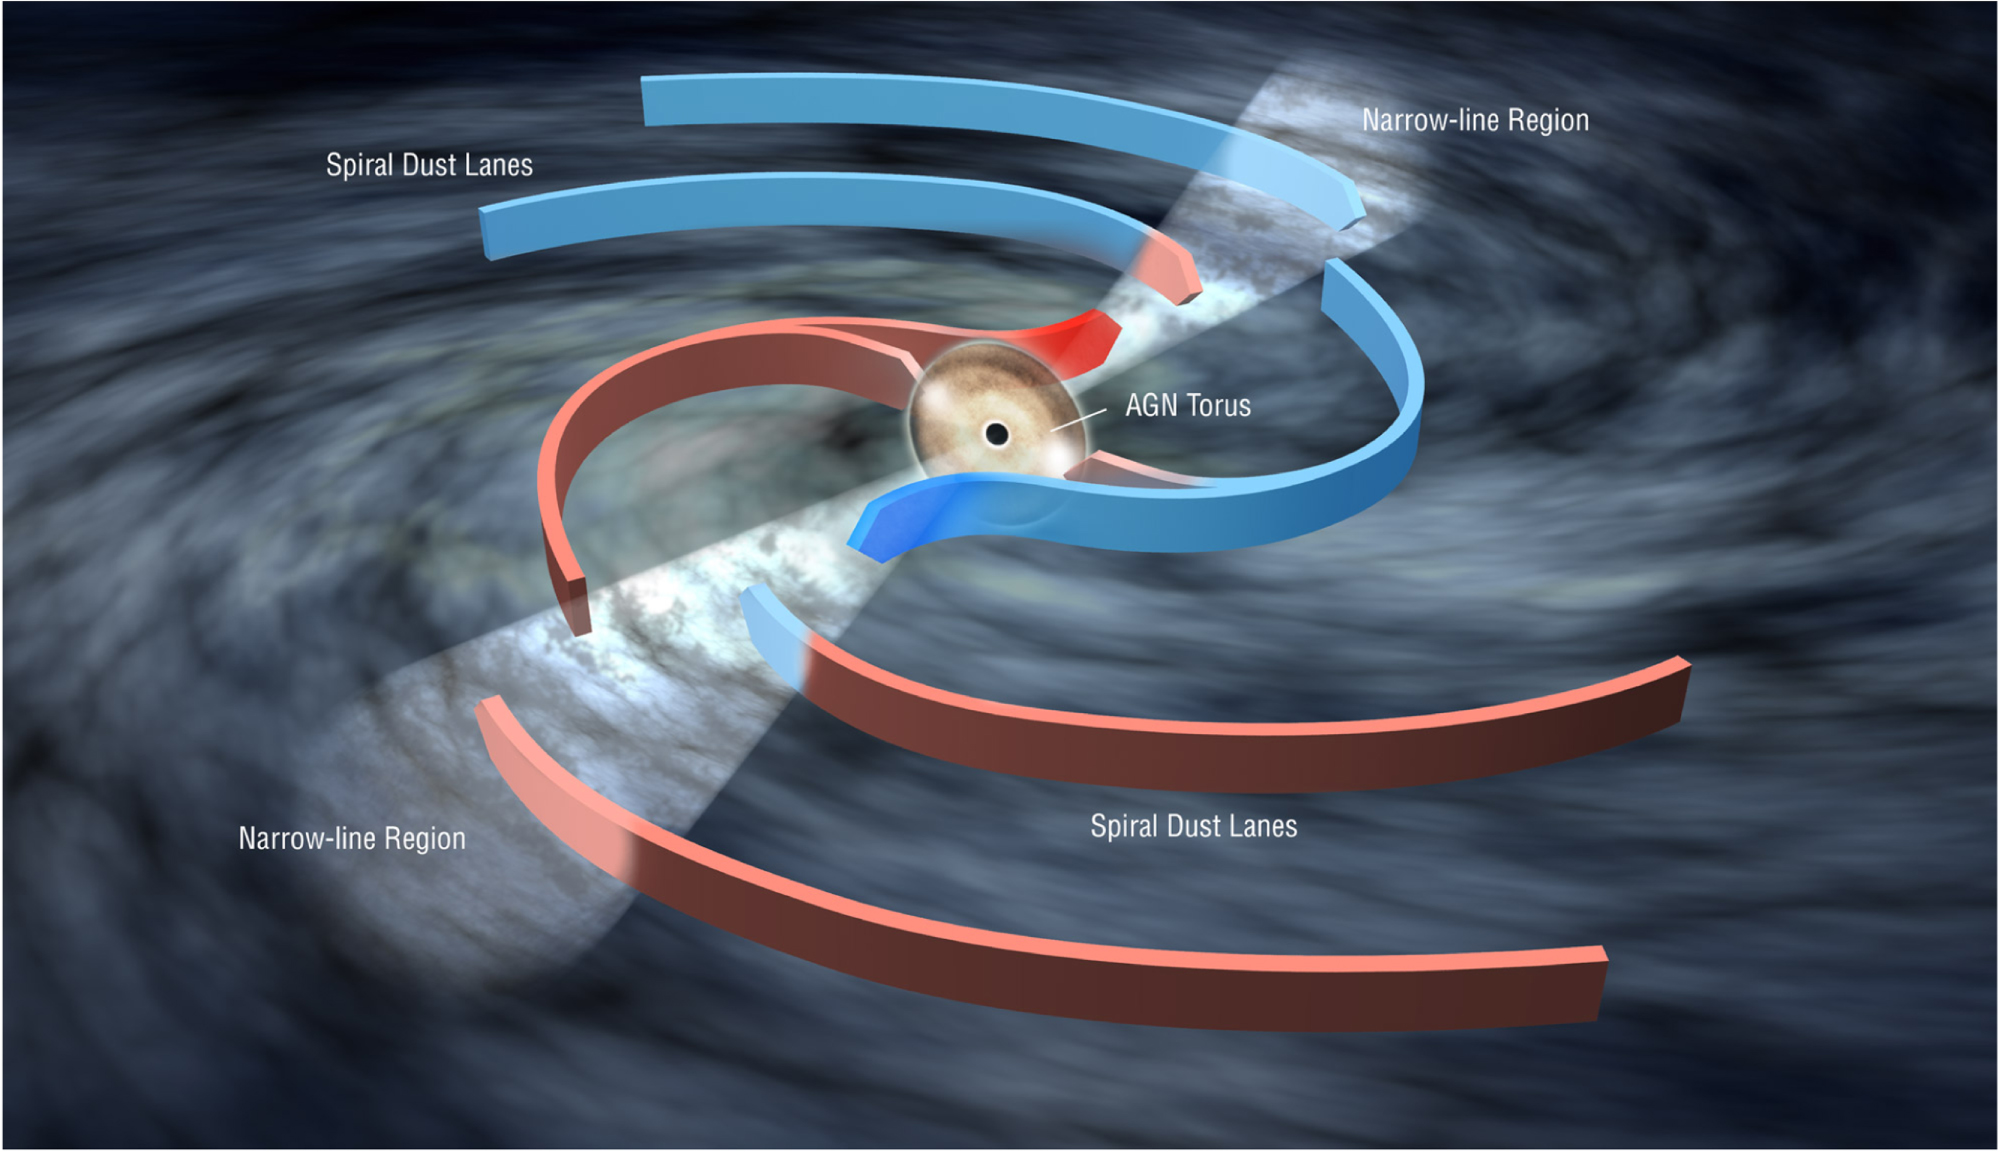
At lower redshifts and in the nearby universe, powerful quasars are more sparse. The AGN population is dominated by the less luminous Seyfert galaxies and LINERs. While blueshifted UV absorption lines are detected in Seyferts, the velocity widths are quite low (a few thousand ) compared to the mildly relativistic velocities observed in broad absorption line quasars. This has raised the question to what extent black hole feedback impacts the host galaxy for these AGN, especially beyond the circumnuclear region ( 0.5 kpc). Indeed, it seems that especially low luminosity AGN () are not sufficiently powerful to accelerate the in-situ gas in the galaxy much beyond the central 200 pc. The threshold luminosity[247] required for the outflows to overcome the host galaxy gravitational potential lies somewhere between .
In recent years, spatially resolved observations with modern integral field units have provided further insight on the topic[248]. Evidence of outflowing gas is in particular seen in the narrow line region, a low-density region of low-velocity (1000 ) ionized gas extending from 1 parsec to distances of 10 – 1000 parsecs. The observed mass outflow rates of this gas are comparable to the mass inflow rates or higher, suggesting that nuclear outflows plow into and accelerate gas located at larger galactic distances[249, 250]. In the case of Mrk 573 (Figure 20) nuclear emission radially accelerates in-situ gas that orbits with the stellar component at central distances 750 parsecs, but not the more distant galactic gas[246]. This in-situ gas acceleration is confirmed in other nearby AGN[251] and may well be common. Interestingly, for these nearby AGN, it is the X-ray wind that has the kinetic power to drive this acceleration, not the [O iii] wind[252]. With the typically short reach (1 kpc) of the ionized outflow, it is, however, unclear if these winds are commonly capable of clearing the galactic bulge of cold gas[250, 246]. For about half the nearby AGN[249] the observed kinetic power of the ionized outflows is significantly less than the expected 0.5% of the bolometric luminosity required[253].
9 Highest redshift black holes
At present 200 quasars and 6 quasars are known to reside at epochs when the Universe was a mere 940 Myr and 770 Myr old, respectively (i.e., redshift 6 and 7), based on deep surveys undertaken over the past 20 years[254]. The mass of their central black holes are estimated to be or higher based on restframe UV-optical spectroscopy or by assuming Eddington-limited accretion. Observations reveal limited evolution in the spectral energy distribution of quasars out to the highest redshifts[255], indicating fast evolution of the most massive black holes at early times. These quasars must be the very tip of the iceberg of the population of massive black holes at those epochs[256], since less luminous (and less massive) systems would not be detectable. The mere presence of such massive black holes so early in the history of the Universe places stringent constraints on the theory of supermassive black hole formation[257] as well as the duty cycle of black hole growth by accretion, since only the fraction of black holes that are actively accreting (i.e., luminous) will be detectable (Chapter 9).
The question of how the black holes, powering the highest redshift quasars, came to be so massive in such a short time since the Big Bang has puzzled scientists for the past couple of decades. Insight can be obtained by examining their impact on the gaseous environment beyond their host galaxies[256, 258]. The powerful radiation from the quasar will ionize the Hydrogen atomic gas in a region in the vicinity of the quasar, allowing Lyman- photons to escape the otherwise predominantly neutral intergalactic medium at the earliest epochs (redshift ). This is evident in the observed spectrum of high redshift quasars. The emission from the quasar is absorbed by intervening atomic Hydrogen along our line of sight. This results in a large number of absorption lines appearing at a range of wavelengths (called the ‘Lyman- forest’), shortward of the Lyman- transition of the quasar. At some wavelength blueward of the quasar Lyman- emission line, the intervening absorption lines suddenly disappear on account of the Hydrogen ionization by the quasar. This is known as the proximity effect.
The quasar lifetime can be estimated from the size of this ionized ‘bubble’: a black hole that has grown by accretion for an extended time, producing ionizing photons in the process, should have a larger ionized bubble than a much younger black hole. The first measurements show a small number of the black holes at redshifts beyond 6 with unusually small bubbles, suggesting that they have not lived long[258] ( years). Since the bubble size also depends on other parameters, such as the density of the extra-galactic gas and the black hole duty cycle (the fractional time that the black hole is ‘on’), scientists have compared observations with simulations to interpret the results. Such work suggests that these small ionized bubbles are not due to a low duty cycle[259]. If correct, this will place additional constraints on when the first massive black holes formed, leaving little time to grow these giants. Observational evidence that the first supermassive black holes are born large ( ) has been looked for, but has not yet been confirmed[260]. Theoretical considerations on this topic is covered by Chapter 9.
Since quasars are very powerful objects, they are obvious candidates for the source of ionizing radiation during the epoch of reionization. However, it is now clear that the number density of quasars at the end of the reionization epoch (redshifts of 6 – 9) is much too low to be the predominant ionizing source; the much more numerous population of star forming galaxies is the likely source[261].
10 Black Hole Growth Across Cosmic Time
Understanding black hole growth on cosmological timescales informs our understanding of the connections between black holes and their host galaxies, the initial seed masses of black holes, the role of black holes in feedback processes, and understanding cosmological structure growth. One way to study the growth of black holes is to assume that black hole mass scaling relations with host galaxy properties continue at high redshift. This assumption can be useful, e.g., for predicting gravitational wave rates or for estimating the distribution of Eddington ratios. An alternative is to use the observed radiative output of accreting black holes to study the population as a whole as a function of redshift.
1 Quasar number density
The simplest exercise in understanding black hole growth is to count the number of quasars in a given volume. It was recognized as early as the 1960s that the number density at is at least two orders of magnitude larger than in the local Universe[262], assuming an unchanging distribution of quasar luminosities. Deeper surveys soon indicated that the luminosity function was evolving[263].
2 The Sołtan argument
As we indicated in §1, we now know that all massive, quiescent galaxies contain relics of potential previous quasars. This connection was first suggested by Lynden-Bell[9], but the connection between the luminosity function of quasars in the distant universe and mass density of black holes in the local universe was not made until the pioneering work of Sołtan[23]. Assuming a fixed radiative efficiency, , for a black hole accreting at a rate the luminosity of a quasar is . By looking at the luminosity distribution of quasars as a function of redshift, an integral argument on the total mass accreted by black holes can be made. This is now known as the Sołtan argument, and one of the resulting key insights is that nearly all of the black hole mass density was accreted during these luminous quasar phases over cosmic time onto the black holes. Thus studying quasar luminosity functions over cosmic time will tell us about black hole growth over cosmic time. In nearly every waveband, the number density of quasars increases rapidly from to – and then more gradually declines to higher redshift[264, 265].
3 Quasar luminosity functions
Quasar luminosity functions, describing the number density of quasars as a function of redshift and luminosity, are measured in radio, infrared/optical, and X-ray bands. Each has its benefits. Radio quasar luminosity function directly probe quasars’ potential impact in terms of radio-mode feedback. Infrared/optical surveys provide the best combination of breadth and depth of coverage, and infrared is proving to be especially reliable in isolating quasars from host galaxy light[255]. X-rays are almost always observed when selecting quasars by radio or infrared/optical and therefore offer an unambiguous way to find quasars[264]. X-ray also is less susceptible to absorption, compared to optical; and it does not suffer from confusion with star formation like radio[266]. A common theme seen in all bands of quasar luminosity functions is that as redshift increases, the peak of the luminosity function shifts to higher luminosity[267]. Thus the typical quasar at low redshift is less luminous than at high redshift and, for fixed radiative efficiency, this implies that the typical quasar is less massive at low redshift. This ‘quasar downsizing’ implies that the most massive black holes grow quickly early on and then mostly shut down[267].
4 Black hole mass functions
Empirical black hole mass functions – the observed space density of black holes as a function of redshift and mass – are also vital tools for characterizing the cosmic black hole growth and evolution. Mass scaling relationships (§ 3) have allowed the determination of the mass function for actively accreting black holes for the redshift and mass ranges over which AGN and quasars are known. This mass function has been characterized using a suite of black hole samples covering a range of distances from the local to the more distant Universe[268]. While the mass functions more directly characterize the black hole demographics compared to luminosity functions, they are limited to the black holes that grow by accreting material at high rates. Another challenge is that the lower mass boundary is a priori not well defined because the black holes are not selected based on their mass, but based on the luminosity of the AGN, since all AGN are discovered and selected from flux-limited surveys.
Nonetheless, the observed mass functions support the notion of a maximum black hole mass[109] of , by displaying a sharp decline in number density above this mass[268]. The mass functions also clearly reveal the aforementioned ‘cosmic downsizing’ trend: the massive black holes are only actively accreting at earlier epochs while at lower redshifts essentially only low-mass black holes are active[110], explaining why the lower luminosity AGN, such as Seyfert galaxies, are the dominant type of AGN in the nearby Universe. While the most massive black holes live fast and furious as AGN at early epochs, the low-mass black holes may need more time to grow sufficiently massive to power an AGN owing to their lower mass accretion rate.
5 Obscured growth
One potential difficulty in mapping out cosmic growth of quasars is when there is strong obscuration of the quasar light from some medium probably close to the black hole. The number of quasars that are significantly obscured is large, potentially a majority. Thus accounting for them is necessary to fully determine their cosmic growth. The main difficulty is that the fraction of obscured quasars is not constant with luminosity or redshift. Obscured quasars are also in host galaxies with larger amounts of gas and dust. Our missing the obscured quasars thus results in a systematic selection effect. Galaxies with larger amount of gas and dust also tend to be star-forming and/or merging. Therefore, characterizing the full connection between galaxy evolution and quasar activity requires taking into account the obscured population. For a more detailed look into the different techniques for identifying obscured quasars see the review by Hickox & Alexander[269].
11 Intermediate-Mass Black Holes
Intermediate-mass black holes (IMBHs) are those with mass between stellar-mass black holes () and supermassive black holes (). The boundaries of the definition vary by scientist, but are usually set so as not to include black holes that could have formed from a single massive star’s evolution and those commonly found in centers of galaxies. In the context of supermassive black holes, IMBHs are astrophysically relevant as precursor stages to current supermassive black holes[270]. As stated in §2, the Sołtan[23] argument has shown that most of the mass in black holes at was accreted onto the black holes over cosmic time. Thus most black holes started less massive than they are as observed in the current epoch. The consideration of Eddington-limited growth of black holes and the observations of black holes at also requires IMBHs as their starting, or ‘seed’ mass or else there is insufficient time to grow to the observed masses[257]. Despite the astrophysical expectation that IMBHs exist, observational evidence of their existence has proven difficult to come by.
Efforts to find IMBHs largely follow observational techniques of stellar-mass and supermassive black holes: dynamical evidence and evidence of accretion. Dynamical evidence comes from both stellar and gas kinematics as well as reverberation mapping. Greene, Strader & Ho[271] compiled a handful of IMBHs of mass at the center of galaxies. Two of them (NGC 205 and NGC 4395) have reported masses , but neither is fully certain as there are other mass estimates consistent with larger masses [97, 272]. There are also about a dozen galaxies with stellar dynamical measurements of a central black hole that place an upper limit such that any black hole would have to be an IMBH, but the observations are also consistent with a lack of a black hole [271]. As described in §3, dynamical mass measurements at a specified distance are more difficult for smaller black holes because of their smaller sphere of influence.
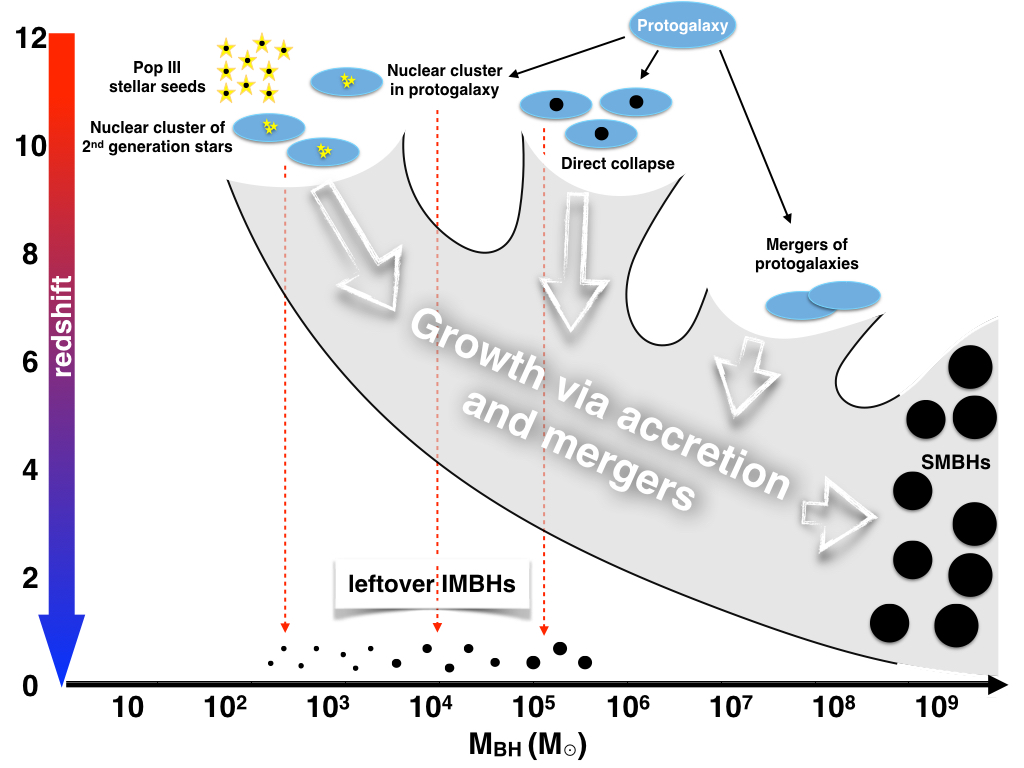
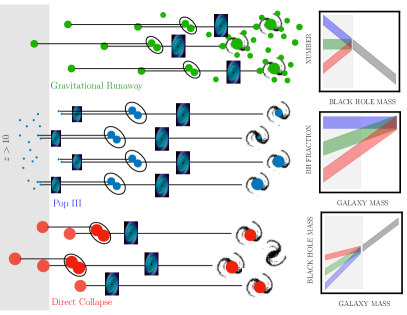
Over one hundred candidate IMBHs have been identified from single-epoch observations of AGN line widths (§ 3) indicating masses below [273, 274, 275, 276, 277]. A key challenge is that the spectral signatures of low-mass AGNs can be mimicked by other types of sources. Application of the BPT diagrams (see diagrams of Section 4) used to determine whether the emission lines are ionized by an accreting black hole or star formation (§ 4) are problematic when used in the smaller galaxies that host these candidate IMBHs. The lower metallicities of the host dwarf galaxies may lead to more high-mass X-ray binaries and more O stars with radiation fields sufficient (especially when clustered) to explain the line ratios seen in the candidates [278]. An additional issue is that stellar winds and supernovae can produce line widths of . Multiwavelength follow-up is needed to confirm the AGN nature of the candidates, and most of them do not show positive evidence of being an AGN. Finally, there is concern that the H line usually used to estimate the black hole mass in these systems may come from non-uniform, non-virialized gas, invalidating the mass estimate[271].
The chance detection of a star being tidally disrupted by a light supermassive black hole () is an alternative way to identify IMBHs. As discussed in section 6, the characteristics of the light curve hold information on the mass of not only the disrupted star but also of the disrupting black hole. While the number of such black holes discovered this way is currently quite low[271], the next generation high-cadence photometric surveys (e.g., the Rubin Observatory’s Legacy Survey of Space and Time) hold great potential for identifying a large number of IMBHs. This approach is demonstrated by the recent discovery of a candidate IMBH of in a dwarf galaxy[187].
Evidence of IMBH candidates has also been found outside of galaxy nuclei in stellar clusters and as ultraluminous X-ray sources (ULXs). Several Galactic and one extragalactic globular cluster have been modelled via the stellar dynamical techniques and resulted in mass estimates as large as [271]. Many globular clusters have been modeled by multiple teams, but none has multiple mass estimates that are significantly above zero. ULXs are off-nuclear X-ray sources with inferred luminosities above , which corresponds to the Eddington limit of a black hole [279]. Above , a natural explanation is an IMBH. Detailed observations of ULXs has shown that many are likely accreting neutron stars with anisotropic emission, invalidating the luminosity inference. HLX-1 is one ULX that has survived to stand as best explained by an accreting IMBH [280].
Despite the lack of confirmed IMBHs observed electromagnetically, the search continues as it is critical for understanding a number of open questions. The seed mass distribution of supermassive black holes is unknown. The small black holes at the centers of the smallest galaxies are potentially closer to their seed masses on account of having undergone fewer mergers and accreted less material. Measurement of the full mass distribution of black holes would enable inferences about the distribution of seed masses, and thus allow discrimination between competing supermassive black hole formation models[271].
12 Pairs of Black Holes
Since every massive galaxy hosts a black hole and massive galaxies merge, there is the obvious expectation that more than one black hole can exist in a galaxy at the same time. The first serious consideration of this idea was made theoretically by Begelman et al.[281] and observationally by Faber et al.[282] Theoretically, the idea is relatively straightforward, but observations of pairs of black holes are relatively rare.
1 Theoretical Overview
The theoretical picture has not qualitatively evolved much in the last 40 years. When two black-hole-hosting galaxies merge with each other, the galaxy merger does what it will to the dark matter, stars, and gas of the galaxies[283]. The black holes go through several phases with the black hole separation monotonically decreasing with time:
-
1.
When the galaxies are interacting but still obviously separate galaxies at separations , the black holes are almost completely unaffected by the galaxy-scale interaction.
-
2.
Once tidal fields are strong enough to induce significant torque on the gas (), cold gas can flow to the center of the galaxies and induce substantial accretion onto the black holes.
-
3.
After the second pericenter passage, the galaxies are usually no longer individual galaxies but a merging system. At this point, there are two black holes in a single galaxy with separation , depending on the mass of the galaxies.
-
4.
As the merged galaxy settles, dynamical friction of stars acting on the black holes causes the black holes’ orbits within the galaxy potential to lose energy. If the mass ratio () of the two galaxies is far from unity, then the black hole in the more massive galaxy (and presumably the more massive black hole) may not be far from the center of the recently merged galaxy.
-
5.
If conditions are not unfavorable, dynamical friction can remove enough energy such that the two black holes become a gravitationally bound binary with separation of order , where is the total mass of the binary and is the local stellar velocity dispersion. Typical values of and result in .
-
6.
Gravitational interactions with stars on orbits within will tend to take energy away from the binary, causing its orbit to tighten or ‘harden.’ An early key theoretical concern (catchily named the ‘final parsec problem’) was whether there exist sufficient stars on orbits to harden the binary to the next phase. Most modern numerical simulations agree that some combination of gas dynamical drag and non-axisymmetry is sufficient to overcome this problem [284, 285].
-
7.
When the binary’s separation is small enough that gravitational wave emission is significant, then its evolution decouples from the stars and its orbit decays at a rate (under the quadrupole approximation)
(7) where is the semimajor axis, is the eccentricity, and and are the masses[286]. Gravitational wave emission will continue until the two black holes merge (see Chapter 8).
-
8.
During the final stages of merger, gravitational waves may be anisotropically emitted because of mass asymmetry and/or spin asymmetry. This anisotropy and conservation of the momentum carried by the gravitational waves leads to a recoil of up to several thousands of . Though most recoils will be of much smaller magnitude, several thousand is sufficient to eject the coalesced black hole from the galaxy.
At any point in the above sequence of events until coalescence, we can refer to the two black holes as a black hole pair. When not gravitationally bound, they are referred to as dual black holes; and only when gravitationally bound are they binary black holes. If the black holes are active, then we refer to them as dual or binary AGNs. The timescales for all of the phases after the galaxy has merged are highly uncertain. Original calculations of dynamical friction timescales may have overestimated the efficiency and thus underestimated the amount of time it takes for the black holes to become bound.
Observationally, inferring the presence of black hole pairs becomes more difficult the smaller the separation. The techniques for finding them are organized here by decreasing physical separation of the black holes.
2 Spatially resolving pairs
The most straightforward way to identify pairs is by spatially resolving them. Inferring the presence of quiescent black holes is notoriously difficult (§3); so, black hole pairs are almost always found as AGN pairs. Dual AGN can be identified in the same types of ways that single AGN are identified: by SED analysis, line ratios indicating ionization by an AGN, substantial X-ray emission, or by AGN radio emission. The presence of an X-ray point source emission is not sufficient to infer the presence of an AGN because X-ray binaries can also appear as X-ray point sources. However, point-source X-ray emission above about almost always is a result of AGN activity; so it is frequently used for final vindication of AGN status of otherwise ambiguous optical or infrared signatures. To this end, much effort has gone into using Chandra as it has the best spatial resolution of any X-ray telescope. Also, advanced statistical techniques are used to infer the presence of pairs with separations smaller than the native pixel resolution.
The separations probed by these techniques are limited by angular resolution and have thus far found dual AGN with separations as small as in optical and X-ray. At radio wavelengths, VLBI has the highest angular resolution achieved, and it thus has the potential to resolve widely separated binary black holes. There are several binary candidates revealed from VLBI observations, but only one (0402+379[287]) has a secondary that is obviously not part of an elongated jet structure. It also has proper motion consistent with a binary orbit at speeds expected for its projected 7 pc separation [288].
3 Varstrometry
Varstrometry is a technique that uses high-precision astrometry to infer the presence of more than one source in an unresolved system by looking for variability in the astrometric center. If the components of the system have uncorrelated, intrinsic variability, then the astrometric center of the system will vary over time. The angular variability in the astrometric center depends on the flux ratio and intrinsic variabilities of the component sources, but if the components are comparable to each other, the astrometric variability amplitude is expected to be
| (8) |
where is the angular separation of the sources, is the average total flux of the sources, and is the rms flux variability. Typical fractional AGN variability is 10%, and GAIA’s astrometric precision of 10 mas correspond to angular separations of 0.2′′, and has been used to find approximately 20 dual AGN at redshifts .[289, 290]
4 Spectro-astrometric techniques
A third technique combines spatially distinguishing sources with separation in wavelength in two-dimensional spectra. Dual AGN will have some relative velocity to each other if one or both is infalling or recoiling but at speeds that are comparable to or smaller than the width of lines used to identify the AGN. The angular separations are similarly small compared to the angular resolution of the instrumentation, but when combined, the two AGN appear as sources separated in the two-dimensional spectra[291]. AGN emission lines, however, can be complicated. Narrow lines in particular can have complex distributions in space and/or velocity. Thus dual AGN candidates identified with spectro-astrometric techniques usually need to be followed up with X-ray or radio imaging to confirm the presence of an AGN[292].
5 Spectroscopic techniques
At separations unresolvable by imaging, the high orbital velocity of binary AGN can be identified spectroscopically. The AGN must be identified by their broad emission line regions, which consist of the gas assumed to be tightly bound to the black holes. The width of the broad lines, however, is necessarily broader than the relative velocity of the black holes and thus makes identification of two broad-line-emitting AGN very difficult. If only the secondary AGN has significant broad-line emission, as has been predicted by a number of theoretical works[293, 294, 295], then it would spectroscopically appear as a broad-line region offset in velocity relative to the narrow emission lines, which will be at the systemic velocity of the host galaxy. Nearly 100 offset broad line AGN have been identified in SDSS data, but confirmation of these as binary AGN is difficult because of the complex nature of broad emission line region. One alternative hypothesis is a single-arm spiral instability in the broad emission line region. Continued monitoring of the offset broad line AGN could eventually reveal orbital motions, but with expected periods of up to a few centuries for separations , other tests are needed.[296]
6 Light curve analysis
At smaller separations still, time-domain astronomy may be able to identify variable emission resulting from binary AGN. Variable accretion rates arising from torques generated by the binary black holes plus Doppler boosting of emitting gas will result in variable continuum emission. A large number of candidates have been identified with this technique[297, 298, 299], but separating intrinsic AGN variability from binary AGN variability is difficult.[298]
7 Gravitational waves
Gravitational waves are more fully covered in Chapter 9, but they are an obvious way to detect binary black holes. They will be strong sources in the LISA band at milihertz frequencies as individual sources and in pulsar timing array bands at nanohertz frequencies as a stochastic signal or as individual sources.
8 Recoiled and recoiling AGN
Finally, a recoiled or recoiling black hole would be indirect evidence for a binary black hole. Positive evidence for a galaxy lacking a black hole is very difficult, but positive evidence for an AGN off-center from the host galaxy is possible. Several candidates have been identified[284].
13 Cosmic Distance Measurements
Scientists have long investigated ways in which quasars could serve as cosmic distance indicators given their high luminosity and ubiquitous presence especially at large cosmic distances. The challenge is to identify a property that can be used as a standard candle or standard ruler.
One of the first studies is that of J. Baldwin[33] who examined if the quasar continuum luminosity correlates sufficiently strongly with other quasar properties that they could be used as a standard candle. J. Baldwin discovered that the strength of the CIV 1549, in particular, decreases with increasing continuum luminosity, an effect now known as the Baldwin effect. However, the scatter in the relationship is too large for this relationship to be a useful standard candle. Contributing to the scatter are light travel time effects between the continuum source and the broad-line region for individual objects[300].
Since then, proposals have been made over the years to use different properties of quasars to measure cosmic distances. Some examples include emission from the black hole accretion disk[301], the broad emission line widths[302], superluminal motion in radio jets[303], the angular diameter of the broad-line region[304] and by identifying quasars emitting at the Eddington limit[305]. However, these early suggestions were not taken further. More recently, our improved understanding of quasars and active galactic nuclei have enabled further progress and a few promising techniques have been proposed.
In 2010 the relationship between the size of the broad-line region, measured by reverberation mapping, and the optical luminosity (§ 3) had become sufficiently tight[151, 153, 154] that Watson et al.[306] proposed to use the relationship in a reversed manner. The Radius – Luminosity relation is commonly used to infer the size of the broad-line region for an estimate of the mass of the black hole in distant AGN where reverberation mapping is unsuitable or simply impractical (§ 3) . Instead of using the continuum luminosity from the AGN to infer the size of the broad-line region, Watson et al. proposed to use reverberation mapping results to infer the source luminosity. By comparing with the observed continuum flux received from the source the cosmic (luminosity) distance can thus be inferred. By using the restframe ultraviolet continuum luminosity instead of the optical luminosity the uncertainty in the distance modulus can be decreased[148] (from magnitudes to magnitudes) due to AGN varying more with larger amplitudes in the ultraviolet regime.
Scientific groups are currently undertaking monitoring programs, in collaboration with surveys targeting supernovae searches. The goal is to perform reverberation mapping of distant AGN and quasars (§ 3) with a hope to also be able to constrain cosmic distances in addition to measuring black hole masses and the size of the broad-line region in these galaxies. While it appears that Baryonic Acoustic Oscillation measurements are currently outperforming the reverberation mapping method, the latter method is currently where the Supernovae method was in the 1980s, leaving room for further improvements.
As it turns out, the physical structure of black hole powered central engine is suitable as a cosmic distance gauge in other ways. Hönig et al.[307] show that the size of the hot-dust emitting region of AGN can be used as a standard ruler if the physical size is determined from time delays and the angular dimension is measured from infrared interferometry. This geometric technique has been dubbed the dust-parallax method. The method measures the angular diameter distance, . The principle of this method is easily understood in a non-expanding, local volume of space. Then the geometric distance is simply . This method was used to measure a of 19 Mpc to the local galaxy[307] NGC 4151. Recently, a high-precision distance of 15.8 0.4 Mpc was measured to NGC 4151 using long-period Cepheid variable stars[308]. The poor agreement of the dust-parallax distance to this robust measurement suggests that the systematics of the dust parallax technique is insufficiently understood.
Similarly, by combining measurements of the broad-line region angular size from observations with the GRAVITY instrument (§ 3) with the physical size measured via time delays by reverberation mapping, scientists have now measured the angular diameter distance to two other local AGN, 3C 273[309] and NGC 3783[310]. This advance can prove quite important since some of the nearby AGN are sufficiently nearby that their redshifts do not accurately reflect their cosmic distances. This is because the gravitational influence of nearby mass structures, such as galaxy clusters, give these AGN a significant perculiar velocity. Accurate distances are crucial for the determination of luminosities and black hole masses[311] and the feedback power of the black hole[222].
Most recently, Lusso et al.[312] show that the luminosity properties of distant quasars are intrinsically stable enough to act as a reliable standard candle. The authors show that the relationship between the X-ray and UV luminosities is sufficiently tight over four orders of magnitude in luminosity to be a cosmic distance measure when using only optically selected quasars with homogeneous spectral energy distributions that show no signs of reddening or obscuration and are free of flux-limit biases. This method is showing promise as it yields distance estimates matching those based on Supernovae measurements, currently observed to a redshift of 1.5.
14 Future Outlook
Technological advances have in the past several years pushed black hole research into an entirely new era, allowing the detection of gravitational waves from colliding black holes and the first high-resolution imaging of the shadows of two supermassive black holes using sub-millimeter interferometry that spatially resolves structure on scales near the size of the black hole event horizon. This is possibly just a taste of the new breakthroughs and discoveries to come when the ground-based gravitational wave detectors are expanded and upgraded555For example, for the Laser Interferometry Gravitational-wave Observatory: https://www.ligo.caltech.edu/page/ligo-lab-statement-long-term-future-observing-plans; links to other gravitational-wave observatories (Virgo, Kagra, GEO600) are also provided on this website.. The Event Horizon Telescope will also be upgraded666https://eventhorizontelescope.org/technology to be more sensitive (larger collecting area and wider frequency band width) and to operate at a higher frequency. This allows sharper images and provides access to other supermassive black holes than those in centers of the Milky Way and M87 galaxies. While the EHT may not image the shadow of a significant number of supermassive black holes, its exquisite angular resolution means that EHT observations can be used to probe other aspects of black hole and AGN physics than the plasma at and near the event horizon. This is quite promising. This is the first time that scientists will have access to the spatial scales where most of the physics of the AGN central engine take place. However, the limitation is that this new window of discovery space is at sub-millimeter and millimeter wavelengths[197], which are not necessarily the best probes of the physics of the winds and outflows. Granted, gravitational waves from coalescing supermassive black holes cannot be detected until the planned Laser Interferometry Space Antenna777https://lisa.nasa.gov/ (LISA) is launched in 2037. LISA will operate at much lower frequencies (0.1 mHz and 1 Hz) than ground-based detectors (10 Hz to 1 kHz), so LISA will be sensitive to the wider orbits of binary supermassive black holes. With LISA it will in principle be possible to characterize the frequency of occurrence of colliding supermassive black holes and thus characterize their growth history by mergers, thereby providing important constraints on the mass distribution of the first black hole seeds. By combining electromagnetic observations with gravitational wave observations (see Chapter 9) scientists will be able to enhance the astrophysical return of both types of investigations.
ESO’s Very Large Telescope infrared interferometry instrument, GRAVITY, will also undergo an upgrade888https://www.mpe.mpg.de/ir/gravityplus that will make it much more sensitive, reaching a -band magnitude of 22, compared to the current limit999https://www.eso.org/sci/facilities/paranal/instruments/gravity/inst.html of 17 mag. This is expected to enable mass determinations of supermassive black holes out to a redshift of about 2 and to measure the central mass of nearby candidate intermediate mass black holes with stellar kinematics. The upgraded instrument, GRAVITY+, is expected to come online in 2025.
Hopes are high among scientists that observations101010https://www.stsci.edu/jwst/science-execution/approved-programs with the newly launched James Webb Space Telescope (JWST), sensitive in the near- and mid-infrared wavelength regime, will provide significant, further insight into not only the properties of the first supermassive black holes in the Universe and their host galaxies but also into their collective effect on the environment at those early times. JWST may also provide the first accurate characterization of the – relationship for galaxies residing at distances beyond the local Universe.
The Vera C. Rubin Observatory111111Formerly known as the Large Synoptic Survey Telescope (LSST), https://www.lsst.org/ will be a game changer for the discovery of variable celestial sources and transients, including tidal disruption events and AGN. With first light in 2023, this 8.4 m optical telescope will image the entire sky every few days. The planned high cadence photometry will be helpful for (a) characterizing the light curves of new tidal disruption events and the time variability of new and known bona-fide AGNs; (b) demographic studies of low- and intermediate mass black holes; (c) preparing follow-up spectroscopic studies of the accretion physics and stellar dynamical mass measurements with other large aperture telescopes; and (d) periodic binary AGN with short periods.
By the middle of the next decade (mid 2030’s) very large ground-based telescopes will have had their first light: namely, ESO’s Extremely Large Telescope121212https://elt.eso.org/ (ELT, 39 meter), the Giant Magellan Telescope131313GMT will consist of seven 8.4 meter segmented mirrors with equivalent resolving power of a 24.5 meter single-mirror telescope with collecting area of a 22.0 meter mirror; https://www.gmto.org/ (GMT, 23 meter), the Thirty Meter Telescope141414https://www.tmt.org/ (TMT, 30 meter). Their large telescope apertures will provide exquisite angular resolution and an amazingly large collecting area suitable for (a) detailed studies of the physics and growth of distant supermassive black holes and their role in galaxy evolution; and (b) for identifying and weighing intermediate-mass black holes. In particular, integral field spectrographs with adaptive optics such as HARMONI at ELT and GMTIFS at GMT, promise significant advances that allow determination of stellar and gas dynamics on small spatial scales that are needed to weigh intermediate-mass and supermassive black holes and to characterize the physics responsible for black hole fueling, growth and feedback onto the host galaxy.
Looking further into the future, NASA is planning for its next flagship mission the ‘Large UV-Optical Infrared Surveyor’151515https://www.luvoirtelescope.org/ (LUVOIR) potentially to be launched no earlier than in the late 2030’s with either an 8-m or a 15-m mirror. In short, the angular resolution and sensitivity will be like the Hubble Space Telescope on steroids. While one of the primary aims is to study extra-solar planets, its capabilities will also be suitable for weighing intermediate mass black holes with stellar and gas dynamics in the nearby Universe and supermassive black holes beyond that.
Significant advances are also expected from new X-ray mission concepts. One of the primary goals of ATHENA (the Advanced Telescope for High-ENergy Astrophysics161616https://www.the-athena-x-ray-observatory.eu/) X-ray Mission, recently selected for construction by the European Space Agency with a tentative launch date in the 2030s, is to provide a complete census and characterization of how black holes have grown over cosmic time and of the physical processes responsible for this growth. Lynx171717https://www.lynxobservatory.com/ is an ongoing concept study of a very ambitious, transformative X-ray mission aimed to achieve high angular resolution, high sensitivity, high survey speed and large field of view. One of its main science goals is to study in detail how material accretes onto the first black holes formed in the Universe and to observe in real time the collision of black holes, localized by gravitational wave detectors weeks before the actual collision. If Lynx is selected, one may hope that its active mission will overlap with that of LUVOIR for optimal science return of each of these two flagship missions.
While individual modern telescopes with advanced optics and detector technology in each of their specialized wavelength regime will bring promising advances, the combination of ongoing and future wide-area surveys at X-ray (e.g. e-Rosita181818https://www.mpe.mpg.de/eROSITA, ATHENA), optical-infrared (e.g., Euclid191919https://www.esa.int/Science_Exploration/Space_Science/Euclid_overview), infrared (e.g., WFIRST-Roman202020https://roman.gsfc.nasa.gov/) and radio (e.g., Square Kilometer Array, SKA212121https://www.skatelescope.org) wavelengths can provide powerful observational constraints on the primordial black hole population, let alone the physical conditions of the early Universe[313].
In summary, the immediate and more distant future is looking particularly bright for shedding light on the darkest, most powerful, and possibly the most enigmatic objects that we currently know to exist in our Universe.
References
- 1. V. F. Baldassare, A. E. Reines, E. Gallo et al., A 50,000 M⊙ Solar Mass Black Hole in the Nucleus of RGG 118, ApJ. 809(1):L14 (Aug., 2015). 10.1088/2041-8205/809/1/L14.
- 2. D. B. Sanders, E. S. Phinney, G. Neugebauer et al., Continuum Energy Distributions of Quasars: Shapes and Origins, ApJ. 347, 29 (Dec., 1989). 10.1086/168094.
- 3. R. C. Jennison and M. K. Das Gupta, Fine Structure of the Extra-terrestrial Radio Source Cygnus I, Nat. 172(4387), 996–997 (Nov., 1953). 10.1038/172996a0.
- 4. C. Hazard, M. B. Mackey and A. J. Shimmins, Investigation of the Radio Source 3C 273 By The Method of Lunar Occultations, Nat. 197(4872), 1037–1039 (Mar., 1963). 10.1038/1971037a0.
- 5. M. Schmidt, 3C 273 : A Star-Like Object with Large Red-Shift, Nat. 197(4872), 1040 (Mar., 1963). 10.1038/1971040a0.
- 6. R. Blandford, D. Meier and A. Readhead, Relativistic Jets from Active Galactic Nuclei, ARA&A. 57, 467–509 (Aug., 2019). 10.1146/annurev-astro-081817-051948.
- 7. A. Stockton, The nature of QSO redshifts., ApJ. 223, 747–757 (Aug., 1978). 10.1086/156308.
- 8. T. A. Boroson and J. B. Oke, Detection of the underlying galaxy in the QSO 3C48, Nat. 296(5856), 397–399 (Apr., 1982). 10.1038/296397a0.
- 9. D. Lynden-Bell, Galactic Nuclei as Collapsed Old Quasars, Nat. 223(5207), 690–694 (Aug., 1969). 10.1038/223690a0.
- 10. D. Richstone, E. A. Ajhar, R. Bender et al., Supermassive black holes and the evolution of galaxies., Nat. 385(6701), A14 (Oct., 1998).
- 11. J. Kormendy and D. Richstone, Inward Bound—The Search For Supermassive Black Holes In Galactic Nuclei, ARA&A. 33, 581 (Jan., 1995). 10.1146/annurev.aa.33.090195.003053.
- 12. C. M. Urry and P. Padovani, Unified Schemes for Radio-Loud Active Galactic Nuclei, PASP. 107, 803 (Sept., 1995). 10.1086/133630.
- 13. R. J. Weymann, S. L. Morris, C. B. Foltz et al., Comparisons of the Emission-Line and Continuum Properties of Broad Absorption Line and Normal Quasi-stellar Objects, ApJ. 373, 23 (May, 1991). 10.1086/170020.
- 14. C. Knigge, S. Scaringi, M. R. Goad et al., The intrinsic fraction of broad-absorption line quasars, MNRAS. 386(3), 1426–1435 (May, 2008). 10.1111/j.1365-2966.2008.13081.x.
- 15. F. Tombesi, M. Meléndez, S. Veilleux et al., Wind from the black-hole accretion disk driving a molecular outflow in an active galaxy, Nat. 519(7544), 436–438 (Mar., 2015). 10.1038/nature14261.
- 16. N. Arav, X. Xu, T. Miller et al., HST/COS Observations of Quasar Outflows in the 500-1050 Å Rest Frame. I. The Most Energetic Outflows in the Universe and Other Discoveries, ApJS. 247(2):37 (Apr., 2020). 10.3847/1538-4365/ab66af.
- 17. X. Xu, N. L. Zakamska, N. Arav et al., Evidence that emission and absorption outflows in quasars are related, MNRAS. 495(1), 305–320 (June, 2020). 10.1093/mnras/staa1142.
- 18. S. Veilleux, M. Meléndez, E. Sturm et al., Fast Molecular Outflows in Luminous Galaxy Mergers: Evidence for Quasar Feedback from Herschel, ApJ. 776(1):27 (Oct., 2013). 10.1088/0004-637X/776/1/27.
- 19. S. Aalto, N. Falstad, S. Muller et al., ALMA resolves the remarkable molecular jet and rotating wind in the extremely radio-quiet galaxy NGC 1377, A&A. 640:A104 (Aug., 2020). 10.1051/0004-6361/202038282.
- 20. J. Frank, A. R. King and D. J. Raine, Accretion power in astrophysics. Cambridge University Press (1985).
- 21. F. Haardt and L. Maraschi, X-Ray Spectra from Two-Phase Accretion Disks, ApJ. 413, 507 (Aug., 1993). 10.1086/173020.
- 22. K. S. Thorne, Disk-Accretion onto a Black Hole. II. Evolution of the Hole, ApJ. 191, 507–520 (July, 1974). 10.1086/152991.
- 23. A. Sołtan, Masses of quasars., MNRAS. 200, 115–122 (July, 1982). 10.1093/mnras/200.1.115.
- 24. Q. Yu and S. Tremaine, Observational constraints on growth of massive black holes, MNRAS. 335(4), 965–976 (Oct., 2002). 10.1046/j.1365-8711.2002.05532.x.
- 25. M. Elvis, G. Risaliti and G. Zamorani, Most Supermassive Black Holes Must Be Rapidly Rotating, ApJ. 565(2), L75–L77 (Feb., 2002). 10.1086/339197.
- 26. M. Elvis, B. J. Wilkes, J. C. McDowell et al., Atlas of Quasar Energy Distributions, ApJS. 95, 1 (Nov., 1994). 10.1086/192093.
- 27. G. T. Richards, M. Lacy, L. J. Storrie-Lombardi et al., Spectral Energy Distributions and Multiwavelength Selection of Type 1 Quasars, ApJS. 166(2), 470–497 (Oct., 2006). 10.1086/506525.
- 28. L. Jiang, X. Fan, Ž. Ivezić et al., The Radio-Loud Fraction of Quasars is a Strong Function of Redshift and Optical Luminosity, ApJ. 656(2), 680–690 (Feb., 2007). 10.1086/510831.
- 29. F. Panessa, R. D. Baldi, A. Laor et al., The origin of radio emission from radio-quiet active galactic nuclei, Nature Astronomy. 3, 387–396 (Apr., 2019). 10.1038/s41550-019-0765-4.
- 30. L. C. Ho, A. V. Filippenko and W. L. W. Sargent, New Insights into the Physical Nature of LINERs from a Multiwavelength Analysis of the Nucleus of M81, ApJ. 462, 183 (May, 1996). 10.1086/177140.
- 31. G. G. Madejski and M. Sikora, Gamma-Ray Observations of Active Galactic Nuclei, ARA&A. 54, 725–760 (Sept., 2016). 10.1146/annurev-astro-081913-040044.
- 32. M. Dietrich, F. Hamann, J. C. Shields et al., Continuum and Emission-Line Strength Relations for a Large Active Galactic Nuclei Sample, ApJ. 581(2), 912–924 (Dec., 2002). 10.1086/344410.
- 33. J. A. Baldwin, Luminosity Indicators in the Spectra of Quasi-Stellar Objects, ApJ. 214, 679–684 (June, 1977). 10.1086/155294.
- 34. T. A. Boroson and R. F. Green, The Emission-Line Properties of Low-Redshift Quasi-stellar Objects, ApJS. 80, 109 (May, 1992). 10.1086/191661.
- 35. T. A. Boroson, Black Hole Mass and Eddington Ratio as Drivers for the Observable Properties of Radio-loud and Radio-quiet QSOs, ApJ. 565(1), 78–85 (Jan., 2002). 10.1086/324486.
- 36. J. W. Sulentic, T. Zwitter, P. Marziani et al., Eigenvector 1: An Optimal Correlation Space for Active Galactic Nuclei, ApJ. 536(1), L5–L9 (June, 2000). 10.1086/312717.
- 37. J. Sulentic and P. Marziani, Quasars in the 4D Eigenvector 1 Context: a stroll down memory lane, Frontiers in Astronomy and Space Sciences. 2:6 (Oct., 2015). 10.3389/fspas.2015.00006.
- 38. P. J. Francis, P. C. Hewett, C. B. Foltz et al., A High Signal-to-Noise Ratio Composite Quasar Spectrum, ApJ. 373, 465 (June, 1991). 10.1086/170066.
- 39. B. M. Peterson, An Introduction to Active Galactic Nuclei. Cambridge University Press (1997).
- 40. C. S. Reynolds, Unwrapping the X-ray spectra of active galactic nuclei, Astronomische Nachrichten. 337(4-5), 404 (May, 2016). 10.1002/asna.201612321.
- 41. J. M. Miller, Relativistic X-Ray Lines from the Inner Accretion Disks Around Black Holes, ARA&A. 45(1), 441–479 (Sept., 2007). 10.1146/annurev.astro.45.051806.110555.
- 42. R. F. Mushotzky, C. Done and K. A. Pounds, X-ray spectra and time variability of active galactic nuclei., ARA&A. 31, 717–717 (Jan., 1993). 10.1146/annurev.aa.31.090193.003441.
- 43. A. K. Kembhavi and J. V. Narlikar, Quasars and active galactic nuclei : an introduction. Cambridge University Press (1999).
- 44. F. Yuan and R. Narayan, Hot Accretion Flows Around Black Holes, ARA&A. 52, 529–588 (Aug., 2014). 10.1146/annurev-astro-082812-141003.
- 45. Y. Zu, C. S. Kochanek and B. M. Peterson, An Alternative Approach to Measuring Reverberation Lags in Active Galactic Nuclei, ApJ. 735(2):80 (July, 2011). 10.1088/0004-637X/735/2/80.
- 46. M. Sun, J. R. Trump, Y. Shen et al., The Sloan Digital Sky Survey Reverberation Mapping Project: Ensemble Spectroscopic Variability of Quasar Broad Emission Lines, ApJ. 811(1):42 (Sept., 2015). 10.1088/0004-637X/811/1/42.
- 47. Y. Lu and Q. Yu, The relationship between X-ray variability and the central black hole mass, MNRAS. 324(3), 653–658 (June, 2001). 10.1046/j.1365-8711.2001.04344.x.
- 48. D. E. Vanden Berk, B. C. Wilhite, R. G. Kron et al., The Ensemble Photometric Variability of ~25,000 Quasars in the Sloan Digital Sky Survey, ApJ. 601(2), 692–714 (Feb., 2004). 10.1086/380563.
- 49. S. Kaspi, W. N. Brandt, D. Maoz et al., Reverberation Mapping of High-Luminosity Quasars: First Results, ApJ. 659(2), 997–1007 (Apr., 2007). 10.1086/512094.
- 50. J. Clavel, G. A. Reichert, D. Alloin et al., Steps toward Determination of the Size and Structure of the Broad-Line Region in Active Galactic Nuclei. I. an 8 Month Campaign of Monitoring NGC 5548 with IUE, ApJ. 366, 64 (Jan., 1991). 10.1086/169540.
- 51. G. A. Reichert, P. M. Rodriguez-Pascual, D. Alloin et al., Steps toward Determination of the Size and Structure of the Broad-Line Region in Active Galactic Nuclei. V. Variability of the Ultraviolet Continuum and Emission Lines of NGC 3783, ApJ. 425, 582 (Apr., 1994). 10.1086/174007.
- 52. G. M. Stirpe, C. Winge, B. Altieri et al., Steps toward Determination of the Size and Structure of the Broad-Line Region in Active Galactic Nuclei. VI. Variability of NGC 3783 from Ground-based Data, ApJ. 425, 609 (Apr., 1994). 10.1086/174008.
- 53. B. M. Peterson, T. J. Balonek, E. S. Barker et al., Steps toward Determination of the Size and Structure of the Broad-Line Region in Active Galactic Nuclei. II. an Intensive Study of NGC 5548 at Optical Wavelengths, ApJ. 368, 119 (Feb., 1991). 10.1086/169675.
- 54. E. M. Cackett, M. C. Bentz and E. Kara, Reverberation mapping of active galactic nuclei: from X-ray corona to dusty torus, iScience. 24(6), 102557 (June, 2021). 10.1016/j.isci.2021.102557.
- 55. D. E. Osterbrock, Astrophysics of gaseous nebulae and active galactic nuclei. University Science Books (1989).
- 56. D. E. Osterbrock and G. J. Ferland, Astrophysics of gaseous nebulae and active galactic nuclei. University Science Books (2006).
- 57. R. L. Davies, L. J. Kewley, I. T. Ho et al., Starburst-AGN mixing - II. Optically selected active galaxies, MNRAS. 444(4), 3961–3974 (Nov., 2014). 10.1093/mnras/stu1740.
- 58. S. I. Raimundo, M. Vestergaard, J. Y. Koay et al., MUSE observations of a changing-look AGN - I. The reappearance of the broad emission lines, MNRAS. 486(1), 123–140 (June, 2019). 10.1093/mnras/stz852.
- 59. J. A. Baldwin, M. M. Phillips and R. Terlevich, Classification parameters for the emission-line spectra of extragalactic objects., PASP. 93, 5–19 (Feb., 1981). 10.1086/130766.
- 60. S. Veilleux and D. E. Osterbrock, Spectral Classification of Emission-Line Galaxies, ApJS. 63, 295 (Feb., 1987). 10.1086/191166.
- 61. L. J. Kewley, B. Groves, G. Kauffmann et al., The host galaxies and classification of active galactic nuclei, MNRAS. 372(3), 961–976 (Nov., 2006). 10.1111/j.1365-2966.2006.10859.x.
- 62. E. A. Fath, The spectra of some spiral nebulae and globular star clusters, Lick Observatory Bulletin. 149, 71–77 (Jan., 1909). 10.5479/ADS/bib/1909LicOB.5.71F.
- 63. C. K. Seyfert, Nuclear Emission in Spiral Nebulae., ApJ. 97, 28 (Jan., 1943). 10.1086/144488.
- 64. A. S. Bennett, The revised 3C catalogue of radio sources., MmRAS. 68, 163 (Jan., 1962).
- 65. R. A. Laing, J. M. Riley and M. S. Longair, Bright radio sources at 178 MHz : flux densities, optical identifications and the cosmological evolution of powerful radio galaxies., MNRAS. 204, 151–187 (July, 1983). 10.1093/mnras/204.1.151.
- 66. H.-Y. Chiu, Gravitational Collapse, Physics Today. 17(5), 21 (Jan., 1964). 10.1063/1.3051610.
- 67. R. F. Green, M. Schmidt and J. Liebert, The Palomar-Green Catalog of Ultraviolet-Excess Stellar Objects, ApJS. 61, 305 (June, 1986). 10.1086/191115.
- 68. B. J. Boyle, R. Fong, T. Shanks et al., A catalogue of faint, UV-excess objects., MNRAS. 243, 1–56 (Mar., 1990). 10.1093/mnras/243.1.1.
- 69. P. C. Hewett, C. B. Foltz and F. H. Chaffee, The Large Bright Quasar Survey.VI.Quasar Catalog and Survey Parameters, AJ. 109, 1498 (Apr., 1995). 10.1086/117380.
- 70. R. Antonucci, Unified models for active galactic nuclei and quasars., ARA&A. 31, 473–521 (Jan., 1993). 10.1146/annurev.aa.31.090193.002353.
- 71. M. Elvis, A Structure for Quasars, ApJ. 545(1), 63–76 (Dec., 2000). 10.1086/317778.
- 72. B. J. Shappee, J. L. Prieto, D. Grupe et al., The Man behind the Curtain: X-Rays Drive the UV through NIR Variability in the 2013 Active Galactic Nucleus Outburst in NGC 2617, ApJ. 788(1):48 (June, 2014). 10.1088/0004-637X/788/1/48.
- 73. K. D. Denney, G. De Rosa, K. Croxall et al., The Typecasting of Active Galactic Nuclei: Mrk 590 no Longer Fits the Role, ApJ. 796(2):134 (Dec., 2014). 10.1088/0004-637X/796/2/134.
- 74. S. M. LaMassa, S. Cales, E. C. Moran et al., The Discovery of the First “Changing Look” Quasar: New Insights Into the Physics and Phenomenology of Active Galactic Nucleus, ApJ. 800(2):144 (Feb., 2015). 10.1088/0004-637X/800/2/144.
- 75. M. Elitzur, L. C. Ho and J. R. Trump, Evolution of broad-line emission from active galactic nuclei, MNRAS. 438(4), 3340–3351 (Mar., 2014). 10.1093/mnras/stt2445.
- 76. J. C. Runnoe, S. Cales, J. J. Ruan et al., Now you see it, now you don’t: the disappearing central engine of the quasar J1011+5442, MNRAS. 455(2), 1691–1701 (Jan., 2016). 10.1093/mnras/stv2385.
- 77. R. E. McElroy, B. Husemann, S. M. Croom et al., The Close AGN Reference Survey (CARS). Mrk 1018 returns to the shadows after 30 years as a Seyfert 1, A&A. 593:L8 (Sept., 2016). 10.1051/0004-6361/201629102.
- 78. H. Noda and C. Done, Explaining changing-look AGN with state transition triggered by rapid mass accretion rate drop, MNRAS. 480(3), 3898–3906 (Nov., 2018). 10.1093/mnras/sty2032.
- 79. Y.-F. Jiang and O. Blaes, Opacity-driven Convection and Variability in Accretion Disks around Supermassive Black Holes, ApJ. 900(1):25 (Sept., 2020). 10.3847/1538-4357/aba4b7.
- 80. J. Y. Koay, M. Vestergaard, V. Casasola et al., ALMA probes the molecular gas reservoirs in the changing-look Seyfert galaxy Mrk 590, MNRAS. 455(3), 2745–2764 (Jan., 2016). 10.1093/mnras/stv2495.
- 81. C. L. MacLeod, N. P. Ross, A. Lawrence et al., A systematic search for changing-look quasars in SDSS, MNRAS. 457(1), 389–404 (Mar., 2016). 10.1093/mnras/stv2997.
- 82. E. Gallo, R. P. Fender and G. G. Pooley, A universal radio-X-ray correlation in low/hard state black hole binaries, MNRAS. 344(1), 60–72 (Sept., 2003). 10.1046/j.1365-8711.2003.06791.x.
- 83. E. Gallo, B. P. Miller and R. Fender, Assessing luminosity correlations via cluster analysis: evidence for dual tracks in the radio/X-ray domain of black hole X-ray binaries, MNRAS. 423(1), 590–599 (June, 2012). 10.1111/j.1365-2966.2012.20899.x.
- 84. K. Gültekin, A. L. King, E. M. Cackett et al., The Fundamental Plane of Black Hole Accretion and Its Use as a Black Hole-Mass Estimator, ApJ. 871(1):80 (Jan., 2019). 10.3847/1538-4357/aaf6b9.
- 85. H. Falcke, E. Körding and S. Markoff, A scheme to unify low-power accreting black holes. Jet-dominated accretion flows and the radio/X-ray correlation, A&A. 414, 895–903 (Feb., 2004). 10.1051/0004-6361:20031683.
- 86. A. Merloni, S. Heinz and T. di Matteo, A Fundamental Plane of black hole activity, MNRAS. 345(4), 1057–1076 (Nov., 2003). 10.1046/j.1365-2966.2003.07017.x.
- 87. M. Schwarzschild, A numerical model for a triaxial stellar system in dynamical equilibrium., ApJ. 232, 236–247 (Aug., 1979). 10.1086/157282.
- 88. J. F. Navarro, C. S. Frenk and S. D. M. White, A Universal Density Profile from Hierarchical Clustering, ApJ. 490(2), 493–508 (Dec., 1997). 10.1086/304888.
- 89. K. Gebhardt, J. Adams, D. Richstone et al., The Black Hole Mass in M87 from Gemini/NIFS Adaptive Optics Observations, ApJ. 729(2):119 (Mar., 2011). 10.1088/0004-637X/729/2/119.
- 90. J. L. Walsh, A. J. Barth, L. C. Ho et al., The M87 Black Hole Mass from Gas-dynamical Models of Space Telescope Imaging Spectrograph Observations, ApJ. 770(2):86 (June, 2013). 10.1088/0004-637X/770/2/86.
- 91. Event Horizon Telescope Collaboration, K. Akiyama, A. Alberdi et al., First M87 Event Horizon Telescope Results. VI. The Shadow and Mass of the Central Black Hole, ApJ. 875(1):L6 (Apr., 2019). 10.3847/2041-8213/ab1141.
- 92. J. L. Walsh, A. J. Barth and M. Sarzi, The Supermassive Black Hole in M84 Revisited, ApJ. 721(1), 762–776 (Sept., 2010). 10.1088/0004-637X/721/1/762.
- 93. B. D. Boizelle, A. J. Barth, J. L. Walsh et al., A Precision Measurement of the Mass of the Black Hole in NGC 3258 from High-resolution ALMA Observations of Its Circumnuclear Disk, ApJ. 881(1):10 (Aug., 2019). 10.3847/1538-4357/ab2a0a.
- 94. H. Nagai, K. Onishi, N. Kawakatu et al., The ALMA Discovery of the Rotating Disk and Fast Outflow of Cold Molecular Gas in NGC 1275, ApJ. 883(2):193 (Oct., 2019). 10.3847/1538-4357/ab3e6e.
- 95. M. D. Smith, M. Bureau, T. A. Davis et al., WISDOM project - VII. Molecular gas measurement of the supermassive black hole mass in the elliptical galaxy NGC 7052, MNRAS. 503(4), 5984–5996 (June, 2021). 10.1093/mnras/stab791.
- 96. T. A. Davis, D. D. Nguyen, A. C. Seth et al., Revealing the intermediate-mass black hole at the heart of the dwarf galaxy NGC 404 with sub-parsec resolution ALMA observations, MNRAS. 496(4), 4061–4078 (Aug., 2020). 10.1093/mnras/staa1567.
- 97. D. D. Nguyen, M. den Brok, A. C. Seth et al., The MBHBM⋆ Project. I. Measurement of the Central Black Hole Mass in Spiral Galaxy NGC 3504 Using Molecular Gas Kinematics, ApJ. 892(1):68 (Mar., 2020). 10.3847/1538-4357/ab77aa.
- 98. A. J. Barth, J. Darling, A. J. Baker et al., Toward Precision Black Hole Masses with ALMA: NGC 1332 as a Case Study in Molecular Disk Dynamics, ApJ. 823(1):51 (May, 2016). 10.3847/0004-637X/823/1/51.
- 99. J. R. Herrnstein, J. M. Moran, L. J. Greenhill et al., The Geometry of and Mass Accretion Rate through the Maser Accretion Disk in NGC 4258, ApJ. 629(2), 719–738 (Aug., 2005). 10.1086/431421.
- 100. B. M. Peterson, Reverberation Mapping of Active Galactic Nuclei, PASP. 105, 247 (Mar., 1993). 10.1086/133140.
- 101. K. Horne, B. M. Peterson, S. J. Collier et al., Observational Requirements for High-Fidelity Reverberation Mapping, PASP. 116(819), 465–476 (May, 2004). 10.1086/420755.
- 102. B. M. Peterson and A. Wandel, Keplerian Motion of Broad-Line Region Gas as Evidence for Supermassive Black Holes in Active Galactic Nuclei, ApJ. 521(2), L95–L98 (Aug., 1999). 10.1086/312190.
- 103. B. M. Peterson and A. Wandel, Evidence for Supermassive Black Holes in Active Galactic Nuclei from Emission-Line Reverberation, ApJ. 540(1), L13–L16 (Sept., 2000). 10.1086/312862.
- 104. B. M. Peterson, L. Ferrarese, K. M. Gilbert et al., Central Masses and Broad-Line Region Sizes of Active Galactic Nuclei. II. A Homogeneous Analysis of a Large Reverberation-Mapping Database, ApJ. 613(2), 682–699 (Oct., 2004). 10.1086/423269.
- 105. E. Dalla Bontà, B. M. Peterson, M. C. Bentz et al., The Sloan Digital Sky Survey Reverberation Mapping Project: Estimating Masses of Black Holes in Quasars with Single-epoch Spectroscopy, ApJ. 903(2):112 (Nov., 2020). 10.3847/1538-4357/abbc1c.
- 106. A. Rafiee and P. B. Hall, Biases in the quasar mass-luminosity plane, MNRAS. 415(3), 2932–2941 (Aug., 2011). 10.1111/j.1365-2966.2011.18910.x.
- 107. M. C. Bentz and S. Katz, The AGN Black Hole Mass Database, PASP. 127(947), 67 (Jan., 2015). 10.1086/679601.
- 108. B. M. Peterson, M. C. Bentz, L.-B. Desroches et al., Multiwavelength Monitoring of the Dwarf Seyfert 1 Galaxy NGC 4395. I. A Reverberation-based Measurement of the Black Hole Mass, ApJ. 632(2), 799–808 (Oct., 2005). 10.1086/444494.
- 109. M. Vestergaard, Early Growth and Efficient Accretion of Massive Black Holes at High Redshift, ApJ. 601(2), 676–691 (Feb., 2004). 10.1086/379758.
- 110. M. Vestergaard and P. S. Osmer, Mass Functions of the Active Black Holes in Distant Quasars from the Large Bright Quasar Survey, the Bright Quasar Survey, and the Color-selected Sample of the SDSS Fall Equatorial Stripe, ApJ. 699(1), 800–816 (July, 2009). 10.1088/0004-637X/699/1/800.
- 111. B. C. Kelly, M. Vestergaard, X. Fan et al., Constraints on Black Hole Growth, Quasar Lifetimes, and Eddington Ratio Distributions from the SDSS Broad-line Quasar Black Hole Mass Function, ApJ. 719(2), 1315–1334 (Aug., 2010). 10.1088/0004-637X/719/2/1315.
- 112. B. M. Peterson, K. D. Denney, G. De Rosa et al., The Size of the Narrow-line-emitting Region in the Seyfert 1 Galaxy NGC 5548 from Emission-line Variability, ApJ. 779(2):109 (Dec., 2013). 10.1088/0004-637X/779/2/109.
- 113. K. T. Korista, D. Alloin, P. Barr et al., Steps toward Determination of the Size and Structure of the Broad-Line Region in Active Galactic Nuclei. VIII. an Intensive HST, IUE, and Ground-based Study of NGC 5548, ApJS. 97, 285 (Apr., 1995). 10.1086/192144.
- 114. K. G. Metzroth, C. A. Onken and B. M. Peterson, The Mass of the Central Black Hole in the Seyfert Galaxy NGC 4151, ApJ. 647(2), 901–909 (Aug., 2006). 10.1086/505525.
- 115. G. De Rosa, B. M. Peterson, J. Ely et al., Space Telescope and Optical Reverberation Mapping Project.I. Ultraviolet Observations of the Seyfert 1 Galaxy NGC 5548 with the Cosmic Origins Spectrograph on Hubble Space Telescope, ApJ. 806(1):128 (June, 2015). 10.1088/0004-637X/806/1/128.
- 116. M. Dehghanian, G. J. Ferland, G. A. Kriss et al., Space Telescope and Optical Reverberation Mapping Project. XI. Disk-wind Characteristics and Contributions to the Very Broad Emission Lines of NGC 5548, ApJ. 898(2):141 (Aug., 2020). 10.3847/1538-4357/ab9cb2.
- 117. B. M. Peterson, G. De Rosa, G. A. Kriss et al. Mapping Gas Flows in AGNs by Reverberation. HST Proposal (May, 2020).
- 118. E. Kara, M. Mehdipour, G. A. Kriss et al., AGN STORM 2. I. First results: A Change in the Weather of Mrk 817, ApJ. 922(2):151 (Dec., 2021). 10.3847/1538-4357/ac2159.
- 119. F. Yuan, C. Lidman, T. M. Davis et al., OzDES multifibre spectroscopy for the Dark Energy Survey: first-year operation and results, MNRAS. 452(3), 3047–3063 (Sept., 2015). 10.1093/mnras/stv1507.
- 120. Y. Shen, W. N. Brandt, K. S. Dawson et al., The Sloan Digital Sky Survey Reverberation Mapping Project: Technical Overview, ApJS. 216(1):4 (Jan., 2015). 10.1088/0067-0049/216/1/4.
- 121. P. Lira, S. Kaspi, H. Netzer et al., Reverberation Mapping of Luminous Quasars at High z, ApJ. 865(1):56 (Sept., 2018). 10.3847/1538-4357/aada45.
- 122. C. J. Grier, Y. Shen, K. Horne et al., The Sloan Digital Sky Survey Reverberation Mapping Project: Initial C IV Lag Results from Four Years of Data, ApJ. 887(1):38 (Dec., 2019). 10.3847/1538-4357/ab4ea5.
- 123. J. K. Hoormann, P. Martini, T. M. Davis et al., C IV black hole mass measurements with the Australian Dark Energy Survey (OzDES), MNRAS. 487(3), 3650–3663 (Aug., 2019). 10.1093/mnras/stz1539.
- 124. A. Penton, U. Malik, T. M. Davis et al., OzDES reverberation mapping program: Lag recovery reliability for 6-yr C IV analysis, MNRAS. 509(3), 4008–4023 (Jan., 2022). 10.1093/mnras/stab3027.
- 125. Y. Shen, K. Horne, C. J. Grier et al., The Sloan Digital Sky Survey Reverberation Mapping Project: First Broad-line H and Mg II Lags at z 0.3 from Six-month Spectroscopy, ApJ. 818(1):30 (Feb., 2016). 10.3847/0004-637X/818/1/30.
- 126. B. Czerny, A. Olejak, M. Rałowski et al., Time Delay Measurement of Mg II Line in CTS C30.10 with SALT, ApJ. 880(1):46 (July, 2019). 10.3847/1538-4357/ab2913.
- 127. Y. Homayouni, M. R. Sturm, J. R. Trump et al., The Sloan Digital Sky Survey Reverberation Mapping Project: UV-Optical Accretion Disk Measurements with Hubble Space Telescope, arXiv e-prints. art. arXiv:2105.02884 (May, 2021).
- 128. Z. Yu, P. Martini, A. Penton et al., OzDES Reverberation Mapping Programme: the first Mg II lags from 5 yr of monitoring, MNRAS. 507(3), 3771–3788 (Nov., 2021). 10.1093/mnras/stab2244.
- 129. G. T. Richards, N. E. Kruczek, S. C. Gallagher et al., Unification of Luminous Type 1 Quasars through C IV Emission, AJ. 141(5):167 (May, 2011). 10.1088/0004-6256/141/5/167.
- 130. G. Fonseca Alvarez, J. R. Trump, Y. Homayouni et al., The Sloan Digital Sky Survey Reverberation Mapping Project: The H Radius-Luminosity Relation, ApJ. 899(1):73 (Aug., 2020). 10.3847/1538-4357/aba001.
- 131. A. L. King, P. Martini, T. M. Davis et al., Simulations of the OzDES AGN reverberation mapping project, MNRAS. 453(2), 1701–1726 (Oct., 2015). 10.1093/mnras/stv1718.
- 132. M. Haas, R. Chini, M. Ramolla et al., Photometric AGN reverberation mapping - an efficient tool for BLR sizes, black hole masses, and host-subtracted AGN luminosities, A&A. 535:A73 (Nov., 2011). 10.1051/0004-6361/201117325.
- 133. L. Jiang, Y. Shen, I. D. McGreer et al., Reverberation Mapping with Intermediate-band Photometry: Detection of Broad-line H Time Lags for Quasars at 0.2 < z < 0.4, ApJ. 818(2):137 (Feb., 2016). 10.3847/0004-637X/818/2/137.
- 134. C. J. Grier, A. Pancoast, A. J. Barth et al., The Structure of the Broad-line Region in Active Galactic Nuclei. II. Dynamical Modeling of Data From the AGN10 Reverberation Mapping Campaign, ApJ. 849(2):146 (Nov., 2017). 10.3847/1538-4357/aa901b.
- 135. A. Pancoast, A. Skielboe, L. Pei et al., The Lick AGN Monitoring Project 2011: Photometric Light Curves, ApJ. 871(1):108 (Jan., 2019). 10.3847/1538-4357/aaf806.
- 136. M. Y. Piotrovich, Y. N. Gnedin, N. A. Silant’ev et al., A polarimetric method for measuring black hole masses in Active Galactic Nuclei, MNRAS. 454(1), 1157–1160 (Nov., 2015). 10.1093/mnras/stv2047.
- 137. R. D. Baldi, A. Capetti, A. Robinson et al., Radio-loud Narrow Line Seyfert 1 under a different perspective: a revised black hole mass estimate from optical spectropolarimetry, MNRAS. 458(1), L69–L73 (May, 2016). 10.1093/mnrasl/slw019.
- 138. Y.-Y. Songsheng and J.-M. Wang, Measuring black hole mass of type I active galactic nuclei by spectropolarimetry, MNRAS. 473(1), L1–L5 (Jan., 2018). 10.1093/mnrasl/slx154.
- 139. C. A. Onken, L. Ferrarese, D. Merritt et al., Supermassive Black Holes in Active Galactic Nuclei. II. Calibration of the Black Hole Mass-Velocity Dispersion Relationship for Active Galactic Nuclei, ApJ. 615(2), 645–651 (Nov., 2004). 10.1086/424655.
- 140. J. H. Krolik, K. Horne, T. R. Kallman et al., Ultraviolet Variability of NGC 5548: Dynamics of the Continuum Production Region and Geometry of the Broad-Line Region, ApJ. 371, 541 (Apr., 1991). 10.1086/169918.
- 141. K. Horne, W. F. Welsh and B. M. Peterson, Echo Mapping of Broad H beta Emission in NGC 5548, ApJ. 367, L5 (Jan., 1991). 10.1086/185919.
- 142. M. C. Bentz, K. Horne, A. J. Barth et al., The Lick AGN Monitoring Project: Velocity-delay Maps from the Maximum-entropy Method for Arp 151, ApJ. 720(1), L46–L51 (Sept., 2010). 10.1088/2041-8205/720/1/L46.
- 143. K. D. Denney, B. M. Peterson, R. W. Pogge et al., Reverberation Mapping Measurements of Black Hole Masses in Six Local Seyfert Galaxies, ApJ. 721(1), 715–737 (Sept., 2010). 10.1088/0004-637X/721/1/715.
- 144. C. J. Grier, B. M. Peterson, K. Horne et al., The Structure of the Broad-line Region in Active Galactic Nuclei. I. Reconstructed Velocity-delay Maps, ApJ. 764(1):47 (Feb., 2013). 10.1088/0004-637X/764/1/47.
- 145. K. Horne, G. De Rosa, B. M. Peterson et al., Space Telescope and Optical Reverberation Mapping Project. IX. Velocity-Delay Maps for Broad Emission Lines in NGC 5548, ApJ. 907(2):76 (Feb., 2021). 10.3847/1538-4357/abce60.
- 146. S. Kaspi, D. Maoz, H. Netzer et al., The Relationship between Luminosity and Broad-Line Region Size in Active Galactic Nuclei, ApJ. 629(1), 61–71 (Aug., 2005). 10.1086/431275.
- 147. K. T. Korista and M. R. Goad, What the Optical Recombination Lines Can Tell Us about the Broad-Line Regions of Active Galactic Nuclei, ApJ. 606(2), 749–762 (May, 2004). 10.1086/383193.
- 148. E. Kilerci Eser, M. Vestergaard, B. M. Peterson et al., On the Scatter in the Radius-Luminosity Relationship for Active Galactic Nuclei, ApJ. 801(1):8 (Mar., 2015). 10.1088/0004-637X/801/1/8.
- 149. S. Wang, Y. Shen, L. Jiang et al., The Sloan Digital Sky Survey Reverberation Mapping Project: How Broad Emission Line Widths Change When Luminosity Changes, ApJ. 903(1):51 (Nov., 2020). 10.3847/1538-4357/abb36d.
- 150. J. Baldwin, G. Ferland, K. Korista et al., Locally Optimally Emitting Clouds and the Origin of Quasar Emission Lines, ApJ. 455, L119 (Dec., 1995). 10.1086/309827.
- 151. M. C. Bentz, B. M. Peterson, H. Netzer et al., The Radius-Luminosity Relationship for Active Galactic Nuclei: The Effect of Host-Galaxy Starlight on Luminosity Measurements. II. The Full Sample of Reverberation-Mapped AGNs, ApJ. 697(1), 160–181 (May, 2009). 10.1088/0004-637X/697/1/160.
- 152. H. Landt, M. J. Ward, B. M. Peterson et al., A near-infrared relationship for estimating black hole masses in active galactic nuclei, MNRAS. 432(1), 113–126 (June, 2013). 10.1093/mnras/stt421.
- 153. M. C. Bentz, K. D. Denney, C. J. Grier et al., The Low-luminosity End of the Radius-Luminosity Relationship for Active Galactic Nuclei, ApJ. 767(2):149 (Apr., 2013). 10.1088/0004-637X/767/2/149.
- 154. B. M. Peterson. Toward Precision Measurement of Central Black Hole Masses. In eds. B. M. Peterson, R. S. Somerville and T. Storchi-Bergmann, Co-Evolution of Central Black Holes and Galaxies, vol. 267, pp. 151–160, Cambridge University Press (May, 2010). 10.1017/S1743921310006095.
- 155. S. Kaspi, W. N. Brandt, D. Maoz et al., Taking a Long Look: A Two-decade Reverberation Mapping Study of High-luminosity Quasars, ApJ. 915(2):129 (July, 2021). 10.3847/1538-4357/ac00aa.
- 156. P. Du and J.-M. Wang, The Radius-Luminosity Relationship Depends on Optical Spectra in Active Galactic Nuclei, ApJ. 886(1):42 (Nov., 2019). 10.3847/1538-4357/ab4908.
- 157. P. Du, Z.-X. Zhang, K. Wang et al., Supermassive Black Holes with High Accretion Rates in Active Galactic Nuclei. IX. 10 New Observations of Reverberation Mapping and Shortened H Lags, ApJ. 856(1):6 (Mar., 2018). 10.3847/1538-4357/aaae6b.
- 158. M. Vestergaard and B. M. Peterson, Determining Central Black Hole Masses in Distant Active Galaxies and Quasars. II. Improved Optical and UV Scaling Relationships, ApJ. 641(2), 689–709 (Apr., 2006). 10.1086/500572.
- 159. A. Wandel, B. M. Peterson and M. A. Malkan, Central Masses and Broad-Line Region Sizes of Active Galactic Nuclei. I. Comparing the Photoionization and Reverberation Techniques, ApJ. 526(2), 579–591 (Dec., 1999). 10.1086/308017.
- 160. M. Vestergaard, Determining Central Black Hole Masses in Distant Active Galaxies, ApJ. 571(2), 733–752 (June, 2002). 10.1086/340045.
- 161. R. J. McLure and M. J. Jarvis, Measuring the black hole masses of high-redshift quasars, MNRAS. 337(1), 109–116 (Nov., 2002). 10.1046/j.1365-8711.2002.05871.x.
- 162. J. E. Greene and L. C. Ho, Estimating Black Hole Masses in Active Galaxies Using the H Emission Line, ApJ. 630(1), 122–129 (Sept., 2005). 10.1086/431897.
- 163. D. Park, J.-H. Woo, K. D. Denney et al., Calibrating C-IV-based Black Hole Mass Estimators, ApJ. 770(2):87 (June, 2013). 10.1088/0004-637X/770/2/87.
- 164. D. Park, A. J. Barth, J.-H. Woo et al., Extending the Calibration of C IV-based Single-epoch Black Hole Mass Estimators for Active Galactic Nuclei, ApJ. 839(2):93 (Apr., 2017). 10.3847/1538-4357/aa6a53.
- 165. Y. Shen, The mass of quasars, Bulletin of the Astronomical Society of India. 41(1), 61–115 (Mar., 2013).
- 166. M. Vestergaard, K. Denney, X. Fan et al. Black hole mass estimations: limitations and uncertainties. In eds. L. Foschini, M. Colpi, L. Gallo et al., Narrow-Line Seyfert 1 Galaxies and their Place in the Universe, p. 38, Proceedings of Science (Jan., 2011).
- 167. D. Tytler and X.-M. Fan, Systematic QSO Emission-Line Velocity Shifts and New Unbiased Redshifts, ApJS. 79, 1 (Mar., 1992). 10.1086/191642.
- 168. G. T. Richards, D. E. Vanden Berk, T. A. Reichard et al., Broad Emission-Line Shifts in Quasars: An Orientation Measure for Radio-Quiet Quasars?, AJ. 124(1), 1–17 (July, 2002). 10.1086/341167.
- 169. K. D. Denney, Are Outflows Biasing Single-epoch C IV Black Hole Mass Estimates?, ApJ. 759(1):44 (Nov., 2012). 10.1088/0004-637X/759/1/44.
- 170. K. D. Denney, B. M. Peterson, R. W. Pogge et al., Diverse Kinematic Signatures from Reverberation Mapping of the Broad-Line Region in AGNs, ApJ. 704(2), L80–L84 (Oct., 2009). 10.1088/0004-637X/704/2/L80.
- 171. J. E. Mejía-Restrepo, P. Lira, H. Netzer et al., The effect of nuclear gas distribution on the mass determination of supermassive black holes, Nature Astronomy. 2, 63–68 (Nov., 2018). 10.1038/s41550-017-0305-z.
- 172. R. R. J. Antonucci and J. S. Miller, Spectropolarimetry and the nature of NGC 1068., ApJ. 297, 621–632 (Oct., 1985). 10.1086/163559.
- 173. V. L. Afanasiev and L. Č. Popović, Polarization in Lines—A New Method for Measuring Black Hole Masses in Active Galaxies, ApJ. 800(2):L35 (Feb., 2015). 10.1088/2041-8205/800/2/L35.
- 174. D. Savić, R. Goosmann, L. Č. Popović et al., AGN black hole mass estimates using polarization in broad emission lines, A&A. 614:A120 (June, 2018). 10.1051/0004-6361/201732220.
- 175. S. Koshida, T. Minezaki, Y. Yoshii et al., Reverberation Measurements of the Inner Radius of the Dust Torus in 17 Seyfert Galaxies, ApJ. 788(2):159 (June, 2014). 10.1088/0004-637X/788/2/159.
- 176. M. Kishimoto, S. F. Hönig, R. Antonucci et al., The innermost dusty structure in active galactic nuclei as probed by the Keck interferometer, A&A. 527:A121 (Mar., 2011). 10.1051/0004-6361/201016054.
- 177. B. J. Wills and I. W. A. Browne, Relativistic Beaming and Quasar Emission Lines, ApJ. 302, 56 (Mar., 1986). 10.1086/163973.
- 178. M. Vestergaard, B. J. Wilkes and P. D. Barthel, Clues to Quasar Broad-Line Region Geometry and Kinematics, ApJ. 538(2), L103–L106 (Aug., 2000). 10.1086/312805.
- 179. Gravity Collaboration, E. Sturm, J. Dexter et al., Spatially resolved rotation of the broad-line region of a quasar at sub-parsec scale, Nat. 563(7733), 657–660 (Nov., 2018). 10.1038/s41586-018-0731-9.
- 180. V. L. Afanasiev, L. Č. Popović and A. I. Shapovalova, Spectropolarimetry of Seyfert 1 galaxies with equatorial scattering: black hole masses and broad-line region characteristics, MNRAS. 482(4), 4985–4999 (Feb., 2019). 10.1093/mnras/sty2995.
- 181. Đ. V. Savić, L. Č. Popović and E. Shablovinskaya, The First Supermassive Black Hole Mass Measurement in Active Galactic Nuclei Using the Polarization of Broad Emission Line Mg II, ApJ. 921(1):L21 (Nov., 2021). 10.3847/2041-8213/ac2d30.
- 182. M. Gierliński, M. Nikołajuk and B. Czerny, High-frequency X-ray variability as a mass estimator of stellar and supermassive black holes, MNRAS. 383(2), 741–749 (Jan., 2008). 10.1111/j.1365-2966.2007.12584.x.
- 183. M. Nikołajuk, B. Czerny, J. Ziółkowski et al., Consistency of the black hole mass determination in AGN from the reverberation and the X-ray excess variance method, MNRAS. 370(3), 1534–1540 (Aug., 2006). 10.1111/j.1365-2966.2006.10576.x.
- 184. B. Mockler, J. Guillochon and E. Ramirez-Ruiz, Weighing Black Holes Using Tidal Disruption Events, ApJ. 872(2):151 (Feb., 2019). 10.3847/1538-4357/ab010f.
- 185. M. J. Rees, Tidal disruption of stars by black holes of 106-108 solar masses in nearby galaxies, Nat. 333(6173), 523–528 (June, 1988). 10.1038/333523a0.
- 186. K. Auchettl, J. Guillochon and E. Ramirez-Ruiz, New Physical Insights about Tidal Disruption Events from a Comprehensive Observational Inventory at X-Ray Wavelengths, ApJ. 838(2):149 (Apr., 2017). 10.3847/1538-4357/aa633b.
- 187. C. e. a. Angus, Title to be provided, Nature (12, 2022).
- 188. Event Horizon Telescope Collaboration, K. Akiyama, A. Alberdi et al., First M87 Event Horizon Telescope Results. V. Physical Origin of the Asymmetric Ring, ApJ. 875(1):L5 (Apr., 2019). 10.3847/2041-8213/ab0f43.
- 189. C. S. Reynolds, Observing black holes spin, Nature Astronomy. 3, 41–47 (Jan., 2019). 10.1038/s41550-018-0665-z.
- 190. C. S. Reynolds, Observational Constraints on Black Hole Spin, ARA&A. 59 (Sept., 2021). 10.1146/annurev-astro-112420-035022.
- 191. A. M. Ghez, S. Salim, N. N. Weinberg et al., Measuring Distance and Properties of the Milky Way’s Central Supermassive Black Hole with Stellar Orbits, ApJ. 689(2), 1044–1062 (Dec., 2008). 10.1086/592738.
- 192. R. Genzel, F. Eisenhauer and S. Gillessen, The Galactic Center massive black hole and nuclear star cluster, Reviews of Modern Physics. 82(4), 3121–3195 (Oct., 2010). 10.1103/RevModPhys.82.3121.
- 193. Gravity Collaboration, R. Abuter, A. Amorim et al., Detection of the gravitational redshift in the orbit of the star S2 near the Galactic centre massive black hole, A&A. 615:L15 (July, 2018). 10.1051/0004-6361/201833718.
- 194. T. Do, A. Hees, A. Ghez et al., Relativistic redshift of the star S0-2 orbiting the Galactic Center supermassive black hole, Science. 365(6454), 664–668 (Aug., 2019). 10.1126/science.aav8137.
- 195. A. Hees, T. Do, A. M. Ghez et al., Testing General Relativity with Stellar Orbits around the Supermassive Black Hole in Our Galactic Center, Phys. Rev. Let.. 118(21):211101 (May, 2017). 10.1103/PhysRevLett.118.211101.
- 196. Gravity Collaboration, R. Abuter, A. Amorim et al., Detection of the Schwarzschild precession in the orbit of the star S2 near the Galactic centre massive black hole, A&A. 636:L5 (Apr., 2020). 10.1051/0004-6361/202037813.
- 197. Event Horizon Telescope Collaboration, K. Akiyama, A. Alberdi et al., First M87 Event Horizon Telescope Results. I. The Shadow of the Supermassive Black Hole, ApJ. 875(1):L1 (Apr., 2019). 10.3847/2041-8213/ab0ec7.
- 198. Event Horizon Telescope Collaboration, K. Akiyama, A. Alberdi et al., First M87 Event Horizon Telescope Results. II. Array and Instrumentation, ApJ. 875(1):L2 (Apr., 2019). 10.3847/2041-8213/ab0c96.
- 199. K. Inayoshi, E. Visbal and Z. Haiman, The Assembly of the First Massive Black Holes, ARA&A. 58, 27–97 (Aug., 2020). 10.1146/annurev-astro-120419-014455.
- 200. R. C. Walker, P. E. Hardee, F. B. Davies et al., The Structure and Dynamics of the Subparsec Jet in M87 Based on 50 VLBA Observations over 17 Years at 43 GHz, ApJ. 855(2):128 (Mar., 2018). 10.3847/1538-4357/aaafcc.
- 201. R. Narayan, M. R. Garcia and J. E. McClintock, Advection-dominated Accretion and Black Hole Event Horizons, ApJ. 478(2), L79–L82 (Apr., 1997). 10.1086/310554.
- 202. Event Horizon Telescope Collaboration, K. Akiyama, J. C. Algaba et al., First M87 Event Horizon Telescope Results. VIII. Magnetic Field Structure near The Event Horizon, ApJ. 910(1):L13 (Mar., 2021). 10.3847/2041-8213/abe4de.
- 203. EHT MWL Science Working Group, J. C. Algaba, J. Anczarski et al., Broadband Multi-wavelength Properties of M87 during the 2017 Event Horizon Telescope Campaign, ApJ. 911(1):L11 (Apr., 2021). 10.3847/2041-8213/abef71.
- 204. R. D. Blandford and R. L. Znajek, Electromagnetic extraction of energy from Kerr black holes., MNRAS. 179, 433–456 (May, 1977). 10.1093/mnras/179.3.433.
- 205. Event Horizon Telescope Collaboration, K. Akiyama, J. C. Algaba et al., First M87 Event Horizon Telescope Results. VII. Polarization of the Ring, ApJ. 910(1):L12 (Mar., 2021). 10.3847/2041-8213/abe71d.
- 206. J. Davelaar and Z. Haiman, Self-Lensing Flares from Black Hole Binaries: Observing Black Hole Shadows via Light Curve Tomography, Phys. Rev. Let.. 128(19):191101 (May, 2022). 10.1103/PhysRevLett.128.191101.
- 207. Gravity Collaboration, O. Pfuhl, R. Davies et al., An image of the dust sublimation region in the nucleus of NGC 1068, A&A. 634:A1 (Feb., 2020). 10.1051/0004-6361/201936255.
- 208. Gravity Collaboration, J. Dexter, J. Shangguan et al., The resolved size and structure of hot dust in the immediate vicinity of AGN, A&A. 635:A92 (Mar., 2020). 10.1051/0004-6361/201936767.
- 209. J. Clavel, W. Wamsteker and I. S. Glass, Hot Dust on the Outskirts of the Broad-Line Region in Fairall 9, ApJ. 337, 236 (Feb., 1989). 10.1086/167100.
- 210. S. F. Hönig, Dust Reverberation Mapping in the Era of Big Optical Surveys and its Cosmological Application, ApJ. 784(1):L4 (Mar., 2014). 10.1088/2041-8205/784/1/L4.
- 211. S. Hoenig. Tori, clumps, disks, and winds – a tale of our evolving picture of dust around AGN. In 40th COSPAR Scientific Assembly, vol. 40, pp. E1.19–16–14 (Jan., 2014).
- 212. Gravity Collaboration, E. Sturm, J. Dexter et al., Spatially resolved rotation of the broad-line region of a quasar at sub-parsec scale, Nat. 563(7733), 657–660 (Nov., 2018). 10.1038/s41586-018-0731-9.
- 213. B. J. Wills and I. W. A. Browne, Relativistic Beaming and Quasar Emission Lines, ApJ. 302, 56 (Mar., 1986). 10.1086/163973.
- 214. M. Vestergaard, B. J. Wilkes and P. D. Barthel, Clues to Quasar Broad-Line Region Geometry and Kinematics, ApJ. 538(2), L103–L106 (Aug., 2000). 10.1086/312805.
- 215. Gravity Collaboration, A. Amorim, M. Bauböck et al., The central parsec of NGC 3783: a rotating broad emission line region, asymmetric hot dust structure, and compact coronal line region, A&A. 648:A117 (Apr., 2021). 10.1051/0004-6361/202040061.
- 216. Gravity Collaboration, J. Dexter, J. Shangguan et al., The resolved size and structure of hot dust in the immediate vicinity of AGN, A&A. 635:A92 (Mar., 2020). 10.1051/0004-6361/201936767.
- 217. J. Kormendy and L. C. Ho, Coevolution (Or Not) of Supermassive Black Holes and Host Galaxies, ARA&A. 51(1), 511–653 (Aug., 2013). 10.1146/annurev-astro-082708-101811.
- 218. L. Ferrarese, R. W. Pogge, B. M. Peterson et al., Supermassive Black Holes in Active Galactic Nuclei. I. The Consistency of Black Hole Masses in Quiescent and Active Galaxies, ApJ. 555(2), L79–L82 (July, 2001). 10.1086/322528.
- 219. J. Kormendy and J. Kennicutt, Robert C., Secular Evolution and the Formation of Pseudobulges in Disk Galaxies, ARA&A. 42(1), 603–683 (Sept., 2004). 10.1146/annurev.astro.42.053102.134024.
- 220. F. Wang, R. Wang, X. Fan et al., Spatially Resolved Interstellar Medium and Highly Excited Dense Molecular Gas in the Most Luminous Quasar at z = 6.327, ApJ. 880(1):2 (July, 2019). 10.3847/1538-4357/ab2717.
- 221. R. Wang, Y. Shao, C. L. Carilli et al., Resolving the Interstellar Medium in the Nuclear Region of Two z = 5.78 Quasar Host Galaxies with ALMA, ApJ. 887(1):40 (Dec., 2019). 10.3847/1538-4357/ab4d4b.
- 222. T. Storchi-Bergmann and A. Schnorr-Müller, Observational constraints on the feeding of supermassive black holes, Nature Astronomy. 3, 48–61 (Jan., 2019). 10.1038/s41550-018-0611-0.
- 223. B. R. McNamara and P. E. J. Nulsen, Heating Hot Atmospheres with Active Galactic Nuclei, ARA&A. 45(1), 117–175 (Sept., 2007). 10.1146/annurev.astro.45.051806.110625.
- 224. V. Quilis, B. Moore and R. Bower, Gone with the Wind: The Origin of S0 Galaxies in Clusters, Science. 288(5471), 1617–1620 (June, 2000). 10.1126/science.288.5471.1617.
- 225. L. S. Sparke and I. Gallagher, John S., Galaxies in the Universe: An Introduction. Cambridge University Press (2007).
- 226. R. I. Davies, W. Maciejewski, E. K. S. Hicks et al., Fueling Active Galactic Nuclei. II. Spatially Resolved Molecular Inflows and Outflows, ApJ. 792(2):101 (Sept., 2014). 10.1088/0004-637X/792/2/101.
- 227. E. K. S. Hicks, R. I. Davies, W. Maciejewski et al., Fueling Active Galactic Nuclei. I. How the Global Characteristics of the Central Kiloparsec of Seyferts Differ from Quiescent Galaxies, ApJ. 768(2):107 (May, 2013). 10.1088/0004-637X/768/2/107.
- 228. L. G. Dahmer-Hahn, R. Riffel, A. Rodríguez-Ardila et al., Stellar populations in local AGNs: evidence for enhanced star formation in the inner 100 pc, MNRAS. 509(3), 4653–4668 (Jan., 2022). 10.1093/mnras/stab3382.
- 229. K. C. Chambers, G. K. Miley and W. J. M. van Breugel, 4C 41.17: A Radio Galaxy at a Redshift of 3.8, ApJ. 363, 21 (Nov., 1990). 10.1086/169316.
- 230. N. P. H. Nesvadba, G. V. Bicknell, D. Mukherjee et al., Gas, dust, and star formation in the positive AGN feedback candidate 4C 41.17 at z = 3.8, A&A. 639:L13 (July, 2020). 10.1051/0004-6361/202038269.
- 231. A. King and K. Pounds, Powerful Outflows and Feedback from Active Galactic Nuclei, ARA&A. 53, 115–154 (Aug., 2015). 10.1146/annurev-astro-082214-122316.
- 232. A. C. Fabian, Observational Evidence of Active Galactic Nuclei Feedback, ARA&A. 50, 455–489 (Sept., 2012). 10.1146/annurev-astro-081811-125521.
- 233. S. Veilleux, R. Maiolino, A. D. Bolatto et al., Cool outflows in galaxies and their implications, A&A Rev.. 28(1):2 (Apr., 2020). 10.1007/s00159-019-0121-9.
- 234. M. E. Putman, J. E. G. Peek and M. R. Joung, Gaseous Galaxy Halos, ARA&A. 50, 491–529 (Sept., 2012). 10.1146/annurev-astro-081811-125612.
- 235. P. F. Hopkins, L. Hernquist, T. J. Cox et al., A Cosmological Framework for the Co-Evolution of Quasars, Supermassive Black Holes, and Elliptical Galaxies. I. Galaxy Mergers and Quasar Activity, ApJS. 175(2), 356–389 (Apr., 2008). 10.1086/524362.
- 236. R. Morganti, J. Fogasy, Z. Paragi et al., Radio Jets Clearing the Way Through a Galaxy: Watching Feedback in Action, Science. 341(6150), 1082–1085 (Sept., 2013). 10.1126/science.1240436.
- 237. F. Tombesi, M. Meléndez, S. Veilleux et al., Wind from the black-hole accretion disk driving a molecular outflow in an active galaxy, Nat. 519(7544), 436–438 (Mar., 2015). 10.1038/nature14261.
- 238. N. Arav, K. T. Korista, T. A. Barlow et al., Radiative acceleration of gas in quasars, Nat. 376(6541), 576–578 (Aug., 1995). 10.1038/376576a0.
- 239. N. Murray, J. Chiang, S. A. Grossman et al., Accretion Disk Winds from Active Galactic Nuclei, ApJ. 451, 498 (Oct., 1995). 10.1086/176238.
- 240. N. Arav, G. Liu, X. Xu et al., Evidence that 50% of BALQSO Outflows Are Situated at Least 100 pc from the Central Source, ApJ. 857(1):60 (Apr., 2018). 10.3847/1538-4357/aab494.
- 241. N. L. Zakamska, F. Hamann, I. Pâris et al., Discovery of extreme [O III] 5007 Å outflows in high-redshift red quasars, MNRAS. 459(3), 3144–3160 (July, 2016). 10.1093/mnras/stw718.
- 242. R. L. Davies, N. M. Förster Schreiber, D. Lutz et al., From Nuclear to Circumgalactic: Zooming in on AGN-driven Outflows at z 2.2 with SINFONI, ApJ. 894(1):28 (May, 2020). 10.3847/1538-4357/ab86ad.
- 243. A. Vayner, N. L. Zakamska, R. A. Riffel et al., Powerful winds in high-redshift obscured and red quasars, MNRAS. 504(3), 4445–4459 (July, 2021). 10.1093/mnras/stab1176.
- 244. X. Xu, N. L. Zakamska, N. Arav et al., Evidence that emission and absorption outflows in quasars are related, MNRAS. 495(1), 305–320 (June, 2020). 10.1093/mnras/staa1142.
- 245. F. Hamann, N. L. Zakamska, N. Ross et al., Extremely red quasars in BOSS, MNRAS. 464(3), 3431–3463 (Jan., 2017). 10.1093/mnras/stw2387.
- 246. T. C. Fischer, C. Machuca, M. R. Diniz et al., Gemini Near Infrared Field Spectrograph Observations of the Seyfert 2 Galaxy Mrk 573: In Situ Acceleration of Ionized and Molecular Gas off Fueling Flows, ApJ. 834(1):30 (Jan., 2017). 10.3847/1538-4357/834/1/30.
- 247. D. Wylezalek, A. Schnorr Müller, N. L. Zakamska et al., Zooming into local active galactic nuclei: the power of combining SDSS-IV MaNGA with higher resolution integral field unit observations, MNRAS. 467(3), 2612–2624 (May, 2017). 10.1093/mnras/stx246.
- 248. D. Baron, H. Netzer, J. X. Prochaska et al., Direct evidence of AGN feedback: a post-starburst galaxy stripped of its gas by AGN-driven winds, MNRAS. 480(3), 3993–4016 (Nov., 2018). 10.1093/mnras/sty2113.
- 249. F. Müller-Sánchez, M. A. Prieto, E. K. S. Hicks et al., Outflows from Active Galactic Nuclei: Kinematics of the Narrow-line and Coronal-line Regions in Seyfert Galaxies, ApJ. 739(2):69 (Oct., 2011). 10.1088/0004-637X/739/2/69.
- 250. D. M. Crenshaw, T. C. Fischer, S. B. Kraemer et al., Feedback from Mass Outflows in Nearby Active Galactic Nuclei. II. Outflows in the Narrow-line Region of NGC 4151, ApJ. 799(1):83 (Jan., 2015). 10.1088/0004-637X/799/1/83.
- 251. M. Revalski, B. Meena, F. Martinez et al., Quantifying Feedback from Narrow Line Region Outflows in Nearby Active Galaxies. III. Results for the Seyfert 2 Galaxies Markarian 3, Markarian 78, and NGC 1068, ApJ. 910(2):139 (Apr., 2021). 10.3847/1538-4357/abdcad.
- 252. A. Trindade Falcão, S. B. Kraemer, T. C. Fischer et al., Hubble Space Telescope [O III] emission-line kinematics in two nearby QSO2s: a case for X-ray feedback, MNRAS. 505(2), 3054–3069 (Aug., 2021). 10.1093/mnras/stab1549.
- 253. T. Di Matteo, V. Springel and L. Hernquist, Energy input from quasars regulates the growth and activity of black holes and their host galaxies, Nat. 433(7026), 604–607 (Feb., 2005). 10.1038/nature03335.
- 254. J. Yang, F. Wang, X. Fan et al., Probing Early Supermassive Black Hole Growth and Quasar Evolution with Near-infrared Spectroscopy of 37 Reionization-era Quasars at 6.3 < z 7.64, ApJ. 923(2):262 (Dec., 2021). 10.3847/1538-4357/ac2b32.
- 255. X. Fan, Evolution of high-redshift quasars, NewAR. 50(9-10), 665–671 (Nov., 2006). 10.1016/j.newar.2006.06.077.
- 256. K. Inayoshi, E. Visbal and Z. Haiman, The Assembly of the First Massive Black Holes, ARA&A. 58, 27–97 (Aug., 2020). 10.1146/annurev-astro-120419-014455.
- 257. M. Volonteri, The Formation and Evolution of Massive Black Holes, Science. 337(6094), 544 (Aug., 2012). 10.1126/science.1220843.
- 258. A.-C. Eilers, J. F. Hennawi, F. B. Davies et al., Detecting and Characterizing Young Quasars. II. Four Quasars at z 6 with Lifetimes < 104 Yr, ApJ. 917(1):38 (Aug., 2021). 10.3847/1538-4357/ac0a76.
- 259. F. B. Davies, J. F. Hennawi and A.-C. Eilers, Time-dependent behaviour of quasar proximity zones at z 6, MNRAS. 493(1), 1330–1343 (Mar., 2020). 10.1093/mnras/stz3303.
- 260. R. A. A. Bowler, R. J. McLure, J. S. Dunlop et al., No evidence for Population III stars or a Direct Collapse Black Hole in the z = 6.6 Lyman- emitter ’CR7’, MNRAS. 469(1), 448–458 (July, 2017). 10.1093/mnras/stx839.
- 261. X. Fan, C. L. Carilli and B. Keating, Observational Constraints on Cosmic Reionization, ARA&A. 44(1), 415–462 (Sept., 2006). 10.1146/annurev.astro.44.051905.092514.
- 262. M. Schmidt, Space Distribution and Luminosity Functions of Quasi-Stellar Radio Sources, ApJ. 151, 393 (Feb., 1968). 10.1086/149446.
- 263. F. D. A. Hartwick and D. Schade, The space distribution of quasars., ARA&A. 28, 437–489 (Jan., 1990). 10.1146/annurev.aa.28.090190.002253.
- 264. W. N. Brandt and D. M. Alexander, Cosmic X-ray surveys of distant active galaxies. The demographics, physics, and ecology of growing supermassive black holes, A&A Rev.. 23:1 (Jan., 2015). 10.1007/s00159-014-0081-z.
- 265. F. Wang, J. Yang, X. Fan et al., Exploring Reionization-era Quasars. III. Discovery of 16 Quasars at 6.4 z 6.9 with DESI Legacy Imaging Surveys and the UKIRT Hemisphere Survey and Quasar Luminosity Function at z 6.7, ApJ. 884(1):30 (Oct., 2019). 10.3847/1538-4357/ab2be5.
- 266. W. N. Brandt and G. Hasinger, Deep Extragalactic X-Ray Surveys, ARA&A. 43(1), 827–859 (Sept., 2005). 10.1146/annurev.astro.43.051804.102213.
- 267. M. Labita, R. Decarli, A. Treves et al., Downsizing of supermassive black holes from the SDSS quasar survey, MNRAS. 396(3), 1537–1544 (July, 2009). 10.1111/j.1365-2966.2009.14812.x.
- 268. B. C. Kelly and A. Merloni, Mass Functions of Supermassive Black Holes across Cosmic Time, Advances in Astronomy. 2012:970858 (Jan., 2012). 10.1155/2012/970858.
- 269. R. C. Hickox and D. M. Alexander, Obscured Active Galactic Nuclei, ARA&A. 56, 625–671 (Sept., 2018). 10.1146/annurev-astro-081817-051803.
- 270. M. Mezcua, Observational evidence for intermediate-mass black holes, International Journal of Modern Physics D. 26(11):1730021 (Jan., 2017). 10.1142/S021827181730021X.
- 271. J. E. Greene, J. Strader and L. C. Ho, Intermediate-Mass Black Holes, ARA&A. 58, 257–312 (Aug., 2020). 10.1146/annurev-astro-032620-021835.
- 272. J.-H. Woo, H. Cho, E. Gallo et al., A 10,000-solar-mass black hole in the nucleus of a bulgeless dwarf galaxy, Nature Astronomy. 3, 755–759 (June, 2019). 10.1038/s41550-019-0790-3.
- 273. A. V. Filippenko and L. C. Ho, A Low-Mass Central Black Hole in the Bulgeless Seyfert 1 Galaxy NGC 4395, ApJ. 588(1), L13–L16 (May, 2003). 10.1086/375361.
- 274. A. J. Barth, L. C. Ho, R. E. Rutledge et al., POX 52: A Dwarf Seyfert 1 Galaxy with an Intermediate-Mass Black Hole, ApJ. 607(1), 90–102 (May, 2004). 10.1086/383302.
- 275. J. E. Greene and L. C. Ho, Active Galactic Nuclei with Candidate Intermediate-Mass Black Holes, ApJ. 610(2), 722–736 (Aug., 2004). 10.1086/421719.
- 276. A. E. Reines, J. E. Greene and M. Geha, Dwarf Galaxies with Optical Signatures of Active Massive Black Holes, ApJ. 775(2):116 (Oct., 2013). 10.1088/0004-637X/775/2/116.
- 277. E. C. Moran, K. Shahinyan, H. R. Sugarman et al., Black Holes At the Centers of Nearby Dwarf Galaxies, AJ. 148(6):136 (Dec., 2014). 10.1088/0004-6256/148/6/136.
- 278. D. Schaerer, T. Fragos and Y. I. Izotov, X-ray binaries as the origin of nebular He II emission in low-metallicity star-forming galaxies, A&A. 622:L10 (Feb., 2019). 10.1051/0004-6361/201935005.
- 279. P. Kaaret, H. Feng and T. P. Roberts, Ultraluminous X-Ray Sources, ARA&A. 55(1), 303–341 (Aug., 2017). 10.1146/annurev-astro-091916-055259.
- 280. N. Webb, D. Cseh, E. Lenc et al., Radio Detections During Two State Transitions of the Intermediate-Mass Black Hole HLX-1, Science. 337(6094), 554 (Aug., 2012). 10.1126/science.1222779.
- 281. M. C. Begelman, R. D. Blandford and M. J. Rees, Massive black hole binaries in active galactic nuclei, Nat. 287(5780), 307–309 (Sept., 1980). 10.1038/287307a0.
- 282. S. M. Faber, G. Wegner, D. Burstein et al., Spectroscopy and Photometry of Elliptical Galaxies. VI. Sample Selection and Data Summary, ApJS. 69, 763 (Apr., 1989). 10.1086/191327.
- 283. T. Di Matteo, J. Colberg, V. Springel et al., Direct Cosmological Simulations of the Growth of Black Holes and Galaxies, ApJ. 676(1), 33–53 (Mar., 2008). 10.1086/524921.
- 284. T. Bogdanovic, M. C. Miller and L. Blecha, Electromagnetic Counterparts to Massive Black Hole Mergers, arXiv e-prints. art. arXiv:2109.03262 (Sept., 2021).
- 285. A. De Rosa, C. Vignali, T. Bogdanović et al., The quest for dual and binary supermassive black holes: A multi-messenger view, NewAR. 86:101525 (Dec., 2019). 10.1016/j.newar.2020.101525.
- 286. P. C. Peters, Gravitational Radiation and the Motion of Two Point Masses, Physical Review. 136(4B), 1224–1232 (Nov., 1964). 10.1103/PhysRev.136.B1224.
- 287. H. L. Maness, G. B. Taylor, R. T. Zavala et al., Breaking All the Rules: The Compact Symmetric Object 0402+379, ApJ. 602(1), 123–134 (Feb., 2004). 10.1086/380919.
- 288. C. Rodriguez, G. B. Taylor, R. T. Zavala et al., A Compact Supermassive Binary Black Hole System, ApJ. 646(1), 49–60 (July, 2006). 10.1086/504825.
- 289. H.-C. Hwang, Y. Shen, N. Zakamska et al., Varstrometry for Off-nucleus and Dual Subkiloparsec AGN (VODKA): Methodology and Initial Results with Gaia DR2, ApJ. 888(2):73 (Jan., 2020). 10.3847/1538-4357/ab5c1a.
- 290. Y.-C. Chen, H.-C. Hwang, Y. Shen et al., Varstrometry for Off-nucleus and Dual Subkiloparsec AGN (VODKA): Hubble Space Telescope Discovers Double Quasars, ApJ. 925(2):162 (Feb., 2022). 10.3847/1538-4357/ac401b.
- 291. J. M. Comerford, B. F. Gerke, D. Stern et al., Kiloparsec-scale Spatial Offsets in Double-peaked Narrow-line Active Galactic Nuclei. I. Markers for Selection of Compelling Dual Active Galactic Nucleus Candidates, ApJ. 753(1):42 (July, 2012). 10.1088/0004-637X/753/1/42.
- 292. J. M. Comerford, D. Pooley, R. S. Barrows et al., Merger-driven Fueling of Active Galactic Nuclei: Six Dual and Offset AGNs Discovered with Chandra and Hubble Space Telescope Observations, ApJ. 806(2):219 (June, 2015). 10.1088/0004-637X/806/2/219.
- 293. J. Cuadra, P. J. Armitage, R. D. Alexander et al., Massive black hole binary mergers within subparsec scale gas discs, MNRAS. 393(4), 1423–1432 (Mar., 2009). 10.1111/j.1365-2966.2008.14147.x.
- 294. C. Roedig, M. Dotti, A. Sesana et al., Limiting eccentricity of subparsec massive black hole binaries surrounded by self-gravitating gas discs, MNRAS. 415(4), 3033–3041 (Aug., 2011). 10.1111/j.1365-2966.2011.18927.x.
- 295. B. D. Farris, P. Duffell, A. I. MacFadyen et al., Binary Black Hole Accretion from a Circumbinary Disk: Gas Dynamics inside the Central Cavity, ApJ. 783(2):134 (Mar., 2014). 10.1088/0004-637X/783/2/134.
- 296. J. C. Runnoe, M. Eracleous, A. Pennell et al., A large systematic search for close supermassive binary and rapidly recoiling black holes - III. Radial velocity variations, MNRAS. 468(2), 1683–1702 (June, 2017). 10.1093/mnras/stx452.
- 297. M. J. Graham, S. G. Djorgovski, D. Stern et al., A systematic search for close supermassive black hole binaries in the Catalina Real-time Transient Survey, MNRAS. 453(2), 1562–1576 (Oct., 2015). 10.1093/mnras/stv1726.
- 298. M. Charisi, I. Bartos, Z. Haiman et al., A population of short-period variable quasars from PTF as supermassive black hole binary candidates, MNRAS. 463(2), 2145–2171 (Dec., 2016). 10.1093/mnras/stw1838.
- 299. Y.-J. Chen, S. Zhai, J.-R. Liu et al., Quasar candidates with periodic variations from the Zwicky Transient Facility. I. Sample, arXiv e-prints. art. arXiv:2206.11497 (June, 2022).
- 300. R. W. Pogge and B. M. Peterson, The Intrinsic Nature of the Balwin Effect, AJ. 103, 1084 (Apr., 1992). 10.1086/116127.
- 301. S. Collier, K. Horne, I. Wanders et al., A new direct method for measuring the Hubble constant from reverberating accretion discs in active galaxies, MNRAS. 302(1), L24–L28 (Jan., 1999). 10.1046/j.1365-8711.1999.02250.x.
- 302. C. M. Rudge and D. J. Raine, Determining the cosmological parameters from the linewidths of active galaxies, MNRAS. 308(4), 1150–1158 (Oct., 1999). 10.1046/j.1365-8711.1999.02802.x.
- 303. D. C. Homan and J. F. C. Wardle, Direct Distance Measurements to Superluminal Radio Sources, ApJ. 535(2), 575–585 (June, 2000). 10.1086/308884.
- 304. M. Elvis and M. Karovska, Quasar Parallax: A Method for Determining Direct Geometrical Distances to Quasars, ApJ. 581(2), L67–L70 (Dec., 2002). 10.1086/346015.
- 305. P. Marziani and J. W. Sulentic, Highly accreting quasars: sample definition and possible cosmological implications, MNRAS. 442(2), 1211–1229 (Aug., 2014). 10.1093/mnras/stu951.
- 306. D. Watson, K. D. Denney, M. Vestergaard et al., A New Cosmological Distance Measure Using Active Galactic Nuclei, ApJ. 740(2):L49 (Oct., 2011). 10.1088/2041-8205/740/2/L49.
- 307. S. F. Hönig, D. Watson, M. Kishimoto et al., A dust-parallax distance of 19 megaparsecs to the supermassive black hole in NGC 4151, Nat. 515(7528), 528–530 (Nov., 2014). 10.1038/nature13914.
- 308. W. Yuan, M. M. Fausnaugh, S. L. Hoffmann et al., The Cepheid Distance to the Seyfert 1 Galaxy NGC 4151, ApJ. 902(1):26 (Oct., 2020). 10.3847/1538-4357/abb377.
- 309. J.-M. Wang, Y.-Y. Songsheng, Y.-R. Li et al., A parallax distance to 3C 273 through spectroastrometry and reverberation mapping, Nature Astronomy. 4, 517–525 (Jan., 2020). 10.1038/s41550-019-0979-5.
- 310. Gravity Collaboration, A. Amorim, M. Bauböck et al., A geometric distance to the supermassive black Hole of NGC 3783, A&A. 654:A85 (Oct., 2021). 10.1051/0004-6361/202141426.
- 311. M. C. Bentz, L. Ferrarese, C. A. Onken et al., A Cepheid-based Distance to the Seyfert Galaxy NGC 6814, ApJ. 885(2):161 (Nov., 2019). 10.3847/1538-4357/ab48fb.
- 312. E. Lusso, G. Risaliti, E. Nardini et al., Quasars as standard candles. III. Validation of a new sample for cosmological studies, A&A. 642:A150 (Oct., 2020). 10.1051/0004-6361/202038899.
- 313. N. Cappelluti, G. Hasinger and P. Natarajan, Exploring the High-redshift PBH-CDM Universe: Early Black Hole Seeding, the First Stars and Cosmic Radiation Backgrounds, ApJ. 926(2):205 (Feb., 2022). 10.3847/1538-4357/ac332d.