Transcoding Quality Prediction for Adaptive Video Streaming
Abstract.
In recent years, video streaming applications have proliferated the demand for Video Quality Assessment (VQA). Reduced reference video quality assessment (RR-VQA) is a category of VQA where certain features (e.g., texture, edges) of the original video are provided for quality assessment. It is a popular research area for various applications such as social media, online games, and video streaming. This paper introduces a reduced reference Transcoding Quality Prediction Model (TQPM) to determine the visual quality score of the video possibly transcoded in multiple stages. The quality is predicted using Discrete Cosine Transform (DCT)-energy-based features of the video (i.e., the video’s brightness, spatial texture information, and temporal activity) and the target bitrate representation of each transcoding stage. To do that, the problem is formulated, and a Long Short-Term Memory (LSTM)-based quality prediction model is presented. Experimental results illustrate that, on average, TQPM yields PSNR, SSIM, and VMAF predictions with an score of 0.83, 0.85, and 0.87, respectively, and Mean Absolute Error (MAE) of 1.31 dB, 1.19 dB, and 3.01, respectively, for single-stage transcoding. Furthermore, an score of 0.84, 0.86, and 0.91, respectively, and MAE of 1.32 dB, 1.33 dB, and 3.25, respectively, are observed for a two-stage transcoding scenario. Moreover, the average processing time of TQPM for 4s segments is 0.328s, making it a practical VQA method in online streaming applications.
1. Introduction
The demand for Video Quality Assessment (VQA) is growing in video streaming applications. It plays an essential role in video processing from capturing to rendering, including compression, transmission, restoration, and display (Lin and Jay Kuo, 2011). With all the available encoding options and trade-offs to consider in HTTP Adaptive Streaming (HAS) (Bentaleb et al., 2019), having a lightweight, and reliable VQA method is crucial. According to the degree of information available for the reference video signals, VQA is classified into full reference (FR), reduced reference (RR), and no reference (NR) methods. NR-VQA methods are “blind”, where the original video content is not used for quality assessment, leading to an unreliable VQA (Lin and Jay Kuo, 2011). On the other hand, since RR-VQA methods use (i) less overhead data compared to FR-based VQA approaches and (ii) are more reliable than NR-based VQA methods, they are employed in real-time scenarios (Dost et al., 2022).
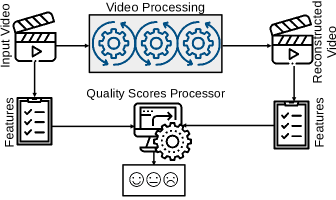
The workflow of the state-of-the-art RR-VQA methods is shown in Figure 1. The characteristic features of the original video and the reconstructed video (e.g., pixels, relative entropy or entropy difference (Chikkerur et al., 2011; Wang et al., 2013), frequency domain features like DCT (Wang et al., 2009)) after any arbitrary video processing process are extracted. The quality score processor (mostly ML-based implementations in the literature) combines these features to predict the resultant video quality (Dost et al., 2022). Since Peak Signal to Noise Ratio (PSNR) remains the de facto industry standard for video quality evaluation, many RR-VQA methods are developed to evaluate it (Narwaria et al., 2012; Pinson and Wolf, 2003). Furthermore, there are methods that predict the Structural Similarity Index (SSIM) (Wang and Bovik, 2006; Wang and Li, 2011), Spatio-temporal RR Entropic Differences (STRRED) (Wang and Simoncelli, 2005), and Spatial RR Entropic Differences (SRRED) (Soundararajan and Bovik, 2013) metrics. However, the metrics mentioned above have limitations, such as neglecting the temporal nature of compression artifacts (Liu et al., 2013). To bridge these gaps, Video Multi-method Assessment Fusion (VMAF) was introduced (Li et al., 2018). VMAF was proposed as an FR-VQA model that combines quality-aware features to predict perceptual quality. For that, it incorporates human vision modeling with machine learning and offers an acceptable prediction of the video QoE (Liu et al., 2013). VMAF is an optimization criterion for better encoding decisions in different applications. As an example, Orduna et al. (Orduna et al., 2020) prove that VMAF can be used without any specific training or adjustments to obtain the quality of 360-degree virtual reality (VR) sequences perceived by users. Zadtootaghaj et al. (Zadtootaghaj et al., 2018) use VMAF to analyze the video quality of online video gaming services and calculate the minimum encoding bitrate to reduce the required bandwidth of different streaming games significantly. Sakaushi et al. (Sakaushi et al., 2017) present a video surveillance system where VMAF is used to measure how the quality of the video is degraded for different bitrates. In (Menon et al., 2022b), optimized bitrate-resolution pairs that maximize VMAF are selected for the bitrate ladder. In (Menon et al., 2022c, 2023c), perceptually-aware optimized bitrate-resolution pairs that maximize the visual quality and compression efficiency are selected for the bitrate ladder. Additionally, in (Menon et al., 2022a), the optimized framerate that yields the highest VMAF is selected for every target bitrate in the ladder. Hence, visual quality prediction enables the server to choose the optimized encoding parameters for the bitrate ladder (Menon et al., 2023b).
Contributions: This paper proposes a reduced-reference transcoding quality prediction model (TQPM) for video streaming applications. To the best of our knowledge, this is the first work proposed to predict VMAF for multi-stage transcoding, especially in video streaming applications, where the video segment is subjected to multiple stages of transcoding before being transcoded to the target bitrate representation. To do that, first, DCT-energy-based features are extracted from the input video segment, and the information of the transcoding pipeline (i.e., target bitrate representation of encoder in each stage) is used as the reduced reference for VMAF prediction. Next, feature extraction is carried out only for the input video segment. This method contrasts the state-of-the-art RR-VQA methods where feature extraction is carried out for the input and the output video segments from the transcoding system. The prediction performance of the proposed model is validated using Apple HTTP Live Streaming (HLS) bitrate ladder111https://developer.apple.com/documentation/http_live_streaming/ hls_authoring_specification_for_apple_devices, last access: Apr 02, 2023. transcoding using the x265222https://www.videolan.org/developers/x265.html, last access: Apr 02, 2023. HEVC (Sullivan et al., 2012) open source encoder.
Paper outline: Section 2 explains the M-stage transcoding model formulated in this paper, while Section 3 discusses the architecture of TQPM. Section 4 illustrates the evaluation of the TQPM performance. Finally, Section 5 concludes the paper.
2. M-stage transcoding model
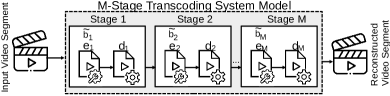
Recently, video transcoding has been considered a prevalent solution for reconstructing video sequences at in-network servers (deployed at cloud or edge) in latency-sensitive video streaming applications (Farahani, 2021; Farahani et al., 2022a, c, b). Hence, in this paper, a generalized M-stage transcoding model for HAS as depicted in Figure 2 is proposed, targeting the following scenarios:
-
(1)
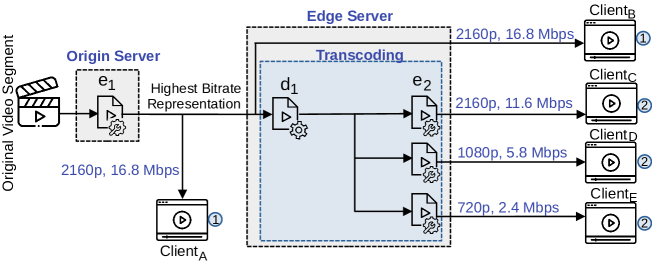
Single-stage transcoding: This is the scenario where the user receives the bitstream produced by the source server. As shown in Figure 3, clients A and B receive the bitrate representation generated at the origin server. Here, VQA can be accomplished at the origin server, as the original and reconstructed video segments are available at the origin server. However, in the state-of-the-art VQA methods, the encoding process must be complete to determine the visual quality score. Moreover, the time taken for feature extraction () of the input and reconstructed video segments adds to the latency.
-
(2)
Two-stage transcoding: In these applications, a higher bitrate representation already available in the edge server is transcoded to a lower bitrate representation requested by the user. As shown in Figure 3, clients C, D, and E receive 11.6 Mbps, 5.8 Mbps, and 2.4 Mbps representations. The edge server transcodes the video segment from the 16.8 Mbps representations to the requested representations. In this manner, the response delay and the backhaul traffic between the origin and the edge servers is expected to be reduced (Farahani, 2021). State-of-the-art VQA methods cannot be used in this scenario as (i) the original input video segment is not available as the reference at the destination (client) and (ii) the final reconstructed video segment is not available at the source (origin server). Assuming a hypothetical scenario where the original and reconstructed video segments are available together at the source or destination, the total processing time would include two encoding and decoding steps and feature extraction of the original and reconstructed segments.
There shall be scenarios of three-stage transcoding that involve two edge servers. As depicted in Figure 2, the generalized M-stage transcoding model for HAS consists of a series of M encoders and M decoders in a chain. M=1 transcoding corresponds to the single-stage transcoding while M=2 transcoding corresponds to the two-stage transcoding. As explained, RR-VQA poses numerous problems while deployed in multi-stage transcoding applications. First, the total transcoding latency to compute video quality () using the input and the final reconstructed video segments is very high. This is because of the encoding and decoding times in the M-stage transcoding process (M encoding and M decoding processes), plus the time taken for feature extraction () of the input and reconstructed video segments add to the latency. The total transcoding latency is formulated in Eq. (1), where and represents the time taken to encode and decode at the transcoding stage, respectively.
| (1) |
Second, determining VMAF is cumbersome in most video streaming applications where (i) the original input video segment is not available as the reference at the destination; (ii) the final reconstructed video segment is not available at the source; (iii) slow VMAF decision-making is not acceptable for online latency-sensitive services. VQA at source by predicting VMAF using the input video segment characteristics and the transcoding system characteristics solves the abovementioned problems.
3. TQPM Architecture
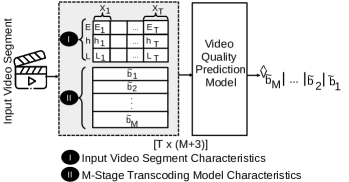
The TQPM architecture is shown in Figure 4, which comprises three steps:
Selecting low-complexity features to characterize the input video segment is critical to utilize lightweight prediction models for quality prediction. High-complexity features would require heavier models (in terms of model size and inference time), contributing to prediction latency. Extracting state-of-the-art Spatial Information (SI) and Temporal Information (TI) features are computationally intensive tasks and do not correlate well with the transcoded video quality (Menon et al., 2022d). This paper uses a lightweight and low-latency feature extraction from input video segments as explained in Section 3.1. The extracted features, along with the encoding target bitrate representations for each stage of the transcoding process, i.e., , ,.., , are employed to predict the visual quality, in terms of PSNR, SSIM, and VMAF, as discussed in Section 3.2.
3.1. Input Video Segment Characterization
Three DCT-energy-based features extracted by the Video Complexity Analyzer (VCA) (Menon et al., 2022d) open-source software, i.e., (i) the average texture energy , (ii) the average temporal energy , and (iii) the average luminescence are used as the reduced reference for each video segment. These features are based on the luma channel of the video segment. Chroma channels are not considered in the proposed solution since the rate control of most of the state-of-the-art encoders does not consider them. Furthermore, VQA metrics like VMAF emphasize the luma channel more than the chroma channels. The features are based on our previous work (Menon et al., 2022d) and are included here to have the paper self-contained. Firstly, the texture of every non-overlapping block in each frame is calculated using Eq. (2):
| (2) |
where pixels is the size of the block, and is the DCT component when , and 0 otherwise (Harikrishnan et al., 2017). The texture is averaged to determine the spatial energy feature per frame, i.e., , as shown in Eq. (3):
| (3) |
where represents the number of blocks in the frame (Menon et al., 2021). Furthermore, the block-wise sum of absolute difference (SAD) of the texture energy of each frame compared to its previous frame is computed and then averaged per frame to obtain the temporal energy feature per frame, (i.e., ) illustrated in Eq. (4):
| (4) |
The luminescence of non-overlapping blocks of each frame is defined as:
| (5) |
where is the component in the DCT calculation. Moreover, the block-wise luminescence is averaged per frame denoted as as shown in Eq. (6).
| (6) |
The video segment is divided into chunks with a fixed number of frames (i.e., ) in each chunk. The averages of the , , and features of each chunk are computed to obtain the reduced reference representation of the input video segment, expressed as:
| (7) |
where, is the feature set of every chunk, represented as :
| (8) |
3.2. Video Quality Prediction
For the sake of simplicity, the settings of the encoders in the M-stage transcoding process, except the target bitrate-resolution pair, are assumed identical (Menon et al., 2023a). The resolutions corresponding to the target bitrates in the bitrate ladder are also assumed to be fixed. Therefore, the transcoding model can be characterized as follows:
| (9) |
where represents the target bitrate of the encoder (cf. Fig. 2). Note that is appended to , which is determined during the input video segment characterization phase, to obtain:
| (10) |
The predicted quality can be presented as:
| (11) |
LSTM models are typically used in time series prediction applications and can mitigate essential issues in long-term prediction, such as vanishing or exploding gradients (Yu et al., 2019). Thus, an LSTM-based prediction model (Hochreiter and Schmidhuber, 1997) is used in this work. The described features are input to the model (Hochreiter and Schmidhuber, 1997) as a vector of dimension , where denotes the number of chunks in the video segment. More specifically, the feature sequences in the series are input to the LSTM model, which predicts visual quality for the corresponding input video segment and chain of encoders in the transcoding process.
The upper bound for the acceptable deviation from the ground truth quality is considered to be one Just Noticeable Difference (JND),
| (12) |
where and are the predicted and the ground truth quality, respectively. In this paper, the average target JND is considered as six VMAF points333https://streaminglearningcenter.com/codecs/finding-the-just-noticeable-difference-with-netflix-vmaf.html, last access: Apr 02, 2023. based on current industry practices.
4. Evaluation
This section first explains the evaluation setup and then presents the experimental results.

| PSNR prediction | SSIM prediction | VMAF prediction | ||||||||||||
|---|---|---|---|---|---|---|---|---|---|---|---|---|---|---|
| M=1 | M=2 | M=1 | M=2 | M=1 | M=2 | |||||||||
| MAE | MAE | MAE | MAE | MAE | MAE | |||||||||
| 360p | 0.145 Mbps | 0.82 | 1.20 dB | - | - | 0.89 | 1.08 dB | - | - | 0.87 | 3.35 | - | - | |
| 432p | 0.300 Mbps | 0.83 | 1.19 dB | 0.84 | 1.37 dB | 0.89 | 1.14 dB | 0.87 | 1.34 dB | 0.87 | 3.51 | 0.76 | 3.38 | |
| 540p | 0.600 Mbps | 0.83 | 1.19 dB | 0.85 | 1.28 dB | 0.88 | 1.18 dB | 0.85 | 1.21 dB | 0.90 | 4.05 | 0.84 | 3.55 | |
| 540p | 0.900 Mbps | 0.83 | 1.19 dB | 0.83 | 1.22 dB | 0.86 | 1.17 dB | 0.86 | 1.11 dB | 0.90 | 3.83 | 0.89 | 3.53 | |
| 540p | 1.600 Mbps | 0.82 | 1.22 dB | 0.82 | 1.15 dB | 0.84 | 1.19 dB | 0.85 | 1.38 dB | 0.90 | 3.45 | 0.90 | 3.44 | |
| 720p | 2.400 Mbps | 0.83 | 1.26 dB | 0.83 | 1.28 dB | 0.82 | 1.18 dB | 0.83 | 1.57 dB | 0.88 | 2.88 | 0.91 | 3.45 | |
| 720p | 3.400 Mbps | 0.81 | 1.30 dB | 0.85 | 1.23 dB | 0.83 | 1.20 dB | 0.82 | 1.35 dB | 0.84 | 2.89 | 0.94 | 3.03 | |
| 1080p | 4.500 Mbps | 0.84 | 1.28 dB | 0.83 | 1.28 dB | 0.88 | 1.23 dB | 0.82 | 1.34 dB | 0.87 | 2.28 | 0.95 | 3.03 | |
| 1080p | 5.800 Mbps | 0.86 | 1.31 dB | 0.87 | 1.42 dB | 0.83 | 1.29 dB | 0.86 | 1.30 dB | 0.87 | 2.23 | 0.95 | 3.34 | |
| 1440p | 8.100 Mbps | 0.84 | 1.39 dB | 0.81 | 1.41 dB | 0.87 | 1.29 dB | 0.87 | 1.32 dB | 0.85 | 2.73 | 0.96 | 2.96 | |
| 2160p | 11.600 Mbps | 0.79 | 1.50 dB | 0.82 | 1.31 dB | 0.88 | 1.17 dB | 0.84 | 1.32 dB | 0.82 | 2.58 | 0.96 | 3.02 | |
| 2160p | 16.800 Mbps | 0.84 | 1.49 dB | 0.79 | 1.26 dB | 0.88 | 1.19 dB | 0.86 | 1.35 dB | 0.86 | 2.38 | 0.96 | 2.99 | |
| Average | 0.83 | 1.31 dB | 0.84 | 1.32 dB | 0.85 | 1.19 dB | 0.86 | 1.33 dB | 0.87 | 3.01 | 0.91 | 3.25 | ||
4.1. Evaluation Setup
In this paper, video sequences from JVET (Boyce et al., 2018), MCML (Cheon and Lee, 2018), SJTU (Song et al., 2013), Berlin (Bross et al., 2020), UVG (Mercat et al., 2020), BVI (Mackin et al., 2015) datasets are used. The sequences are encoded at 30 fps using x265 v3.5 with the ultrafast preset using the Video Buffering Verifier (VBV) rate control mode on a dual-processor server with Intel Xeon Gold 5218R (80 cores, frequency at 2.10 GHz). The segment length is set as four seconds. 80% of the five hundred videos considered are used as the training dataset, and the remaining 20% is used as the test dataset. The bitrate representations considered in the experiments () used as the target bitrate of encoding in each transcoding stage () are specified in the Apple HLS authoring specifications. The , , and features are extracted using the VCA v2.0444https://vca.itec.aau.at, last access: Apr 02, 2023. open-source video complexity analyzer (Menon et al., 2022d) run in eight CPU threads, with (cf. Eq. 2) as 32. is set as 15, i.e., the video segment is divided into eight chunks (T=8).
Hyperparameter tuning is performed on the LSTM model to obtain the maximum prediction performance (Yu et al., 2019). The number of LSTM cells is set to 50, and the model is trained for 100 epochs with a learning rate of with the Adam optimizer (Kingma and Ba, 2015). The loss function used to train the LSTM model is the mean absolute error (MAE). The resulting quality and the predicted in terms of PSNR, SSIM, and VMAF (Li et al., 2018) are compared for each test sequence for M=1 (single-stage) and M=2 (two-stage) transcoding. Since the content is assumed to be displayed in the highest resolution (i.e., 2160p), the transcoded content is scaled (bi-cubic) to 2160p resolution to determine the visual quality.
4.2. Experimental Results
In the first experiment, TQPM’s processing time (i.e., ) is compared to the total transcoding latency (cf. Eq.1) in state-of-the-art RR-VQA approaches. The average for M=1 and M=2 are observed as 1.92s and 3.78s, respectively. The average time taken for feature extraction ( of a 4s segment is 0.323s. Furthermore, the average inference time of the LSTM model is 5 ms. Hence, the average processing time of TQPM for a 4s segment is 0.328s. Thus, TQPM has a significantly lower processing time than the state-of-the-art RR-VQA approaches.
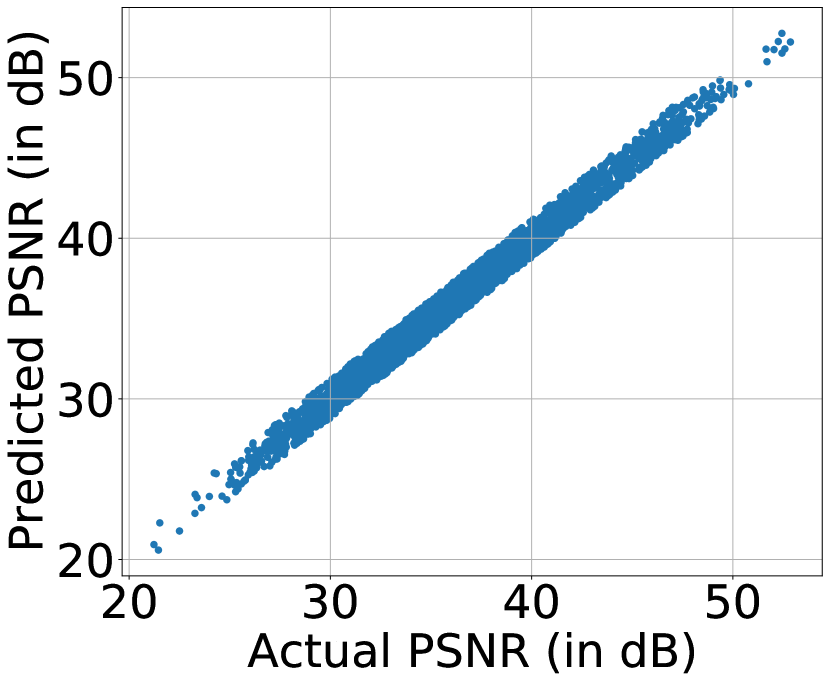
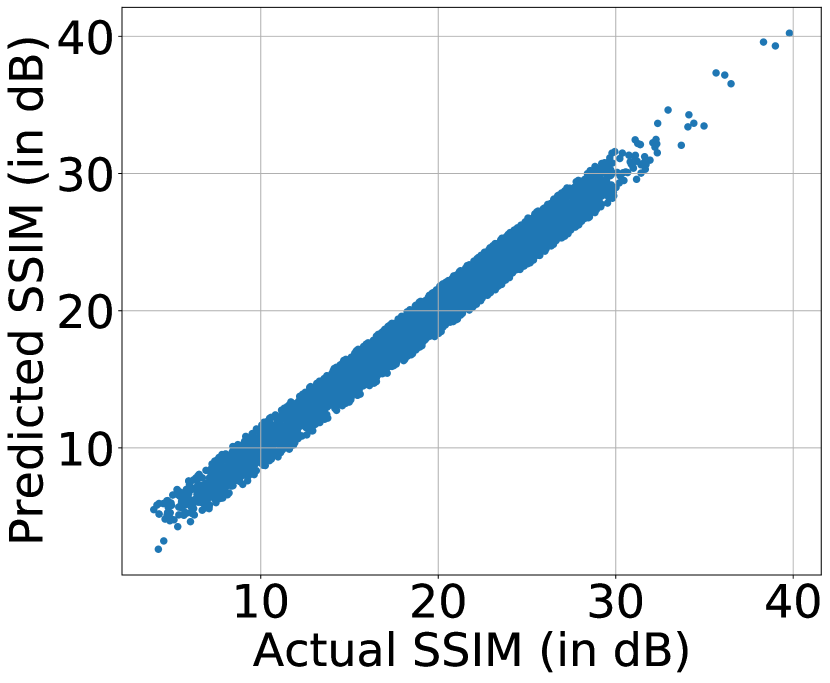
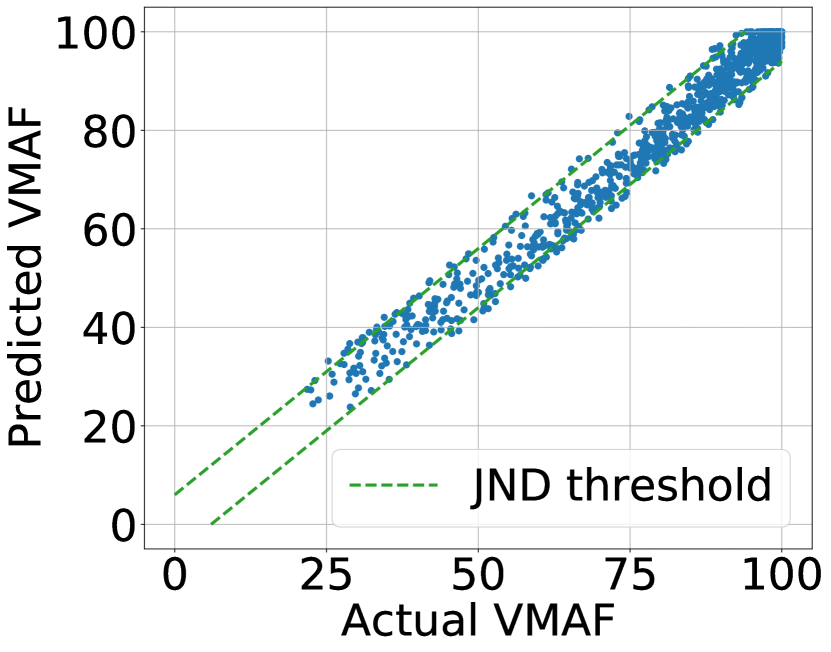
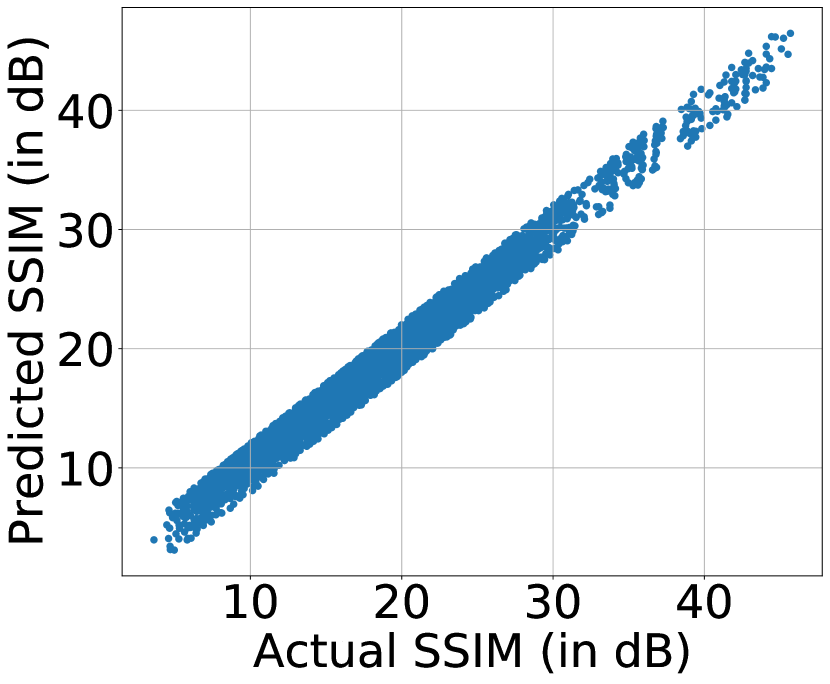
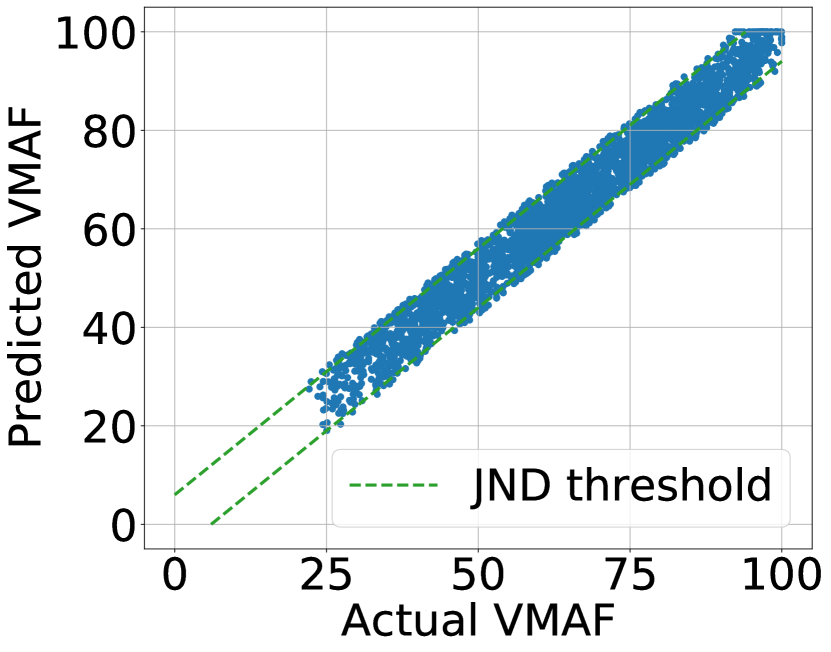
The second experiment assesses the correlation between the predicted to actual quality score for M=1 and M=2 transcoding. As illustrated in Figures 5(a), 5(b), and 5(c) and Figures 5(d), 5(e), and 5(f), there is a strong correlation between the predicted to the actual PSNR, SSIM, and VMAF scores, respectively (e.g., the average scores of VMAF prediction for single-stage and two-stage transcoding are 0.87 and 0.91, respectively). Furthermore, the prediction errors are less than the acceptable threshold of one JND (i.e., six VMAF points, which shows TQPM works with sufficient accuracy.
In the final experiment, the prediction performance of TQPM for the representations considered in this paper is investigated using the Mean Absolute Error (MAE) for M=1 and M=2 transcoding. As shown in Table 1, the average MAE for VMAF prediction in M=1 and M=2 transcoding are 3.01 and 3.25, respectively. The results of M=2 correspond to the average visual quality prediction accuracy of transcoding from bitrate representation to the possible lower bitrate representations in the bitrate ladder. Please note that since is the lowest bitrate representation in the bitrate ladder, a scenario corresponding to does not exist. The scores for M=2 are observed to increase as increases. This is because there is a higher amount of training data (transcoding to lower bitrate representations) as increases.
5. Conclusions
This paper proposed TQPM, an online transcoding quality prediction model for video streaming applications. The proposed LSTM-based model uses DCT-energy-based features as reduced reference to characterize the input video segment, which is used to predict the visual quality of an M-stage transcoding process. The performance of TQPM is validated by the Apple HLS bitrate ladder encoding and transcoding using the x265 open-source HEVC encoder. On average, for single-stage transcoding, TQPM predicts PSNR, SSIM, and VMAF with an MAE of 1.31 dB, 1.19 dB, and 3.01, respectively. Furthermore, PSNR, SSIM, and VMAF are predicted for two-stage transcoding with an average MAE of 1.32 dB, 1.33 dB, and 3.25, respectively.
In this paper, trans-sizing and trans-rating are considered as transcoding, i.e., the encoder/codec used for the bitrate ladder representations is assumed to be the same. In the future, transcoding between bitrate ladder representations of various codecs shall be investigated. Another future direction is defining a decision-making component based on the proposed model in an end-to-end live streaming system.
6. Acknowledgment
The financial support of the Austrian Federal Ministry for Digital and Economic Affairs, the National Foundation for Research, Technology and Development, and the Christian Doppler Research Association is gratefully acknowledged. Christian Doppler Laboratory ATHENA: https://athena.itec.aau.at/.
References
- (1)
- Bentaleb et al. (2019) A. Bentaleb, B. Taani, A. C. Begen, C. Timmerer, and R. Zimmermann. 2019. A Survey on Bitrate Adaptation Schemes for Streaming Media Over HTTP. IEEE Communications Surveys Tutorials 21, 1 (2019), 562–585.
- Boyce et al. (2018) Jill Boyce, Karsten Suehring, Xiang Li, and Vadim Seregin. 2018. JVET-J1010: JVET common test conditions and software reference configurations.
- Bross et al. (2020) B. Bross, H. Kirchhoffer, C. Bartnik, M. Palkow, and D. Marpe. 2020. AHG4 Multiformat Berlin Test Sequences. In JVET-Q0791.
- Cheon and Lee (2018) Manri Cheon and Jong-Seok Lee. 2018. Subjective and Objective Quality Assessment of Compressed 4K UHD Videos for Immersive Experience. IEEE Transactions on Circuits and Systems for Video Technology 28, 7 (2018), 1467–1480. https://doi.org/10.1109/TCSVT.2017.2683504
- Chikkerur et al. (2011) Shyamprasad Chikkerur, Vijay Sundaram, Martin Reisslein, and Lina Karam. 2011. Objective Video Quality Assessment Methods: A Classification, Review, and Performance Comparison. IEEE Transactions on Broadcasting 57, 2 (2011), 165–182. https://doi.org/10.1109/TBC.2011.2104671
- Dost et al. (2022) Shahi Dost, Faryal Saud, Maham Shabbir, Muhammad Gufran Khan, Muhammad Shahid, and Benny Lovstrom. 2022. Reduced reference image and video quality assessments: review of methods. EURASIP Journal on Image and Video Processing (2022). https://doi.org/10.1186/s13640-021-00578-y
- Farahani (2021) Reza Farahani. 2021. CDN and SDN support and player interaction for HTTP adaptive video streaming. In Proceedings of the 12th ACM Multimedia Systems Conference. 398–402.
- Farahani et al. (2022a) Reza Farahani, Hadi Amirpour, Farzad Tashtarian, Abdelhak Bentaleb, Christian Timmerer, Hermann Hellwagner, and Roger Zimmermann. 2022a. RICHTER: hybrid P2P-CDN architecture for low latency live video streaming. In Proceedings of the 1st Mile-High Video Conference. 87–88.
- Farahani et al. (2022b) Reza Farahani, Mohammad Shojafar, Christian Timmerer, Farzad Tashtarian, Mohammad Ghanbari, and Hermann Hellwagner. 2022b. ARARAT: A Collaborative Edge-Assisted Framework for HTTP Adaptive Video Streaming. IEEE Transactions on Network and Service Management (2022).
- Farahani et al. (2022c) Reza Farahani, Farzad Tashtarian, Christian Timmerer, Mohammad Ghanbar, and Hermann Hellwagner. 2022c. LEADER: A Collaborative Edge-and SDN-Assisted Framework for HTTP Adaptive Video Streaming. In ICC 2022-IEEE International Conference on Communications. IEEE, 745–750.
- Harikrishnan et al. (2017) NB Harikrishnan, Vignesh V Menon, Manoj S Nair, and Gayathri Narayanan. 2017. Comparative evaluation of image compression techniques. In 2017 International Conference on Algorithms, Methodology, Models and Applications in Emerging Technologies (ICAMMAET). IEEE, 1–4.
- Hochreiter and Schmidhuber (1997) Sepp Hochreiter and Jürgen Schmidhuber. 1997. Long Short-Term Memory. Neural Comput. 9, 8 (Nov. 1997), 1735–1780. https://doi.org/10.1162/neco.1997.9.8.1735
- Kingma and Ba (2015) Diederik P. Kingma and Jimmy Ba. 2015. Adam: A Method for Stochastic Optimization. In 3rd International Conference on Learning Representations, ICLR 2015, San Diego, CA, USA, May 7-9, 2015.
- Li et al. (2018) Zhi Li et al. 2018. VMAF: The journey continues. Netflix Technology Blog 25 (2018).
- Lin and Jay Kuo (2011) Weisi Lin and C.-C. Jay Kuo. 2011. Perceptual visual quality metrics: A survey. Journal of Visual Communication and Image Representation 22, 4 (2011), 297–312. https://doi.org/10.1016/j.jvcir.2011.01.005
- Liu et al. (2013) Tsung-Jung Liu, Yu-Chieh Lin, Weisi Lin, and C.-C. Jay Kuo. 2013. Visual quality assessment: recent developments, coding applications and future trends. APSIPA Transactions on Signal and Information Processing 2 (2013), e4. https://doi.org/10.1017/ATSIP.2013.5
- Mackin et al. (2015) Alex Mackin, Fan Zhang, and David R. Bull. 2015. A study of subjective video quality at various frame rates. In 2015 IEEE International Conference on Image Processing (ICIP). 3407–3411. https://doi.org/10.1109/ICIP.2015.7351436
- Menon et al. (2022a) Vignesh V Menon, Hadi Amirpour, Mohammad Ghanbari, and Christian Timmerer. 2022a. CODA: Content-aware Frame Dropping Algorithm for High Frame-rate Video Streaming. In 2022 Data Compression Conference (DCC). 475–475. https://doi.org/10.1109/DCC52660.2022.00086
- Menon et al. (2022b) Vignesh V Menon, Hadi Amirpour, Mohammad Ghanbari, and Christian Timmerer. 2022b. OPTE: Online Per-Title Encoding for Live Video Streaming. In ICASSP 2022 - 2022 IEEE International Conference on Acoustics, Speech and Signal Processing (ICASSP). 1865–1869. https://doi.org/10.1109/ICASSP43922.2022.9746745
- Menon et al. (2022c) Vignesh V Menon, Hadi Amirpour, Mohammad Ghanbari, and Christian Timmerer. 2022c. Perceptually-Aware Per-Title Encoding for Adaptive Video Streaming. In 2022 IEEE International Conference on Multimedia and Expo (ICME). IEEE Computer Society, Los Alamitos, CA, USA, 1–6. https://doi.org/10.1109/ICME52920.2022.9859744
- Menon et al. (2023a) Vignesh V Menon, Hadi Amirpour, Mohammad Ghanbari, and Christian Timmerer. 2023a. EMES: Efficient Multi-Encoding Schemes for HEVC-Based Adaptive Bitrate Streaming. ACM Trans. Multimedia Comput. Commun. Appl. 19, 3s, Article 129 (mar 2023), 20 pages. https://doi.org/10.1145/3575659
- Menon et al. (2021) Vignesh V Menon, Hadi Amirpour, Christian Timmerer, and Mohammad Ghanbari. 2021. INCEPT: Intra CU Depth Prediction for HEVC. In 2021 IEEE 23rd International Workshop on Multimedia Signal Processing (MMSP). 1–6. https://doi.org/10.1109/MMSP53017.2021.9733517
- Menon et al. (2022d) Vignesh V Menon, Christian Feldmann, Hadi Amirpour, Mohammad Ghanbari, and Christian Timmerer. 2022d. VCA: Video Complexity Analyzer. In Proceedings of the 13th ACM Multimedia Systems Conference (Athlone, Ireland) (MMSys ’22). Association for Computing Machinery, New York, NY, USA, 259–264. https://doi.org/10.1145/3524273.3532896
- Menon et al. (2023b) Vignesh V Menon, Prajit T Rajendran, Reza Farahani, Klaus Schoeffmann, and Christian Timmerer. 2023b. Video Quality Assessment with Texture Information Fusion for Streaming Applications. arXiv:2302.14465 [cs.MM]
- Menon et al. (2023c) Vignesh V Menon, Prajit T Rajendran, Christian Feldmann, Klaus Schoeffmann, Mohammad Ghanbari, and Christian Timmerer. 2023c. JND-aware Two-pass Per-title Encoding Scheme for Adaptive Live Streaming. (March 2023). https://doi.org/10.36227/techrxiv.22256704.v1
- Mercat et al. (2020) Alexandre Mercat, Marko Viitanen, and Jarno Vanne. 2020. UVG Dataset: 50/120fps 4K Sequences for Video Codec Analysis and Development. Association for Computing Machinery, New York, NY, USA, 297–302. https://doi.org/10.1145/3339825.3394937
- Narwaria et al. (2012) Manish Narwaria, Weisi Lin, Ian Vince McLoughlin, Sabu Emmanuel, and Liang-Tien Chia. 2012. Fourier Transform-Based Scalable Image Quality Measure. IEEE Transactions on Image Processing 21, 8 (2012), 3364–3377. https://doi.org/10.1109/TIP.2012.2197010
- Orduna et al. (2020) Marta Orduna, César Díaz, Lara Muñoz, Pablo Pérez, Ignacio Benito, and Narciso García. 2020. Video Multimethod Assessment Fusion (VMAF) on 360VR Contents. IEEE Transactions on Consumer Electronics 66, 1 (2020), 22–31. https://doi.org/10.1109/TCE.2019.2957987
- Pinson and Wolf (2003) Margaret H. Pinson and Stephen Wolf. 2003. An objective method for combining multiple subjective data sets. In Visual Communications and Image Processing 2003. 583–592. https://doi.org/10.1117/12.509909
- Sakaushi et al. (2017) Airi Sakaushi, Kenji Kanai, Jiro Katto, and Toshitaka Tsuda. 2017. Image quality evaluations of image enhancement under various encoding rates for video surveillance system. In 2017 IEEE 6th Global Conference on Consumer Electronics (GCCE). 1–2. https://doi.org/10.1109/GCCE.2017.8229463
- Song et al. (2013) Li Song, Xun Tang, Wei Zhang, Xiaokang Yang, and Pingjian Xia. 2013. The SJTU 4K Video Sequence Dataset. Fifth International Workshop on Quality of Multimedia Experience (QoMEX2013) (July 2013).
- Soundararajan and Bovik (2013) Rajiv Soundararajan and Alan C. Bovik. 2013. Video Quality Assessment by Reduced Reference Spatio-Temporal Entropic Differencing. IEEE Transactions on Circuits and Systems for Video Technology 23, 4 (2013), 684–694. https://doi.org/10.1109/TCSVT.2012.2214933
- Sullivan et al. (2012) G. J. Sullivan, J. R. Ohm, W. J. Han, and T. Wiegand. 2012. Overview of the high efficiency video coding (HEVC) standard. IEEE Transactions on circuits and systems for video technology 22, 12 (2012), 1649–1668.
- Wang et al. (2013) Shiqi Wang, Xiang Zhang, Siwei Ma, and Wen Gao. 2013. Reduced reference image quality assessment using entropy of primitives. In 2013 Picture Coding Symposium (PCS). 193–196. https://doi.org/10.1109/PCS.2013.6737716
- Wang et al. (2009) Xu Wang, Gangyi Jiang, and Mei Yu. 2009. Reduced Reference Image Quality Assessment Based on Contourlet Domain and Natural Image Statistics. In 2009 Fifth International Conference on Image and Graphics. 45–50. https://doi.org/10.1109/ICIG.2009.44
- Wang and Bovik (2006) Zhou Wang and Alan C. Bovik. 2006. Modern Image Quality Assessment. Synthesis Lectures on Image, Video, and Multimedia Processing 2, 1 (2006), 1–156. https://doi.org/10.2200/S00010ED1V01Y200508IVM003
- Wang and Li (2011) Zhou Wang and Qiang Li. 2011. Information Content Weighting for Perceptual Image Quality Assessment. IEEE Transactions on Image Processing 20, 5 (2011), 1185–1198. https://doi.org/10.1109/TIP.2010.2092435
- Wang and Simoncelli (2005) Zhou Wang and Eero Simoncelli. 2005. Reduce-reference image quality assessment using a wavelet-domain natural image statistic model. Proceedings of SPIE - The International Society for Optical Engineering 5666 (03 2005). https://doi.org/10.1117/12.597306
- Yu et al. (2019) Yong Yu, Xiaosheng Si, Changhua Hu, and Jianxun Zhang. 2019. A Review of Recurrent Neural Networks: LSTM Cells and Network Architectures. Neural Computation 31, 7 (07 2019), 1235–1270. https://doi.org/10.1162/neco_a_01199
- Zadtootaghaj et al. (2018) Saman Zadtootaghaj, Steven Schmidt, Nabajeet Barman, Sebastian Möller, and Maria G. Martini. 2018. A Classification of Video Games based on Game Characteristics linked to Video Coding Complexity. In 2018 16th Annual Workshop on Network and Systems Support for Games (NetGames). 1–6. https://doi.org/10.1109/NetGames.2018.8463434