ZEBRA: Z-order Curve-based Event Retrieval Approach to Efficiently Explore Automotive Data
Abstract
Evaluating the performance of software for automated vehicles is predominantly driven by data collected from the real world. While professional test drivers are supported with technical means to semi-automatically annotate driving maneuvers to allow better event identification, simple data loggers in large vehicle fleets typically lack automatic and detailed event classification and hence, extra effort is needed when post-processing such data. Yet, the data quality from professional test drivers is apparently higher than the one from large fleets where labels are missing, but the non-annotated data set from large vehicle fleets is much more representative for typical, realistic driving scenarios to be handled by automated vehicles. However, while growing the data from large fleets is relatively simple, adding valuable annotations during post-processing has become increasingly expensive. In this paper, we leverage Z-order space-filling curves to systematically reduce data dimensionality while preserving domain-specific data properties, which allows us to explore even large-scale field data sets to spot interesting events orders of magnitude faster than processing time-series data directly. Furthermore, the proposed concept is based on an analytical approach, which preserves explainability for the identified events.
Index Terms:
space-filling curve, Morton-order, Z-order curve, event detectionI Introduction
Since Advanced Driver Assistance Systems (ADAS) and Automated Driving Systems (ADS) of modern vehicles highly interact with their environment, researchers and engineers face challenges in handling the vast space of possible scenarios during the development and testing of such systems. To better cope with the sheer unbounded unstructuredness during the development phase, researchers and engineers are exploring the proper use of Artificial Intelligence (AI)/Machine Learning (ML)-based components to improve perception systems, for example, for pedestrian detection [1]. The performance of these components, though, depends on the quality and diversity of the data, which was used to train such ML-based components. Moreover, the data set shall ideally reflect relevant and important aspects of the intended Operational Design Domain (ODD). Hence, start-up companies as well as legacy automotive Original Equipment Manufacturers (OEMs) began in recent years to collect enormous amounts of data to systematically train and test ADAS/ADS. This growing amount of data is partially annotated, fueling virtual environments for closed-loop testing, or to infer information about typical traffic scenarios to deal with on average.
I-A Problem Domain & Motivation
Data quality and data diversity are primary drivers to determine and improve the performance of AI/ML-based software. However, just growing existing data sets into barely manageable data lakes is an insufficient response to meet quality criteria for a safer engineering and testing of AI/ML-based software. Instead, large-scale properly annotated data sets or efficient filtering methods are required to support event queries such as “retrieve data samples from a specific time of the year, in a specific region, and containing certain traffic participants that perform a lane change”. Annotating data to realize this query is an expensive operation that demands enormous effort and is potentially prone to biases. A more efficient way to retrieve events from data sets is to initially annotate data samples automatically, which, however, requires knowledge of relevant clusters. Updating the set of relevant clusters to include new participants such as e-scooters for example may cause an expensive re-annotation of all existing entries in a data set.
Alternatively, filtering the data based on predefined search criteria using selected data properties
is an automated operation that reduces human impact. However, naïvely evaluating all entries of
large data sets entry by entry does not scale. As state-of-the-art configurations for automated vehicles
generate between 1-3TB of data per
hour111Cf. https://developer.nvidia.com/blog/training-self-driving-vehicles-challenge-scale/,
all previously mentioned approaches are inappropriate due to the enormous effort spent for annotation or
because of computational inefficiency when filtering such time-series data. Hence, we motivate our work
as follows:
Motivation: Computationally efficient approaches are needed to systematically describe and
analytically understand the inherent value of growing data lakes to better support the data-driven development
and improvement of AI/ML-based automotive software.
I-B Research Goal & Research Questions
We pursue the research goal to design and evaluate an approach to computationally efficiently identify and retrieve events from large-scale automotive data sets. In this paper, we leverage the dimensionality reducing property of Space-Filling Curves (SFCs) to traceably compute a domain-specific, compact representation that we exploit as a novel index to entries of a large-scale data set for retrieving events based on efficient range queries. We conducted experiments to answer the following research questions:
RQ-1:
How can SFCs be exploited to retrieve automotive events?
RQ-2:
What is the performance of event retrieval based on SFCs?
I-C Contributions & Scope
In this paper, we leverage SFCs to provide the Z-order Curve-based Event Retrieval Approach (ZEBRA) to efficiently process large-scale data sets. We evaluate the efficacy and efficiency of ZEBRA for detecting maneuvers based on multi-dimensional acceleration data on an automotive data set. Yet, its underlying concept and implementation are generic and designed to handle various, multi-dimensional, numerical data.
I-D Structure of the Article
The remaining part of the paper is structured as follows: Sec. II introduces briefly the concept of SFCs to provide the relevant terminology and theoretical concepts. In Sec. III, we present and discuss related works. We introduce ZEBRA in Sec. IV and discuss results from a systematic evaluation in Sec. V before we conclude our work in Sec. VI.
II Background
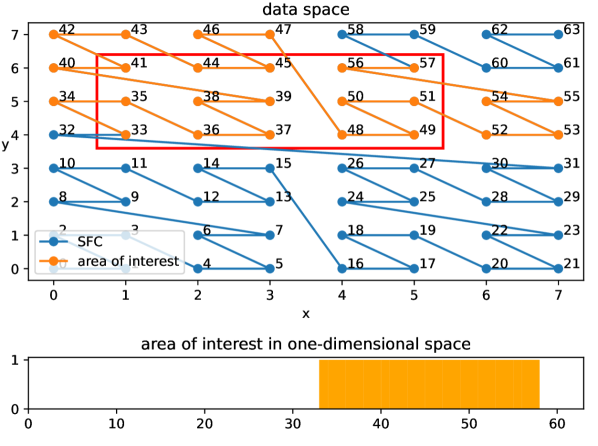
SFCs are used to map multi-dimensional values to their corresponding single-dimensional representations (cf. Bader, [2]), which can be exploited for computationally efficient data exploration (cf. Fig. 1). An early definition of SFCs can be found by Goldschlager who states that “a space-filling curve is a continuous curve […], which passes through every point in the square” [3]. This points-passing curve is constructed following a very specific repetitive or recursive pattern to pervade a given space.
In Fig. 1, we present an example of the repeating Z-order curve (blue zig-zag-line) covering the complete two-dimensional value space. For this purpose, the shape of the SFC is determined by a dimensionality reducing mapping function like Morton-codes (cf. Bader, [2] and Morton, [4]) that associates a single-dimensional value to every -tuple from the -dimensional data space. The mathematical operation to turn a multi-dimensional data sample into its one-dimensional representation when using a Z-order curve is bit-interleaving. This transformation is traceable, explainable, and bi-directional.
Querying the multi-dimensional value space is depicted as a red rectangle in Fig. 1 denoting an area-of-interest, where relevant points on the single-dimensional Z-order curve are highlighted in orange. In the single-dimensional space, the Morton-codes for the bottom/left corner () and top/right corner () are computed as and , respectively. The complete value range between these two Morton-codes does not contain any false/negatives, ie., multi-dimensional values that should have been included in the area-of-interest but were not. Moreover, SFCs exhibits locality preservation (cf. Bader, [2]), which illustratively means that points that are in close proximity in the multi-dimensional space will also be located near to each other on a SFC. For example, SFCs found an application for looking up data samples from a database that reside in specific geographical regions (cf. Sec. III).
III Related Works
A naïve approach to retrieve events from large data sets is brute-force that simply traverses all entries to find matching properties. Perez et al. [5] suggested an approach based on such an idea to use kinematics thresholds for event detection. While event retrieval is rule-based and traceable, its actual effort scales with the number of entries in a data set and hence, brute force is practically infeasible to query events from large-scale data sets.
Improved approaches use clustering techniques for event detection by analyzing patterns with respect to their similarity and classify them into clusters. Current approaches use for example the k-means algorithm as suggested by Hauer et al. [6] or ML-enabled approaches such as auto-encoders as proposed by Demetriou et al., Hoseini et al., and Ding et al. [7, 8, 9] to cluster entries from a data set. Initially determining existing clusters and assigning relevant entries from a data set to these clusters require significant computational effort. Inserting and assigning single entries retroactively, though, is a computationally efficient operation. However, such clusters need to be updated regularly as the characteristics of data set entries might evolve over time.
Another research direction as suggested by Hulbert et al. [10] suggests to use SFC to realize data sample look-ups in large-scale data sets. Bader (cf. [2]) and Morton (cf. [4]) for example suggest to use Z-order curve to turn a tuple of (latitude, longitude) GPS coordinates into a single-dimensional representation allowing a simple retrieval of all GPS coordinates of interest by looking up their corresponding Morton-encoded, single-dimensional representations within an area of interest thanks to the SFC’s locality preservation property. Inserting new entries into a data set, generating a SFC-index, and retrieving entries from an area of interest are computationally efficient operations. Moreover, calculating a SFC-index for related entries in a data set is a rule-based, traceable operation.
We are proposing in this work the combination of the locality preservation property of SFCs with temporal properties of consecutive data samples from ODD scenarios such as automotive data as a novel approach to model and retrieve events of interest.
IV ZEBRA: Z-order Curve-based
Event Retrieval Approach
IV-A Overview of the Fundamental Concept
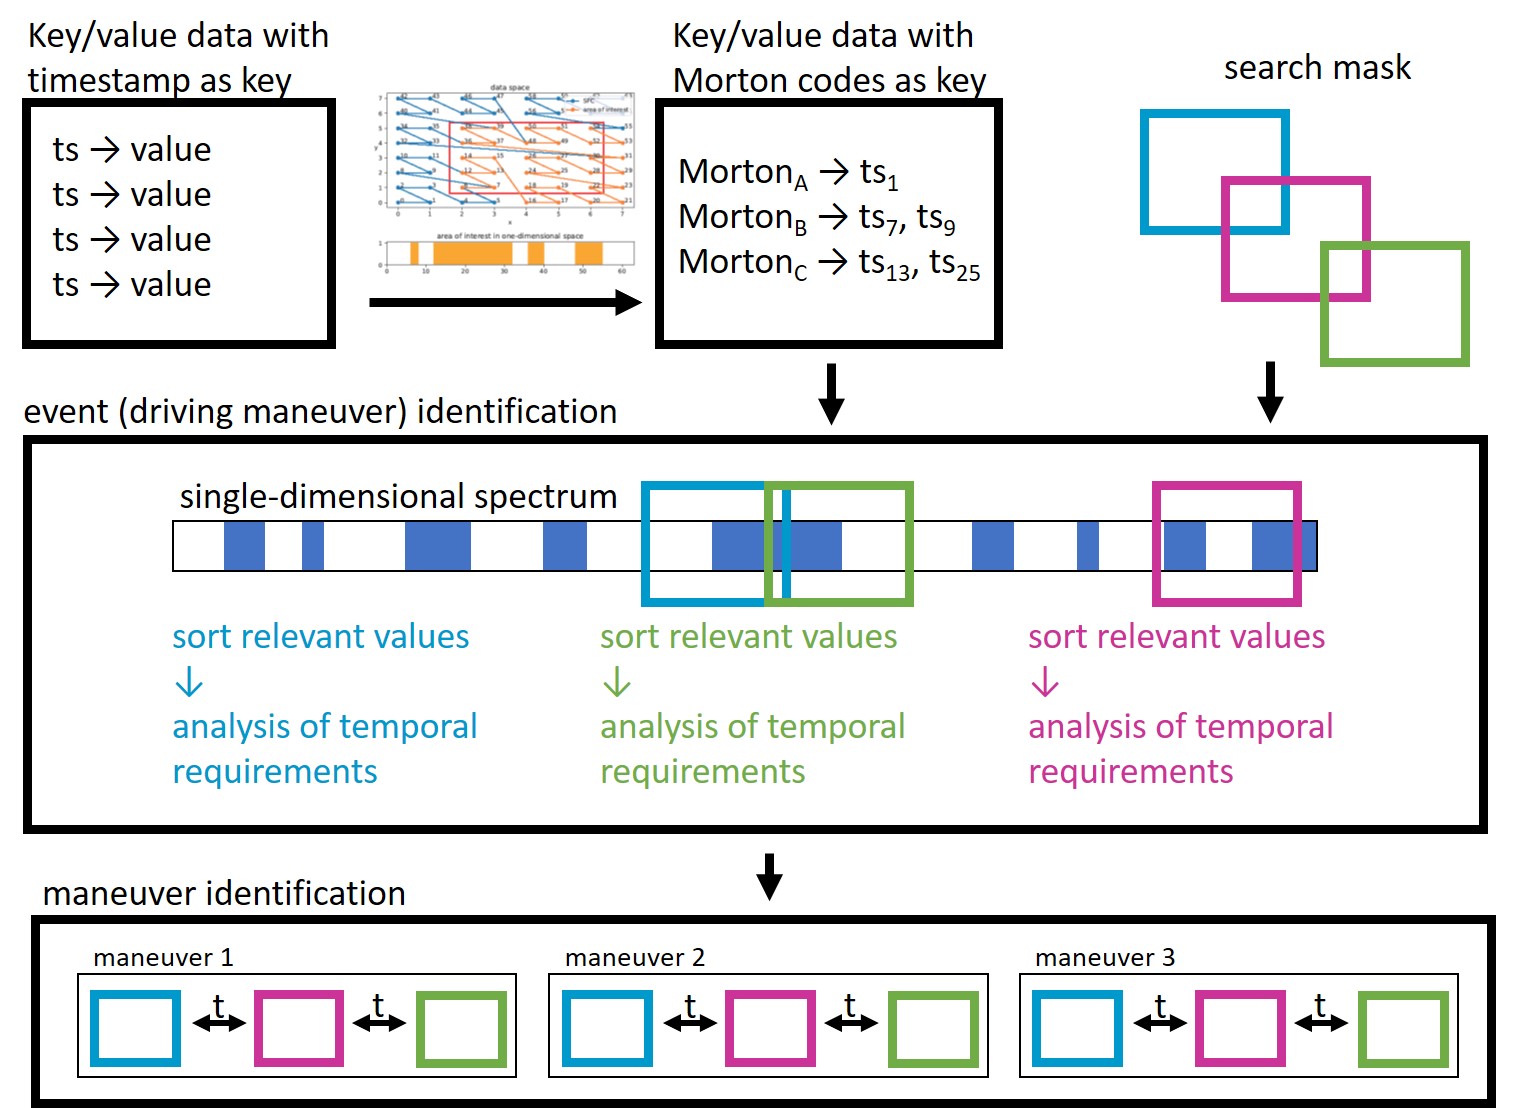
The fundamental idea behind our proposed Z-order Curve-based Event Retrieval Approach (ZEBRA) exploits the dimensionality reduction from SFCs to transform multi-dimensional data samples into a single-dimensional representation in combination with the temporal occurrence of such data samples as depicted in Fig. 2. The visual representation of the resulting single-dimensional data resembles a Zebra-pattern as depicted in Fig. 3(c). The specific ordering, temporal occurrence and spread, and distribution of the resulting stripes correspond semantically to scenarios in the ODD that we refer to as events; in the automotive ODD case as described in Sec. V, such events correspond to driving maneuvers. In ZEBRA, we are now using the resulting single-dimensional representations as additional index for an existing key/value database where all data samples are stored. This index, which contains domain-specific properties from the original multi-dimensional space, is ordered and thus, can be computationally efficiently exploited for range queries to retrieve events of interest. We use search masks (ie., area of interests) to query individual events and multi-level search masks to query for temporal combinations of individual events. Thus, we are able to retrieve arbitrary events that are defined by search masks from large-scale databases by exploiting the temporal relations between Zebra-pattern-like stripes.
IV-B Application of ZEBRA to Automotive ODDs
In the following, we outline how we use this approach for event retrieval on automotive data sets. We consider vehicle kinematics over time as multi-dimensional value space for event modeling in automotive data sets. Individual vectors contain the vehicle’s acceleration or steering wheel angle for example. Using ZEBRA, these vectors are discretized to to allow for applying dimensionality reduction using Morton-codes for the Z-order curve. The obtained Z-order curve represents only actually existing points in the multi-dimensional value space as Zebra-stripes in their corresponding, single-dimensional representation. Values that do not occur in the multi-dimensional data space also do not occur in the single-dimensional SFC representation.
Next, the specific ordering, temporal occurrence and spread, and distribution of these stripes in the single-dimensional representation need to be interpreted within the originating ODD of the automotive data space for event modeling and retrieval. For this step, the temporal dimension of the ODD is considered that intuitively determines what stripes occur at what point in time and what their temporal distance and spread is. Different scenarios from the ODD exhibit different yet specific characteristics for stripe ordering, temporal occurrence and spread of stripes, and stripe distribution that we exploit in our search masks to retrieve events from a data set. In Sec. V, we are providing two examples from the automotive ODD: Autonomous Emergency Braking (AEB) and Lane Departure Warning (LDW), on which we apply and evaluate ZEBRA.
V Evaluation of ZEBRA and Discussion
In this section, we describe our experimental results from applying and evaluating ZEBRA to efficiently retrieve events from automotive data to address the aforementioned research questions.
V-A Experimental Setup
To evaluate how ZEBRA can be used to retrieve events from automotive ODD, we set up an experiment on a confined test site where we collected data using a Volvo XC90 instrumented with an Applanix GPS/IMU system. We defined two driving maneuvers: (a) Emergency braking as found in AEB systems for example, and (b) lane change maneuvers as found in LDW systems. For that purpose, we drove the vehicle manually and conducted the required maneuvers at different speeds while recording accelerations, angular velocities, and the steering wheel angle. We used this controlled experiment to evaluate whether ZEBRA can correctly identify these maneuvers. Afterwards, we collected data during a test drive through Gothenburg in Sweden where we also included lane changes that we manually annotated during the data collection with the goal to let ZEBRA spot these events automatically afterwards. Due to safety reasons, we excluded emergency braking scenarios during the real-world data collection in Gothenburg. For all collected data sets, we generated SFC representations and use ZEBRA to retrieve emergency braking and lane change events that we compared afterwards with the manual annotations.

V-B Using ZEBRA for Detecting Emergency Braking Scenarios
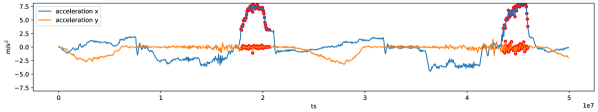
The first application of ZEBRA is depicted in Fig. 3, where ZEBRA is used to spot emergency braking scenarios in a data set recorded on a confined test site. The vehicle was accelerated to inner city driving speed before an emergency braking maneuver was conducted.
When processing these data samples using a brute force approach, an event detection algorithm would have to process all rows using a sliding window for example to find rising edges over time for the longitudinal acceleration of the vehicle (cf. Fig. 3(b)) resulting in a computational complexity of at least . When operating on a Z-order curve, though, relevant events can simply be spotted by using a threshold query exhibiting better than performance as all tuples with excessive longitudinal/lateral-accelerations will be located in a certain part of the single dimensional spectrum after transforming such multi-dimensional data to their single-dimensional representations as depicted using red stripes in Fig. 3(c): They are all located at the right hand side. As illustrated in Sec. IV, we use the single-dimensional representations as additional index into a key/value database, which allows us to efficiently look-up all time points where such emergency braking maneuvers were conducted.
V-C Using ZEBRA for Detecting Lane Changes
The second application of ZEBRA is shown in Fig. 4, where ZEBRA is used to identify lane change maneuvers. In contrast to the previous example, where already a simple threshold query in the single-dimensional space was sufficient, detecting lane changes may require the observation of a certain acceleration profile in two dimensions over time. Hence, both aspects from ZEBRA, dimensionality reduction and temporal properties from the ODD need to be exploited to identify this type of events. For this experiment, the same instrumented vehicle was used on a confined test site. The vehicle was accelerated to inner city driving speed before a lane change maneuver from the left to the right lane was conducted. In a second step, the same driving profile was repeated but the lane change maneuver was omitted.
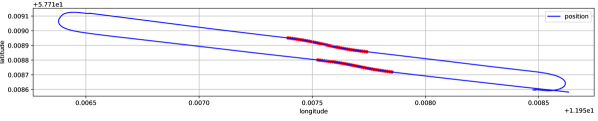
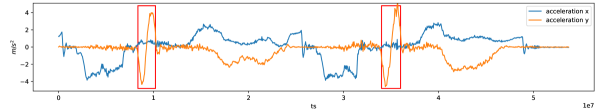

Both runs were subsequently converted to a single-dimensional spectrum and the second run was subtracted from the first run to identify relevant sections on the SFC. These sections were then analyzed to identify relations between occurring time points and spread of stripes over time as shown in Fig. 4(c) to model a search mask for an event detector. The design of this event detector contained several stages as first, a range query was needed to spot the falling V-shapes of candidates for potential lane change maneuvers as highlighted with red rectangles in Fig. 4(b). As the corresponding Morton-code representations are used as additional index into a key/value database referring to time points, such retrieved time points were stored in a list as input for the second stage of this event detector that was spotting the second half of the flipped V-shaped curve as highlighted in Fig. 4(b); the corresponding time points were then added to a second list. The final stage of this event detector was then matching starting time points from the first list with time points from the second list that in combination had to match semantic plausibility checks from the ODD like minimal and maximal durations to be classified as a lane change maneuver.
Similar to the previous example, traversing all rows using a sliding window with a variable look-ahead to spot such scenarios would require at least . When operating on the Z-order curve, though, spotting the two V-shapes can be realized as computationally efficient range queries exhibiting better than performance and only the final stage in the search mask of the event detector would require a linear traversal of potential candidate entries from both lists, which is now only a small fraction from the entire data set.
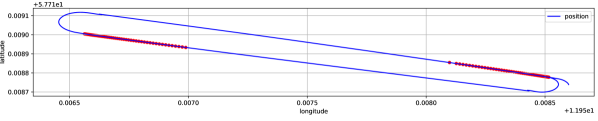
V-D Using ZEBRA on a Real World Example
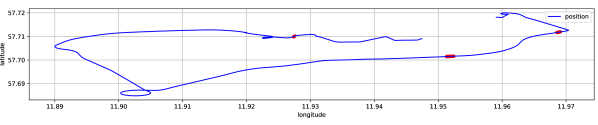
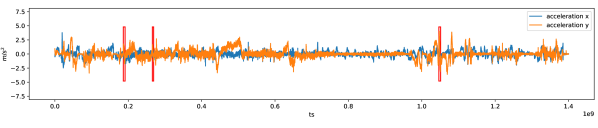

Finally, we conducted a data collection in Gothenburg, Sweden to evaluate the transferability of the event detection approach calibrated on one data set recorded at a confined test site to a data set, on which the event detector was not applied before. The same instrumented vehicle was used to collect GPS and acceleration data for approx. 23 minutes as depicted in Fig. 5. All lane changes from right to left lane and vice versa were manually annotated to be able to verify the results from ZEBRA afterwards. The recorded data was transformed from its multi-dimensional space into the single-dimensional spectrum and the lane change event detector was applied thereto. During the test drive, three lane change maneuvers on straight roads were conducted that were also spotted from ZEBRA. Since we defined and calibrated the search mask to detect lane changes for straight roads on flat surfaces, we only detect this type of lane changes within our experiments. As the definition and detection of search masks, however, is generic, defining search masks that cover lane changes when passing curves is possible by adjusting the search mask calibration parameters, which was outside the scope of our experiments. One observation can be made when comparing Fig. 4(c) with Fig. 5(c): The spectra are not exactly the same and this is motivated by the fact that the data collection during driving through the city created obviously more tuples of longitudinal/lateral-accelerations than what was possible with the controlled experiments on the confined test site only. Hence, we see similar sections in both spectra covered by stripes but in addition, the spectrum from the larger test drive shows also broader ranges covered by stripes.
Answering RQ-1: How can SFCs be exploited to retrieve automotive events?
The Z-order Curve-based Event Retrieval Approach (ZEBRA)uses SFCs to generate a domain-specific representation that we use as index into a
key/value database to model and computationally efficiently retrieve automotive events from annotated driving experiments
on a confined test sites and from a real-world data collection. We created SFC representations for
tuples of longitudinal/lateral-accelerations and successfully retrieved emergency braking and lane changes maneuvers.
V-E Performance of ZEBRA
Next, we evaluate the performance of ZEBRA by conducting an experiment that investigates its efficiency and efficacy. We query maneuvers from a large-scale, real world data set collected in Gothenburg, Sweden (cf. Berger [11]) with three event retrieval approaches: A) BF_primitive, which is a naïve implementation processing the data set entry-by-entry from beginning to its end, ie., operating in brute force (BF) and hence, exhibiting ; B) an improved version of the previous event detector that scales better in case when multi-stage data look-ups are necessary; and C) ZEBRA: our SFC-based implementation of the event detector.
The BF_primitive query requires a key/value database with time points as keys and a search mask as input. The output is a set of tuples of time points describing the start and end of detected driving maneuvers. BF_primitive traverses the entire database for each stage in the search mask and identifies relevant entries (ie., whether longitudinal- and lateral-accelerations are in the defined value range). We analyze the time points of relevant values according to their temporal relations and consider them as a valid driving maneuver when they match a minimum and a maximum duration. However, we allow outliers as long as the temporal gap between two following relevant values does not exceed a defined threshold. In case of a multi-stage search mask, we also investigate the temporal gap between two following stages and define a minimum and a maximum gap.
The improved BF query also requires a key/value database with time points as keys and it outputs a combination of start and end time points that describe valid maneuvers. The improved BF query iterates the entire database only once and determines entries that are valid according to the first search mask stage (ie., value range and temporal relations). After a valid starting part of a driving maneuver has been detected according to the first search mask stage, the improved BF query recursively checks for further parts of the driving maneuver under consideration. The recursion starts at the end of the previous part prolonged by a minimal gap time allowing also overlaps. If all following parts for this driving maneuver under consideration are valid, the entire driving maneuver is returned, otherwise the recursion is terminated.
The SFC-based event detector is inspired by the design of the BF_primitive query; however, the identification of relevant entries is optimized. The SFC query requires a search mask and, in contrast to BF, a database index that is representing the single-dimensional, Morton-encoded spectrum; cf. Sec. IV for details. For each search mask stage (ie., area-of-interest in this case), we determine the relevant Morton-codes to match on the single-dimensional spectrum. After matching the relevant Morton-codes, the corresponding relevant time points are retrieved and sorted by ascending order of time. The maneuver detection based on relevant time points is then similar to the BF_primitive query.
We evaluate efficiency by comparing the durations of the queries and efficacy by determining false/positives and false/negatives. Since the database is not annotated, we consider the output of BF-primitive as ground truth as the process of BF-primitive is very similar to the intuition of experienced domain experts. We require and verify that all methods detect the same events. The dependent variables of the experiment are (d1) duration of a query and (d2) false positive and false negative maneuvers. We report the number of detected maneuvers as independent variable.
The controlled variables are (c1) the number of stages in a search mask, (c2) the dimensions of the search mask stages (ie., bottom/left and top/right of the area-of-interest), and (c3) the size of the database. Fixed parameters are the minimal and maximal duration of a driving maneuver (, ), the minimal and maximal gap between two valid driving maneuvers (; ), and the maximum temporal distance between two valid entries in case of outliers .
We conducted all experiments on a NUC 9 Pro computer powered by an Intel(R) Xeon(R) E-2286M 16-core CPU with 64GB RAM running Linux kernel 5.3.19-6 with 2x Sabrent Rocket Q (firmware RKT30Q.3) 8TB NVMe SSDs used with the ZFS filesystem in a striped data pool running ZFS version 2.5.1 and Linux kernel module 2.4.1.
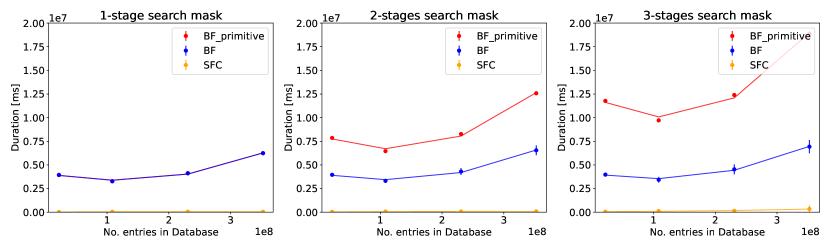
We consider search masks with one, two, or three stages and randomly generated five of these search masks each resulting in a total of 15 search masks. We require that each search mask detects at least one valid maneuver in the overall database that we verified with a SFC-query. As a first step, we search for maneuvers for each search mask with each query method (Bf_primtive, BF, SFC) using the entire database (352,477,057 entries) resulting in a total of 45 queries. To investigate the impact of database size on the query duration, we randomly extract three snippets with different sizes (230,774,696 entries, 22,042,147 entries, 108,402,558 entries) from the overall database and apply all 45 queries to each database excerpt respectively. The overall experiment took approx. 223h.
We show the query durations separated by the number of search masks and arranged according to the database size in Fig. 6. From left to right, we plot results for the search masks with 1–3 stages. The x-axis depicts the number of entries that are contained in the database or database excerpt, and the y-axis describes the duration of the maneuver queries. A dot in the chart represents the mean of five randomly generated search masks and a vertical line the spread of their minimum/maximum query duration. The line connecting multiple dots shows a -order polynomial trend line.
The SFC query is clearly faster than the improved BF and BF-primitive queries. The query duration increases for all approaches with growing database sizes and BF-primitive query is most and SFC-query is least impacted by the database size as expected. Moreover, the number of stages significantly impacts the BF-primitive query, while the improved BF mainly has similar query durations. The SFC-query outperforms both query methods with respect to shortest query durations independently of search mask stages and database sizes.
Answering RQ-2: What is the performance of event retrieval based on SFCs?
Our experiments showed that ZEBRA identifies the same events as the naïve brute force method
but significantly outperforms both brute force implementations in execution time. ZEBRA provides
the possibility to efficiently query maneuvers from large-scale databases independently of search mask
complexity and dimensions of area-of-interests.
V-F Discussion
Common to the illustrating application examples for the emergency braking and the lane change maneuvers as well as the experimental setup as described before is that the transformation of the underlying data samples from their multi-dimensional value space into the corresponding, single-dimensional spectrum must be conducted only once irrespective of the type of events to be spotted and how often any event detection queries shall be executed. This is a strong benefit of the presented novel approach compared to rule-based event detection based on annotations that in the worst case would need to re-process all data again on any change of the implementation.
In contrast to event detectors, which are directly applied to all entries of a data set and as a consequence are not computationally efficient by design, event detectors operating on the single-dimensional spectrum are not dependent on the amount of data to process due to its design operating on a fixed range to assess stripe ordering, temporal occurrence and spread of stripes, and stripe distribution. The only influencing factor on the performance of SFCs-based event detectors is the growing amount of entries in the lists with candidate time points that are subsequently needed to evaluate temporal relations. Hence, we can conclude that ZEBRA is a computationally efficient approach for event detection.
Furthermore, the general architecture behind ZEBRA correlates certain patterns from the single-dimensional spectrum including temporal properties for stripe occurrence, spread, and distribution. Therefore, ZEBRA preserves the analytical explainability of event modeling and identification. As such, the presented approach of SFC-based event detectors can also be considered as a more suitable means for systematic event description and identification in the context of, eg., safety-critical systems engineering, where systematic and traceable safety argumentation is needed.
VI Conclusion and Future Work
In this paper, we present a novel approach to model and retrieve events in multi-dimensional data spaces called ZEBRA by combining (a) dimensionality reduction of SFCs resulting in single-dimensional representations of values as Zebra-stripes, with (b) the temporal properties for stripe ordering, temporal occurrence and spread of stripes, and stripe distribution. Computationally efficient event detection and retrieval is enabled when using the single-dimensional values as additional index into key/value-databases. We illustrate ZEBRA for maneuver detection in an automotive data set and evaluate its performance on a large-scale automotive data set, where we could reduce the processing time from initially approximately 69 minutes using an event detector to 21 seconds using ZEBRA.
The combination of dimensionality reduction of SFCs with temporal properties from an ODD of a data space unlocks computationally efficient information retrieval. We foresee further very relevant research and application directions such as real-time event classification, event similarity identification in large data sets, or ODD-agnostic event modeling for interactive data exploration on large-scale data for improved edge-case modeling. The outlined SFC-based approach is addressing a relevant topic from industry that is even enabling further research opportunities for event modeling and detection offering analytical explainability of detected events. Additionally, more research is needed to also integrate further unstructured data samples from video-, radar-, or lidar-sensors into the dimensionality reduction processing step to allow for more detailed event detectors.
Acknowledgment
This work has been partially been funded by the PhD program “Responsible AI in the Digital Society” funded by the Ministry for Science and Culture of Lower Saxony, Germany. This work has been partially supported by Vinnova, Grant Number 2021-05027.
References
- [1] C. Zhang, C. Berger, and M. Dozza, “Social-IWSTCNN: A Social Interaction-Weighted Spatio-Temporal Convolutional Neural Network for Pedestrian Trajectory Prediction in Urban Traffic Scenarios,” in Proceedings of the 32nd IEEE Intelligent Vehicles Symposium (IVS), Jul. 2021, p. 8. [Online]. Available: https://arxiv.org/pdf/2105.12436.pdf
- [2] M. Bader, Space-Filling Curves. Springer Berlin, Heidelberg, 2013.
- [3] L. M. Goldschlager, “Short algorithms for space-filling curves,” Software: Practice and Experience, vol. 11, no. 1, pp. 99–99, 1981. [Online]. Available: https://onlinelibrary.wiley.com/doi/abs/10.1002/spe.4380110106
- [4] G. M. Morton, “A Computer Oriented Geodetic Data Base and a New Technique in File Sequencing,” 1966. [Online]. Available: https://dominoweb.draco.res.ibm.com/reports/Morton1966.pdf
- [5] M. A. Perez, J. D. Sudweeks, E. Sears, J. Antin, S. Lee, J. M. Hankey, and T. A. Dingus, “Performance of basic kinematic thresholds in the identification of crash and near-crash events within naturalistic driving data,” Accident Analysis & Prevention, vol. 103, pp. 10–19, 2017. [Online]. Available: https://www.sciencedirect.com/science/article/pii/S0001457517301033
- [6] F. Hauer, I. Gerostathopoulos, T. Schmidt, and A. Pretschner, “Clustering traffic scenarios using mental models as little as possible,” in 2020 IEEE Intelligent Vehicles Symposium (IV). IEEE, 2020, pp. 1007–1012.
- [7] A. Demetriou, H. Alfsvåg, S. Rahrovani, and M. H. Chehreghani, “A deep learning framework for generation and analysis of driving scenario trajectories,” arXiv preprint arXiv:2007.14524, 2020.
- [8] F. Hoseini, S. Rahrovani, and M. H. Chehreghani, “Vehicle motion trajectories clustering via embedding transitive relations,” in 2021 IEEE International Intelligent Transportation Systems Conference (ITSC). IEEE, 2021, pp. 1314–1321.
- [9] W. Ding, W. Wang, and D. Zhao, “A multi-vehicle trajectories generator to simulate vehicle-to-vehicle encountering scenarios,” in 2019 International Conference on Robotics and Automation (ICRA). IEEE, 2019, pp. 4255–4261.
- [10] A. Hulbert, T. Kunicki, J. N. Hughes, A. D. Fox, and C. N. Eichelberger, “An experimental study of big spatial data systems,” in 2016 IEEE International Conference on Big Data (Big Data). Washington, DC, USA: IEEE, 2016, pp. 2664–2671.
- [11] C. Berger, A. Karsolia, F. Giaimo, and O. Benderius, “Over 60,000 km in a year: remotely collecting large-volume high-quality data from a logistics truck,” SpringerNature Applied Sciences (SNAS), vol. 277, no. 4, pp. 1–9, Sep. 2022. [Online]. Available: https://link.springer.com/article/10.1007/s42452-022-05159-w