This manuscript has been authored by UT-Battelle, LLC under Contract No. DE-AC05-00OR22725 with the U.S. Department of Energy. The United States Government retains and the publisher, by accepting the article for publication, acknowledges that the United States Government retains a non-exclusive, paid-up, irrevocable, world-wide license to publish or reproduce the published form of this manuscript, or allow others to do so, for United States Government purposes. The Department of Energy will provide public access to these results of federally sponsored research in accordance with the DOE Public Access Plan(http://energy.gov/downloads/doe-public-access-plan).
Atomic dynamics in fluids: Normal mode analysis revisited
Abstract
Developing microscopic understanding of the thermal properties of liquids is challenging due to their strong dynamic disorder, which prevents characterization of the atomic degrees of freedom. There have been significant research interests in the past few decades to extend the normal mode analysis for solids to instantaneous structures of liquids. However, the nature of normal modes that arise from these unstable structures is still elusive. In this work, we explore the instantaneous eigenmodes of dynamical matrices of various Lennard-Jones argon liquid/gas systems at high temperatures and show that the normal modes can be interpreted as an interpolation of (gas) and (solid) mode descriptions. We find that normal modes become increasingly collisional and translational, recovering atomistic gas-like behavior rather than vibrational with increase in temperature, suggesting that normal modes in liquids may be described by both solid-like and gas-like modes.
I Introduction
In contrast to solids and gases, the nature of atomic dynamics of liquids remains elusive due to strong atomic correlations, leading to difficulties in microscopically understanding materials properties of liquid. Among other theoretical approaches that characterize atomic dynamics, normal mode analysis is widely used in various physical [1] and life sciences [2]. In normal mode analysis, one obtains normal mode/eigenmode frequencies and eigenvectors from diagonalization of dynamical matrices built from second derivatives of the interatomic potential of a given structure. Therefore, eigenmode frequencies represent local potential curvatures and eigenvectors depict constituent atomic motions relative to each other.
For solids, normal modes are physically understood as harmonic oscillators about static equilibrium positions, with some exceptions including highly anharmonic systems [3]. These harmonic oscillators are categorized as phonons, propagons, diffusons, and locons based on translational symmetry and mode interaction mechanisms. Normal mode analysis has been successful in describing various thermodynamic and thermal properties of solids, including free energy and heat capacity from a bottom-up perspective [1, 4, 5]. These properties can now be predicted with high accuracy from routine lattice dynamics calculations [6].
Encouraged by the success in describing vibrational properties of solids, many efforts have been made in recent years to extend the normal mode analysis to liquid systems where instantaneous structure snapshots are used instead of the lattice structure [7, 8, 9, 10, 11, 12, 13, 14, 15]. These unstable snapshot structures (non-zero net forces) give rise to modes with imaginary frequencies in addition to modes with real frequencies. As such, a lot of research has been conducted to understand the nature of imaginary modes and various aspects of these have been used to describe some non-equilibrium processes including atomic diffusion [9, 16], glass transition [17, 18], and melting [19], with varying degrees of success. Despite these efforts, physical understanding of imaginary modes and their relation to various materials properties remains elusive. Real modes in liquids are often interpreted as extrapolation of real modes in solids as harmonic oscillators with well-defined frequencies in a local potential well. However, this assumption becomes particularly questionable at high temperatures as the structures themselves change much faster than most real mode periods. Accurate understanding of the nature of real modes in liquids is, therefore, also lacking.
To build a better understanding of normal mode behaviors, particularly for non-static structures (i.e., liquids and gases), we study normal mode characteristics of molecular dynamics (MD) snapshots of various argon systems from solid to gas at extremely high temperatures, up to K, at constant volume. In particular, we explore the high temperature limit () of normal modes such that physical interpretations of normal modes at finite, intermediate temperatures can potentially become an interpolation between solid and gas rather than an extrapolation from solid behavior alone. We find that as temperature increases, normal modes involving diatomic units become a dominant feature in the normal mode spectra. Many of these pairs of atoms have positive potential energies and large kinetic energies such that normal modes with eigenvectors that are parallel with the ‘bond’ can be described as collisional rather than vibrational. Further, we also observe modes progressively being projected to a single atom, mimicking single atom translating in space. Our findings, therefore, set the scale of the spectrum of eigenmodes of dynamical matrices where in one end, we have solid-like vibrational normal modes and in the other end we have gas-like collisional and translational modes.
II Methods
Crystalline argon of 1372 atoms in the FCC structure and with a lattice parameter of 5.27 Å was used as the initial input structure for MD simulations using LAMMPS [20] to generate equilibrated atomic structures at various temperatures at constant volume. Interatomic interactions are described by the Lennard-Jones potential [21, 22, 23]. The parameters used were = 0.0104 eV and = 3.4 Å. The cutoff distance was 2.5 and the potential was shifted to eliminate discontinuity. Timesteps of 0.1 fs (up to 106 K) and 0.01 fs (107 K and above) were used. At each temperature, all systems except that of the glass system were equilibrated for timesteps in the canonical ensemble (NVT) prior to data recording of another timesteps under the same ensemble. The equilibrated atomic structures (snapshots) generated from MD were used to perform lattice dynamics calculations using GULP [24] to obtain eigenfrequencies and eigenvectors of the point dynamical matrices with the entire domain considered as a unit cell. For better statistics, ten such structures at each temperature from MD simulations were used for the lattice dynamics calculations.
Temperatures considered were 1 K for crystal and glass systems and ranging from to K in increments of factors of ten for high temperature liquids and gases. In this work, we consider all systems at 106 K and above as gas states as their specific heat is within numerical errors where is the number of atoms. Even though the physical density is kept constant, the effective atomic radius, where the potential energy equals , thus the effective packing fraction, becomes much reduced at high temperatures, as in gas. Thus, for simplicity, we loosely refer to all other high temperature systems below 106 K as liquids. The glass system was created by a standard melt-quench technique (1000 K melting followed by an instantaneous quench to 1 K). This fast cooling rate was required due to typical poor glass formability of monatomic systems. Quenched glass was then equilibrated for timesteps before data recording for timesteps.
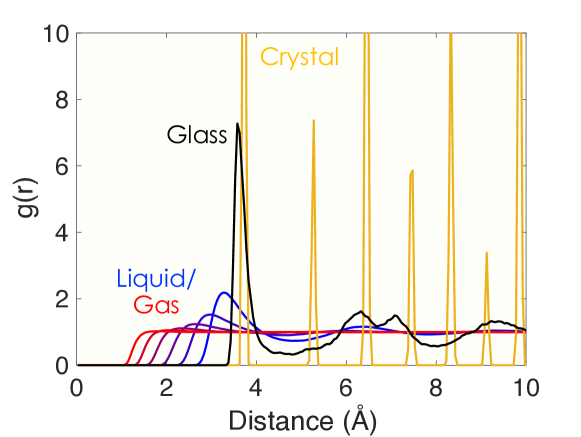
To characterize the phases of the various structures, the pair distribution function for each system (shown in Fig. 1) was calculated by
| (1) |
where , , and are number of atoms, number density, and the atomic position of atom , respectively. Sharp peaks are observed for the 1 K crystal and broadened peaks and valleys are observed for the 1 K glass demonstrating short and medium range orders are still present in the structure. For the liquid systems, peaks and valleys become broader with increase in temperature and eventually become step-functions similar to hard-sphere or dilute gases observed in the literature [25]. The effective diameters of argon atoms decrease with increase in temperature as high kinetic energy enables atoms to approach close to each other, overcoming more of the repulsive portion of the potential, thus mimicking a dilute gas.
From the snapshot structures of all systems, we perform lattice dynamics calculations to obtain eigenmode frequencies () and eigenvectors () from point dynamical matrices () as
| (2) |
where subscript denotes a particular mode from 1 to ( for our systems). Dynamical matrices are related to the potential () by
| (3) |
where is the mass of atom and Greek subscripts denote Cartesian directions. There are no phase factors in Eq. 3 as the wavevector under consideration is zero and there are no lattice vectors for our non-periodic systems. All eigenvectors are real and are orthonormal such that . As dynamical matrices are Hermitian, all eigenvalues () are real, while eigenfrequencies () can be real or imaginary. We denote imaginary frequencies as negative values in figures below. Overall distributions of available eigenmode populations known as the density of states , can then be found by
| (4) |
Using the mode eigenvectors, we can further characterize each mode by its inverse participation ratio (IPR) and phase quotient (PQ). IPRs () are found by [26]
| (5) |
where is the eigenvector component for atom in direction for the mode . IPR gives a measure of how many atoms participate appreciably in the motion of a particular mode; therefore, IPR has been used to qualitatively provide information about the degree of localization of modes for various complex systems [27, 28] and even scattering behaviors of acoustic and optic phonons in binary compound crystals [29]. The IPR is conventionally interpreted such that describes all atoms participating in the mode (delocalized) and 1 if the mode motion is completely localized to a single atom.
Phase quotients have also been useful in characterizing normal modes in various materials, especially disordered solids [30, 31, 32] and is defined as [30]
| (6) |
where the sum over represents counting only the nearest neighbor pairs among atoms and . PQ is a measure of the phase relationship of an atom and its neighbors for a given mode. A PQ value of 1 then represents cluster of atoms all moving in-phase, which is the case for Goldstone translational modes, and a PQ value of -1 means that all atoms participating in the mode are moving in the opposite phase/direction with their nearest neighbors. For our systems, we define nearest neighbors to be within where ; however, we find that our results are not sensitive to the choice of .
III Results
III.1 Normal modes in solids
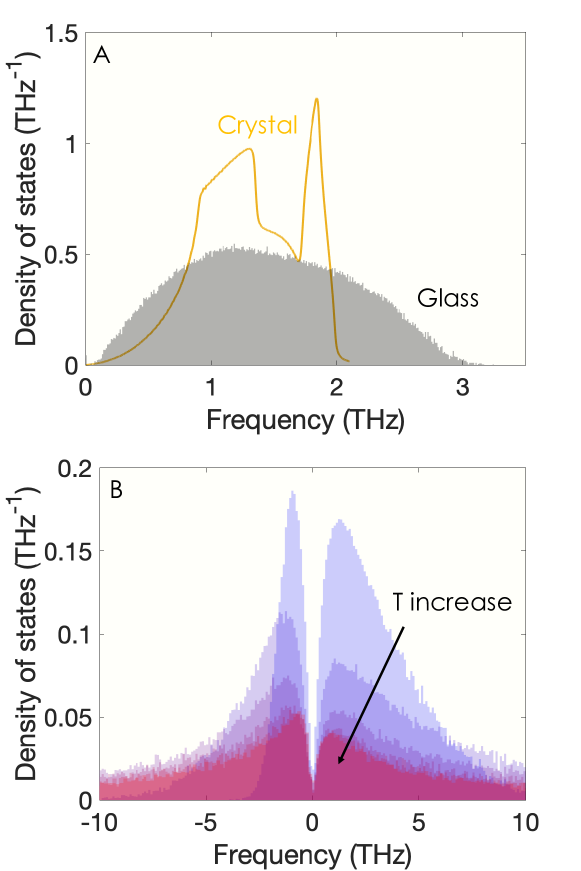
Density of states. – Eigenmode densities of states (DOS) for all systems are shown in Fig. 2. Modes with real and imaginary frequencies are plotted on the positive and negative sides of the horizontal axis, respectively. For solids, all modes have real frequencies as shown in Fig. 2A. Crystalline DOS computed from integration of wavevector points using the primitive unit cell (one atom per unit cell with primitive lattice vectors: and ) are also shown as reference. Sharp kinks in the densities of states for crystals are referred to as van Hove singularities where , mostly near zone-boundaries [33]. Crystalline argon has three acoustic branches with frequencies ranging up to 2 THz. There are no optical branches due to the primitive unit cell having only one atom. For the rest of the work, we utilize supercell argon crystal normal modes for analysis for more appropriate comparisons with the other non-periodic systems of the same size. For the glass system, there are no clear Brilliouin zone-boundaries nor translational symmetry; thus, it has a much broader density of states, though still has three Goldstone modes with zero frequency. The frequency ranges up to 3 THz, larger than that of crystalline argon likely due to some bonds being shorter than the mean equilibrium bond lengths.
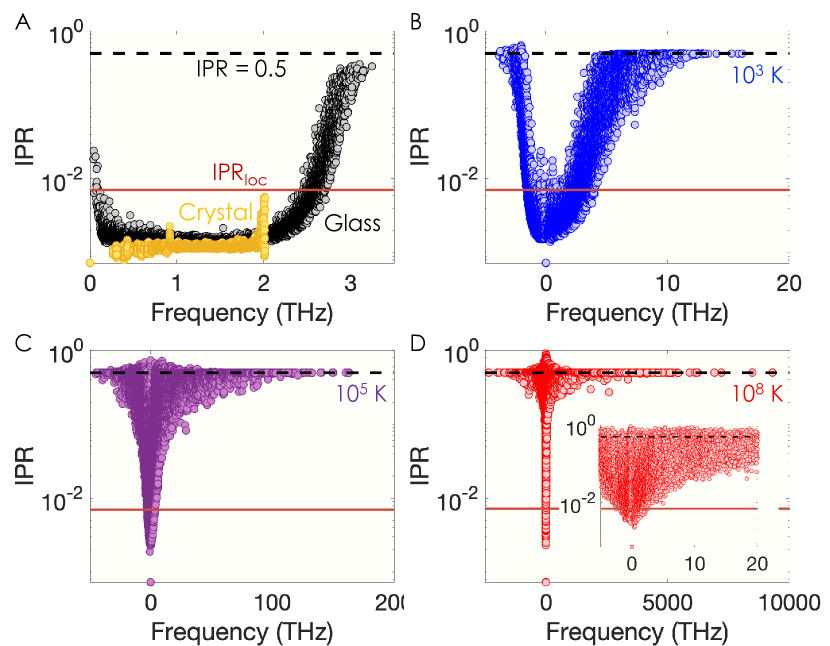
Inverse participation ratio. – Crystalline modes are expected to be spatially delocalized whereas glasses are expected to have some localized modes due to structural disorder. Inverse participation ratios for both are shown in Fig. 3A and give a measure of the degree of localization for each mode. In the literature, a normal mode has been considered to be localized when less than 10 to 20% of atoms are participating in the mode motion [31, 34, 35]. For our purposes here, modes with IPR values over IPRloc = 0.007 (corresponding to 10% atom participation) are considered to be localized. At 0 THz, we have the Goldstone modes with IPR = for both solids where all atoms are participating in the purely translational motion. As expected, all modes for crystalline argon have IPR values less than IPRloc, demonstrating that all modes are delocalized. For our glass system, most low frequency modes are also delocalized with some exceptions known as quasi-localized or resonant modes. Prior works have proposed that some localization at low frequencies is due to finite size effects [36]. At high frequencies, we observe a significant number of modes with IPR values greater than IPRloc, similar to that observed previously in another single element glass (amorphous silicon) [31]. These localized vibrational modes, often referred to as locons in the glass literature, form a small fraction of the total number of modes, about 2 to 3%. Locons typically have low thermal diffusivities and conductivities compared to extended modes [31, 37, 38]. Maximum IPR values found in our glass system are around 0.3.
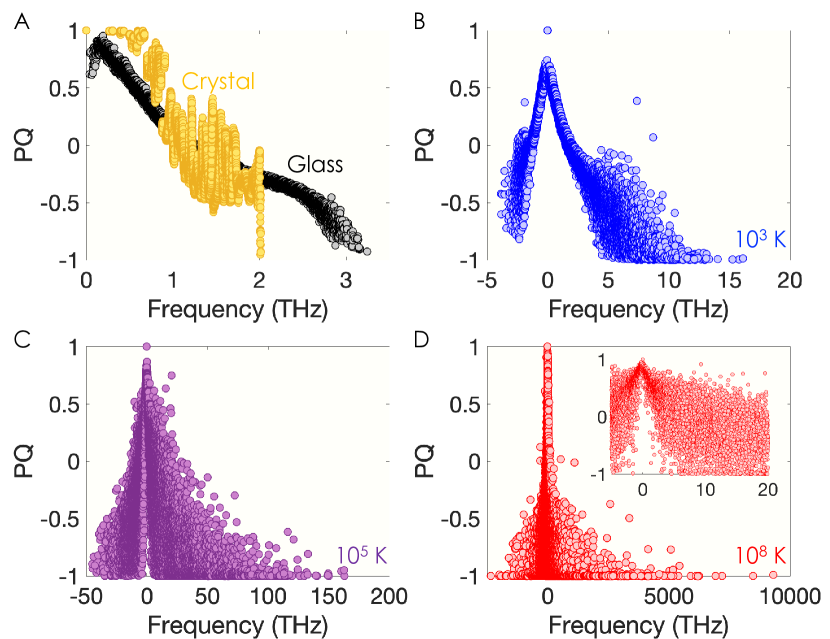
Phase quotient. – Modal phase quotients (PQ) for our solid argon systems that characterize relative mode motion of an atom with its neighbors are shown in Fig. 4A (PQ=1 for fully in-phase and PQ=-1 for fully out-of-phase). For the crystal system, some modes, including the 0 THz Goldstone modes, have PQ 1 at low frequencies demonstrating that atoms are moving nearly in phase with their neighbors. With increase in frequency, PQ decreases and eventually appears to fluctuate between PQ = 0 and PQ = -0.5 and approaches PQ -1. While crystalline argon does not have optical modes (typical out-of-phase vibrations in compound crystals), away from 0 THz acoustic modes develop phase differences among neighboring atoms which underlies the decrease in PQ values. For the argon glass, we observe a monotonic decrease in PQ values with increase in frequency away from 0 THz Goldstone modes that have PQ = 1, similar to other glasses reported in the literature [31, 32]. The lowest PQ values found in the glass system are around -0.9, close to the fully out-of-phase value of PQ = -1. Prior works utilizing PQs in glasses have proposed that modes with PQ 0 and PQ 0 represent acoustic-like and optical-like modes, respectively [31, 32]. Using this notation, an acoustic to optical like mode transition occurs around 1.2 THz for argon glass.
With this normal mode analysis for solids as background context, we next characterize normal modes in the same way for various liquid and gas systems at higher temperatures.
III.2 Normal modes in liquids and gases
Density of states. – Normal mode densities of states for all liquid and gas systems are shown in Fig. 2B. Similar to the solids, densities of states are scaled such that the area under the curve is 1. Only the low frequency region 10 THz is shown for ease of comparisons. Perhaps, the most notable difference in the normal mode densities of states of liquids and gases compared to those of solids is the significant presence of imaginary modes. We see a clear temperature dependence: the imaginary part of the spectra becomes more prominent with increase in temperature as measured by the area. However, as noted previously [39], the rate at which this happens slows down at high temperatures as demonstrated in Fig. 2B. We have previously proposed that equal number of imaginary modes and real modes marks a transition to a gas-like phase [39]. With increase in temperature, also the frequency ranges increase significantly up to 104 THz and down to -2500 THz () for the 108 K gas but with very small probability.
Following Zwanzig’s approach to relate self-diffusion coefficients to normal modes [40], some prior works have tried to express self-diffusion coefficient with the fractions of imaginary modes and real modes over all modes [10, 9, 41, 19, 12]. Some other works have tried to relate normal modes in non-solids to their specific heats [42, 39] and glass transitions [17, 18]. Extrapolating the physical interpretation of real modes in solids to non-solids, it is often assumed that for real modes, liquid atoms vibrate as harmonic oscillators within a local potential well determined from the cage of nearest neighbor atoms [19, 42, 14]. However, physical interpretation of both real and imaginary modes in liquids is not clear and motivated our study.
We aim below to characterize the high temperature limit of eigenmodes of dynamical matrices () under the same density as those of solids such that interpretation of eigenmodes of liquids may potentially become an interpolation from both and eigenmodes rather than an extrapolation only from the crystalline modes that we are familiar with.
Inverse participation ratio. – Similar to solids, we characterize eigenmodes of liquids and gases via inverse participation ratios and phase quotients. Inverse participation ratio spectra at select high temperatures ( K, K, and K) are shown in Fig. 3B-D. At K, we see an asymmetric U shape with high real and imaginary frequency modes being strongly localized and low frequency modes being more extended. This IPR behavior mimics the glass spectral features, although the liquid system has a large component of imaginary modes. Similar trends have been previously shown in other liquid systems [16]. In the limit of high frequency, we seem to approach IPR = 0.5. With increase in temperature, low frequency modes have higher IPR values, filling up the empty region in the U shapes found at low temperatures. For our highest temperature system, we have a cross-like shape with the vertical limits dictated by the lowest IPR () from the pure translational modes and highest IPR approaching 0.9 and with high frequency modes having IPRs exactly equal to 0.5. At K, nearly all modes (over 98% of the mode populations) are ‘localized’ in the conventional interpretation having IPR IPRloc.
Phase quotient. – Phase quotients for liquids and gases are shown in Fig. 4B-D. For all systems, the phase quotient spectra appear nearly symmetric for real and imaginary modes with the exception of the long tail in the real frequency spectrum. A monotonic decrease in PQs is apparent moving away from 0 THz, similar to the glass system. One notable trend observed for liquids and gases vs. solids is the increasing presence of modes with PQ = -1 with increase in temperature. In both metrics (IPR and PQ), we do not observe distinct differences between real mode and imaginary mode characters.
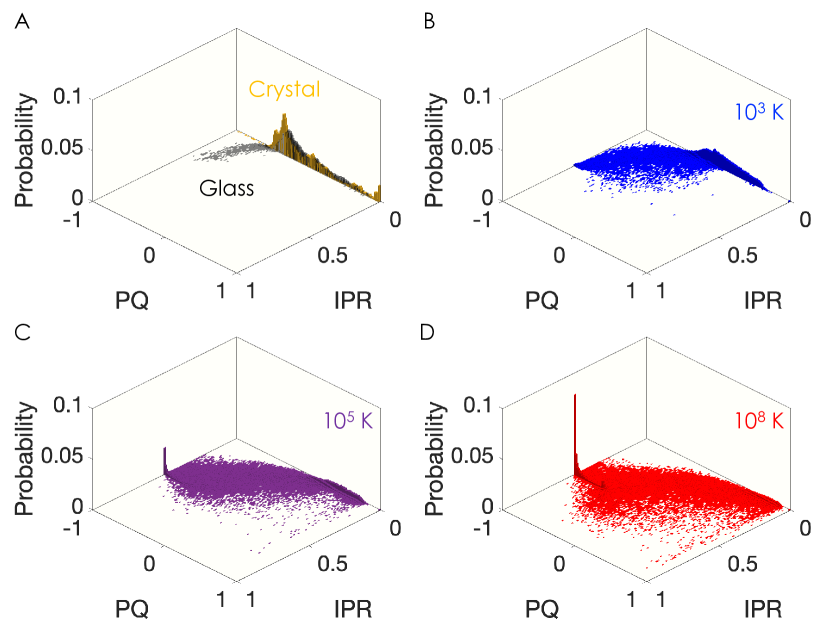
Examining the gas modes more closely, we find some modes with exact values of IPR = 0.5 and/or PQ = -1, modes that are absent in the solid systems. Bivariate probability distributions of the IPRs and PQs for argon at select temperatures are plotted in Fig. 5 and demonstrate a strong trend: going from solids to gases, modes with both IPR = 0.5 and PQ = -1 become the dominant population. In the limit that , we imagine that this trend continues as atoms become effectively smaller and this character will govern the normal mode spectra. As our interest lies in using normal mode analysis to understand liquids in terms of higher T gas phases, we aim to fully understand these modes.
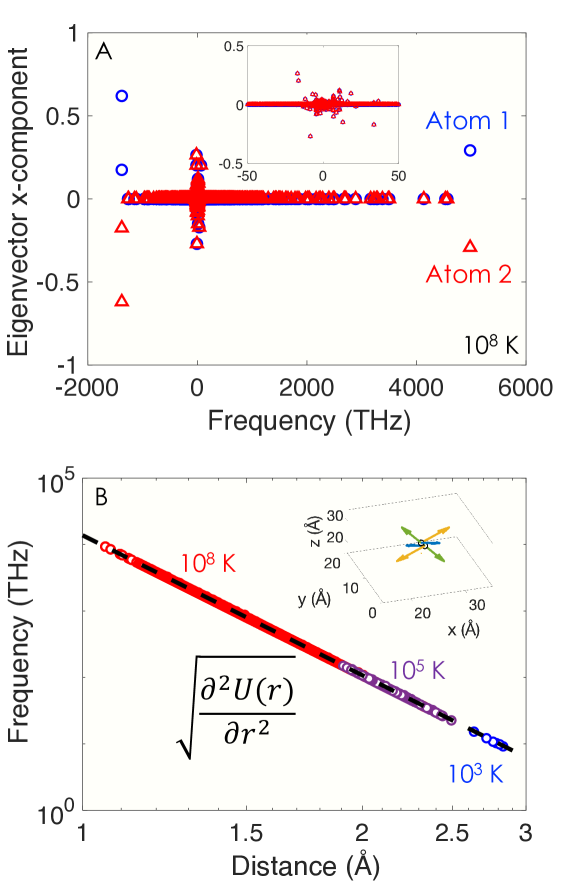
IPR = 0.5 & PQ = -1 modes. – IPR of 0.5 indicates that two atoms are participating in the mode and PQ = -1 describes eigenvectors among neighboring atoms that are fully out-of-phase. From the simulations we have identified pairs of atoms that govern modes with IPR = 0.5 and PQ = -1 and examined the roles of these atoms in all modes of the system. As a representative example, Fig. 6A gives (-direction) eigenvector components for such a pair (atom 1: blue and atom 2: red) for all modes at K. This pair of atoms contributes negligibly to most modes (near zero amplitudes) as nearly all modes are localized to other atoms (large IPR values). However, for modes with finite and sometimes large -components (see inset) for this pair, the eigenmotion of the two atoms are the same (overlapping components), while three modes have identical amplitudes in opposite direction. Thus, of the multitudes of other mode motions, their relative motions are defined by three modes with opposite directions (IPR = 0.5 and PQ = -1). and eigenvector components have similar features (not shown to avoid redundancy).
Interestingly, the three modes that govern the motion of the pairs of atoms with IPR = 0.5 and PQ = -1 can be decomposed into one real mode and two imaginary modes. Visualization of these three modes projected on a pair of atoms is representatively shown in the inset of Fig. 6B. The real modes have eigenvectors along the ‘bond’ (green arrows), while atomic motion for the other two imaginary modes are orthogonal to the bond. In essence, the repulsive force along the bond directs the atoms to a more stable position while there is no energy loss in the motion of the other two modes, similar to rotational modes.
In bulk dense solids, each atom sits in an effective potential that is the summation of all neighboring interatomic potential interactions. However, for the pairs of atoms dominating the eigenmotions for IPR = 0.5 and PQ = -1 modes, the behavior is simulating independent two-atom motion governed by a single pair potential () that defines the mode frequencies, while other interactions are negligible. This leads to three Goldstone modes (two atoms moving in-phase for three Cartesian degrees of freedom) and three out-of-phase modes with opposite eigenvector directions with one being along the bond. Mode frequency along the bond is strictly determined by . Along-the-bond mode frequencies with IPR = 0.5 and PQ = -1 as a function of distance between the atomic pairs are shown in Fig. 6B for both liquid and gas systems. The nearly perfect power law behavior demonstrates that these mode frequencies are purely determined by the second derivative of the pair potential, similar to truly independent two-atom interactions. We also observe that there is a temperature dependence in the bond distance and mode frequencies. There is a large distribution of bond lengths and frequencies at high temperature while the distribution is smaller for low temperatures. While dynamical matrices are built based purely on the potential of a static structure, kinetic energies play a dominant role in determining the atomic locations that feed into the dynamical matrices, especially at high temperatures (liquids and gases). The larger the kinetic energies that atoms have, the closer they can approach each other, leading to higher frequencies for these modes.
Collisons. – Normal modes are typically used to describe phonon quasi-particles or harmonic oscillators in solids. Even in gases, there can be internal degrees of freedom for non-monoatomic species that lead to vibrations (e.g., H2 and O2). However, the results described above show that along-the-bond modes with IPR = 0.5 and PQ = -1 should be considered as collisional rather than vibrational. Even with absence of kinetic energy, if pairs of argon atoms are initially placed at distances shown in Fig. 6B and their motions are allowed to evolve with time, their potential energy is positive ( Å such that they dissociate after participating in the along-the-bond mode motion with kinetic energies determined by energy conservation. We, thereby, characterize these modes as two-body collisional modes or ‘collisons’.
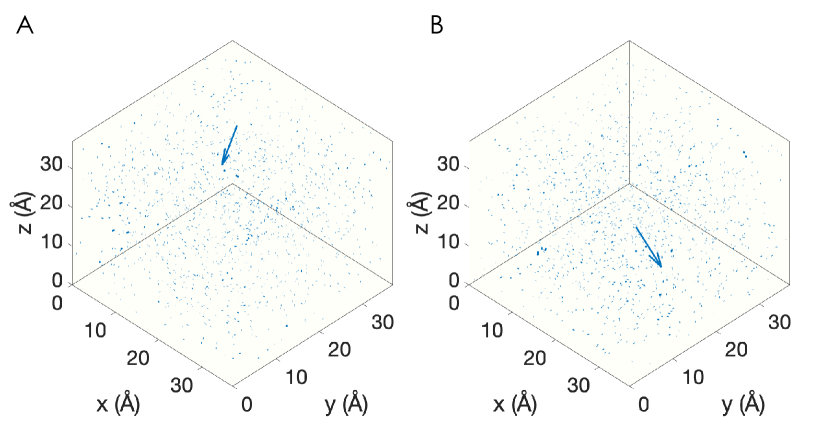
Translatons. – As evident from Fig. 3, the highest IPR values which are located near 0 THz also depend on temperature. Traditional interpretation of IPRs that IPR is a measure of the number of atoms participating in the mode does not strictly work here as there are many IPRs between (2 atoms participating) and 1 (1 atom participating). However, we find that these high IPR modes appear to have concentrated eigenvector amplitude on a single atom as demonstrated in Fig. 7.
It is, therefore, expected that under different conditions there exist modes with IPR approaching 1 where mode motion is projected to a single atom translating through space with small frequency. This is consistent with what we know about dilute gas eigenmodes where nearly all modes have zero eigenfrequencies due to lack of potential interactions. As we progressively reach lower densities, atomic interactions will become less frequent and more uninterrupted translational motion will appear, which would have zero eigenfrequency. In the same token, in the limit of where atoms become point particle-like and overall collisions become less frequent, we would expect modes that purely describe translational motion, or what we may characterize as ‘translatons’, to appear. We have done 1012 K IPR calculations (not shown) and found that IPR approaches as high as 0.97 vs. 0.85 observed in our 108 K system.
IV Concluding remarks
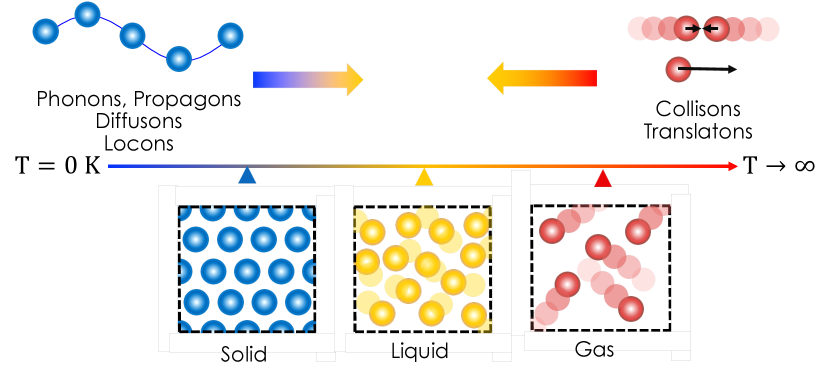
Our results on the normal mode analysis on heat capacities [39], pair distribution functions, and mode characters by IPRs and PQs, suggest that in the limit of , particles will effectively behave as point-particles and two-body collisional modes dominate the particle dynamics, even when the volume is kept constant at that of a solid. This is consistent with real gas collisions where two-atom collisions become statistically dominant with increase in temperature over many-body collisions [43]. In glasses, eigenmodes are vibrational within a local harmonic well and have been categorized into propagons, diffusons, and locons depending on the degree of localization [44, 31]. Although there exist different ways to categorize these modes [34, 37, 45], they often rely on the normal mode analysis, i.e., eigenvector characters. Similarly, we categorize eigenmodes at into collisons and translatons from their eigenvector characters and their local atomic environment.
With these insights into the behavior of high temperature (gas) eigenmodes of dynamical matrices coupled with the vast body of research regarding T = 0 eigenmodes (solid), we propose that eigenmodes in liquids may be best considered as a collection of both solid-like vibrational and gas-like collisional and translational modes as summarized in Fig. 8. While the probability of having two-body collisional modes decreases with decreasing temperature, we still observe these modes even in the lowest temperature liquid argon considered here. In real liquid systems at lower densities, where potential interactions are weaker, we expect that normal mode spectra will still consist of some gas-like modes. In this work, a simple Lennard-Jones pair potential was used throughout. We anticipate that our high temperature limit results will not depend on the choice of interatomic potential (two-body, many-body, etc) as all systems will become an atomic gas where details of the nature of the interactions become less important.
In this work, we explored the high temperature limits of eigenmodes of dynamical matrices through the lens of inverse participation ratios and phase quotients in the context of K eigenmodes. In crystals and glasses, normal modes are considered to be vibrational in nature with most being delocalized in space. With increase in temperature we find that an increasing number of eigenmodes become gas-like collisional and translational modes. Our work, therefore, sets the scale of spectra of different eigenmodes such that normal modes of liquids can be described in terms of evolving characters, rather than extrapolation from our understanding of normal modes in solids alone as often done in literature.
ACKNOWLEDGEMENT
Authors thank Simon Thébaud for helpful discussions on the nature of normal modes. This research was supported by the U.S. Department of Energy, Office of Science, Basic Energy Sciences, Materials Sciences and Engineering Division. This work used the Extreme Science and Engineering Discovery Environment (XSEDE) Expanse under Allocation No. TG-MAT200012. This research used resources of the National Energy Research Scientific Computing Center (NERSC), a U.S. Department of Energy Office of Science User Facility located at Lawrence Berkeley National Laboratory, operated under Contract No. DE-AC02-05CH11231 using NERSC award BES-ERCAPERCAP0020503.
Data Availability
All data are included in the text.
References
- Dove [1993] M. T. Dove, Introduction to lattice dynamics, Vol. 4 (Cambridge university press, 1993).
- Case [1994] D. A. Case, Normal mode analysis of protein dynamics, Current Opinion in Structural Biology 4, 285 (1994).
- Sun et al. [2020] B. Sun, S. Niu, R. P. Hermann, J. Moon, N. Shulumba, K. Page, B. Zhao, A. S. Thind, K. Mahalingam, J. Milam-Guerrero, R. Haiges, M. Mecklenburg, B. C. Melot, Y.-D. Jho, B. M. Howe, R. Mishra, A. Alatas, B. Winn, M. E. Manley, J. Ravichandran, and A. J. Minnich, High frequency atomic tunneling yields ultralow and glass-like thermal conductivity in chalcogenide single crystals, Nature Communications 11, 6039 (2020), number: 1 Publisher: Nature Publishing Group.
- Lindsay et al. [2018] L. Lindsay, C. Hua, X. L. Ruan, and S. Lee, Survey of ab initio phonon thermal transport, Materials Today Physics 7, 106 (2018).
- McGaughey et al. [2019] A. J. H. McGaughey, A. Jain, H.-Y. Kim, and B. Fu, Phonon properties and thermal conductivity from first principles, lattice dynamics, and the Boltzmann transport equation, Journal of Applied Physics 125, 011101 (2019).
- Togo and Tanaka [2015] A. Togo and I. Tanaka, First principles phonon calculations in materials science, Scripta Materialia 108, 1 (2015).
- Cho et al. [1994] M. Cho, G. R. Fleming, S. Saito, I. Ohmine, and R. M. Stratt, Instantaneous normal mode analysis of liquid water, The Journal of Chemical Physics 100, 6672 (1994).
- Keyes [1997] T. Keyes, Instantaneous Normal Mode Approach to Liquid State Dynamics, The Journal of Physical Chemistry A 101, 2921 (1997).
- Seeley et al. [1991] G. Seeley, T. Keyes, and B. Madan, Isobaric diffusion constants in simple liquids and normal mode analysis, The Journal of Chemical Physics 95, 3847 (1991).
- Seeley and Keyes [1989] G. Seeley and T. Keyes, Normal‐mode analysis of liquid‐state dynamics, The Journal of Chemical Physics 91, 5581 (1989).
- Gezelter et al. [1997] J. D. Gezelter, E. Rabani, and B. J. Berne, Can imaginary instantaneous normal mode frequencies predict barriers to self-diffusion?, J. Chem. Phys. 107, 11 (1997).
- Clapa et al. [2012] V. I. Clapa, T. Kottos, and F. W. Starr, Localization transition of instantaneous normal modes and liquid diffusion, The Journal of Chemical Physics 136, 144504 (2012).
- Schirmacher et al. [2022] W. Schirmacher, T. Bryk, and G. Ruocco, Modeling the instantaneous normal mode spectra of liquids as that of unstable elastic media, Proceedings of the National Academy of Sciences 119, e2119288119 (2022).
- Zaccone and Baggioli [2021] A. Zaccone and M. Baggioli, Universal law for the vibrational density of states of liquids, Proceedings of the National Academy of Sciences 118, e2022303118 (2021).
- Stratt [1995] R. M. Stratt, The Instantaneous Normal Modes of Liquids, Accounts of Chemical Research 28, 7 (1995).
- Zhang et al. [2019] W. Zhang, J. F. Douglas, and F. W. Starr, What does the instantaneous normal mode spectrum tell us about dynamical heterogeneity in glass-forming fluids?, The Journal of Chemical Physics 151, 184904 (2019).
- Bembenek and Laird [1995] S. D. Bembenek and B. B. Laird, Instantaneous Normal Modes and the Glass Transition, Physical Review Letters 74, 4 (1995).
- Bembenek and Laird [2001] S. D. Bembenek and B. B. Laird, Instantaneous normal modes analysis of amorphous and supercooled silica, The Journal of Chemical Physics 114, 2340 (2001).
- Melzer et al. [2012] A. Melzer, A. Schella, J. Schablinski, D. Block, and A. Piel, Instantaneous Normal Mode Analysis of Melting of Finite Dust Clusters, Physical Review Letters , 5 (2012).
- Plimpton [1995] S. Plimpton, Fast parallel algorithms for short-range molecular dynamics, Journal of computational physics 117, 1 (1995).
- Jones [1924a] J. E. Jones, On the determination of molecular fields. —II. From the equation of state of a gas, Proceedings of the Royal Society of London. Series A, Containing Papers of a Mathematical and Physical Character 106, 463 (1924a).
- Jones [1924b] J. E. Jones, On the determination of molecular fields.—I. From the variation of the viscosity of a gas with temperature, Proceedings of the Royal Society of London. Series A, Containing Papers of a Mathematical and Physical Character 106, 441 (1924b).
- Rahman et al. [1976] A. Rahman, M. J. Mandell, and J. P. McTague, Molecular dynamics study of an amorphous Lennard‐Jones system at low temperature, The Journal of Chemical Physics 64, 1564 (1976).
- Gale [1997] J. D. Gale, GULP: A computer program for the symmetry-adapted simulation of solids, Journal of the Chemical Society, Faraday Transactions 93, 629 (1997).
- McQuarrie [2000] D. A. McQuarrie, Statistical Mechanics (Sterling Publishing Company, 2000).
- Bell and Dean [1970] R. J. Bell and P. Dean, Atomic vibrations in vitreous silica, Discussions of the Faraday society 50, 55 (1970).
- Moon and Minnich [2016] J. Moon and A. J. Minnich, Sub-amorphous thermal conductivity in amorphous heterogeneous nanocomposites, RSC Advances 6, 105154 (2016).
- DeAngelis et al. [2018] F. DeAngelis, M. G. Muraleedharan, J. Moon, H. R. Seyf, A. J. Minnich, A. J. H. McGaughey, and A. Henry, Thermal Transport in Disordered Materials, Nanoscale and Microscale Thermophysical Engineering (2018).
- Lindsay et al. [2013] L. Lindsay, D. A. Broido, and T. L. Reinecke, Phonon-isotope scattering and thermal conductivity in materials with a large isotope effect: A first-principles study, Physical Review B 88, 144306 (2013), publisher: American Physical Society.
- Bell and Hibbins-Butler [1975] R. J. Bell and D. C. Hibbins-Butler, Acoustic and optical modes in vitreous silica, germania and beryllium fluoride, Journal of Physics C: Solid State Physics 8, 787 (1975).
- Allen et al. [1999] P. B. Allen, J. L. Feldman, J. Fabian, and F. Wooten, Diffusons, locons and propagons: Character of atomie yibrations in amorphous Si, Philosophical Magazine B 79, 1715 (1999).
- Seyf et al. [2018] H. R. Seyf, W. Lv, A. Rohskopf, and A. Henry, The Importance of Phonons with Negative Phase Quotient in Disordered Solids, Scientific Reports 8, 2627 (2018).
- Kittel [1976] C. Kittel, Introduction to solid state physics. Fifth edition (1976).
- Seyf and Henry [2016] H. R. Seyf and A. Henry, A method for distinguishing between propagons, diffusions, and locons, Journal of Applied Physics 120, 025101 (2016).
- Aryana et al. [2021] K. Aryana, D. A. Stewart, J. T. Gaskins, J. Nag, J. C. Read, D. H. Olson, M. K. Grobis, and P. E. Hopkins, Tuning network topology and vibrational mode localization to achieve ultralow thermal conductivity in amorphous chalcogenides, Nature Communications 12, 2817 (2021), number: 1 Publisher: Nature Publishing Group.
- Feldman et al. [1999] J. L. Feldman, P. B. Allen, and S. R. Bickham, Numerical study of low-frequency vibrations in amorphous silicon, Physical Review B 59, 3551 (1999).
- Moon et al. [2018] J. Moon, B. Latour, and A. J. Minnich, Propagating elastic vibrations dominate thermal conduction in amorphous silicon, Physical Review B 97, 10.1103/PhysRevB.97.024201 (2018).
- Kim et al. [2021] T. Kim, J. Moon, and A. J. Minnich, Origin of micrometer-scale propagation lengths of heat-carrying acoustic excitations in amorphous silicon, Physical Review Materials 5, 065602 (2021), publisher: American Physical Society.
- Moon et al. [2022] J. Moon, S. Thébaud, L. Lindsay, and T. Egami, Microscopic view of heat capacity of matter: solid, liquid, and gas, arXiv preprint arXiv:2210.06218 (2022).
- Zwanzig [1983] R. Zwanzig, On the relation between self‐diffusion and viscosity of liquids, The Journal of Chemical Physics 79, 4507 (1983).
- Nave et al. [2000] E. L. Nave, A. Scala, F. W. Starr, F. Sciortino, and H. E. Stanley, Instantaneous Normal Mode Analysis of Supercooled Water, Physical Review Letters 84, 4 (2000).
- Baggioli and Zaccone [2021] M. Baggioli and A. Zaccone, Explaining the specific heat of liquids based on instantaneous normal modes, Physical Review E 104, 014103 (2021), publisher: American Physical Society.
- Bonasera and Gulminelli [1991] A. Bonasera and F. Gulminelli, Competition between two- and three-body collisions in a dense gas at finite temperature, Physics Letters B 259, 399 (1991).
- Allen and Feldman [1989] P. B. Allen and J. L. Feldman, Thermal conductivity of glasses: Theory and application to amorphous Si, Physical Review Letters 62, 645 (1989).
- Moon [2021] J. Moon, Examining normal modes as fundamental heat carriers in amorphous solids: The case of amorphous silicon, Journal of Applied Physics 130, 055101 (2021), publisher: American Institute of Physics.