Conformational and state-specific effects
in reactions of 2,3-dibromobutadiene with Coulomb-crystallized calcium ions
Abstract
Recent advances in experimental methodology enabled studies of the quantum-state- and conformational dependence of chemical reactions under precisely controlled conditions in the gas phase. Here, we generated samples of selected gauche and s-trans 2,3-dibromobutadiene (DBB) by electrostatic deflection in a molecular beam and studied their reaction with Coulomb crystals of laser-cooled ions in an ion trap. The rate coefficients for the total reaction were found to strongly depend on both the conformation of DBB and the electronic state of . In the and excited states of , the reaction is capture-limited and faster for the gauche conformer due to long-range ion-dipole interactions. In the ground state of , the reaction rate for s-trans DBB still conforms with the capture limit, while that for gauche DBB is strongly suppressed. The experimental observations were analysed with the help of adiabatic capture theory, ab-initio calculations and reactive molecular dynamics simulations on a machine-learned full-dimensional potential energy surface of the system. The theory yields near-quantitative agreement for s-trans-DBB, but overestimates the reactivity of the gauche- conformer compared to the experiment. The present study points to the important role of molecular geometry even in strongly reactive exothermic systems and illustrates striking differences in the reactivity of individual conformers in gas-phase ion-molecule reactions.
1 Department of Chemistry, University of Basel, Klingelbergstrasse 80, 4056 Basel, Switzerland
2 Center for Free-Electron Laser Science CFEL, Deutsches Elektronen-Synchrotron DESY, Notkestr. 85, 22607 Hamburg, Germany
3 Vector Institute for Artificial Intelligence, Toronto, ON, M5S 1M1, Canada
4 Departments of Chemistry, Materials Science and Engineering, and Physics, University of Toronto, St. George Campus, Toronto, ON M5S 3H6, Canada
5 Machine Learning Group, Technische Universität Berlin, 10587 Berlin, Germany
6 Berlin Institute for the Foundations of Learning and Data – BIFOLD, Germany
7 Department of Physics, Universität Hamburg, Luruper Chaussee 149, 22761 Hamburg, Germany
8 Department of Chemistry, Universität Hamburg, Martin-Luther-King-Platz 6, 20146 Hamburg, Germany
9 Center for Ultrafast Imaging, Universität Hamburg, Luruper Chaussee 149, 22761 Hamburg, Germany
10 Department of Chemistry, Brown University, Providence, RI 02912, USA
a Present address: Novartis Institutes for Biomedical Research, Fabrikstrasse 2, 4056 Basel, Switzerland
b Present address: Department of Chemistry, University of Hawaii at Manoa, Honolulu, HI 96822, USA
c Present address: Fraunhofer Institute for Applied Solid State Physics IAF, Tullastrasse 72, 79108 Freiburg, Germany
These authors contributed equally to the present work.
Electronic mail: jochen.kuepper@cfel.de, m.meuwly@unibas.ch, stefan.willitsch@unibas.ch
In memoriam Max Schwilk (1986-2022)
Introduction
Gas-phase ion-molecule reactions play a key role in the ionosphere of the earth and in interstellar clouds [1, 2, 3] as well as in the context of catalysis, where gas-phase studies can help to elucidate the mechanisms of bond activation [4, 5]. As experiments are advancing to probe ever more complex systems [6, 7], the precise molecular geometry, and in particular the molecular conformation, becomes increasingly important for the reaction dynamics. Thus, new experimental methods become necessary which are capable of isolating individual conformers in the gas phase in order to study their specific reactivities. In this context, we recently developed a new technique for the investigation of conformational effects in ion-molecule reactions based on trapped and laser-cooled atomic ions forming Coulomb crystals [8, 6]. Coulomb crystals can be considered as reaction vessels in which reactant and product molecular ions can be co-trapped and cooled sympathetically by the laser-cooled species [9, 10]. The neutral co-reactant is introduced into the experiment in a molecular beam passing through an inhomogeneous electrostatic field where molecular conformations with different electric dipole moments in the laboratory frame are spatially separated [11, 12, 13, 14, 15, 16, 17]. This approach recently enabled studies of reactions of ions with individual conformations [14, 18] and also selected rotational states [19] of neutral molecules, which pointed to the important role of conformer- and state-specific long-range interactions governing both the dynamics and kinetics in these systems. In these cases, capture theories [20, 21, 22] could be successfully applied to model rate coefficients.
To gain deeper insight into fundamental mechanisms of conformational dynamics in gas-phase ion-molecule processes, we here performed kinetic measurements of trapped Ca+ ions reacting with a molecular beam of 2,3-dibromobutadiene (DBB) molecules using an electrostatic deflector [13] to separate its gauche and s-trans conformers [17]. Already a number of previous studies focused on ion-molecule reactions of atomic ions with supersonic beams or thermal samples of neutral molecules, see, e.g., Refs. [4, 5] for an overview. Studies on singly charged alkaline-earth ions, e.g., Mg+ [23, 24] and Ca+ [25, 26, 27, 14, 28, 29], often found that fast reactions proceeded from excited electronic states of the metal ion while reactions involving the ground state were found to be kinetically hindered. By contrast, we showed that for the present system the reaction rate of Ca+ with s-trans DBB is capture-limited irrespective of the electronic state of Ca+, i.e. (4s)2S1/2, (4p)2P1/2 or (3d)2D3/2. Conversely, for the gauche conformer we found that the reaction is capture-limited only with Ca+ in its 2P1/2 or 2D3/2 excited states. In the 2S1/2 ground state, however, the reaction rate is strongly suppressed pointing to a pronounced conformational effect governing the ground-state reaction dynamics.
To rationalize the experimental findings, we modelled the kinetics and dynamics using adiabatic capture theory [30] and reactive molecular dynamics simulations on a full-dimensional potential energy surface (PES) of the system trained on the results of ab initio calculations by a neural network (NN). The theory yields excellent agreement with experiment for the reaction of s-trans-DBB, but overestimates the reactivity of the gauche- conformer by almost an order of magnitude suggesting the presence of an as yet unaccounted dynamic bottleneck along the gauche reaction pathway. Possible explanations are discussed. The present study highlights the important role of molecular conformation in gas-phase ion-molecule reactions of polyatomic species and the role of both long-range and short-range effects in determining conformational differences in chemical reactivity.
Results
Experimental setup
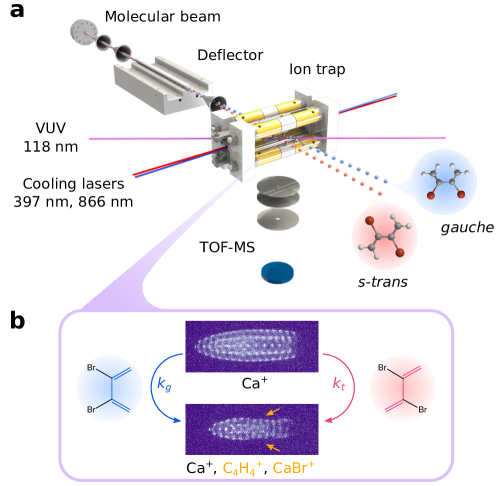
The experimental setup, Fig. 1a, consisted of a molecular beam apparatus interfaced with an ion trap, see Methods and references [14, 19, 17]. Briefly, an internally cold beam of the neutral reaction partner DBB seeded in neon carrier gas was formed by pulsed supersonic expansion and passed through a series of skimmers and an electrostatic deflector before it reached the ion trap. The deflector’s inhomogeneous electric field allowed the separation of the polar gauche conformer of DBB (dipole moment D) from the apolar s-trans conformer (). In the ion trap, laser-cooled Ca+ ions formed a Coulomb crystal [6] and served as a collision target for the molecular beam. Different conformers of DBB were selectively brought into reaction with the Ca+ ions by vertically tilting the molecular beam apparatus.
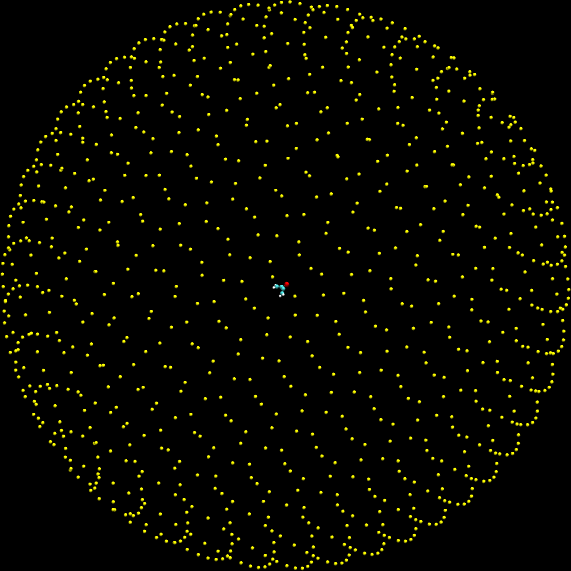
The reaction of Ca+ with the gauche and s-trans DBB conformers proceeded via individual pathways with bimolecular reaction rate coefficients and , respectively (Fig. 1b). Throughout the reaction, the fluorescence of Ca+ ions due to laser cooling on the transition at 397 nm was imaged onto a camera (Fig. 1b). As the reactions progressed, the Coulomb crystals changed shape due to loss of Ca+ ions and accumulation of heavier product ions around the Ca+ core. Quantitative analysis of the reaction kinetics and products was performed by ejecting the trapped ions into a time-of-flight mass-spectrometer (TOF-MS) radially coupled to the ion trap [31].
Reaction products
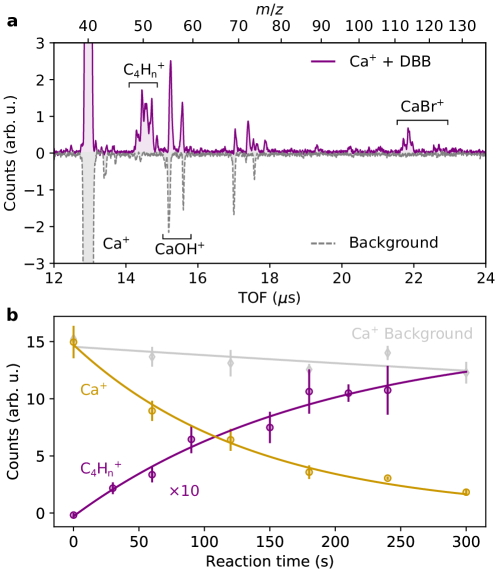
As a first step, the product ions of the reaction were characterized using the TOF-MS after a reaction time of 2 minutes (Fig. 2). The electrostatic deflector was switched off and a high-flux molecular beam of DBB with a thermal (300 K) gauche:trans conformer mixture of [17] was directed at the ion trap. TOF-MS traces averaged over 45 experiments are displayed in Fig. 2a and compared against a control experiment in which the molecular beam did not contain DBB (grey inverted trace). Besides a dominant peak corresponding to Ca+ (40 u) at a time of flight of s, the spectra contain four main features that were assigned to specific molecular compounds with assistance of molecular dynamics simulations (see Sec. S2 in the Supplementary Information). The main background signal at s corresponds to CaOH+ (57 u), formed by the reaction of Ca+ with residual water in the vacuum chamber (pressure mbar). Another weaker impurity signal around s with approximate mass 72 u could be due to CaO [29]. Clearly, ions forming uniquely as products of the reaction were observed at s and s and were identified as (–4, 50 – 52 u) and CaBr+ (119 and 121 u), respectively. Another possible reaction product could be CaBr (200 u), which was however not detected (see Sec. S2 in the Supplementary Information). Excess kinetic energy after the reaction or excitation by the UV cooling laser for Ca+ could lead to its rapid dissociation to CaBr+. A (H)Br+ fragment was also not detected. Consequently, the reaction leads to a Br-abstraction from DBB and a localisation of the charge on either CaBr+ or the butadiene moiety. The observation of fragments points to H-loss from the expected product [32]. The reaction kinetics for the observed products and CaBr+ can thus be modeled using the following equations,
| (1) | |||||
| (2) |
with bimolecular rate coefficients . To explore the reaction kinetics, the number of Ca+ and ions were determined as a function of reaction time using the TOF-MS in high-resolution mode [31] in separate experiments (Fig. 2b). The event rate of CaBr+ detection was too low to measure its kinetics of formation with sufficient statistics. Fig. 2b compares the decrease of Ca+ ions in the crystal due to reaction with DBB (yellow data points) with the formation of the product fragment (purple points). The data of the latter are scaled by a factor of 10 for clarity. For reference, decay of Ca+ caused by background collisions is also shown (grey points). Due to the constant DBB density in the molecular beam, the reaction kinetics was modeled using a pseudo-first-order rate law, i.e.
| (3) | |||||
| (4) |
Here, , is the total decay rate of Ca+ and are pseudo-first-order rate coefficients. The solutions are
| (5) | |||||
| (6) |
where is the initial Ca+ density at . The equations (5) and (6) were independently fitted to the corresponding data (solid lines in Fig. 2b) to determine . From the fit of equation (6) to the data, a value was found. Fitting the Ca+ decay using equation (5) yields a value of after background correction. The good agreement between the two independently determined values for confirms that is indeed a product of the bimolecular reaction (2). The small yield of indicates a small branching ratio . The kinetic model then implies that CaBr+ should be formed in much larger quantities, which is however not observed in the TOF-MS (Fig. 2a) An explanation could be increased loss of heavier product ions from the ion trap. The effective rf-trapping potential is inversely proportional to the ion mass, which leads to their localization further away from the laser-cooled Ca+ core and renders sympathetic cooling less efficient [33].
Conformer-specific rate coefficients
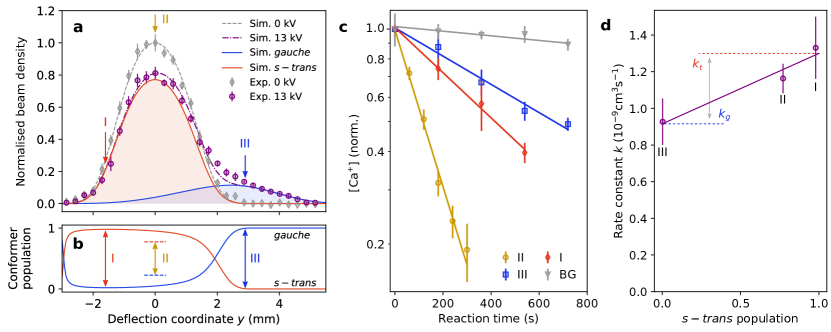
To investigate the effect of the molecular conformation of DBB on the reaction kinetics, the electrostatic deflector was used to prepare samples with well-defined conformational compositions. A density profile of the DBB molecular beam along the deflection coordinate (a deflection profile) was measured by vacuum ultraviolet (VUV) ionization of DBB at the position of the ion trap (Fig. 3a) [17]. With the deflector turned off (deflector voltage 0 kV), the molecular beam contained a thermal 1:3.3 mixture of the gauche and s-trans conformers of DBB, respectively. At a deflector voltage of 13 kV, the gauche-DBB conformers were deflected away from s-trans-DBB in the beam and produced a shoulder at high deflection coordinates in the density profile. A Monte Carlo simulation of deflected DBB trajectories yielded good agreement with the experimental data for a rotational temperature of 1 K and independently measured beam velocity [17]. At 13 kV, the time-averaged peak density of DBB was measured to be .
The Monte Carlo simulation was used to determine the conformer populations as a function of deflection coordinate (Fig. 3b). Three beam positions, marked I–III in Figs. 3a and b, corresponding to the pure s-trans conformer (I), thermal mixture (II) in undeflected beam, and the pure gauche conformer (III), were chosen for reaction rate measurements. In each position, the Ca+ ion count was measured as a function of reaction time (Fig. 3c). The background loss rate of Ca+ was determined separately by adjusting the molecular beam such that it did not hit the Coulomb crystal (grey data points in Fig. 3c). All traces exhibit an exponential decay of the number of Ca+ ions which confirms the validity of using a pseudo-first-order rate law for the bimolecular reaction of with a constant DBB density. Pseudo first-order rate coefficients () were obtained by fitting exponential-decay models to the data and subtracting the corresponding background rate. From the , the bimolecular rate coefficients were calculated using the DBB beam densities at each position =I, II, III in the deflection profile.
Figure 3d shows the measured bimolecular rate coefficients as a function of the s-trans population obtained from the Monte-Carlo simulation. The bimolecular rate coefficient for the depletion of Ca+ was modeled as the linear combination of the conformer-specific rate coefficients (gauche/s-trans). The weighting factors are the respective conformer populations at location (Fig. 3b). A least-squares fit (solid line in Fig. 3d) with this model was applied to the data and yielded the bimolecular reaction rate coefficients for the gauche-conformer and for the s-trans-conformer. This implies a relative difference by which the s-trans-conformer is observed to react faster than the gauche-conformer.
State-specific rate coefficients
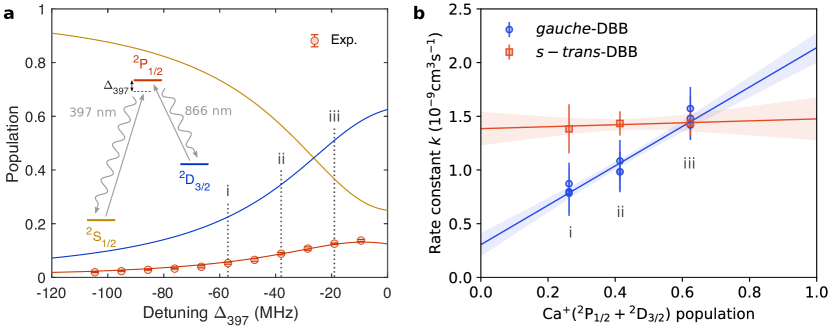
Because the Ca+ ions were constantly laser-cooled in the experiment, reactive collisions with DBB could occur in any of the electronic states , and addressed by the laser excitation (see inset of Fig. 4a). Thus, the measured reaction rate coefficients represent an average over the states involved weighted by their populations. In order to obtain state-specific rate coefficients, reaction rates were measured in different configurations of Ca+ state populations. Control over the populations was achieved by adjusting the frequency detuning of the cooling and repumping lasers from the (397 nm) and (866 nm) transitions, respectively. The fluorescence of Ca+ generated on the transition was measured as a function of the laser detunings as well as polarization and modeled using optical Bloch equations to calibrate the average populations in the , and electronic states (see ref. [34] and Sec. S3 in the Supplementary Information). Fig. 4a shows the dependence of the level populations of Ca+ on the detuning of the cooling laser, with the red circles representing the experimental state populations determined from the fluorescence measurements and the solid lines representing the results of the theoretical model. The excited-state and populations increase with decreasing detuning, while the ground-state population decreases.
To measure the reaction rate coefficients as a function of the excited-state population of Ca+, a set of detunings of the 397 nm laser labelled i–iii in Fig. 4a was chosen that samples a combined population between 0.25 and 0.7. At each detuning, one rate measurement was conducted with pure s-trans DBB (molecular beam position I in Fig. 3a) and three measurements for pure gauche DBB (molecular beam position III). Results of the state- and conformer-resolved rate measurements are presented in Fig. 4b. A linear model was fitted to the measured rate coefficients as a function of the excited state population () to retrieve the ground-state () and excited-state () rate coefficients. Due to the strong correlation between the populations and rate coefficients in the and states obtained in the fit, no statements about their individual reaction rates could be made and only the effective rate coefficient averaged over both excited states is given.
Strikingly, the observed dependence of the rate coefficient on the Ca+ excited state population differs strongly between the two conformers of DBB. While the rate coefficient remains nearly constant for s-trans-DBB, a clear increase with excited-state population is observed for the gauche conformer, pointing to a considerably reduced reaction rate for the gauche species with ground-state Ca+. The fitted bimolecular rate coefficients of s-trans DBB with Ca+ in ground and excited states, and , respectively, lie within one standard deviation from each other. For the gauche conformer, however, the fitted bimolecular rate coefficients are for Ca+ in its ground state and for the excited states.
Adiabatic capture theory
Ion-molecule reactions often involve barrierless processes governed by long-range electrostatic interactions in which case capture models can be employed to model the kinetics [21]. In order to rationalize the different rate coefficients observed for the two DBB conformers in reactions with Ca+, a rotationally adiabatic capture theory [20, 30] was employed (see Sec. S2 in the Supplementary Information). At the collision energy and rotational temperature of DBB in the present experiments, the calculation yields bimolecular rate coefficients of for gauche-DBB and for s-trans-DBB, with a calculated relative difference between the gauche and s-trans conformers of .
The measured rate coefficient for the s-trans conformer agrees with the calculated value within the uncertainty limits. By contrast, for the reaction of gauche-DBB with Ca+ in its ground electronic state, adiabatic capture theory predicts a reaction rate coefficient about an order of magnitude larger than the experimental results. For reactions with electronically excited Ca+ ions, however, capture theory and experiment again agree within the experimental uncertainties. It can thus be concluded that all but one combinations of both conformers of DBB and the electronic states of Ca+ considered, the kinetics and dynamics of the title reaction can adequately be described by capture theory and are thus governed by long-range intermolecular forces, in this case ion-dipole interactions. The exception is the reaction of gauche-DBB with Ca+ in its ground state, which was found to be considerably slower than the capture limit. Thus, in order to gain a more in-depth understanding of the reaction dynamics, additional computational studies were carried out including electronic structure calculations and reactive molecular dynamics simulations.
Potential energy surface and reaction pathways
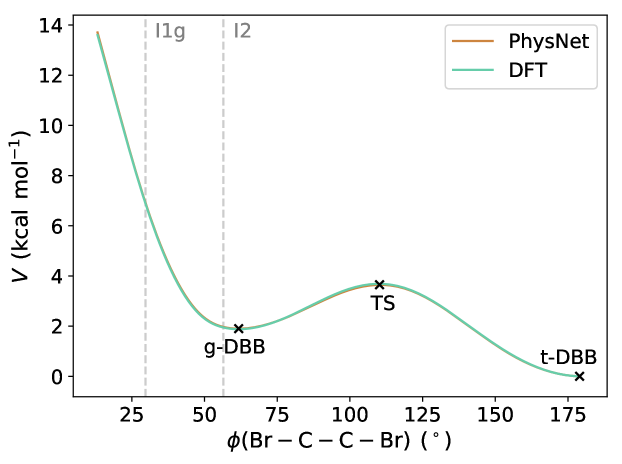
To gain further insights into conformationally dependent reaction pathways of the title reaction and rationalize the experimental findings, quantum-chemical calculations of the PES were performed. Recent calculations at the explicitly correlated coupled cluster level of theory [CCSD(T)-F12] revealed that gauche-DBB lies 0.049 eV [2.22 kcal/mol] higher in energy than s-trans DBB and that an activation barrier of 0.18 eV [4.15 kcal/mol] is required to interconvert the two conformers by torsion along the central C-C bond [17].
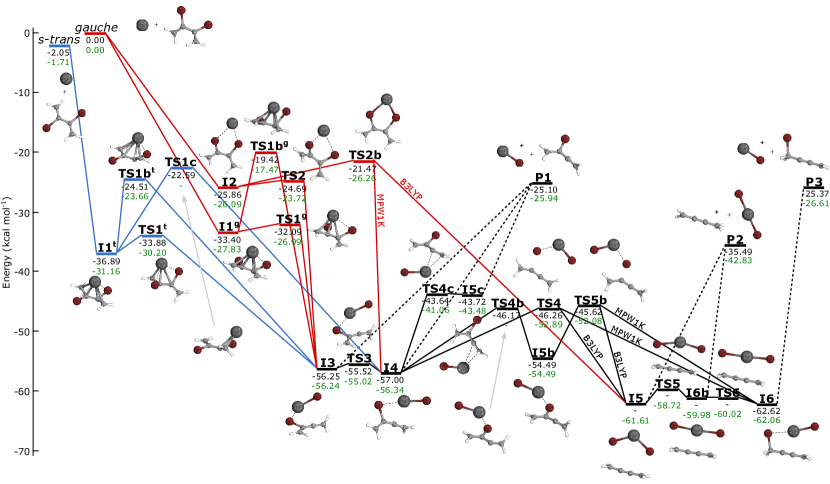
Fig. 5 depicts the energetically lowest reaction channels found by a scan of possible chemically distinct reaction pathways, as well as products, based on the assumption that the formation of the Ca-Br ionic bond is the driving force of the overall reaction. Fig. S6 of the SI shows all reaction pathways identified including ones with higher barriers. Intrinsic reaction coordinates (IRCs) and zero-point-energy corrections have been obtained at the spin-unrestricted B3LYP/TZ level of theory. Electronic energies of the stationary points have been recomputed at the CCSD(T)-F12/DZ level of theory. All computational details, including quality checks for the IRCs and single-reference-character checks of the PES are described in the Methods section and the Supplementary Information. Spin-restricted Hartree-Fock and B3LYP orbitals of the stationary-point structures were used for a chemical analysis of the reaction channels (the most important valence orbitals for every stationary state compound are depicted in Tables S4 and S5 of the Supplementary Information.).
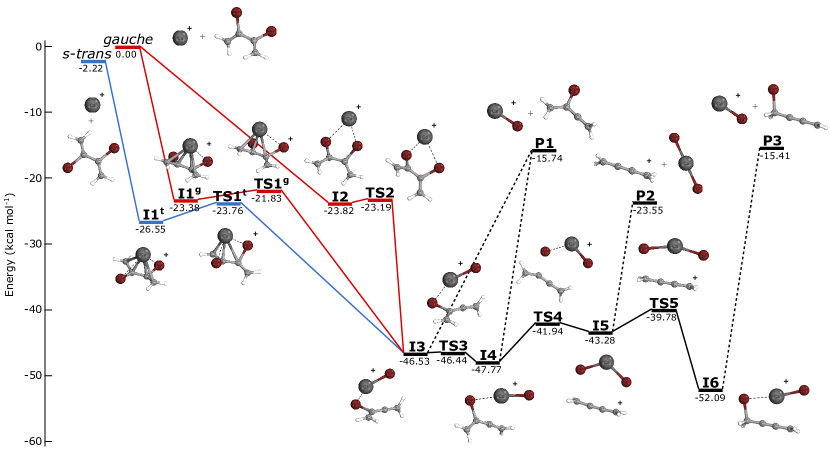
The reaction of CaS1/2 with DBB can initiate via the addition of Ca+ to either the bromine moieties or to the -electron system of DBB. The relevant reaction intermediates are shown in Fig. 5 (I2 and I1t/g). For both s-trans-DBB and gauche-DBB, an -coordination of a singly occupied orbital of the system of DBB- to Ca2+ emerges as a stable intermediate (I1t/g) with similar energies. In these intermediates, a single electron transfer from Ca+ to DBB has occurred and the Ca2+ moiety is stabilized by strong -back-donation from the bromine atoms. Our results suggest that the s-trans adduct is energetically slightly favoured over the gauche adduct (energy difference kcal/mol [0.13 eV]). For gauche-DBB, we also found an adduct intermediate I2 similar in energy to I1g in which both bromine groups coordinate to Ca+. In this case, the calcium moiety has not undergone an electron transfer. These intermediates in the three entrance channels stabilize by 23–25 kcal/mol (1.00–1.08 eV) with respect to their reactant state via a barrier-less reaction path.
From all three entrance-channel intermediates (I1t/g and I2), a Br- migration from the DBB moiety to calcium over a low-lying transition state (activation energy 3 kcal/mol [0.13 eV]) was found forming intermediate I3. This intermediate displays a strong energetic stabilisation (46.5 kcal/mol [2.02 eV] with respect to the gauche-DBB reactant state) and exhibits an allene radical structure with the remaining DBB bromine coordinatively binding to CaBr+. CaBr+ dissociation from I3 yields the product P1 (CaBr+, C4H4Br) which is energetically stabilized by 15.7 kcal/mol (0.68 eV) with respect to the gauche-DBB reactant state. The ionic product of this pathway, CaBr+, is observed in the experimental mass spectra (Fig. 2 (a)).
Another pathway originating from I3 via its conformer I4 was found to feature a second Br- migration to CaBr+ via TS4 to I5. In I5, perpendicular and systems have formed with the singly occupied molecular orbital (SOMO) being the HOMO of the system (for depictions of the orbitals see Table S4 of the SI). Strong -back-donation from CaBr2 stabilizes the uncommon electronic structure of the C4H species . Dissociation of CaBr2 then results in the energetically most favoured product P2 (CaBr2, C4H) where the SOMO exhibits a spiral -system, typical for cumulenes. P2 is energetically stabilized with respect to the gauche-DBB reactant state by 23.6 kcal/mol (1.02 eV). The ionic product of this pathway, C4H, and fragmentation products thereof are observed in the experimental mass spectra (Fig. 2 (a)). I5 was also found to connect to a 1,2-migration of Br- to the terminal carbon center, yielding I6 which also exhibits an allene-radical electronic structure. This low-energy structure (stabilized by kcal/mol (2.26 eV) with respect to the gauche-DBB reactant state) can then evolve via CaBr+ dissociation to P3 (CaBr+, C4H4Br) which is close in energy to P1.
The initial confomer-specific reaction channels connect to the same intermediates after the first Br- migration in the formation of I3. All barriers found are clearly submerged below the energies of the reactants, rendering all studied reaction pathways effectively barrierless. For the reaction of the s-trans conformer, this finding rationalizes the good agreement between the experimental and theoretical rate coefficient which was computed assuming barrierless capture dynamics. However, the barrierless minimum-energy paths displayed in Fig. 5 do not provide an explanation for the significantly lower reaction-rate coefficient observed for gauche-DBB.
Reaction Rates from Reactive Molecular Dynamics Simulations
To gain further insight into the underlying reaction dynamics, reactive molecular dynamics simulations were performed on a full-dimensional machine learned PES trained on reference data at the DFT level using the PhysNet deep NN [35]. Reaction rates for both the gauche and s-trans conformers were computed from opacity functions derived from their respective reactive trajectories (see Methods).
Opacity functions and role of molecular rotation:
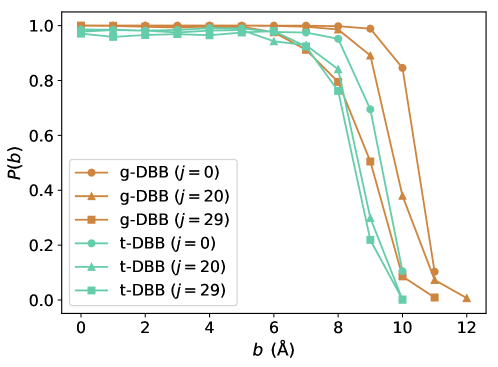
Opacity functions for reactive collisions of the gauche and s-trans conformers are shown in Fig. 6. The results were obtained starting from 1 000 initial conditions per impact factor interval. To assess the role of rotational excitation in the dynamics, opacity functions were obtained for a range of rotational energies of the molecule corresponding to different rotational angular momentum quantum numbers . The data suggest that the capture range for gauche-DBB is larger by pm than for the s-trans conformer, irrespective of the molecular rotation. For both isomers, however, rotational excitation reduces the capture range leading to a smaller maximum impact parameter and thus a reduced reaction rate. Note that corresponds to rotational energies and kcal/mol (3.90 and 7.81 meV) for gauche-DBB and s-trans-DBB, respectively, while for , the corresponding values are and kcal/mol (8.24 and 16.48 meV). Under the present experimental conditions, both gauche- and s-trans-DBB populate considerably lower rotational levels with the largest population found in [17]. Thus, in the experiment kcal/mol (0.43 meV). Consequently, based on the present MD simulations, it can be surmised that the small rotational excitation of the molecules has a small influence on the observed reaction rates. We note, however, that these MD simulations, due to their purely classical-electrodynamics description, cannot reproduce effects due to weak-field-seeking behaviour in the approach of the molecule and ion.
Reaction rate coefficients:
The reaction rate coefficients computed from the opacity function in Fig. 6 are listed in Tab. 1. Irrespective of rotation, the computed rate coefficients for gauche-DBB are larger by about 20% compared to the s-trans conformer. The rate coefficients obtained from the simulations are in good agreement with the capture theory and with experiment for the s-trans conformer, but fail to reproduce the experimental rate coefficient for reactions with gauche-DBB.
| gauche | s-trans | |
|---|---|---|
| PhysNet () | 2.510-9 | 2.010-9 |
| PhysNet () | 2.210-9 | 1.510-9 |
| PhysNet () | 1.710-9 | 1.510-9 |
| Capture Theory | 2.410-9 | 1.310-9 |
| Exp. | 3(2)10-10 | 1.4(3)10-9 |
DBB Reorientation Dynamics:
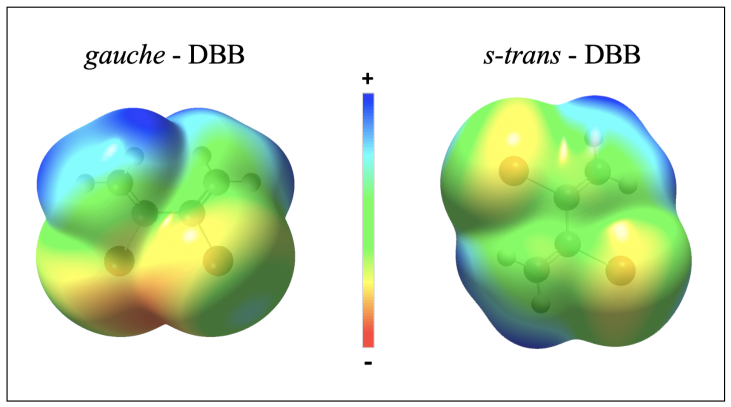
One difference between the two DBB isomers is that gauche-DBB features an ion-dipole barrier of kcal/mol (0.13 eV) for certain directions of approach in the entrance channel whereas for s-trans-DBB this barrier is considerably lower ( kcal/mol [0.043 eV]). If the dynamics was sensitive to such a barrier in the entrance channel, this could explain the reduction of the rate for gauche- vs. s-trans-DBB. In order to test this hypothesis explicitly and to better characterize the underlying dynamics, 1000
trajectories with impact parameter Å were analysed for both,
gauche- and s-trans-DBB. For the polar gauche conformer, the long-range ion-dipole interaction with Ca+ causes about 50 %
of the area of the molecule to be shielded by a repulsive ion-dipole barrier that
raises up to kcal/mol (0.13 eV).
This might suggest that collisions along
these directions lead to unproductive collisions and therefore reduce
the total rate.
For trans-DBB, lower repulsive barriers with heights kcal/mol (0.043 eV) covering about % of the circumference were found along
the approach of Ca+ towards the two methylene groups.
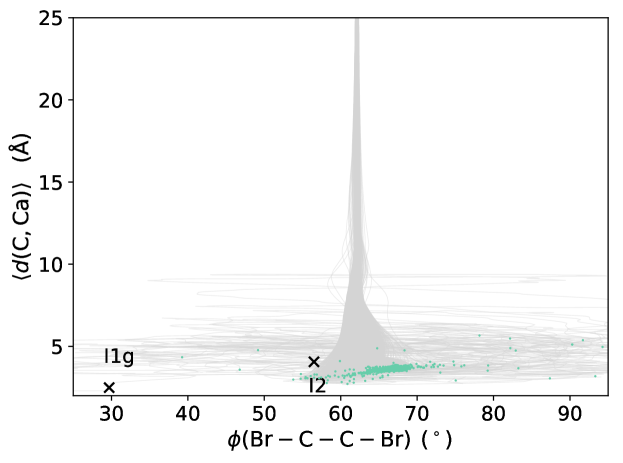
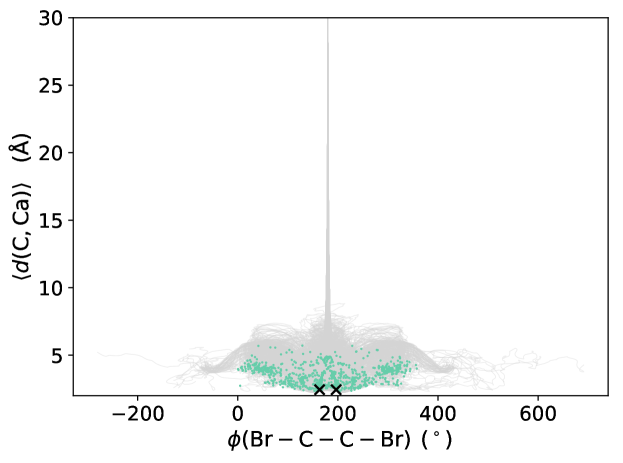
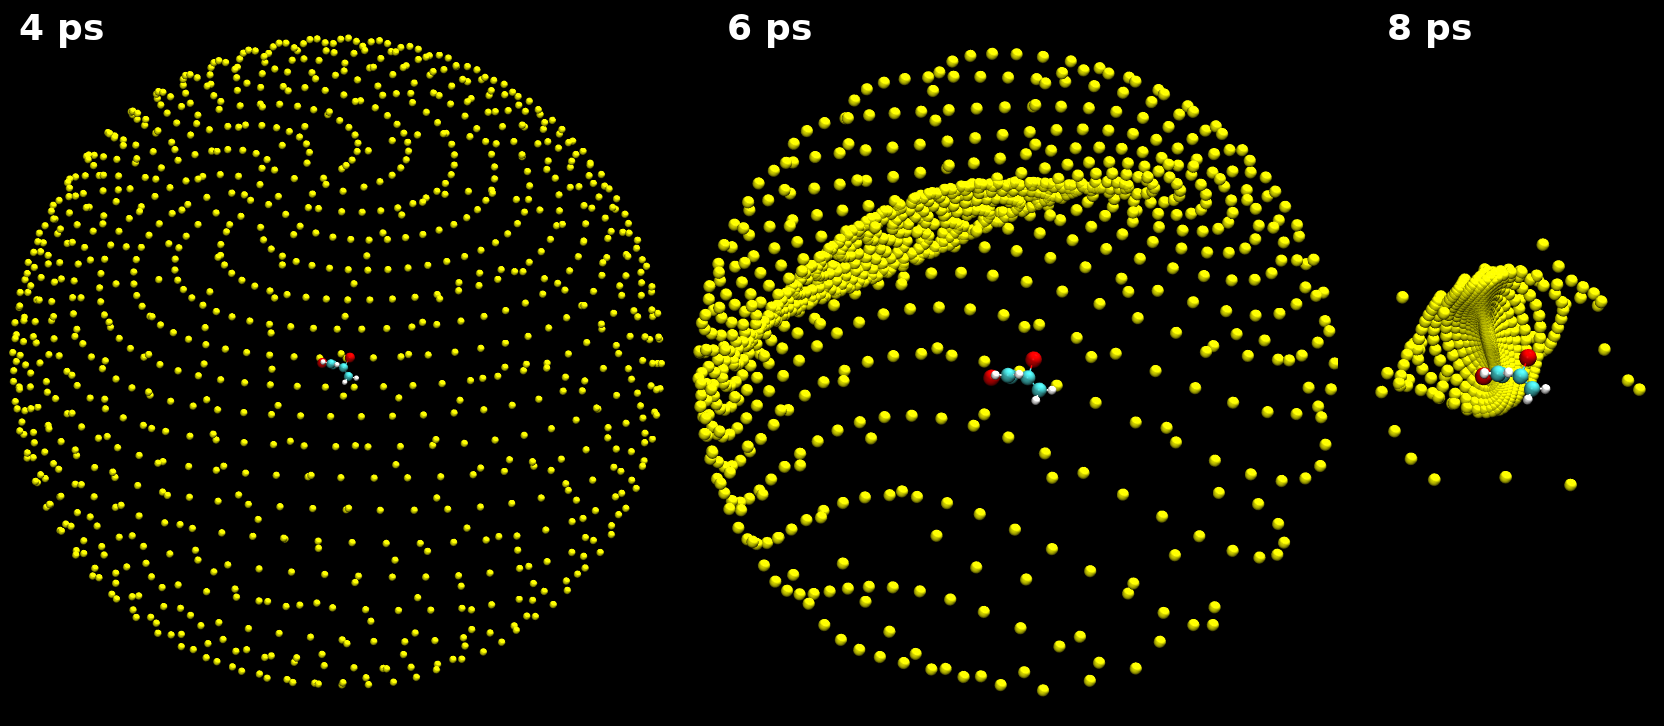
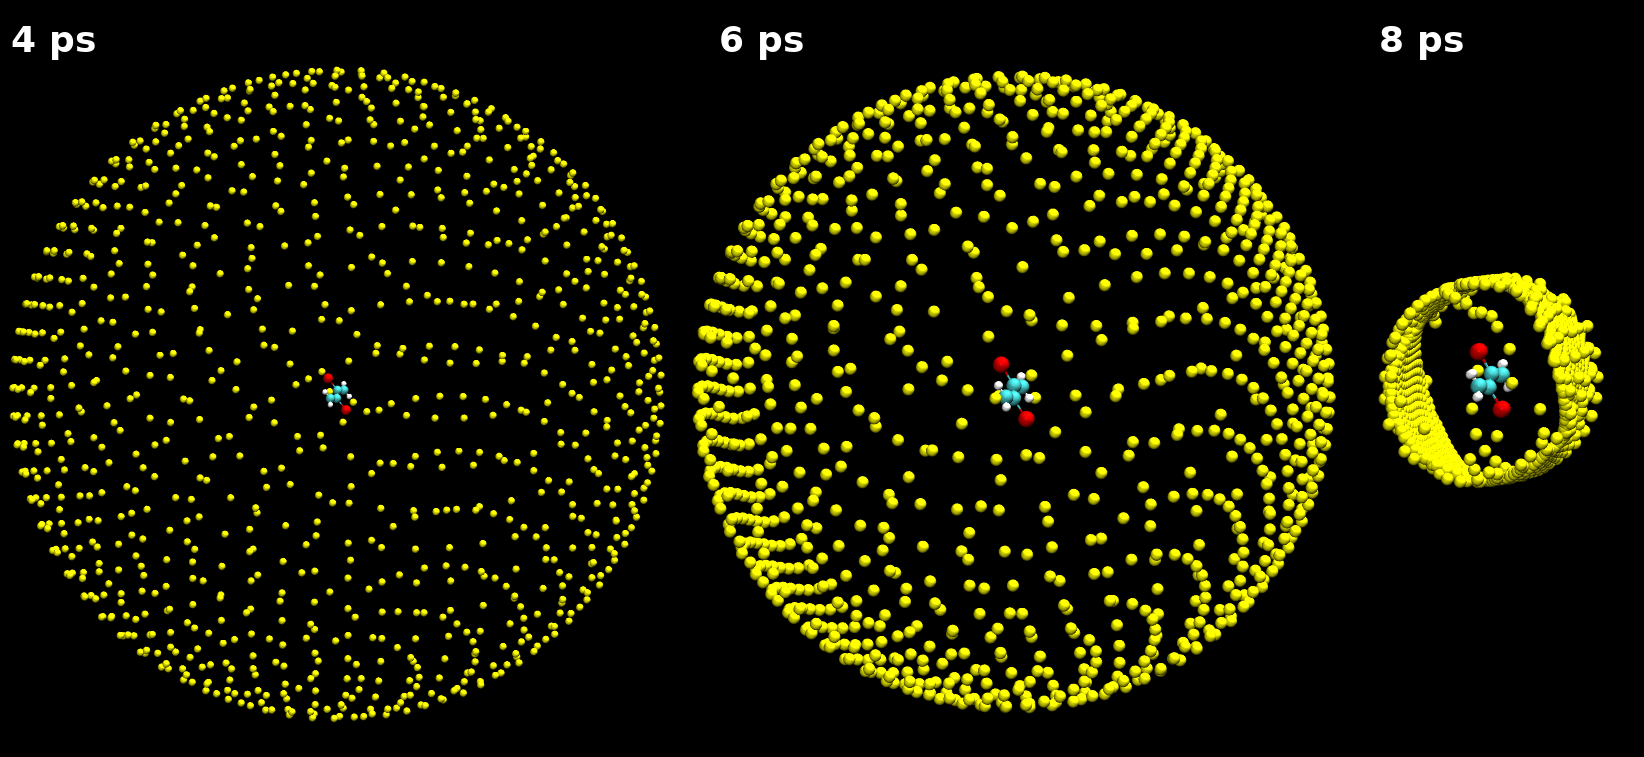
The dynamics simulations, however, indicate that the ion-dipole barrier present for gauche-DBB does not reduce the reaction rate because during the collisions the reactants reorient towards the most favourable approach, i.e., Ca+ attacking the negative end of the molecular dipole, and thus avoid the barrier (Fig. 7). An alignment effect also occurs for s-trans-DBB as shown in Fig. 8. Because of these dynamics, it can be surmised that the barriers in the entrance channels of the collisions of both conformers do not play a significant role in the dynamics under the present conditions. As an additional verification that the barriers in the entrance channel are not responsible for the disagreement between observed and computed rates, additional simulations with collision energies decreased by up to a factor of were carried out. The result was an increase of the rate coefficient for the gauche-conformer in line with capture theory, which is, however, still at variance with the much smaller value obtained from experiment. Hence, the barriers in the entrance channel are not decisive for the differences in the reaction rates because the long-range intermolecular interactions orient gauche-DBB into a reaction-competent fashion and the barrier is never sampled for the collision energies relevant and considered here.
The most apparent difference between the two conformers is that
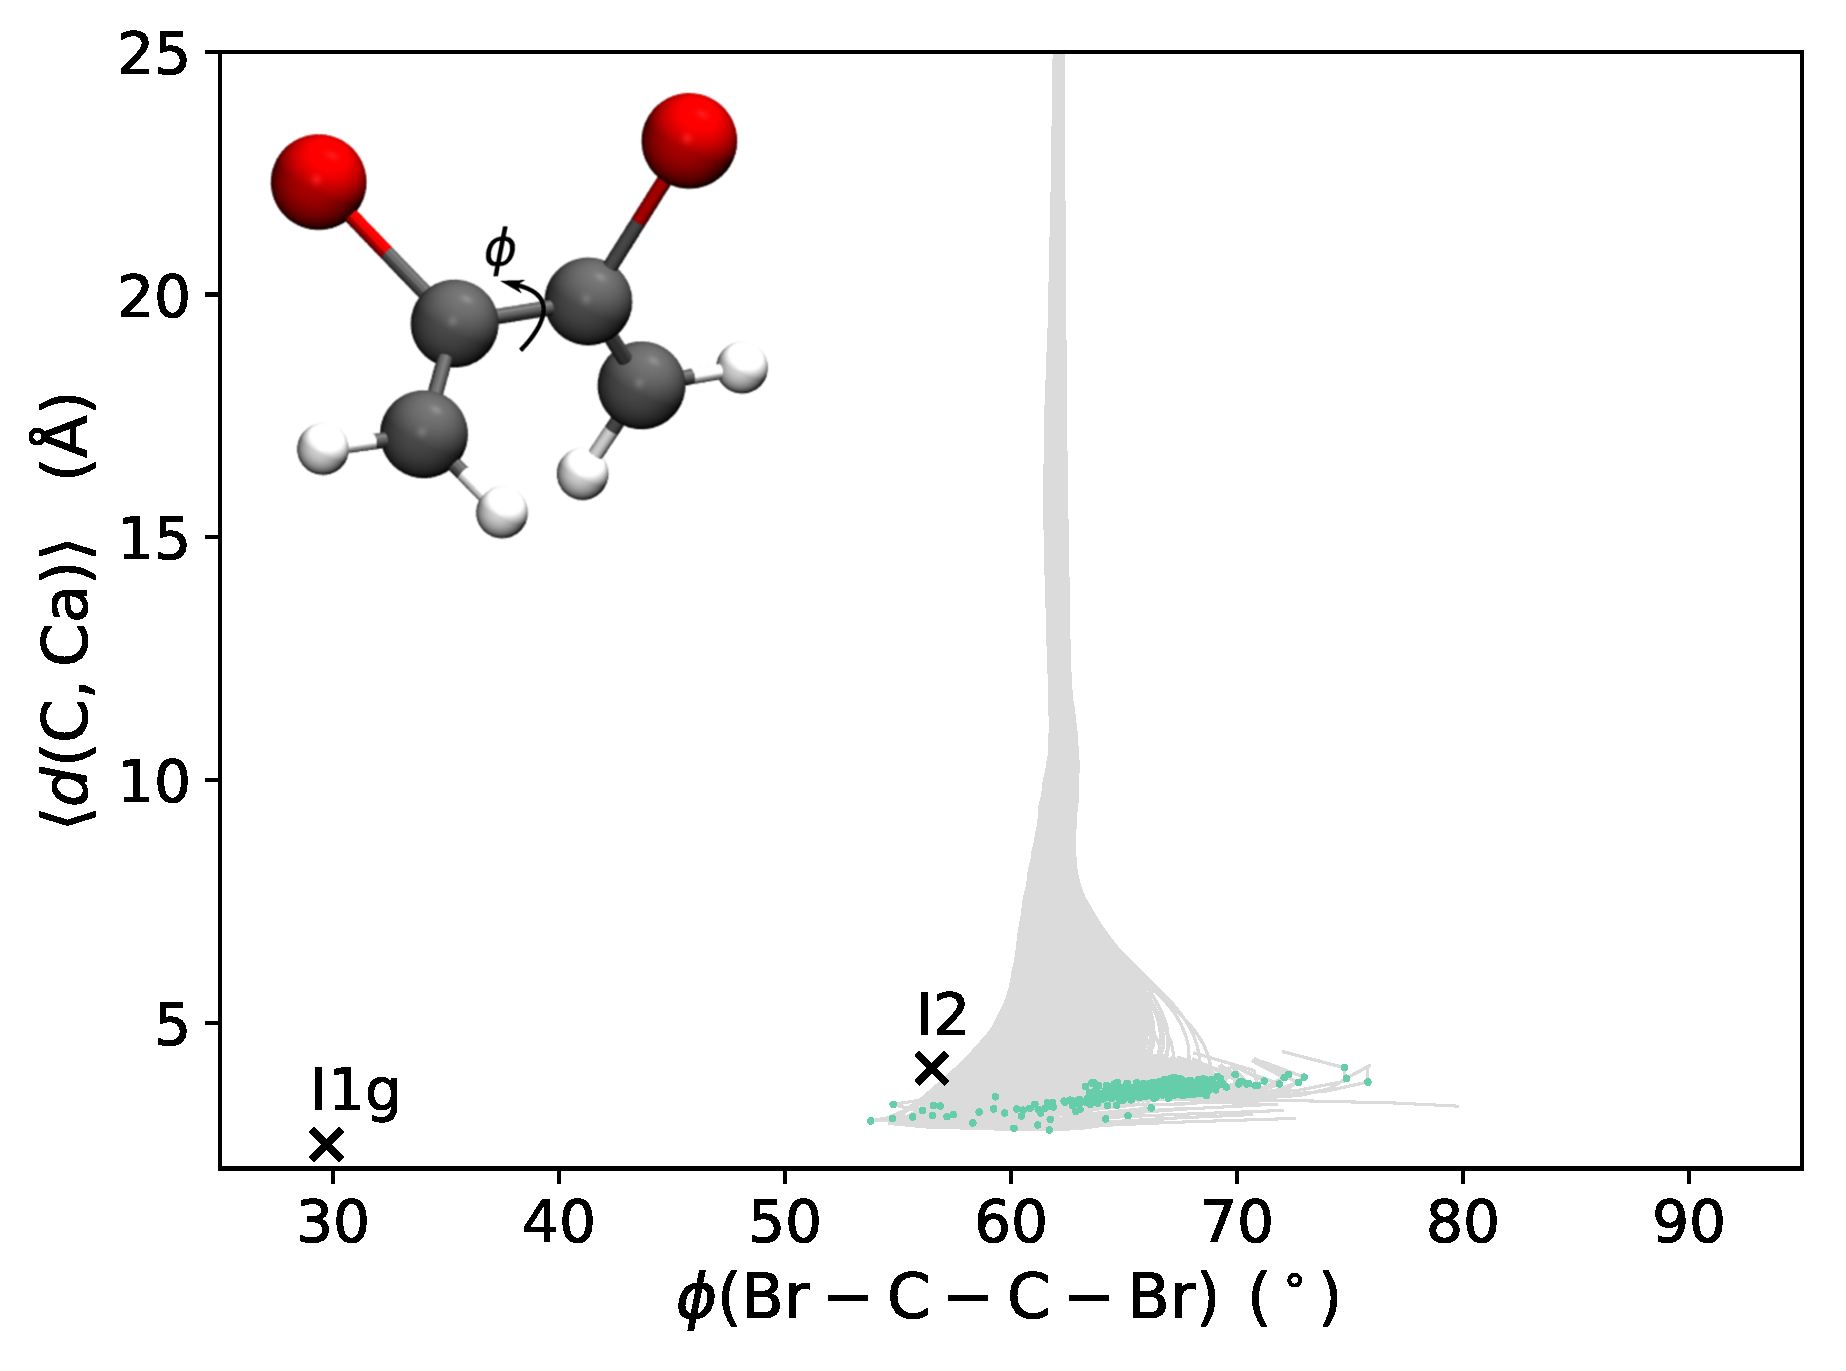
s-trans-DBB only features one reaction pathway whereas for gauche-DBB, two paths are in principle accessible, see Fig. 5. However, a closer evaluation of the trajectories in Fig. 9 reveals
that for the gauche species, the majority of reactive trajectories exclusively pass through intermediate I2 in which the Ca+ moiety is coordinated to the bromine atoms of DBB. While the small energetic differences between the two pathways are unlikely to account for this dynamic bias, this finding is in line with the reorientation dynamics discussed above: during the approach of Ca+, the negative end of the molecular dipole formed by the bromine atoms of DBB orients towards the ion which directly leads to intermediate I2 from where the reaction proceeds further, usually in a direct abstraction process.
Conversely, for s-trans-DBB the reaction is found to proceed via
two symmetric I1t intermediates in which the Ca+ ion is coordinated to the electron system of the molecule as shown in
Fig. S13 of the Supplementary Information.
Discussion
The current study presents a comprehensive experimental and theoretical characterisation of the state- and conformationally specific dynamics of the reaction of 2,3-DBB with Ca+ ions. While excellent agreement between experiment and theory is obtained for the reactions of excited states of Ca+ with both conformers of DBB as well as for ground-state Ca+ with the s-trans species, the experimentally determined rates for ground-state Ca+ colliding with gauche-DBB differ by almost an order of magnitude compared to those of the s-trans conformer, which is not reflected in the calculations. In search for explanations for this disagreement between experiment and theory, various analyses were carried out.
The lifetimes of the collision complexes were found to be generally short ( ps) for both DBB isomers. Thus, a possible slowdown of the reaction due to formation of a long-lived reaction intermediate cannot be the origin for the discrepancy between experiment and simulations for the gauche species. Typically, the simulations yielded direct abstraction reactions. Only for the minority of trajectories, lifetimes of the reaction complex longer than several vibrational periods (i.e., longer than 1 ps) were observed. As discussed above, rotational excitation was found to change the reaction rates for both isomers in a similar fashion.
Concerning the quality of the PES, there are two main factors that influence the computed rates, first the quality of the PhysNet fit (i.e. how accurately the NN reproduces the ab initio reference data) and second, the chosen level of theory and basis set of the reference data.
First, the PhysNet representation of the global PES is accurate. Figure S14 in the Supplementary Information compares the ab initio with the PhysNet energies along two representative trajectories. The NN based PES faithfully reproduces the DFT energies, which was also found when predicting energies for a test set that was not used during training. The out-of-sample mean absolute and root mean squared errors (MAE and RMSE) for predicting energies for 10 000 structures and covering an energy range of 230 kcal/mol (9.97 eV) amount to MAE() = 0.06 and RMSE() = 0.3 kcal/mol (2.6 and 13.0 meV), respectively. Thus, the quality of the fit can be judged excellent and fitting errors can be ruled out as a source of the discrepancy.
Second, an insufficient level of theory of the ab initio PES may be another reason for the discrepancy. A comparison between Fig. S6 in the Supplementary Information and Fig. 5 illustrates the overall similarity of the B3LYP PES used for training the NN-PES and running the reactive MD simulations with the one obtained at the higher level of theory CCSD(T)-F12. However, as the energies of some stationary points differ by up to a few kcal/mol, an effect of the level of theory cannot be completely ruled out. For example, transition state TS1g is higher in energy by 1.4 kcal/mol (0.06 eV) than TS2 at the CCSD(T) level but in the B3LYP calculations, the ordering of the two states is reversed and the energy difference increases to 3.3 kcal/mol (0.14 eV). Notwithstanding the fact that the relevant barriers here are strongly submerged with respect to the energy of the reactants, we note that within transition state theory one order of magnitude difference in the rate corresponds to an energy scale of kcal/mol (0.065 eV) which can, e.g., be compared with an uncertainty of kcal/mol (0.17 eV) in the ordering of TS1g and TS2 mentioned above.
In addition, the use of classical MD simulations as opposed to a full quantum treatment of the nuclear dynamics may be questioned. However, the masses of the atoms involved in the reaction as well as the energies along the reaction pathway are both large which make quantum effects as a source for the disagreement unlikely. Moreover, it was recently demonstrated that quasi-classical trajectory simulations yield energy-dependent rates that compare favourably with quantum wavepacket calculations for the C+O2O+CO reaction in its electronic ground state down to collision energies of a few 10 K.[36].
On the other hand, molecules in low rotational states states can display significant weak-field-seeking behaviour which leads to anti-orientation of the dipole in the electric field [37]. This effect is entirely quantum mechanical in nature and in the present case it is expected to be particularly important for intramolecular geometries between the long-range electrostatically dominated regime and chemical bonding. From simple estimates and for the relevant ion-molecule distances of a few nanometer to a few 100 picometer, both the translation time and the re-orientation time of the molecular dipole in the field of the ion are on the order of some picoseconds. In the most obvious way, this would lead to "inverted" approach geometries and thus reduce the reaction rate for gauche DBB, but more generally this effect indicates that intricate details of the PES could be very relevant with respect to modified entrance-channel geometries and dynamics. In the present experiment, low rotational states for DBB are most prevalent and neglect of this in the MD simulations is potentially critical for correctly describing the reaction dynamics. Full dimensional quantum dynamics simulations for systems of this size are currently unfeasible, but a possible alternative is to precompute geometry-dependent Stark-effect-corrected effective interaction energies and add those to the energy function used in the MD simulations. This, however, is beyond the scope of the present work.
Lastly, multi-reference and non-adiabatic effects could influence the dynamics in the present system. Checks for a possible spin contamination of the stationary points displayed in Fig. 5 remained inconspicuous, see Tables S3 and S2 in the Supplementary Information. Thus, while these tests did not reveal any obvious multireference effects in the present system, a possible role of non-adiabatic dynamics cannot be ruled out until the lowest excited states of the system and potential crossings between them have been thoroughly explored which, however, is outside the scope of the present study. Along similar lines, the trajectory calculations do not explicitly account for long-range charge transfer. All electronic effects are "only" accounted for within the concept of a Born–Oppenheimer PES. It is conceivable that electronic structure calculations at almost all levels of theory are incapable of capturing such effects.
Finally, we note that an isomeric effect was also observed in Ref. [38] where the reaction of N+ ions with s-cis-dichloroethylene (C2H2Cl2) was found to be considerably slower than predicted by capture theory while the rate coefficient of the s-trans species agreed very well with the theoretical predictions. In that study, it was speculated that the reason for this discrepancy for s-cis-C2H2Cl2 is a mismatch between the direction of most favoured attack for short-range charge transfer and the direction of the long-range approach of the collision partners along the axis of the molecular dipole. While this explanation is in line with the finding in the present system that the attack of Ca+ occurs exclusively along the direction of the molecular dipole of the gauche conformer of DBB leading to the formation of intermediate I2, it does not rationalize the reduced reactivity in the present case according to our trajectory calculations.
Summary and Conclusions
We performed reaction experiments with conformer-selected 2,3-dibromobutadiene from a molecular beam with trapped and laser-cooled Ca+ ions. TOF mass spectra identified and CaBr+ as the main ionic reaction products. An analysis of the reaction-rate dependence on both the molecular conformation of DBB as well as the electronic-state population of Ca+ revealed two kinetic regimes. With Ca+ in either of the excited states, the kinetics were capture-limited for both DBB conformers and the rate coefficient of gauche-DBB was enhanced compared to the s-trans conformer due to the interaction of its permanent electric dipole moment with the ion. For reactions with Ca+ in its ground state, the rate coefficient with s-trans-DBB was also found to be capture-limited. However, reactions of gauche-DBB were strongly suppressed to about one tenth of the capture limit.
The experimental findings were analysed using adiabatic-capture-theory calculations and reactive molecular dynamics simulations on a full-dimensional, machine-learned PES. For both isomers the abstraction reaction for forming CaBr+ is direct with rare formation of an intermediate with lifetimes longer than 1 ps. For the s-trans conformer, the simulations yielded near-quantitative agreement with experiments for the rate coefficient. This is consistent with findings for reactive atom+diatom systems using similar computational approaches.[36] On the other hand, the computations overestimated the reaction rate for the gauche conformer, which features two possible reaction pathways, by an order of magnitude compared with experiment. Again, this has been found, for example, for the MgO+ + CH4 reaction, for which the computed rate differed from experiments by one order of magnitude but showing the correct temperature dependence.[39] The reason for the discrepancies in both cases may be limitations in the electronic structure methods that can be applied to the systems of interest given their size, omitting non-adiabatic effects, or neglect of purely quantum-mechanical re-orientation effects of the cold polar molecule in the electric field of the ion. Further studies are required to clarify these possibilities.
The present study highlights the important role of molecular conformation in gas-phase ion-molecule reactions already in moderately complex polyatomic systems. While previous studies of conformer-selected ion-molecule reactions [14, 18] mainly uncovered conformational dependencies due to differences in long-range interactions, the current results suggest that short-range conformational effects strongly suppress the reactivity of the gauche-conformer, which still needs to be explained.
Moreover, although the actual – time-resolved – elementary dynamics of similarly controlled molecular systems were experimentally observed [40], unravelling the underlying dynamics of bimolecular reactions such as the present one for now seems a formidable task, especially regarding problem of defining the starting time of the individual reactions but also the low occurrence statistics of ongoing reactions. The current combination of measuring time-averaged rates and molecular dynamics simulations consistent with experimental findings is a meaningful starting point for disentangling the chemical dynamics.
Methods
Molecular beam
The molecular beam was generated from DBB vapour at room temperature seeded in neon carrier gas at 5 bar. The gas mixture was expanded through a pulsed cantilever piezo valve (MassSpecpecD ACPV2, m nozzle diameter) with a repetition rate of 200 Hz. Before entering the reaction chamber the molecular beam passed the electric deflector [14, 13]. We measured a gas-pulse duration of s at the position of the center of the ion trap and the propagation velocity of the resulting molecular beam of [19].
Ion trap and TOF-MS
The radio frequency (RF) linear quadrupole ion trap was operated at a peak-to-peak RF voltage of V and a frequency of . Laser light at the frequencies of the cooling and repumping transitions of Ca+ at 397 nm and 866 nm, respectively, was delivered by frequency-stabilized external-cavity diode lasers [9]. The Ca+ fluorescence generated during the laser cooling was imaged onto a camera to obtain fluorescence images of the Coulomb crystals (see Fig. 1b).
The ion trap was radially coupled to a TOF-MS orthogonal to the molecular-beam propagation axis for the mass and quantitative analysis of reactant and product ions [31]. Two different modes of operation were used for the TOF-MS. For the determination of mass spectra of the reaction products, a low-resolution mode was used to extract ions into the TOF-MS by applying a s long pulse of 4.0 kV to the repeller electrode. For the rate measurements, additional high-voltage pulses, delayed by s, were applied to the extractor electrodes to selectively enhance the resolution for the Ca+ and species [31]. Ions were detected using a microchannel plate detector (MCP, Photonis USA) operated at a voltage of typically 2.3 kV placed at the end of the flight tube.
Ionization methods
Calcium atoms were ionized with femtosecond laser pulses from a Ti:Sapphire femtosecond laser (CPA 2110, Clark-MXR, Inc.) at a wavelength of 775 nm and pulse duration of 150 fs focused to a diameter of m at the center of the ion trap. A standardized procedure was used to ionize Ca atoms and ensure a constant size and composition of the ion Coulomb crystals as verified by TOF-MS. A pulsed vacuum-ultraviolet (VUV) light source at 118 nm, focused down to a spot size of roughly 100 m, was used for soft ionization of the DBB molecules and to measure the deflection profiles [17].
Quantum-chemical calculations
The PES presented in Fig. 5 was computed with spin-unrestricted Kohn-Sham density functional theory (UKS-DFT) using the B3LYP [41, 42] and MPW1K [43] functionals with the def2-TZVPP [44] basis set and the Stuttgart effective core potential (ECP) [45] for the 10 inner shell electrons of bromine accounting for scalar-relativistic effects using the Gaussian09 software package [46]. The functionals were chosen based on earlier studies for similar systems [47, 26, 5]. With both functionals the same topology of intermediates, transition states, and intrinsic reaction coordinates (IRCs) was obtained. Minor differences between these methods are shown in an extended PES in Fig. S6. Intrinsic reaction coordinates (IRCs) were found to connect all intermediates and transition states, barrierless reaction pathways connecting reactant and product states with the respective intermediates were found in all cases. Zero point vibrational energies were computed for all stationary points. Single point energies for all reaction paths were recomputed with spin-unrestricted (for doublet states) or spin-restricted (for singlet states) CCSD(T)-F12b/VDZ-F12 [48, 49] using a spin-restricted HF/VDZ-F12 reference wave function with the Molpro program package [50, 51].
Intrinsic bond orbitals (IBOs) [52] of restricted open-shell B3LYP/def2TZVPP and HF/VDZ-F12 wave functions of the stationary point structures were computed for the chemical analysis. Orbitals depicted in Tables S4 and S5 of the SI has been visualized by the IboView program package [53]. The spin contamination of the wavefunctions for the stationary points were found to be low (See tables S2 and S3 of the SI).
Machine-Learned PES and Molecular Dynamics Simulations
Machine Learning of the PES:
A deep NN of the PhysNet
type [35] was used to learn a full-dimensional
representation of the PES for the collision reaction up to
intermediates I3, I4 and I5 (see Fig. 5). PhysNet predicts
energies, forces, dipole moments and partial charges of structures
based on a descriptor that represents the local chemical environment
of each atom [35]. Provided that PhysNet is trained
on suitable ab initio data, it can be used for MD simulations
with high accuracy instead of computationally much more expensive
ab initio MD simulations at a given level of electronic
structure theory.
Reference data including energies, forces and dipole moments was
calculated at the B3LYP/def2-TZVPP using
Orca[54]. Relevant geometries for the collisions of Ca+ with both gauche- and s-trans-DBB were obtained by
running Langevin dynamics using the semiempirical tight binding
GFN2-xTB method [55]. Random momenta drawn from a
Maxwell-Boltzmann distribution corresponding to 300 K were assigned to
DBB (note that the resulting DBB configurations also contain
configurations relevant to lower
temperatures[56]). Diverse collision angles for the
reaction were obtained by choosing the Ca+ position randomly on a
sphere around DBB before accelerating it towards DBB. After training
PhysNet on this initial data set, new geometries were generated using
adaptive
sampling[57, 58]. Adaptive
sampling is used to detect regions on the PES which are
underrepresented in the reference data set using an ensemble of
PhysNet models. The final data set contained 191 982 structures
covering the separated fragments and reaction products.
PhysNet was trained following the procedure outlined in Reference 35 and using the standard hyperparameters as suggested therein. The resulting PES of the studied system is given by
| (7) |
Here, and correspond to the total number of atoms and the
atomic energy contribution of atom , is Coulomb’s constant,
is the partial charge of atom and is the
interatomic distance between atoms and . Note that the partial
charges are corrected to guarantee charge conservation and the
electrostatic energy is damped to avoid instabilities due to the
singularity at .[35]
Molecular Dynamics Simulations:
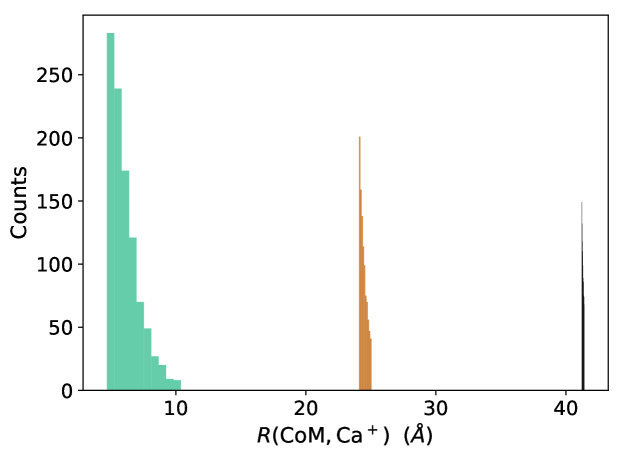
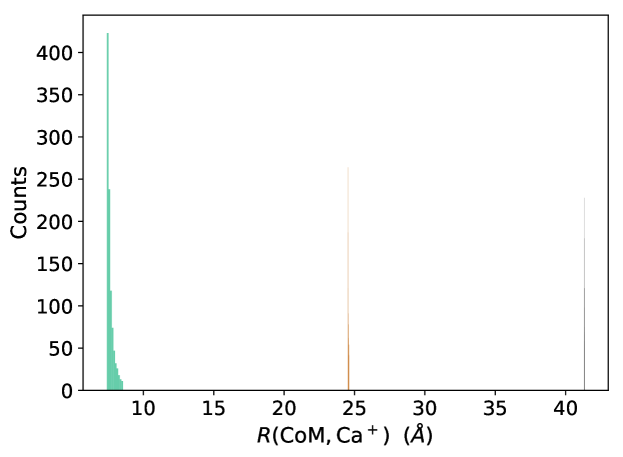
Initial configurations for the reactive collision of DBB and Ca+
were generated as follows: The center of mass (CoM) of DBB was placed at the
origin of the coordinate system with space-fixed orientation and positions of Ca+
generated by Fibonacci sampling[59] the
unit sphere. Then, the separation between the CoM of DBB and Ca+
was increased to 75 Å . Fibonacci sampling was used to generate
evenly distributed points on the unit sphere, see
Fig. S8. A center-of-mass velocity of
m/s, consistent with experiment and corresponding to a collision
energy of 2.86 kcal/mol (0.12 eV), was assigned to DBB whereas the Ca+ cation
was at rest. The impact factor was sampled uniformly in non-overlapping
intervals (i.e. , , Å) by displacing
Ca+ perpendicularly to the collision axis. 1 000
trajectories were run per impact-factor interval
for Å. The convergence of the opacity function (w.r.t
number of trajectories per impact factor) was tested for gauche-DBB
and impact factors between to 10 Å. Comparing the reaction
probability obtained from 10 000 (denser Fibonacci lattice) and
1 000 initial configurations yielded the same results within 1.5 %.
Simulations were run in the ensemble using the Velocity Verlet
integrator as implemented in the atomic simulation
environment[60] with a time step of fs. The simulations were terminated based on two distance
criteria, i.e., for Å and Å
a reaction was considered to have occurred. Additionally, the
simulations were stopped and considered "nonreactive" if, after
initial approach, DBB and Ca+ were separated by more than
30 Å without satisfying the criteria for a "reactive"
trajectory. At the beginning of the simulation, the structure of DBB
was optimized and remained vibrationally cold.
Two sets of simulations were carried out: The first was run without
assigning any rotational energy to the DBB molecules. This is justified
by the low temperature (few K) of DBB in the experiment. The second
set included rotation of the DBB molecule to study the influence of
classical rotation in general. For this, the moments of inertia together with the three principal axes of rotation were
determined and a rotation was assigned to the principal axis with
lowest . Simulations were carried out at different rotational
energies where is the rotational constant around
the principal axis with lowest .
Reaction Rates:
The opacity functions in Fig. 6 represent the fraction of reactive trajectories, i.e. at a given impact factor . Note that in Fig. 6 corresponds to the simulations run with , while corresponds to simulations run with . The reactive cross section , from which the reaction rates were obtained, was calculated according to[61]
| (8) |
where is the largest impact factor at which reactive events were observed, is the total number of trajectories, the number of reactive trajectories and is the impact factor of the reactive trajectory . The reaction rate is then determined from
| (9) |
with m/s as in the experiments.
References
- Smith and Spanel [1995] D. Smith and P. Spanel, Mass. Spectrom. Rev., 1995, 14, 255–278.
- Ehrenfreund and Sephton [2006] P. Ehrenfreund and M. A. Sephton, Faraday Discuss., 2006, 133, 277–288.
- Larsson et al. [2012] M. Larsson, W. D. Geppert and G. Nyman, Rep. Prog. Phys, 2012, 75, 066901.
- Böhme and Schwarz [2005] D. K. Böhme and H. Schwarz, Angew. Chem. Int. Ed., 2005, 44, 2336–2354.
- Roithová and Schröder [2010] J. Roithová and D. Schröder, Chem. Rev., 2010, 110, 1170–1211.
- Willitsch [2017] S. Willitsch, Adv. Chem. Phys., 2017, 162, 307–340.
- Meyer and Wester [2017] J. Meyer and R. Wester, Annu. Rev. Phys. Chem., 2017, 68, 333–353.
- Rösch et al. [2014] D. Rösch, S. Willitsch, Y.-P. Chang and J. Küpper, J. Chem. Phys., 2014, 140, 124202.
- Willitsch [2012] S. Willitsch, Int. Rev. Phys. Chem., 2012, 31, 175–199.
- Heazlewood and Softley [2015] B. Heazlewood and T. P. Softley, Annu. Rev. Phys. Chem., 2015, 66, 475–495.
- Filsinger et al. [2008] F. Filsinger, U. Erlekam, G. von Helden, J. Küpper and G. Meijer, Phys. Rev. Lett., 2008, 100, 133003.
- Filsinger et al. [2009] F. Filsinger, J. Küpper, G. Meijer, J. L. Hansen, J. Maurer, J. H. Nielsen, L. Holmegaard and H. Stapelfeldt, Angew. Chem. Int. Ed., 2009, 48, 6900–6902.
- Chang et al. [2015] Y.-P. Chang, D. A. Horke, S. Trippel and J. Küpper, Int. Rev. Phys. Chem., 2015, 34, 557.
- Chang et al. [2013] Y.-P. Chang, K. Dlugolecki, J. Küpper, D. Rösch, D. Wild and S. Willitsch, Science, 2013, 342, 98–101.
- Kierspel et al. [2014] T. Kierspel, D. A. Horke, Y.-P. Chang and J. Küpper, Chem. Phys. Let., 2014, 591, 130–132.
- Horke et al. [2014] D. A. Horke, Y.-P. Chang, K. Długołęcki and J. Küpper, Angew. Chem. Int. Ed., 2014, 53, 11965–11968.
- Kilaj et al. [2020] A. Kilaj, H. Gao, D. Tahchieva, R. Ramakrishnan, D. Bachmann, D. Gillingham, O. A. von Lilienfeld, J. Küpper and S. Willitsch, Phys. Chem. Chem. Phys., 2020, 22, 13431–13439.
- Kilaj et al. [2021] A. Kilaj, J. Wang, P. Straňák, M. Schwilk, U. Rivero, L. Xu, O. A. v. Lilienfeld, J. Küpper and S. Willitsch, Nat. Commun., 2021, 12, 6047.
- Kilaj et al. [2018] A. Kilaj, H. Gao, D. Rösch, U. Rivero, J. Küpper and S. Willitsch, Nat. Commun., 2018, 9, 2096.
- Clary [1987] D. Clary, J. Chem. Soc., Faraday Trans. 2, 1987, 83, 139–148.
- Clary [1990] D. Clary, Annu. Rev. Phys. Chem., 1990, 41, 61–90.
- Tsikritea et al. [2022] A. Tsikritea, J. A. Diprose, T. P. Softley and B. R. Heazlewood, J. Chem. Phys., 2022, 157, 060901.
- Mølhave and Drewsen [2000] K. Mølhave and M. Drewsen, Phys. Rev. A, 2000, 62, 011401.
- Staanum et al. [2008] P. F. Staanum, K. Højbjerre, R. Wester and M. Drewsen, Phys. Rev. Lett., 2008, 100, 243003.
- Willitsch et al. [2008] S. Willitsch, M. T. Bell, A. D. Gingell, S. R. Procter and T. P. Softley, Phys. Rev. Lett., 2008, 100, 043203.
- Gingell et al. [2010] A. D. Gingell, M. T. Bell, J. M. Oldham, T. P. Softley and J. M. Harvey, J. Chem. Phys., 2010, 133, 194302.
- Hall et al. [2011] F. H. J. Hall, M. Aymar, N. Bouloufa-Maafa, O. Dulieu and S. Willitsch, Phys. Rev. Lett., 2011, 107, 243202.
- Greenberg et al. [2018] J. Greenberg, P. C. Schmid, M. Miller, J. F. Stanton and H. J. Lewandowski, Phys. Rev. A, 2018, 98, 032702.
- Schmid et al. [2019] P. C. Schmid, M. I. Miller, J. Greenberg, T. L. Nguyen, J. F. Stanton and H. J. Lewandowski, Mol. Phys., 2019, 117, 3036–3042.
- Stoecklin et al. [1992] T. Stoecklin, D. C. Clary and A. Palma, J. Chem. Soc. Faraday Trans., 1992, 88, 901.
- Rösch et al. [2016] D. Rösch, H. Gao, A. Kilaj and S. Willitsch, EPJ Tech. Instrum., 2016, 3, 5.
- Fang et al. [2011] W. Fang, L. Gong, Q. Zhang, X. Shan, F. Liu, Z. Wang and L. Sheng, J. Chem. Phys., 2011, 134, 174306.
- Roth and Schiller [2009] B. Roth and S. Schiller, Cold Molecules, CRC Press, Boca Raton, 2009, p. 651.
- Oberst [1999] H. Oberst, MSc thesis, University of Innsbruck, 1999.
- Unke and Meuwly [2019] O. T. Unke and M. Meuwly, J. Chem. Theory Comput., 2019, 15, 3678–3693.
- Goswami et al. [2022] S. Goswami, J. C. S. V. Veliz, M. Upadhyay, R. J. Bemish and M. Meuwly, Phys. Chem. Chem. Phys., 2022, 24, 23309–23322.
- Chang et al. [2014] Y.-P. Chang, F. Filsinger, B. Sartakov and J. Küpper, Comp. Phys. Comm., 2014, 185, 339–349.
- Rebrion et al. [1988] C. Rebrion, J. B. Marquette, B. R. Rowe, C. Chakravarty, D. C. Clary, N. G. Adams and D. Smith, J. Phys. Chem., 1988, 92, 6572–6574.
- Sweeny et al. [2020] B. C. Sweeny, H. Pan, A. Kassem, J. C. Sawyer, S. G. Ard, N. S. Shuman, A. A. Viggiano, S. Brickel, O. T. Unke, M. Upadhyay and M. Meuwly, Phys. Chem. Chem. Phys., 2020, 22, 8913–8923.
- Onvlee et al. [2022] J. Onvlee, S. Trippel and J. Küpper, Nat. Comm., 2022, 13, 7462.
- Lee et al. [1988] C. Lee, W. Yang and R. G. Parr, Phys. Rev. B: Condens. Matter. Phys., 1988, 37, 785.
- Becke [1993] A. D. Becke, J. Chem. Phys., 1993, 98, 5648.
- Lynch et al. [2000] B. J. Lynch, P. L. Fast, M. Harris and D. G. Truhlar, J. Phys. Chem. A, 2000, 104, 4811.
- Weigend and Ahlrichs [2005] F. Weigend and R. Ahlrichs, Phys. Chem. Chem. Phys., 2005, 7, 3297.
- Bergner et al. [1993] A. Bergner, M. Dolg, W. Küchle, H. Stoll and H. Preuß, Mol. Phys., 1993, 80, 1431–1441.
- [46] M. J. Frisch, G. W. Trucks, H. B. Schlegel, G. E. Scuseria, M. A. Robb, J. R. Cheeseman, G. Scalmani, V. Barone, B. Mennucci, G. A. Petersson, H. Nakatsuji, M. Caricato, X. Li, H. P. Hratchian, A. F. Izmaylov, J. Bloino, G. Zheng, J. L. Sonnenberg, M. Hada, M. Ehara, K. Toyota, R. Fukuda, J. Hasegawa, M. Ishida, T. Nakajima, Y. Honda, O. Kitao, H. Nakai, T. Vreven, J. A. Montgomery, Jr., J. E. Peralta, F. Ogliaro, M. Bearpark, J. J. Heyd, E. Brothers, K. N. Kudin, V. N. Staroverov, R. Kobayashi, J. Normand, K. Raghavachari, A. Rendell, J. C. Burant, S. S. Iyengar, J. Tomasi, M. Cossi, N. Rega, J. M. Millam, M. Klene, J. E. Knox, J. B. Cross, V. Bakken, C. Adamo, J. Jaramillo, R. Gomperts, R. E. Stratmann, O. Yazyev, A. J. Austin, R. Cammi, C. Pomelli, J. W. Ochterski, R. L. Martin, K. Morokuma, V. G. Zakrzewski, G. A. Voth, P. Salvador, J. J. Dannenberg, S. Dapprich, A. D. Daniels, Ö. Farkas, J. B. Foresman, J. V. Ortiz, J. Cioslowski and D. J. Fox, Gaussian 09 Revision D.01, Gaussian Inc., Wallingford CT, 2009.
- Redondo et al. [2014] P. Redondo, A. Largo, V. M. Rayón, G. Molpeceres, J. Á. Sordo and C. Barrientos, Phys. Chem. Chem. Phys., 2014, 16, 16121–16136.
- Adler et al. [2007] T. B. Adler, G. Knizia and H.-J. Werner, J. Chem. Phys., 2007, 127, 221106.
- Peterson et al. [2008] K. A. Peterson, T. B. Adler and H.-J. Werner, J. Chem. Phys., 2008, 128, 084102.
- Werner et al. [2012] H.-J. Werner, P. J. Knowles, G. Knizia, F. R. Manby and M. Schütz, WIREs Comput. Mol. Sci., 2012, 2, 242–253.
- Werner et al. [2018] H.-J. Werner, P. J. Knowles, G. Knizia, F. R. Manby, M. Schütz et al., MOLPRO, version 2018.1, a package of ab initio programs, 2018.
- Knizia [2013] G. Knizia, J. Chem. Theory Comput., 2013, 9, 4834–4843.
- [53] G. Knizia, Iboview Orbital visualization program (version 20150427), {https://www.iboview.org}.
- Neese et al. [2020] F. Neese, F. Wennmohs, U. Becker and C. Riplinger, J. Chem. Phys., 2020, 152, 224108.
- Bannwarth et al. [2019] C. Bannwarth, S. Ehlert and S. Grimme, J. Chem. Theory Comput., 2019, 15, 1652–1671.
- Unke et al. [2021] O. T. Unke, S. Chmiela, H. E. Sauceda, M. Gastegger, I. Poltavsky, K. T. Schütt, A. Tkatchenko and K.-R. Müller, Chem. Rev., 2021, 121, 10142–10186.
- Behler [2014] J. Behler, J. Phys. Condens. Matter, 2014, 26, 183001.
- Behler [2015] J. Behler, Int. J. Quantum Chem., 2015, 115, 1032–1050.
- González [2010] Á. González, Math. Geosci., 2010, 42, 49–64.
- Larsen et al. [2017] A. H. Larsen, J. J. Mortensen, J. Blomqvist, I. E. Castelli, R. Christensen, M. Dułak, J. Friis, M. N. Groves, B. Hammer, C. Hargus et al., J. Phys. Condens. Matter, 2017, 29, 273002.
- Bernstein [2013] R. B. Bernstein, Atom-molecule collision theory: a guide for the experimentalist, Springer Science & Business Media, 2013.
- Dahl [1995] D. A. Dahl, SIMION 3D, version 6.0 user’s manual, Idaho National Engineering Laboratory, Chemical Materials & Processes Department and Lockheed Idaho Technologies Company, Idaho Falls, Rev. 4 edn, 1995.
Acknowledgements
We thank Philipp Knöpfel, Grischa Martin, Georg Holderied, and Anatoly Johnson at the University of Basel for technical support. We thank Ziv Meir for fruitful discussions. This work has been supported by the Swiss National Science Foundation under grants no. BSCGI0_157874 and IZCOZ0_189907, and the NCCR MUST, by Deutsches Elektronen-Synchrotron DESY, a member of the Helmholtz Association (HGF), and by the Cluster of Excellence “Advanced Imaging of Matter” (AIM, EXC 2056, ID 39 071 5994) of the Deutsche Forschungsgemeinschaft (DFG). O.A.v.L. has received funding from the European Research Council (ERC) under the European Union’s Horizon 2020 research and innovation programme (grant agreement No. 772834). O.A.v.L. has received support as the Ed Clark Chair of Advanced Materials and as a Canada CIFAR AI Chair.
Author contributions
A.K., J.W., and L.X. performed the experiments. A.K. analysed all data, with assistance from J.W., and performed the capture-rate calculations. L.X. simulated mass spectra with SIMION. P.S. and M.S. performed the quantum-chemical calculations. M.S. supervised the quantum chemical calculations. S.K. carried out and analysed reactive MD simulations. A.K., P.S., M.S., S. K., O.A.v.L., J.K., M.M., and S.W. wrote the manuscript. S.W., J.K., and M.M. conceived and supervised the project. All authors have read and approved the final manuscript.
Competing interests
The authors declare no competing financial or non-financial interests.
Supporting Information for:
Conformational effects in the reaction of 2,3-dibromobutadiene with ground- and excited-state Calcium ions
S1 Simulation of mass spectra

In order to assign masses to the different features observed in the product mass spectrum of Fig. 2a, simulations of the ion dynamics in the TOF-MS were performed. In mixed-species Coulomb crystals, the ions arrange in layers such that lightest ions are trapped at the center and successively heavier ions accumulate around the lighter ions in shells of increasing radius. This inhomogeneous ion distribution leads to a broadening and bimodal structure of the peaks in the TOF-MS [31].
In the simulations, ion trajectories of a Coulomb crystal being ejected into the TOF-MS were calculated using SIMION [62]. The arrival times at the detector were extracted to determine the mass spectra. In the simulations, a typical Coulomb crystal of 500 Ca+ ions (mass 40 u) was assumed, additionally containing 20 ions of each of the masses 50 u, 51 u, 52 u, 57 u, 72 u, 120 u and 200 u. A comparison of the experimental data with the simulation is shown in Fig. S1. Different colours highlight the contribution of each ion mass in the simulation. The time coordinates of the simulation have been shifted globally to match the location of the Ca+ peaks. The locations and splittings of the individual mass peaks reproduce the measured TOF spectra fairly well. A signal due to CaBr (200 u) is absent in the data. Slight differences between the simulated and observed splittings of the peaks can be explained by different sizes of the simulated and experimental Coulomb crystals.
Based on the good agreement between data and simulation, the product peaks of Fig. S1 were assigned to different molecular compounds as summarized in Table S1.
| Mass (u) | Possible compounds |
|---|---|
| , | |
| 57 | |
| 72 | |
| 120 | CaBr+ |
| 200 | CaBr |
S2 Adiabatic capture theory
Rotationally adiabatic capture (AC) rate coefficients were calculated using the theory developed by Clary and co-workers [20, 30] that has also been employed in refs. [14, 19]. The AC calculation proceeded in two steps. First, rotationally-adiabatic and centrifugally-corrected long-range interaction potentials were calculated for each rotational state of DBB. The ion-molecule interaction includes charge-induced dipole and charge-permanent dipole couplings. Figs. S2a and b show these long-range potentials for collisions of Ca+ with gauche- and s-trans-DBB, respectively. Each set of curves corresponds to a different value of the total collisional angular momentum quantum number . With increasing , a centrifugal energy barrier emerges. The individual curves for each value of belong to all rotational quantum state of DBB with angular momentum quantum number , which is calculated to have the strongest population at K. The quantum numbers and refer to the asymmetric rotor quantum number and the quantum number of the angular-momentum projection onto the ion-molecule distance vector, respectively. Given these long-range potentials, AC theory assigns unit reaction probability to any collision with , for which the centrifugal energy barrier lies below the experimental collision energy meV (black solid line in Figs. S2a,b). For each rotational state of gauche/s-trans DBB (g/t), the corresponding value of was determined numerically leading to a collisional cross-section [30]
| (S1) |
where is the reduced mass of the two collision partners. The rate coefficient was then calculated by averaging over all rotational states of DBB assuming a thermal distribution, i.e.
| (S2) |
Here, is the thermal population of a given rotational state at the rotational temperature .
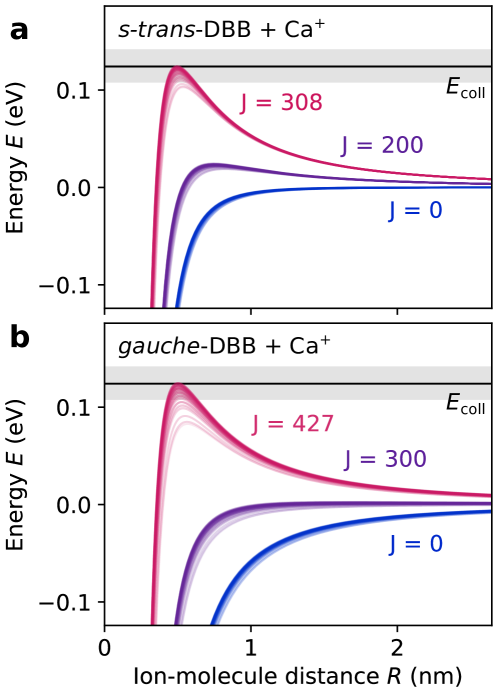
Figs. S2a,b show that the centrifugal barrier increases faster with for s-trans-DBB than for gauche-DBB such that the maximum collisional angular momenta for a reactive encounter at the experimental collision energy are and , respectively, implying a larger cross-section for gauche-DBB. For the lowest values of , one notices a steeper slope of the ion-molecule potential for gauche-DBB. This points to a stronger attractive interaction between the ion and the permanent dipole of gauche-DBB as opposed to the apolar s-trans conformer and explains the calculated difference in conformer-specific reaction rates. The anisotropic charge-permanent dipole interaction of gauche DBB, which is absent for s-trans DBB, also leads to a stronger dependence of its rotationally adiabatic potential on the rotational state. This appears as a larger spread between the different potential energy curves for a given value of .
S3 Determination of Ca+ electronic state populations
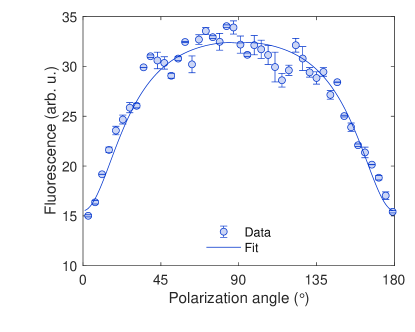
The polarization of the 866 nm repumping laser was adjusted to optimize the repumping efficiency. First, the polarization was cleaned with a polarizing beam-splitter and then rotated using a half-wave plate. Then, the 866 nm beam was combined with the 397 nm light on a dichroic mirror and directed at the ion trap. The polarization of the 397 nm laser was not controlled, since the OBE simulation was found to be insensitive to it. The Ca+ fluorescence was then measured while varying the polarization angle of the 866 nm repumping laser (Fig. S3). The fluorescence data were fitted using the OBE prediction for the P-state population. At a 90∘ polarization angle relative to the magnetic field axis the peak fluorescence was found. To maximize population in the state, this setting was used for all subsequent measurements.
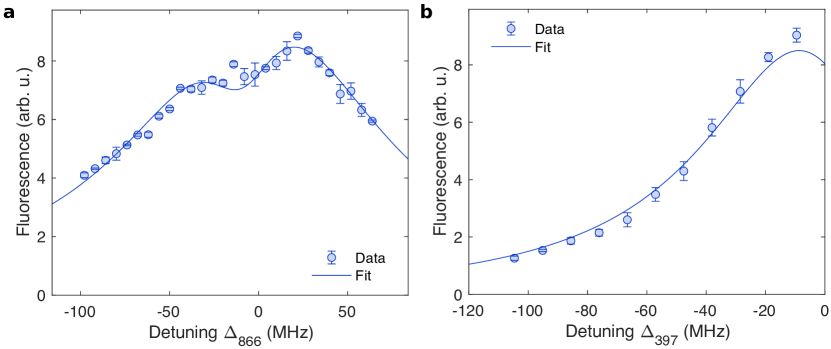
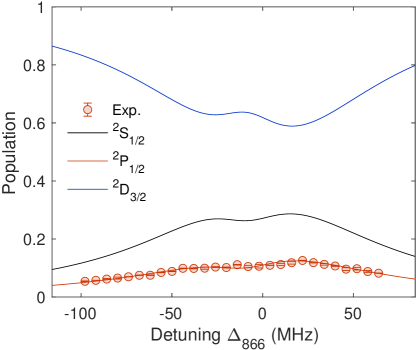
After adjusting the polarization, the frequency of the 397 nm cooling laser was set to a detuning of MHz, below the “melting point” of the Coulomb crystal at . Then, the Ca+ fluorescence was measured as a function of the 866 nm repumper detuning (Fig. S4a). Afterwards, the repumper detuning was set to MHz, where repumping is most efficient (Fig. S4a) and the detuning of the cooling laser was scanned (Fig. S4b). These two datasets were simultaneously fitted using the OBE model, allowing the determination of the following parameters: the effective laser intensities and linewidths, a detuning offset of the 866 nm laser, and a proportionality constant allowing to convert the measured fluorescence to the P-state population. The fitted laser linewidths were consistent with the observed fluctuations on the wavemeter. To optimize the fit, a magnetic field value of 1 Gauss was chosen, which is a reasonable value for the stray magnetic field in the present apparatus. The resulting , and state populations determined from this measurement are shown in Fig. S5. On resonance of the 866 nm repumper, the state population is minimal and the , population reach a maximum. The state populations as a function of resulting from this calibration are shown in Fig. 4a.
S4 Ground-state potential energy surface of the reaction of DBB with Ca+
To elucidate the mechanism of the present reaction, the PES of the system was explored using spin-unrestricted density-functional theory (DFT) with both the MPW1K [43] and B3LYP [41, 42] functionals. The def2-TZVPP basis set [44] was employed in both cases. Intrinsic reaction coordinates (IRCs) have been computed independently for both DFT methods. Relevant stationary points on the PES calculated with both methods are shown in Fig. S6. Both functionals yielded qualitatively similar result. Most of the geometries have been located with both methods, except structures TS1c and TS4b which were found exclusively by MPW1K. The optimized geometries are very similar for both approaches apart from structures TS3b and I5 that differ in bond order. The computed IRCs were found to be the same except for the pathway of TS2b connecting to I4 for MPW1K and to I5 for B3LYP.
The geometries of the energetically lowest reaction channels found, shown in the main text in Fig. 5, were further reoptimized using the Stuttgart effective core potential (ECP) [45] for the 10 inner shell electrons of bromine atoms for both B3LYP and MPW1K functionals. All structures were confirmed. The geometries were almost identical to the calculations omitting the core potentials. The energy differences and spin contamination were compared in order to investigate the reliability of the structure geometries in Tables S2 and S3 for MPW1K and B3LYP, respectively. Both methods gave very similar relative energies. Restricted open-shell single-point energy calculations were performed using Orca [54] on these geometries for further analysis. The single-point energies of the unrestricted and restricted-open-shell B3LYP are very similar suggesting no significant mixing of different electronic states.
| Name |
|
|
|||||
|---|---|---|---|---|---|---|---|
| gauche | 0.00 | 0.00 | - | ||||
| s-trans | -2.19 | -2.04 | - | ||||
| I1g | -33.12 | -30.84 | 0.7652 | ||||
| I1t | -36.77 | -34.31 | 0.7697 | ||||
| I2 | -26.15 | -22.50 | 0.7503 | ||||
| I3 | -54.12 | -50.32 | 0.7920 | ||||
| I4 | -54.46 | -49.55 | 0.8121 | ||||
| I6 | -60.89 | -57.02 | 0.7854 | ||||
| TS1g | -31.39 | -27.51 | 0.7789 | ||||
| TS1t | -32.82 | -28.88 | 0.7699 | ||||
| TS2 | -24.95 | -21.41 | 0.7504 | ||||
| TS3 | -53.06 | -48.45 | 0.8053 | ||||
| TS4 | -42.82 | -39.46 | 0.7988 | ||||
| P1 | -22.13 | -17.70 | 0.8113 | ||||
| P2 | -31.38 | -28.00 | 0.7928 | ||||
| P3 | -22.89 | -18.95 | 0.7946 |
| Name |
|
|
|
|||||||
|---|---|---|---|---|---|---|---|---|---|---|
| gauche | 0.00 | 0.00 | - | 0.00 | ||||||
| s-trans | -1.85 | -1.79 | - | -1.77 | ||||||
| I1g | -27.58 | -25.43 | 0.7551 | -24.64 | ||||||
| I1t | -31.05 | -28.92 | 0.7566 | -28.05 | ||||||
| I2 | -26.19 | -23.23 | 0.7503 | -23.14 | ||||||
| I3 | -54.26 | -51.56 | 0.7685 | -49.68 | ||||||
| I4 | -54.01 | -50.50 | 0.7776 | -48.08 | ||||||
| I5 | -59.51 | 58.27 | 0.7643 | -57.16 | ||||||
| I6 | -60.58 | -58.16 | 0.7670 | 56.37 | ||||||
| TS1g | -26.40 | -23.36 | 0.7588 | -22.40 | ||||||
| TS1t | -29.35 | -26.41 | 0.7622 | -25.29 | ||||||
| TS2 | -23.87 | -20.88 | 0.7503 | -20.74 | ||||||
| TS3 | -52.73 | -49.48 | 0.7746 | -47.22 | ||||||
| TS4 | -49.92 | -46.49 | 0.7739 | -44.31 | ||||||
| TS5 | -56.78 | -54.52 | 0.7624 | -53.51 | ||||||
| P1 | -23.20 | -20.22 | 0.7769 | -17.83 | ||||||
| P2 | -39.20 | -37.59 | 0.7649 | -36.36 | ||||||
| P3 | -24.39 | -21.98 | 0.7713 | -19.92 |
| B3LYP | HF | |||||
|---|---|---|---|---|---|---|
| Structure | SOMO | Ca-Br | -system | SOMO | Ca-Br | -system |
| I1g | ![[Uncaptioned image]](/html/2303.11813/assets/orb_B3LYP/I1_GAUCHE_ROKS_HOMO.png) |
![[Uncaptioned image]](/html/2303.11813/assets/orb_B3LYP/I1_GAUCHE_ROKS_pi2.png) |
![[Uncaptioned image]](/html/2303.11813/assets/orb_CCSDT/xyz_i1_gauche_1e1o_ibba_HOMO.png) |
![[Uncaptioned image]](/html/2303.11813/assets/orb_CCSDT/xyz_i1_gauche_1e1o_ibba_pi2.png) |
||
| I1t | ![[Uncaptioned image]](/html/2303.11813/assets/orb_B3LYP/I1_ROKS_HOMO.png) |
![[Uncaptioned image]](/html/2303.11813/assets/orb_B3LYP/I1_ROKS_pi.png) |
![[Uncaptioned image]](/html/2303.11813/assets/orb_CCSDT/xyz_i1_1e1o_ibba_HOMO.png) |
![[Uncaptioned image]](/html/2303.11813/assets/orb_CCSDT/xyz_i1_1e1o_ibba_dat.png) |
![[Uncaptioned image]](/html/2303.11813/assets/orb_CCSDT/xyz_i1_1e1o_ibba_pi2_notloc.png) |
|
| I2 | ![[Uncaptioned image]](/html/2303.11813/assets/x13.png) |
![[Uncaptioned image]](/html/2303.11813/assets/x14.png) |
![[Uncaptioned image]](/html/2303.11813/assets/x15.png) |
![[Uncaptioned image]](/html/2303.11813/assets/x16.png) |
![[Uncaptioned image]](/html/2303.11813/assets/x17.png) |
![[Uncaptioned image]](/html/2303.11813/assets/x18.png) |
| I3 | ![[Uncaptioned image]](/html/2303.11813/assets/orb_B3LYP/I2_ROKS_HOMO.png) |
![[Uncaptioned image]](/html/2303.11813/assets/orb_B3LYP/I2_ROKS_dat2.png) |
![[Uncaptioned image]](/html/2303.11813/assets/orb_B3LYP/I2_ROKS_pi2.png) |
![[Uncaptioned image]](/html/2303.11813/assets/orb_CCSDT/xyz_i2_1e1o_ibba_HOMO.png) |
![[Uncaptioned image]](/html/2303.11813/assets/orb_CCSDT/xyz_i2_1e1o_ibba_dat2.png) |
![[Uncaptioned image]](/html/2303.11813/assets/orb_CCSDT/xyz_i2_1e1o_ibba_pi2.png) |
| I4 | ||||||
| I5 | ![[Uncaptioned image]](/html/2303.11813/assets/orb_B3LYP/I4_ROKS_HOMO.png) |
![[Uncaptioned image]](/html/2303.11813/assets/orb_B3LYP/I4_ROKS_dat2.png) |
![[Uncaptioned image]](/html/2303.11813/assets/orb_B3LYP/I4_ROKS_pi2.png) |
![[Uncaptioned image]](/html/2303.11813/assets/orb_CCSDT/xyz_i4_1e1o_ibba_HOMO.png) |
![[Uncaptioned image]](/html/2303.11813/assets/orb_CCSDT/xyz_i4_1e1o_ibba_dat2_notloc.png) |
![[Uncaptioned image]](/html/2303.11813/assets/orb_CCSDT/xyz_i4_1e1o_ibba_pi2.png) |
| I6 | ![[Uncaptioned image]](/html/2303.11813/assets/orb_B3LYP/I6_ROKS_HOMO.png) |
|||||
| B3LYP | HF | |||||
|---|---|---|---|---|---|---|
| Structure | SOMO | Ca-Br | -system | SOMO | Ca-Br | -system |
| TS1g | ![[Uncaptioned image]](/html/2303.11813/assets/orb_B3LYP/TS2_GAUCHE_ROKS_HOMO.png) |
![[Uncaptioned image]](/html/2303.11813/assets/orb_B3LYP/TS2_GAUCHE_ROKS_pi2.png) |
![[Uncaptioned image]](/html/2303.11813/assets/orb_CCSDT/xyz_ts2_gauche_1e1o_ibba_HOMO.png) |
![[Uncaptioned image]](/html/2303.11813/assets/orb_CCSDT/xyz_ts2_gauche_1e1o_ibba_pi2_notloc.png) |
||
| TS1t | ![[Uncaptioned image]](/html/2303.11813/assets/orb_B3LYP/TS2_ROKS_HOMO.png) |
![[Uncaptioned image]](/html/2303.11813/assets/orb_B3LYP/TS2_ROKS_dat2.png) |
![[Uncaptioned image]](/html/2303.11813/assets/orb_B3LYP/TS2_ROKS_pi2.png) |
![[Uncaptioned image]](/html/2303.11813/assets/orb_CCSDT/xyz_ts2_1e1o_ibba_HOMO.png) |
![[Uncaptioned image]](/html/2303.11813/assets/orb_CCSDT/xyz_ts2_1e1o_ibba_dat2.png) |
![[Uncaptioned image]](/html/2303.11813/assets/orb_CCSDT/xyz_ts2_1e1o_ibba_pi2notloc.png) |
| TS2 | ![[Uncaptioned image]](/html/2303.11813/assets/x19.png) |
![[Uncaptioned image]](/html/2303.11813/assets/x20.png) |
![[Uncaptioned image]](/html/2303.11813/assets/x21.png) |
![[Uncaptioned image]](/html/2303.11813/assets/x22.png) |
![[Uncaptioned image]](/html/2303.11813/assets/x23.png) |
![[Uncaptioned image]](/html/2303.11813/assets/x24.png) |
| TS3 | ![[Uncaptioned image]](/html/2303.11813/assets/orb_B3LYP/TS4_ROKS_HOMO.png) |
![[Uncaptioned image]](/html/2303.11813/assets/orb_B3LYP/TS4_ROKS_Dat2.png) |
![[Uncaptioned image]](/html/2303.11813/assets/orb_B3LYP/TS4_ROKS_pi2.png) |
![[Uncaptioned image]](/html/2303.11813/assets/orb_CCSDT/xyz_ts4_1e1o_ibba_HOMO.png) |
![[Uncaptioned image]](/html/2303.11813/assets/orb_CCSDT/xyz_ts4_1e1o_ibba_dat2.png) |
![[Uncaptioned image]](/html/2303.11813/assets/orb_CCSDT/xyz_ts4_1e1o_ibba_pi2.png) |
| TS4 | ![[Uncaptioned image]](/html/2303.11813/assets/orb_B3LYP/TS5_ROKS_HOMO.png) |
![[Uncaptioned image]](/html/2303.11813/assets/orb_B3LYP/TS5_ROKS_dat2.png) |
![[Uncaptioned image]](/html/2303.11813/assets/orb_B3LYP/TS5_ROKS_pi2.png) |
![[Uncaptioned image]](/html/2303.11813/assets/orb_CCSDT/xyz_ts5_1e1o_ibba_HOMO.png) |
![[Uncaptioned image]](/html/2303.11813/assets/orb_CCSDT/xyz_ts5_1e1o_ibba_dat2.png) |
![[Uncaptioned image]](/html/2303.11813/assets/orb_CCSDT/xyz_ts5_1e1o_ibba_pi2.png) |
S5 PhysNet potential energy surface