Error-rate Prediction for Mouse-based Rectangular-target Pointing with no Knowledge of Movement Angles
Abstract.
In rectangular-target pointing, movement angles towards targets are known to affect error rates. When designers determine target sizes, however, they would not know the frequencies of cursor-approaching directions for each target. Thus, assuming that there are unbiasedly various angles, we derived models to predict error rates depending only on the target width and height. We conducted two crowdsourced experiments: a cyclic pointing task with a predefined movement angle and a multi-directional pointing task. The shuffle-split cross-validation with 60% training data showed , , and , suggesting good prediction accuracy even for predicting untested target sizes when designers newly set UI elements.
1. Introduction
To quantitatively determine how well users operate interactive systems, modeling error rates has attracted the interest of HCI researchers. Developing error-prediction models for target pointing is a hot topic as this task is one of the most frequently performed actions on PCs and touch devices (Bi and Zhai, 2016; Huang et al., 2019; Usuba et al., 2021; Yamanaka, 2021b).
We derived error-rate prediction models on mouse-based pointing for rectangular targets. Compared with traditional 1D ribbon-shaped or 2D circular targets, rectangular targets are recognized as more meaningful shapes in actual user interfaces (UIs) (Accot and Zhai, 2003; Hoffmann and Sheikh, 1994; Ko et al., 2020; Ma et al., 2021; Yamanaka, 2021a; Yang and Xu, 2010; Zhang et al., 2012). A notable difference of our work from previous mouse-based studies is that we did not use the initial cursor position of each trial, which prevented us from using the movement angle towards the target in the model. This condition corresponds to a realistic UI design work, that is, designers want users to click a target with certain accuracy (e.g., 3%) but would not know the frequencies of cursor-approach angles.
Conditions under which the approach angle is known are special cases, such as (a) a webpage has already been released and users’ cursor traces are recorded or (b) a UI element is located close to the screen edge; thus, the frequencies are biased. In more general cases, however, without prior knowledge, designers have no choice but to assume that the cursor reaches the target in various angles with no bias.
Error-rate prediction models that ignore movement angles have been proposed for touch-based pointing, in which a new target appears on the screen that participants tap (Bi and Zhai, 2016; Yamanaka and Usuba, 2020). It could be more probable that the finger waits near the screen center than near screen edges, so the finger may tend to reach, e.g., a target on the top edge of the screen with an upward movement. This means that not using movement angles is equivalent to merging various movement angles when predicting error rates (Yamanaka and Usuba, 2020).
Similarly to these touch-based pointing studies, we examined how well our error-rate models perform after merging various movement angles that our experimental system actually recorded. We conducted two experiments: one with four movement angles and one with a multi-directional task modified from the ISO 9241-9 standard (ISO, 2000). The cross-validation results indicate that, even when the training-data size decreased by 40%, the best-fit model could predict the error rates with , mean absolute error (, and root mean square error ( in Experiment 1, and , , and in Experiment 2.
2. Related Work
2.1. Predicting Error Rates in Pointing Tasks
Modeling movement times (s) in pointing tasks has been a popular topic in HCI, namely, studies on Fitts’ law (Fitts, 1954) and its variations (e.g., (Accot and Zhai, 2003; Zhang et al., 2012)). In traditional experiments with 1D ribbon-shaped or 2D circular targets, the target size is solely defined by its width (MacKenzie, 1992; Soukoreff and MacKenzie, 2004). Under this condition, click- or touch-points (i.e., endpoints) are assumed to be distributed normally over the target (Bi and Zhai, 2016; Crossman, 1956; MacKenzie, 1992; Wobbrock et al., 2008), but this assumption does not always hold (Welford et al., 1969; Yamanaka and Usuba, 2020).
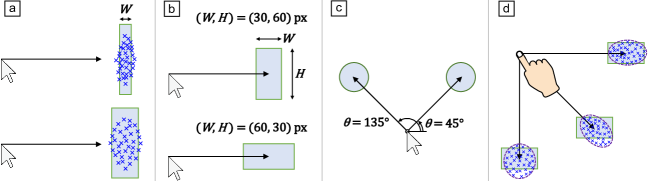
It is known that the error rate tends to be higher as decreases (e.g., (Fitts, 1954; Chapuis and Dragicevic, 2011; Yamanaka, 2021b); see Figure 1a). However, this relationship between and is not linear; thus, predicting the requires a more probabilistic process. The first step is to compute endpoint variability. For normally distributed endpoints in 1D pointing on x-axis movements, the mean position is located close to the target center (), and the variability (standard deviation ) increases with . It has been assumed that is proportionally related to or with a small intercept:
| (1) |
Hereafter, italic lowercase letters – refer to empirical constants. This formulation has been used for predicting endpoint variability in mouse-based (Yamanaka, 2021b) and virtual-reality pointing tasks (Yu et al., 2019). As shown by this equation, the distance from the initial cursor (or finger) position to the target does not affect the endpoint distribution if users have sufficient time to aim for the target (Bi and Zhai, 2016; Crossman, 1956; Yamanaka and Usuba, 2020; Yamanaka, 2021b). We do not intend to run time-limited or ballistic (i.e., not using visual feedback) pointing tasks, where the target distance affects the distributions (BEGGS et al., 1974; Grossman and Balakrishnan, 2005; Lin and Tsai, 2015; Schmidt et al., 1979; Wobbrock et al., 2008).
The second step is to compute the on the basis of . By using the Gauss error function , the is derived as
| (2) |
For a new target condition, we can accurately predict by using Equation 1 then obtain the on the basis of the new and predicted by using Equation 2. For example, Yamanaka conducted a mouse-pointing task with ranging from 8 to 78 pixels and obtained for Equation 1 and for Equation 2 in leave-one-out cross-validation, which demonstrated good prediction accuracy for unknown target conditions (Yamanaka, 2021b).
2.2. Endpoint Distribution and Error Rate in Rectangular Target Pointing
Pointing to rectangular targets, which have another dimension (height ), has been studied to predict s (Accot and Zhai, 2003; Bohan et al., 2003; Crossman, 1956; Hoffmann and Sheikh, 1994; Kvålseth, 1977; Yamanaka, 2021a). We define and as the target sizes on the x- and y-axes on the screen, respectively, as in these studies.
Endpoint distributions for rectangular targets have been studied in several contexts. In a study on typing on a smartphone keyboard with and mm for each key, the tap points were reported as close to bivariate normal distributions (Azenkot and Zhai, 2012). This was consistent with a study by Wang and Ren (Wang and Ren, 2009). In a game-like moving-target pointing task on a touchscreen, Huang et al. proposed the 2D Ternary-Gaussian model (Huang et al., 2019). This model includes more complex factors, such as finger-touch ambiguity and movement-speed effect, to model endpoint variability.
In Hoffmann and Sheikh’s horizontal-movement experiment, they tested 10, 20, and 40 mm, and 1, 2, 5, 10, 20, 40, and 200 mm. They reported that (a) was significantly affected by but not by , and the interaction between and was significant; and (b) the endpoint variability on the y-axis was significantly affected by but not by , and the interaction was not significant. The results indicated that as either or increased, the on that axis almost linearly increased. The for (, ) was 0.91, and that for (, ) was 0.87. After eliminating an extremely large of 200 mm, the for (, ) was 0.97. Thus, for reasonable ranges where or constrains endpoints, we can assume that the endpoints spread more widely as the target size on that axis increases.
A similar conclusion was found in Yamanaka’s dataset in a crowdsourcing experiment on a horizontal-movement task (Yamanaka, 2021a). He tested 30, 40, 60, and 90 pixels, and 10, 20, 30, 40, 60, 100, and 200 pixels. The regressions of the 28 fitting points showed both for and . He also showed that, even when the movement angle and ratio of to are the same, the s are not consistent. When pixels, the was 3.067%, while that for was 2.207%, which showed a significant pairwise difference (); see Figure 1b. Thus, the would be higher when the movement-axis size is smaller.
2.3. Effect of Movement Angle on Pointing Performance
The movement angle towards the target is another objective in the pointing paradigm. For modeling s, studies have shown that the times change depending on the angles, e.g., horizontal movements required a shorter time than vertical ones (Appert et al., 2008; Thompson et al., 2004; Whisenand and Emurian, 1995; Yang and Xu, 2010; Zhang et al., 2012).
In comparison, studies on s regarding the movement angle are rare. One example is the work by Hertzum and Hornbæk who used circular targets and eight movement directions (Hertzum and Hornbæk, 2010). They showed that the s for the top-right direction and top-left one were approximately 7.5 and 9%, respectively, for right-handed mouse users (Figure 1c). For touchpad usage, the downward movement showed the largest of 13%, and the smallest of 10% was observed for the rightward movement. Thus, the changes depending on the movement angle as well as the device.
Ma et al. proposed the Rotational Dual Gaussian Model to predict touch-point distributions (Ma et al., 2021). They strictly controlled the movement angle in each trial and proposed a target-size adjustment method based on the movement angle, called projected target width and height. They showed that the endpoints were affected by and , as well as the movement angle; the endpoint variability became larger on the movement axis than the perpendicular axis (Figure 1d). They showed that their proposed model could estimate s more accurately than a model without using the angle.
Therefore, if researchers can distinguish each pointing trial’s movement angle, the prediction accuracy of an model would improve. However, this is a kind of special case in which we can record, e.g., the cursor trajectory in a pointing-experiment system for research purposes, but the feasibility would be low for practitioners to use the model when they design UIs. Hence, our research question is, if we cannot know the movement angles and we merge the data from various angles, can we accurately predict the s?
In summary, although the importance of models for rectangular targets and developing models have been recognized individually, models for rectangular target pointing have rarely been studied. Because Ma et al. have shown that integrating the movement angle significantly outperformed the angle-ignored model (Ma et al., 2021), we focus only on the prediction accuracy when the movement angle is unknown, i.e., various angles appear unbiasedly and the data are analyzed after merging.
3. Model Derivation
As with the regression, and as Hoffmann and Sheikh demonstrated (Hoffmann and Sheikh, 1994), we use the following equation to predict :
| (3) |
Because our assumption is that we cannot know the movement angle, and are independent from the movement axis, i.e., these are the endpoints’ values measured on the screen. Equations 1 and 3 are the simplest models to predict and , but Hoffmann and Sheikh found that the interaction of and had a significant effect on . As we later show, also had a main effect on , and had a main effect on . Given that the interaction of and could be significant on and , the possible more complicated formulations are
| (4) |
The interaction terms will be determined from our experimental results. If the effect of to increase increases with , the term should be . In contrast, if the effect decreases as increases, it should be . Similarly, if the effect of to increase decreases as increases, the interaction term is .111Both multiplication and division can be used (Statinfer, 2018), and previous studies used a similar empirical approach to determine the division form for the interaction or covariance term to model (Huang et al., 2018, 2019; Zhou et al., 2009). Another policy for variability fitting is to use the squares of variables then take a square-root, e.g., . We tested both methods and found no notable difference; thus, we used the simpler one, as in previous studies (Yamanaka, 2021b; Yu et al., 2019).
We assume that the endpoints follow a bivariate normal distribution, and the mean of click-points is located at the target center (). Thus, the probability that a click position falls inside the target area is
| (5) |
where and is the correlation for the endpoint distributions on the x- and y-axes. Because we assume that is negligible () when merging various movement angles (Bi and Zhai, 2016; Yamanaka and Usuba, 2020), we have
| (6) |
Note that is concerning whether the endpoint distribution’s ellipse is diagonal, while “interaction” in Equation 4 is concerning if the variability size increases with the interaction term. Because the target area’s x and y ranges are independent, the double integrals can be split, and the former and latter halves are written by Gauss error functions:
| (7) |
Finally, we obtain the as :
| (8) |
What we do is to simply compute the success rates for the x- and y-axes independently, multiply them, and subtract the product from one. However, we used several simplifications and assumptions, such as that is negligible, and the appropriate formulations to predict the interaction terms for and are also unknown. We should thus empirically determine the formulations and evaluate our model’s prediction accuracy.
4. Experiment 1: Cyclic Pointing with Four Movement Angles
Because recruiting numerous participants helps researchers obtain the central tendency of s (Yamanaka, 2021b), we conducted a cyclic pointing experiment on the Yahoo! Crowdsourcing platform (https://crowdsourcing.yahoo.co.jp). The experimental system was developed with the Hot Soup Processor programming language. The crowdworkers were asked to download and run an executable file to perform the task. Our affiliation’s IRB-equivalent research ethics team and the crowdsourcing platform approved this study.
4.1. Task, Design, and Procedure
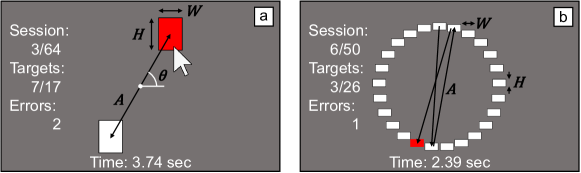
In the task window ( pixels), two rectangular targets were displayed (Figure 2a). If the workers clicked the target, the red target and white non-target switched colors, and they repeatedly performed this action back and forth. If the workers missed the target, it flashed yellow and they had to keep trying until successfully clicking it. The distance between the target centers was fixed to pixels. The movement angle was defined as . A session consisted of 17 clicks for a fixed condition. The first target was on the left side (or the bottom when ).
This study was a repeated-measures design with two independent variables: and (30, 50, 80, and 120 pixels for both). While we did not include as an independent variable, we tested four s (, , , and ), which included two directions of outbound/return (e.g., rightward and leftward movements, respectively, for when ). We chose these four values so that ranged from horizontal to vertical angles. While we would like to include more angles, we limited the range to to avoid an overly large number of task conditions.
The order of the 64 conditions was randomized. The first three out of 17 clicks for each session were eliminated. Thus, were recorded for each worker. Trials in which we observed one or more clicks outside the target were flagged as an error. The dependent variables were , , and .
4.2. Participants and Recruitment
We requested no specific PC skills of the crowdworkers, but used the “White List” option in the crowdsourcing platform for screening newly created accounts. This option enabled us to offer the task only to workers who were considered reliable on the basis of their previous task history.
To reduce noise introduced by multiple pointing devices, we asked the workers to use a mouse if they had one. Nevertheless, we explained that any device was acceptable then removed the non-mouse users from the analysis. To increase ecological validity, the workers were not asked to change the cursor speed or acceleration function.
Once workers accepted the task, they were asked to read the online instructions, which stated that they should perform the pointing task as rapidly and accurately as possible. After they finished all sessions and completed the questionnaire, they uploaded the log data file to a server to receive payment.
In total, 210 mouse-users completed the task. The participants’ demographics were as follows. Age: ranging from 20 to 76 years, and . Gender: 176 were male and 34 were female. Handedness: 189 were right-handed and 21 were left-handed. Windows version: 190 used Win 10, 15 Win 7, 4 Win 8, and 1 Vista. PC usage history: ranged from 0 (less than 1 year) to 40 years, and .
Each worker received JPY 200 (USD 1.77). The time for the pointing task ranged from 7 min 53 sec to 23 min 5 sec ( 13 min 1 sec). Thus, the effective hourly payment was JPY 922 (USD 7.95) on average. Note that this effective payment could change depending on other factors such as the time for reading the instructions.
5. Results of Experiment 1
5.1. Outlier Data Screening
We removed spatial outliers if the distance of the first click position was shorter than (Banovic et al., 2013; MacKenzie and Isokoski, 2008) to omit clear accidental operations such as double-clicking the previous target. Another criterion used in these laboratory-based studies was to remove trials in which the click position was more than from the target center, but we did not use this criterion, as there are a variety of target-size definitions in our diagonal-movement task with rectangular targets (MacKenzie and Buxton, 1992).
To remove extremely fast or slow operations, we used the inter-quartile range () method (Devore, 2011). The is defined as the difference between the first and third quartiles of the for each session. Trials in which was more than higher than the third quartile or more than lower than the first quartile were removed.
For participant-level outliers, we calculated the mean across all 64 sessions for each worker. Using each worker’s mean , we again applied the method for each worker.
5.2. Analyses of Dependent Variables
5.2.1.
While ANOVAs can be robust regardless of the data distribution (Dixon, 2008; Mena et al., 2017), it is better to log-transform the data for detecting statistical significance more appropriately. The log-transformed data from 7 out of 16 conditions () passed the Shapiro-Wilk normality test (), or 43.75%. This normality test was conducted to examine if the 208 workers’ data distributed normally, and the results were independent from whether the endpoints were distributed normally. We used RM-ANOVAs with the Bonferroni -value adjustment method for pairwise tests. Throughout this paper, for the statistic, the degrees of freedom were corrected using the Greenhouse-Geisser method when Mauchly’s sphericity assumption was violated ().
We found significant main effects of (, , ) and (, , ) on . The interaction of and was significant (, , ). For all pairwise comparisons for and , the differences were significant (with at least). As either or increased, increased. For the interaction effect, all pairwise comparisons showed at least.
5.2.2.
For the log-transformed data, 6 out of 16 conditions passed the normality test (37.5%). We found significant main effects of (, , ) and (, , ) on . The interaction of and was significant (, , ). For all pairwise comparisons for and , the differences were significant (with at least), except for vs. pixels () and vs. pixels (). As the or increased, increased.
5.2.3. Error Rate
We used non-parametric ANOVAs with the aligned rank transform with multi-factor contrast tests for pairwise comparisons (Elkin et al., 2021; Wobbrock et al., 2011) with Holm’s method for -value adjustment. We found significant main effects of (, , ) and (, , ) on the . The interaction of and was significant (, , ). As the or increased, the decreased.
5.3. Model Fitting
For the conditions, 2,814 data points of passed the normality test, or 84.6%. For , 2,561 data passed (77.0%). We found that 2,666 data points passed the bivariate normality test (80.1%). These rates were lower than those in previous studies (Bi and Zhai, 2013; Yamanaka and Usuba, 2020).
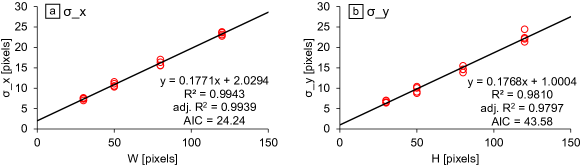
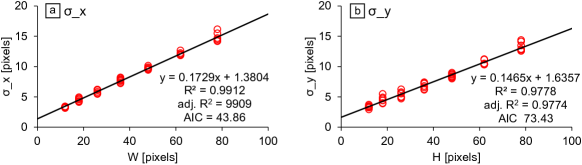
The s were almost linearly related to the target sizes (); see Figure 3. Thus, using only for predicting and only for is possible (Equations 1 and 3, respectively). Yet, as we observed the significant main effects of and both for and , as well as the interaction of and , we used the 3-variable formulations (Equation 4).
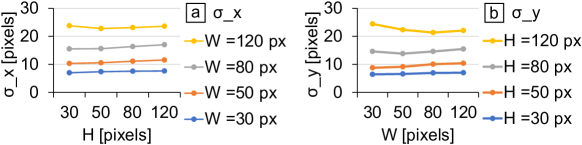
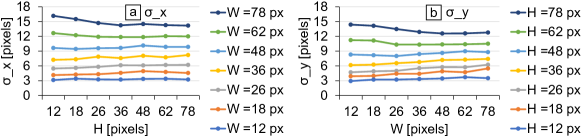
As shown in Figure 4a, when pixels (the yellow line), the largest was observed under the -pixel condition. In contrast, for the other conditions, the increased as increased. Hence, the positive effect of on reduced as increased; therefore, we added the interaction term of and as . This interaction was more clearly observed for the result (Figure 4b), and the interaction term on was added as . We obtained the fitting results as follows.
| (9) | ||||||||||
| (10) |
For , the difference from the 1-variable formulation (; see Figure 3a) was greater than 2. Thus, this 3-variable version was significantly better (Devore, 2011) and the two additional terms ( and ) did not cause overfitting. This is also true for .
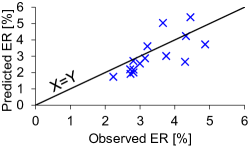
Using these regression expressions, we obtain the predicted and for each target condition then compute the s by using Equation 8. The observed vs. predicted s are shown in Figure 5a. The results of three metrics to evaluate prediction accuracy were , , and .
These results are, however, worse than those for the s using 1-variable formulations to predict and . The comparison is shown in Table 1 (see the “All data” column). The results are , , and .
| formulation | Metric | All data | 80% train : 20% test | 70% train : 30% test | 60% train : 40% test |
|---|---|---|---|---|---|
| 0.8862 | 0.8482 | 0.8326 | 0.8145 | ||
| 1-variable | [%] | 0.5758 | 0.6208 | 0.6177 | 0.6596 |
| [%] | 0.6259 | 0.6766 | 0.6878 | 0.7474 | |
| 0.5315 | 0.7398 | 0.6648 | 0.5409 | ||
| 3-variable | [%] | 0.8270 | 0.8712 | 0.8921 | 0.9318 |
| [%] | 1.0589 | 1.0513 | 1.1011 | 1.1981 |
5.4. Cross Validation
In the above-mentioned results, we used all data from 16 target conditions to be fitted. To investigate the prediction accuracy for future (unknown) task conditions, we ran shuffle-split cross-validations to evaluate the prediction accuracy when the training data size becomes smaller.
We used three ratios of (train:test) data: (80%:20%), (70%:30%), and (60%:40%). For example, when the training data size is 70%, we randomly choose ceil conditions for computing the coefficients of models then predict the s for the remaining four conditions. By comparing the predicted vs. observed s for the four test data, we obtain , , and . We repeatedly carried out this process over 100 iterations to handle the sampling randomness when splitting the training and test datasets and obtained the average values of the three metrics. The results are shown in Table 1.
5.5. Discussion of Experiment 1
Better fits were observed for the 1-variable formulation regardless of the analyses of all-data or cross-validation. However, as a limitation of Experiment 1, the number of movement angles were still limited. This caused an issue that the x- and y-axes distributions had correlations () ranging from to for the 16 target conditions, and the mean was . A negative indicates that the spread of endpoints had an ellipse diagonal along the top-right to bottom-left direction on the screen. This is obviously because we tested only such angles () and is consistent with Ma et al.’s report on rectangular-target pointing with known movement angles (Ma et al., 2021).
This range is statistically considered “negligible correlations” (Witz, 1990), which supported our simplification. Yet, to check whether the lower fitness was observed due to the lack of , we use the correlations for the 16 fitting points in the more complete version of probability computation (Equation 5). The was for the all-data analysis, which has only a 0.0005-point difference from the correlation-ignored 3-variable formulation version. Therefore, integrating the correlations did not improve prediction accuracy.
Furthermore, the target sizes were somewhat large (30 to 120 pixels), which enabled the workers to point to targets with a certain accuracy (less than 5%; see Figure 5). This made it difficult for us to determine if the models could accurately predict s when it would be higher, e.g., 8%. To address these limitations, we conducted Experiment 2.
6. Experiment 2: Multi-directional Pointing
To further validate our models, we conducted Experiment 2 with much more variety of angles and smaller target sizes. We used the same crowdsourcing platform, and the points of difference are described in the following subsections.
6.1. Participants
In total, 267 mouse-users completed the task. Age: ranging from 17 to 73 years, and . Gender: 229 were male, 36 were female, 2 did not answer. Handedness: 247 were right-handed and 20 were left-handed. Windows version: 229 used Win 10, 22 Win 7, 9 Win 11, 6 Win 8, and 1 Vista. PC usage history: ranged from 1 to 45 years, and . Each worker received JPY 250 (USD 2.26). The time for the task ranged from 14 min 2 sec to 40 min 8 sec ( 19 min 45 sec). The effective hourly payment was JPY 759 (USD 6.55) on average.
6.2. Task, Design, and Procedure
This task was a modified version of the ISO 9241-9 standard (ISO, 2000) with rectangular targets. Twenty-five targets appeared in a ring-shaped arrangement, and the first target was located at the top of the window (Figure 2b). If the participants clicked it, the next target (bottom-left one) turned red, and they successively selected the targets in a pre-programmed order. The was fixed to 500 pixels. A session consisted of 26 selections (the top target acted as the start and end ones) for a fixed condition.
This study was a repeated-measures design with two independent variables of and : 12, 18, 26, 36, 48, 62, and 78 pixels for both. The order of the 49 conditions was randomized. The first click for each session was eliminated, and the remaining 25 clicks were analyzed. Thus, were recorded for each participant. Before the first session, the participants performed a practice session with , , and pixels, i.e., the condition that was not used in the main 49 sessions.
7. Results of Experiment 2
We used the same outlier-detection criteria as in Experiment 1. Among the 327,075 trials (), we removed 3,465 trial-level and one participant-level outliers. Because the outlier worker also exhibited trial-level outliers, the data from 4,663 trials were removed (1.43%).
7.1. Analyses of Dependent Variables
7.1.1.
We found that the log-transformed data passed the normality test for 18 out of 49 conditions (), or 36.7%. An RM-ANOVA showed significant main effects of (, , ) and (, , ) on . The interaction of and was significant (, , ). For all pairwise comparisons for and , the differences were significant (with at least). For the interaction effect, all pairwise comparisons showed .
7.1.2.
We found that the log-transformed data passed the normality test for 14 conditions, or 28.6%. An RM-ANOVA showed significant main effects of (, , ) and (, , ) on . The interaction of and was significant (, , ). For all pairwise comparisons for and , the differences were significant (with at least). For the interaction effect, all pairwise comparisons showed .
7.1.3. Error Rate
A non-parametric ANOVA with aligned rank transform showed significant main effects of (, , ) and (, , ) on . The interaction of and was significant (, , ). The differences were not significant for (48, 62), (48, 78), and (62, 78) pixels, while the other pairs showed significant differences (). This was also true for the same s. Thus, the significant differences disappeared as and increased.
When either or was small, it had a stronger effect to increase the . For example, when pixels, the for showed a significant pairwise difference only from pixels (7.612 vs. 6.073%, respectively; ). In comparison, when pixels, the for showed for all the other s, ranging from 0.835% () to 9.079% (). This clearly showed the interaction effect of and on .
7.2. Model Fitting
For the conditions, 11,764 data points of passed the normality test, or 90.3%. For , 11,690 data passed (89.7%). We found that 11,955 data points passed the bivariate normality test (91.7%). The assumption that the endpoints are distributed normally was more supported than in Experiment 1.
The endpoint variabilities were almost linearly related to the target sizes (); see Figure 6. As we observed a similar interaction effect between and as in Experiment 1 (see Figure 7), we examined the 3-variable formulations with the interaction terms of and . The following coefficients were obtained.
| (11) | |||
| (12) |
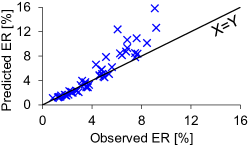
The observed vs. predicted s are shown in Figure 8. The results of the prediction-accuracy metrics are summarized in Table 2.
7.3. Cross Validation
The s ranged from 0.835 to 9.19% (Figure 8), which were more widely spread than in Experiment 1 (ranging from 2.23 to 4.87%). This enables us to evaluate the models’ validity more thoroughly. As shown in Table 2, the 3-variable formulations exhibited better prediction accuracy in terms of regardless of the training data size.
| formulation | Metric | All data | 80% train : 20% test | 70% train : 30% test | 60% train : 40% test |
|---|---|---|---|---|---|
| 0.8189 | 0.8310 | 0.8229 | 0.8182 | ||
| 1-variable | [%] | 1.0853 | 1.1781 | 1.1789 | 1.2568 |
| [%] | 1.8260 | 1.8575 | 1.8645 | 2.0179 | |
| 0.8810 | 0.8943 | 0.8730 | 0.8627 | ||
| 3-variable | [%] | 1.0919 | 1.0597 | 1.1883 | 1.2283 |
| [%] | 1.8327 | 1.7008 | 1.9248 | 2.0459 |
7.4. Discussion of Experiment 2
The 3-variable formulations showed better fits than the 1-variable ones in terms of . Because we used much smaller sizes of and than in Experiment 1, the perpendicular-axis target size affected the s more strongly, which forced us to use the 3-variable formulations to accurately predict s.
For the 49 target conditions, the of endpoints ranged from to , and the mean was . The absolute value was considerably smaller than that in Experiment 1 (mean was ). When we used the s for the 49 fitting points in the more complete version of probability computation (Equation 5), the model showed for the all-data analysis, which is equal to the -ignored version (see Table 2), while there was in actuality a 0.0001-point difference. Therefore, when assuming that users aim for the target in various movement angles, ignoring the correlations does not damage prediction accuracy, which supported our simplification.
8. Conclusions and Future Work
The appropriate formulation changed in the two experiments. In Experiment 1, using the simple 1-variable formulation (Equations 1 and 3) showed the best fit in accordance with the cross-validation. In Experiment 2, however, the 3-variable formulation (Equation 4) achieved better fits. As we used much smaller target sizes in Experiment 2, the perpendicular-axis size affected the ; thus, accurate prediction required considering the endpoint-variability changes depending on both and .
As we explained in Experiment 1, when the s are always low, we do not need to use the 3-variable formulations. Yet, when designers have to use smaller targets due to, e.g., the space limitation of webpages, the necessity to predict s would increase. Hence, the 3-variable formulation will work well in more general cases.
The findings and model validation in this study were limited to the extent of our experimental design, such as the target sizes we used. While we assumed that the target distance does not affect the endpoint variability in accordance with previous studies (Bi et al., 2013; Huang et al., 2018; Yamanaka and Usuba, 2020), this assumption does not hold when users exhibit ballistic movements (BEGGS et al., 1974; Grossman and Balakrishnan, 2005). Our instruction to select a target as rapidly and accurately as possible is just one strategy from among various speed-accuracy balances. Using only mice was another limitation of this study; thus, we plan to evaluate our models with other input methods such as touch-based pointing where other factors would affect endpoint variability (Bi and Zhai, 2016).
Our next step is to analyze the prediction accuracy of our models when the frequencies of movement angles are known. For example, for a target near the top edge of the screen, it is less likely to move the cursor with downward movements; thus, the frequencies of other angles (upward, leftward, diagonally upward, etc.) relatively increase. Under such a condition, the s would be more sensitively affected by rather than , because the frequency of vertical movements are low. We plan to investigate how we should give weights to the probabilities of each movement angle to accurately predict the overall .
When we can record the cursor trace on a certain webpage or application, there is another challenge to be addressed, i.e., determine the initial cursor position from continuous movements. Chapuis et al. described the difficulty in this data processing to segment cursor trajectory (Chapuis et al., 2007). They also showed that each pointing did not exhibit a straight-forward motion towards a target; some were linear but others were zig-zag and curved. Thus, our models, which do not use movement angles, are perhaps useful for practical purposes.
References
- (1)
- Accot and Zhai (2003) Johnny Accot and Shumin Zhai. 2003. Refining Fitts’ Law Models for Bivariate Pointing. In Proceedings of the SIGCHI Conference on Human Factors in Computing Systems (Ft. Lauderdale, Florida, USA) (CHI ’03). ACM, New York, NY, USA, 193–200. https://doi.org/10.1145/642611.642646
- Appert et al. (2008) Caroline Appert, Olivier Chapuis, and Michel Beaudouin-Lafon. 2008. Evaluation of Pointing Performance on Screen Edges. In Proceedings of the Working Conference on Advanced Visual Interfaces (Napoli, Italy) (AVI ’08). Association for Computing Machinery, New York, NY, USA, 119–126. https://doi.org/10.1145/1385569.1385590
- Azenkot and Zhai (2012) Shiri Azenkot and Shumin Zhai. 2012. Touch Behavior with Different Postures on Soft Smartphone Keyboards. In Proceedings of the 14th International Conference on Human-computer Interaction with Mobile Devices and Services (San Francisco, California, USA) (MobileHCI ’12). ACM, New York, NY, USA, 251–260. https://doi.org/10.1145/2371574.2371612
- Banovic et al. (2013) Nikola Banovic, Tovi Grossman, and George Fitzmaurice. 2013. The Effect of Time-based Cost of Error in Target-directed Pointing Tasks. In Proceedings of the SIGCHI Conference on Human Factors in Computing Systems (Paris, France) (CHI ’13). ACM, New York, NY, USA, 1373–1382. https://doi.org/10.1145/2470654.2466181
- BEGGS et al. (1974) W. D. A. BEGGS, RUTH SAKSTEIN, and C. I. HOWARTH. 1974. The Generality of a Theory of the Intermittent Control of Accurate Movements. Ergonomics 17, 6 (1974), 757–768. https://doi.org/10.1080/00140137408931422
- Bi et al. (2013) Xiaojun Bi, Yang Li, and Shumin Zhai. 2013. FFitts Law: Modeling Finger Touch with Fitts’ Law. In Proceedings of the SIGCHI Conference on Human Factors in Computing Systems (Paris, France) (CHI ’13). ACM, New York, NY, USA, 1363–1372. https://doi.org/10.1145/2470654.2466180
- Bi and Zhai (2013) Xiaojun Bi and Shumin Zhai. 2013. Bayesian Touch: A Statistical Criterion of Target Selection with Finger Touch. In Proceedings of the 26th Annual ACM Symposium on User Interface Software and Technology (St. Andrews, Scotland, United Kingdom) (UIST ’13). Association for Computing Machinery, New York, NY, USA, 51–60. https://doi.org/10.1145/2501988.2502058
- Bi and Zhai (2016) Xiaojun Bi and Shumin Zhai. 2016. Predicting Finger-Touch Accuracy Based on the Dual Gaussian Distribution Model. In Proceedings of the 29th Annual Symposium on User Interface Software and Technology (Tokyo, Japan) (UIST ’16). ACM, New York, NY, USA, 313–319. https://doi.org/10.1145/2984511.2984546
- Bohan et al. (2003) Michael Bohan, Mitchell Longstaff, Arend Van Gemmert, Miya Rand, and George Stelmach. 2003. Effects of target height and width on 2D pointing movement duration and kinematics. Motor control 7 (08 2003), 278–289. Issue 3. https://doi.org/10.1123/mcj.7.3.278
- Chapuis et al. (2007) Olivier Chapuis, Renaud Blanch, and Michel Beaudouin-Lafon. 2007. Fitts’ Law in the Wild: A Field Study of Aimed Movements. Technical Report. LRI, Université Paris Sud & INRIA. https://hal.archives-ouvertes.fr/hal-00612026 LRI Technical Repport Number 1480, Univ. Paris-Sud.
- Chapuis and Dragicevic (2011) Olivier Chapuis and Pierre Dragicevic. 2011. Effects of Motor Scale, Visual Scale, and Quantization on Small Target Acquisition Difficulty. ACM Trans. Comput.-Hum. Interact. 18, 3, Article 13 (Aug. 2011), 32 pages. https://doi.org/10.1145/1993060.1993063
- Crossman (1956) Edward R.F.W. Crossman. 1956. The speed and accuracy of simple hand movements. Ph.D. Dissertation. University of Birmingham.
- Devore (2011) Jay L. Devore. 2011. Probability and Statistics for Engineering and the Sciences (8th ed.). Brooks/Cole, Pacific Grove, CA. ISBN-13: 978-0-538-73352-6.
- Dixon (2008) Peter Dixon. 2008. Models of accuracy in repeated-measures designs. Journal of Memory and Language 59, 4 (2008), 447–456.
- Elkin et al. (2021) Lisa A. Elkin, Matthew Kay, James J. Higgins, and Jacob O. Wobbrock. 2021. An Aligned Rank Transform Procedure for Multifactor Contrast Tests. In The 34th Annual ACM Symposium on User Interface Software and Technology (Virtual Event, USA) (UIST ’21). Association for Computing Machinery, New York, NY, USA, 754–768. https://doi.org/10.1145/3472749.3474784
- Findlater et al. (2017) Leah Findlater, Joan Zhang, Jon E. Froehlich, and Karyn Moffatt. 2017. Differences in Crowdsourced vs. Lab-based Mobile and Desktop Input Performance Data. In Proceedings of the 2017 CHI Conference on Human Factors in Computing Systems (Denver, Colorado, USA) (CHI ’17). ACM, New York, NY, USA, 6813–6824. https://doi.org/10.1145/3025453.3025820
- Fitts (1954) Paul M. Fitts. 1954. The information capacity of the human motor system in controlling the amplitude of movement. Journal of Experimental Psychology 47, 6 (1954), 381–391. https://doi.org/10.1037/h0055392
- Grossman and Balakrishnan (2005) Tovi Grossman and Ravin Balakrishnan. 2005. A Probabilistic Approach to Modeling Two-dimensional Pointing. ACM Trans. Comput.-Hum. Interact. 12, 3 (Sept. 2005), 435–459. https://doi.org/10.1145/1096737.1096741
- Hertzum and Hornbæk (2010) Morten Hertzum and Kasper Hornbæk. 2010. How Age Affects Pointing With Mouse and Touchpad: A Comparison of Young, Adult, and Elderly Users. International Journal of Human-Computer Interaction 26, 7 (2010), 703–734. https://doi.org/10.1080/10447318.2010.487198
- Hoffmann and Sheikh (1994) Errol R. Hoffmann and Ilyas H. Sheikh. 1994. Effect of varying target height in a Fitts’ movement task. Ergonomics 37, 6 (1994), 1071–1088. https://doi.org/10.1080/00140139408963719
- Huang et al. (2018) Jin Huang, Feng Tian, Xiangmin Fan, Xiaolong (Luke) Zhang, and Shumin Zhai. 2018. Understanding the Uncertainty in 1D Unidirectional Moving Target Selection. In Proceedings of the 2018 CHI Conference on Human Factors in Computing Systems (Montreal QC, Canada) (CHI ’18). Association for Computing Machinery, New York, NY, USA, Article 237, 12 pages. https://doi.org/10.1145/3173574.3173811
- Huang et al. (2019) Jin Huang, Feng Tian, Nianlong Li, and Xiangmin Fan. 2019. Modeling the Uncertainty in 2D Moving Target Selection. In Proceedings of the 32nd Annual ACM Symposium on User Interface Software and Technology (New Orleans, LA, USA) (UIST ’19). Association for Computing Machinery, New York, NY, USA, 1031–1043. https://doi.org/10.1145/3332165.3347880
- ISO (2000) ISO. 2000. ISO 9241-9. International standard: ergonomic requirements for office work with visual display terminals (VDTs)–Part 9: requirements for non-keyboard input devices, International Organization for Standardization.
- Ko et al. (2020) Yu-Jung Ko, Hang Zhao, Yoonsang Kim, IV Ramakrishnan, Shumin Zhai, and Xiaojun Bi. 2020. Modeling Two Dimensional Touch Pointing. In Proceedings of the 33rd Annual ACM Symposium on User Interface Software and Technology (Virtual Event, USA) (UIST ’20). Association for Computing Machinery, New York, NY, USA, 858–868. https://doi.org/10.1145/3379337.3415871
- Kvålseth (1977) Tarald O. Kvålseth. 1977. A Generalized Model of Temporal Motor Control Subject to Movement Constraints. Ergonomics 20, 1 (1977), 41–50. https://doi.org/10.1080/00140137708931599
- Lin and Tsai (2015) Ray F. Lin and Yi-Chien Tsai. 2015. The use of ballistic movement as an additional method to assess performance of computer mice. International Journal of Industrial Ergonomics 45 (2015), 71–81. https://doi.org/10.1016/j.ergon.2014.12.003
- Ma et al. (2021) Yan Ma, Shumin Zhai, IV Ramakrishnan, and Xiaojun Bi. 2021. Modeling Touch Point Distribution with Rotational Dual Gaussian Model. Association for Computing Machinery, New York, NY, USA, 1197–1209. https://doi.org/10.1145/3472749.3474816
- MacKenzie (1992) I. Scott MacKenzie. 1992. Fitts’ law as a research and design tool in human-computer interaction. Human-Computer Interaction 7, 1 (1992), 91–139. https://doi.org/10.1207/s15327051hci0701_3
- MacKenzie and Buxton (1992) I. Scott MacKenzie and William Buxton. 1992. Extending Fitts’ Law to Two-dimensional Tasks. In Proceedings of the SIGCHI Conference on Human Factors in Computing Systems (Monterey, California, USA) (CHI ’92). ACM, New York, NY, USA, 219–226. https://doi.org/10.1145/142750.142794
- MacKenzie and Isokoski (2008) I. Scott MacKenzie and Poika Isokoski. 2008. Fitts’ Throughput and the Speed-Accuracy Tradeoff. In Proceedings of the SIGCHI Conference on Human Factors in Computing Systems (Florence, Italy) (CHI ’08). ACM, New York, NY, USA, 1633–1636. https://doi.org/10.1145/1357054.1357308
- Mena et al. (2017) Blanca Mena, M José, Rafael Alarcón, Jaume Arnau Gras, Roser Bono Cabré, and Rebecca Bendayan. 2017. Non-normal data: Is ANOVA still a valid option? Psicothema 29, 4 (2017), 552–557.
- Schmidt et al. (1979) Richard A. Schmidt, Howard N. Zelaznik, Bob Hawkins, James S. Frank, and J. T. Quinn. 1979. Motor-output variability: a theory for the accuracy of rapid motor acts. Psychological review 86, 5 (1979), 415–451.
- Soukoreff and MacKenzie (2004) R. William Soukoreff and I. Scott MacKenzie. 2004. Towards a standard for pointing device evaluation, perspectives on 27 years of Fitts’ law research in HCI. International Journal of Human-Computer Studies 61, 6 (2004), 751–789. https://doi.org/10.1016/j.ijhcs.2004.09.001
- Statinfer (2018) Statinfer. 2018. Predictive modeling & machine learning. Retrieved January 14, 2022 from https://statinfer.com/204-1-11-interaction-terms/.
- Thompson et al. (2004) Shelby Thompson, Jeremy Slocum, and Michael Bohan. 2004. Gain and Angle of Approach Effects on Cursor-Positioning Time with a Mouse in Consideration of Fitts’ Law. Proceedings of the Human Factors and Ergonomics Society Annual Meeting 48, 5 (2004), 823–827. https://doi.org/10.1177/154193120404800517
- Usuba et al. (2021) Hiroki Usuba, Shota Yamanaka, and Homei Miyashita. 2021. Modeling Movement Times and Success Rates for Acquisition of One-Dimensional Targets with Uncertain Touchable Sizes. Proc. ACM Hum.-Comput. Interact. 5, ISS, Article 487 (nov 2021), 15 pages. https://doi.org/10.1145/3486953
- Wang and Ren (2009) Feng Wang and Xiangshi Ren. 2009. Empirical Evaluation for Finger Input Properties in Multi-touch Interaction. In Proceedings of the SIGCHI Conference on Human Factors in Computing Systems (Boston, MA, USA) (CHI ’09). ACM, New York, NY, USA, 1063–1072. https://doi.org/10.1145/1518701.1518864
- Welford et al. (1969) A.T. Welford, A.H. Norris, and N.W. Shock. 1969. Speed and accuracy of movement and their changes with age. Acta Psychologica 30 (1969), 3–15. https://doi.org/10.1016/0001-6918(69)90034-1
- Whisenand and Emurian (1995) Thomas G. Whisenand and Henry H. Emurian. 1995. Some Effects of Angle of Approach on Icon Selection. In Conference Companion on Human Factors in Computing Systems (Denver, Colorado, USA) (CHI ’95). Association for Computing Machinery, New York, NY, USA, 298–299. https://doi.org/10.1145/223355.223683
- Witz (1990) Klaus Witz. 1990. Applied Statistics for the Behavioral Sciences. Journal of Educational Statistics 15, 1 (1990), 84–87. http://www.jstor.org/stable/1164825
- Wobbrock et al. (2008) Jacob O. Wobbrock, Edward Cutrell, Susumu Harada, and I. Scott MacKenzie. 2008. An Error Model for Pointing Based on Fitts’ Law. In Proceedings of the SIGCHI Conference on Human Factors in Computing Systems (Florence, Italy) (CHI ’08). ACM, New York, NY, USA, 1613–1622. https://doi.org/10.1145/1357054.1357306
- Wobbrock et al. (2011) Jacob O. Wobbrock, Leah Findlater, Darren Gergle, and James J. Higgins. 2011. The Aligned Rank Transform for Nonparametric Factorial Analyses Using Only Anova Procedures. In Proceedings of the SIGCHI Conference on Human Factors in Computing Systems (Vancouver, BC, Canada) (CHI ’11). ACM, New York, NY, USA, 143–146. https://doi.org/10.1145/1978942.1978963
- Yamanaka (2021a) Shota Yamanaka. 2021a. Comparing Performance Models for Bivariate Pointing through a Crowdsourced Experiment. In Human-Computer Interaction – INTERACT 2021. Springer International Publishing, Gewerbestr, Switzerland, 76–92. https://doi.org/10.1007/978-3-030-85616-8_6 The error-rate dataset was obtained via personal communication.
- Yamanaka (2021b) Shota Yamanaka. 2021b. Utility of Crowdsourced User Experiments for Measuring the Central Tendency of User Performance to Evaluate Error-Rate Models on GUIs. Proceedings of the AAAI Conference on Human Computation and Crowdsourcing 9, 1 (Oct. 2021), 155–165.
- Yamanaka and Usuba (2020) Shota Yamanaka and Hiroki Usuba. 2020. Rethinking the Dual Gaussian Distribution Model for Predicting Touch Accuracy in On-Screen-Start Pointing Tasks. Proc. ACM Hum.-Comput. Interact. 4, ISS, Article 205 (Nov. 2020), 20 pages. https://doi.org/10.1145/3427333
- Yamanaka et al. (2021) Shota Yamanaka, Keisuke Yokota, and Takanori Komatsu. 2021. Time-Penalty Impact on Effective Index of Difficulty and Throughputs in Pointing Tasks. In Human-Computer Interaction – INTERACT 2021, Carmelo Ardito, Rosa Lanzilotti, Alessio Malizia, Helen Petrie, Antonio Piccinno, Giuseppe Desolda, and Kori Inkpen (Eds.). Springer International Publishing, Cham, 100–121.
- Yang and Xu (2010) Huahai Yang and Xianggang Xu. 2010. Bias Towards Regular Configuration in 2D Pointing. In Proceedings of the SIGCHI Conference on Human Factors in Computing Systems (Atlanta, Georgia, USA) (CHI ’10). ACM, New York, NY, USA, 1391–1400. https://doi.org/10.1145/1753326.1753536
- Yu et al. (2019) Difeng Yu, Hai-Ning Liang, Xueshi Lu, Kaixuan Fan, and Barrett Ens. 2019. Modeling Endpoint Distribution of Pointing Selection Tasks in Virtual Reality Environments. ACM Trans. Graph. 38, 6, Article 218 (nov 2019), 13 pages. https://doi.org/10.1145/3355089.3356544
- Zhang et al. (2012) Xinyong Zhang, Hongbin Zha, and Wenxin Feng. 2012. Extending Fitts’ Law to Account for the Effects of Movement Direction on 2D Pointing. In Proceedings of the SIGCHI Conference on Human Factors in Computing Systems (Austin, Texas, USA) (CHI ’12). ACM, New York, NY, USA, 3185–3194. https://doi.org/10.1145/2207676.2208737
- Zhou et al. (2009) Xiaolei Zhou, Xiang Cao, and Xiangshi Ren. 2009. Speed-Accuracy Tradeoff in Trajectory-Based Tasks with Temporal Constraint. In Proceedings of the 12th IFIP TC 13 International Conference on Human-Computer Interaction: Part I (Uppsala, Sweden) (INTERACT ’09). Springer-Verlag, Berlin, Heidelberg, 906–919. https://doi.org/10.1007/978-3-642-03655-2_99