75282
A search for mid-IR bands of amino acids in the Perseus Molecular Cloud
Abstract
Amino acids are building-blocks of proteins, basic constituents of all organisms and essential to life on Earth. They are present in carbonaceous chondrite meteorites and comets, but their origin is still unknown. We present Spitzer spectroscopic observations in the star-forming region IC 348 of the Perseus Molecular Cloud showing the possible detections of mid-IR emission lines consistent with the most intense laboratory bands of the three aromatic amino acids, tyrosine, phenylalanine and tryptophan and the aliphatic amino acids isoleucine and glycine. Based on these tentative identifications, preliminary estimates of column densities give values 10-100 times higher for isoleucine and glycine than for the aromatic amino acids as in some meteorites. Potential counterparts of the strongest laboratory bands of each amino acid are also found in the combined spectrum of 32 interstellar locations obtained in diverse unrelated star-forming regions.
1 Introduction
Proteinogenic and non-proteinogenic amino acids have long been known to be present in meteorites, especially carbonaceous chondrites and their abundances have been compiled in numerous studies (Pizzarello & Shock, 2017), (Koga & Naraoka, 2017). The presence of amino acids in meteorites and comets (Elsila et al., 2009) suggests that the young planet Earth was enriched with these molecules, basic constituents of proteins, essential for the emergence of life and the development of living organisms (Botta & Bada, 2002).
A few dozen molecules have been detected in the interstellar medium of star-forming regions (Favre et al., 2018) and in protoplanetary disks. These detections include aldehydes, acids, ketones, and sugars. The simplest organic acid, formic acid (HCOOH), which contains the carboxyl group, one of the main functional groups of amino acids, has been detected in low-mass star-forming regions (Lefloch et al., 2017) and in a protoplanetary disk (Favre et al., 2018). The reaction of protonated alcohols and HCOOH could lead to the production of glycine (and other amino acids) in the hot nuclei of molecular clouds and formation of amino acids also seems possible via specific gas-phase reactions in dark clouds (Ehrenfreund & Charnley, 2000; Elsila et al., 2007; Redondo et al., 2017). Very sensitive searches of amino acid bands conducted at millimeter wavelengths have focused on glycine, the most simple amino acid, and obtained upper limits to the column density (e.g. Ceccarelli et al. 2000) or tentative assignments of ro-vibrational bands (Kuan et al., 2003) which have not been fully confirmed (Cunningham et al., 2007). The young stellar cluster IC 348 (age 2 Myr), located at the eastern end of the well known Perseus Molecular Cloud complex, at a distance of 321 10 pc, is one of the nearest star-forming regions well suited to explore the presence of complex carbon-based molecules (Luhman et al., 2016; Iglesias-Groth, 2019). Organic molecules appear to be widely distributed in this nearby molecular cloud complex which prompted us to carry out an extensive search for amino acids.
Systematic laboratory work (Matei et al., 2005; Iglesias-Groth & Cataldo, 2018) has led to the identification of a large number of relatively intense amino acid bands in the mid-IR. Between 15 and 20.8 m these bands are mostly due to the carboxylate group COO- rocking, bending and wagging modes; in the range 20.8 to 26.3 m are mainly associated to the protonated amino group and, at longer wavelengths, between 26.3 and 37.0 m the bands are mainly related to the C-C -N deformation modes (Iglesias-Groth & Cataldo, 2018). The Spitzer Space Telescope has obtained a large, very valuable number of moderately high resolution spectra of star-forming regions in the spectral range 10-35 m. This spectral range appears particularly interesting for a potential identification of individual amino acid species (Iglesias-Groth & Cataldo, 2018). Among all the 20 proteinogenic amino acids, precise laboratory measurements of wavelengths, molar extinction coefficients and integrated molar absorptivities of mid-IR bands are available for the aromatic amino acids tryptophan, tyrosine and phenylalanine and for the aliphatic isoleucine and glycine (Iglesias-Groth & Cataldo, 2022). In this work, we present results on the search in the Perseus Molecular Complex for mid-IR bands (10-35 m range) of these five amino acids.
2 Observations
It was used Spitzer Space Telescope moderately high spectral resolution (R 600) archive spectra obtained at various interstellar locations in the central region of IC 348 in the Perseus Molecular Cloud. All selected slits were within 10 arcmin of the most luminous star of the IC 348 cluster: HD 281159. Fully reduced spectra acquired with the Short-High (S-H, 9.8-19.5 m ) and Long-High (L-H, 19.5-36 m) modules were taken from the Combined Atlas of Spitzer/IRS Sources, (CASSIS; http:// cassis.sirtf.com, (Lebouteiller et al., 2015): provides reduced and flux calibrated data.) The individual CASSIS full-aperture extraction of the S-H and L-H spectra were subsequently averaged to produce a high signal to noise spectrum designated hereafter as combined IC 348 ISM. Similarly, we produced a star-forming region ISM “reference” spectrum by averaging 32 spectra selected from ISM observations of diverse star-forming regions unrelated to Perseus. Many weak spectral features are found in common which supports they are reliable detections. The minimum flux level for a 3 detection of a line in the combined IC 348 ISM spectrum is 0.5 x 10¹⁸ Wm-2.
3 Searching for known molecules
At mid-IR wavelengths there are fundamental vibrational transitions of many relevant molecules which could limit the detectability of amino acid bands. The HITRAN molecular spectroscopic database was used to explore the presence of these molecular bands in the observed spectrum. The HITRAN Application Programming Interface (HAPI) was used for downloading and selecting spectroscopic transitions for each molecular specie in the HITRAN online web server and for calculating the corresponding absorption coefficients and absorption spectra in the spectral range of interest (10-34 m). The computed spectra, as well as molecular mid-IR bands reported in the literature served as a reference for their identification in the spectrum of the interstellar gas in IC 348. In addition, mid-IR transitions of atomic species commonly detected in interstellar environments were considered in this search.
4 Results
Both, the IC 348 and the reference ISM spectra show a very large number of emission lines in common. The strongest and broader feature in the Perseus spectrum is the 11.2 m PAH band. Other strong lines which we can see in the panels of Figures 1-2 are associated to transitions of molecular hydrogen at 12.28 and 17.04 m, and atomic hydrogen at 12.37 and 19.06 m. Weaker lines of water, fullerene species and other organic molecules are also seen in the spectra. From the excitation diagram of the rotational transition lines S(0), S(1) and S(2) of molecular hydrogen, we obtain: Tex 270 10 K and column density N 2.3 x 1021 cm -2. It is also found a low abundance of water N 2.7 x 1015 cm-2, N(H2O/H(Htot) 3 x 10⁻⁷.
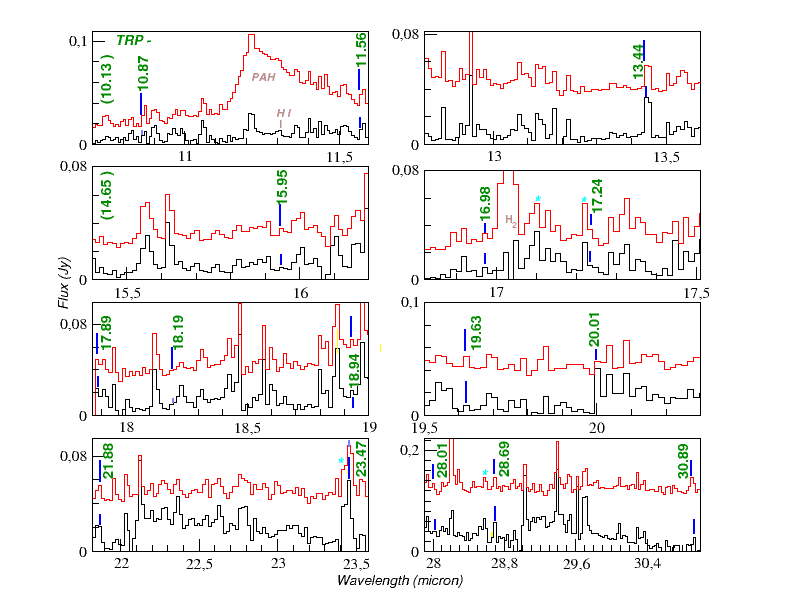
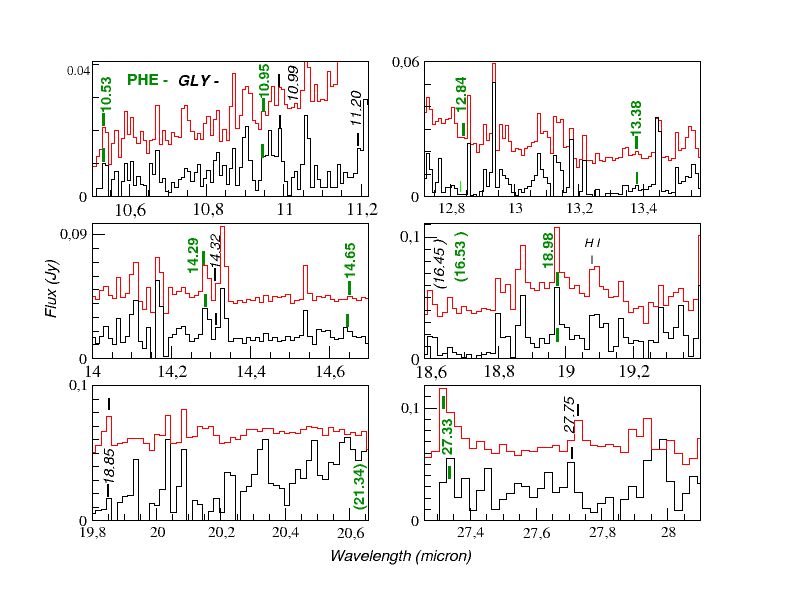
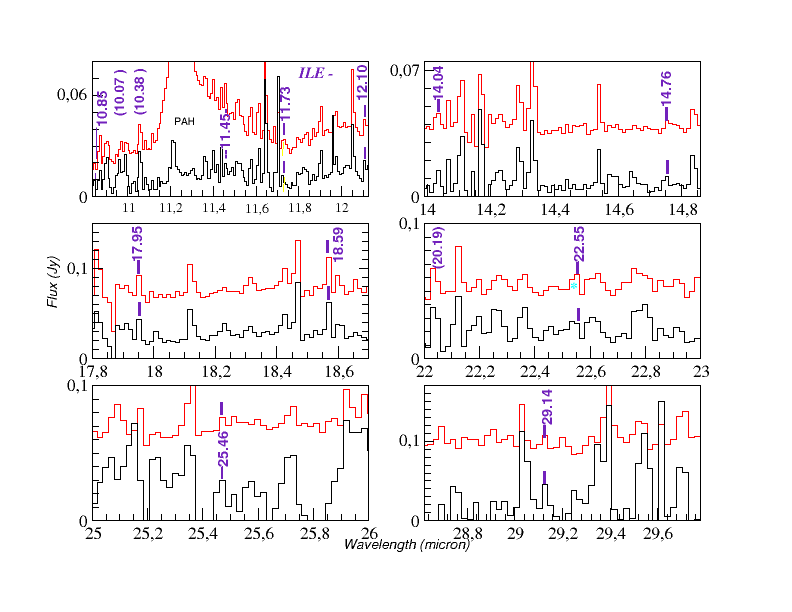
Laboratory wavenumbers, wavelengths (laboratory and observations) and integrated molar absorptivity () for the strongest mid-IR transitions of the amino acids under study are listed in Table 1. Laboratory wavenumbers are precise at the level of 1 cm -1 and the integrated molar absorptivity adopted from Iglesias-Groth & Cataldo (2022)) has uncertainties of order 20. In the Figures the positions of the strongest laboratory bands of each of the five amino acids under study and the emission features we tentatively assign to them are marked on the combined IC 348 ISM spectrum (red-line). Band assignments are less reliable at longer wavelengths due to increased uncertainties in laboratory wavelengths. For comparison, in each figure it is also plotted the star-forming region ISM “reference” spectrum (black line). For all the strongest mid-IR bands of amino acids we have identified emission features with wavelengths consistent within errors with those measured at laboratory.
Fluxes for the assigned bands were measured only in the IC 348 ISM spectrum by integrating the continuum subtracted spectrum. In Table 1 we list, for each of the five amino acids, measured fluxes and wavelengths for the tentative assignments to all the laboratory bands with integrated molar absorptivity 0.6 km mol -1. Errors in the band fluxes were estimated by propagating pixel error through the band integrals and are typically of order 20.
TRYPTOPHAN: In Table 1 there are listed bands with reported integrated molar absorptivity 2 km mol -1, we identify in Fig. 1 emission features which could be associated to each of these laboratory bands and provide fluxes for each of them. The two bands with larger integrated molar absorptivity have clear counterparts at 13.44 and 19.63 m. The next at 11.56 and 23.47 m are also clearly detected. For any reported laboratory band with a measured absorptivity we find a counterpart emission feature in the observed spectrum as marked in the figure. However, the weaker bands in the laboratory are not reliably detected in the observed spectrum. TYROSINE: The strongest absorptivity bands have counterparts at 11.88, 12.59, 15.39, 17.35 and 18.89 m but the only non-blended ones are at 11.88 and 15.39 m. This is considered a tentative detection. PHENYLALANINE: The three stronger laboratory bands have counterparts in the spectrum, other weaker lab. bands have assignments but are less reliable identifications. Overall this may be considered a weak detection. ISOLEUCINE: The highest = 13 km mol -1, corresponds to the 18.58 m band which shows the highest observed flux in the proposed counterpart emission features. The next bands at 14.05, 22.56, 25.42 and 29.13 m have also detected counterparts. In some cases, they appear blended, thus it should be considered a tentative or marginal detection. GLYCINE: There are only six known bands in the spectral range under consideration, out of which five have integrated molar absorptivity reported. The two bands with higher values at 19.85 and 27.75 m and the 14.32 m band can be assigned to rather isolated emission lines in the IC 348 spectrum. The band at 10.2 m is blended with the strong PAH band and its presence (and flux) is difficult to ascertain. The remaining band at 16.45 m could be associated with an emission line which is however superimposed on a weak broader spectral feature and the measured flux is rather uncertain. The evidence for the presence of glycine shall be taken with caution.
| Am.Ac | Lab O | LabI-C | LabI-C | Obs | Flux | |
|---|---|---|---|---|---|---|
| (cm -1) | (cm -1) | (m) | (m) | (km mol -1) | (10-18 W m-2) | |
| TRP | - | 987 | 10.13 | 10.14 | 2.3 | 1.4 |
| - | 920 | 10.87 | 10.87 | 4.4 | 2.2 | |
| - | 865 | 11.56 | 11.57 | 10.8 | 4.5 | |
| - | 744 | 13.44 | 14.44 | 30.6 | 6.4 | |
| - | 683 | 14.64 | 14.66 | 2.3 | 1.4 | |
| 627m | 627 | 15.94 | 15.95 | 2.7 | 1.4 | |
| 581m | 588 | 17.01 | 16.98 | - | 1.0 | |
| 581m | 580 | 17.24 | 17.24 | 5.6 | 4.5 | |
| 559m | 559 | 17.89 | 17.89 | 9.8 | 2.8 | |
| 549m | 550 | 18.18 | 18.19 | 2.8 | 2.6 | |
| 530m | 528 | 18.94 | 18.93 | 4.0 | 1.5 | |
| 509m | 509 | 19.64 | 19.63 | 31.7 | 3.0 | |
| 499m | 499 | 20.04 | 20.01 | 4.0 | 1.5 | |
| 456m | 457 | 21.88 | 21.87 | 1.9 | 2.0 | |
| 426m | 426 | 23.47 | 23.47 | 10.0 | 4.8 | |
| - | 397 | 25.19 | 25.19 | 0.6 | 1.0 | |
| - | 357 | 28.01 | 28.01 | 1.9 | 2.0 | |
| 347m | 349 | 28.65 | 28.69 | 9.6 | 3.0 | |
| 325m | 324 | 30.86 | 30.89 | 3.2 | 3.0 | |
| TYR | - | 985 | 10.15 | 10.14 | 2.8 | 1.0 |
| - | 897 | 11.15 | 11.15 | 2.3 | 1.2 | |
| - | 877 | 11.40 | 11.40 | 4.6 | 5.0 | |
| - | 841 | 11.89 | 11.89 | 14.5 | 3.7 | |
| - | 794 | 12.59 | 12.59 | 12.7 | 2.2 | |
| - | 740 | 13.51 | 13.51 | 4.9 | 1.7 | |
| - | 713 | 14.03 | 14.02 | 1.2 | 1.0 | |
| 650m | 650 | 15.38 | 15.39 | 12.7 | 2.2 | |
| 575m | 576 | 17.36 | 17.37 | 12.7 | 2.3 | |
| 529m | 530 | 18.87 | 18.87 | 16.0 | 12.0 | |
| 493m | 494 | 20.24 | 20.24 | 2.7 | 1.5 | |
| 433m | 434 | 23.04 | 23.06 | 5.5 | 3.0 | |
| 377m | 380 | 26.32 | 26.33 | 15.6 | 3.4 | |
| 335m | 335 | 29.85 | 29.72 | 1.3 | 2.2 | |
| PHE | - | 950 | 10.53 | 10.53 | 7.2 | 5.7 |
| - | 914 | 10.94 | 10.95 | 1.7 | 2.0 | |
| - | 779 | 12.84 | 12.84 | 3.6 | 3.0 | |
| - | 746 | 13.40 | 13.38 | 9.2 | 1.8 | |
| - | 700 | 14.29 | 14.29 | 19.8 | 6.9 | |
| - | 683 | 14.64 | 14.65 | 2.3 | 3.0 | |
| 605m | 605 | 16.53 | 16.53 | 2.1 | ||
| 525m | 526 | 19.01 | 18.98 | 15.0 | 7.2 | |
| 469m | 469 | 21.32 | 21.34 | 5.1 | 3.0 | |
| 365m | 366 | 27.32 | 27.33 | 54.0 | 10.0 | |
| ILE | - | 993 | 10.07 | 10.07 | 1.3 | 1.0 |
| - | 964 | 10.37 | 10.38 | 1.8 | 1.3 | |
| - | 921 | 10.86 | 10.85 | 3.0 | 2.0 | |
| - | 873 | 11.45 | 11.45 | 3.2 | 2.5 | |
| - | 852 | 11.74 | 11.73 | 0.3 | 1.0 | |
| - | 826 | 12.10 | 12.10 | 0.6 | 1.0 | |
| - | 712 | 14.04 | 14.04 | 5.4 | 2.7 | |
| - | 676 | 14.79 | 14.76 | 3.4 | 2.5 | |
| 557m | 557 | 17.95 | - | - | ||
| 538m | 538 | 18.59 | 18.59 | 12.9 | 3.5 | |
| 490m | 496 | 20.18 | 20.19 | 1.5 | 1.0 | |
| 443m | 443 | 22.55 | 22.55 | 7.0 | 3.0 | |
| 393m | 393 | 25.45 | 25.46 | 5.2 | 1.4 | |
| 343m | 343 | 29.15 | 29.14 | 4.5 | 3.4 | |
| GLY | - /911r | 910 | 10.99 | 10.99 | 10.5 | 4.0 |
| - /893r | 893 | 11.20 | 11.20 | 10.5 | 4.0 | |
| - /698r | 698 | 14.32 | 14.32 | 6.6 | 2.5 | |
| 607m/608r | 608 | 16.45 | 16.45 | 2.1 | 1.4 | |
| 504m / 504r | 504 | 19.84 | 19.85 | 15.1 | 4.5 | |
| 356m / 358r | 359 | 27.85 | 27.75 | 14.4 | 3.4 |
5 DISCUSSION
In order to produce vibrational excitation diagrams it is necessary to estimate for each amino acid transition the number of molecules in the upper vibrational state Nu. This can be obtained from the measured flux of each transition assuming optically thin emission, since the total power emitted in a band is P=N u A ul h ul /(4 D 2), where, D is the distance to IC 348, ul the frequency of the amino acid transition, and h the Planck constant. The Einstein A ul coefficients can be obtained from the laboratory integrated molar absorptivity. As molar absorptivity coefficients are sensitive to temperature and vacuum conditions, we can only expect from the available absorptivity data a very preliminary indication of the existence of thermal equilibrium.
In spite of the limited laboratory information available, vibration excitation diagrams for each amino acid were obtained using the strongest transitions for which molar absorptivity were available and fluxes measured in the “combined IC 348 ISM” spectrum. The results show good correlation coefficients in the range r=0.9-0.95 for each individual amino acid, even if for simplicity a vibrational degeneracy gu=1 was adopted for all the energy levels. The inverse of the slopes of the fits indicates equilibrium temperatures in the range 270-290 K for each amino acid. Considering that the absorbed UV energy is re-emitted mostly via the IR vibrational bands, column densities, n(AA), can be derived from the measured band fluxes in the IC 348 spectrum. We will follow procedures similar to those used to estimate abundances for other molecular species in the ISM of star-forming regions (Berné et al., 2017; Iglesias-Groth, 2019). The total IR intensity (W m-2 sr-1) emitted by the amino acid AA can be estimated as I tot= n(AA) x UV x G 0 x 1.2 x 10-7 where G 0 is the radiation field in the locations of the observations and UV is the cross section for absorption in the UV of the relevant molecular specie. Large variations exist in the far UV radiation field within the IC 348 star-forming region. Previous work on fullerene abundances using spectra obtained in very similar locations of the ISM in IC 348, adopted G 0 = 45 for the average interstellar radiation field (Iglesias-Groth, 2019). This value will be adopted here.
The total intensity, I tot, can be determined from the measured total fluxes emitted in the IR. However, we only measured fluxes for the subset of stronger lines known in the 10-30 m region. The real total IR intensity will be higher than the value inferred from our band measurements, and subsequently, the column densities too. The excitation diagram suggests that amino acids in the ISM of IC 348 are in thermal equilibrium with excitation temperatures in the range 270-290 K. We will assume such thermal equilibrium conditions to model the contribution to the total IR flux resulting from the known non-measured IR transitions (out of the range 10-30 m) for which molar absorptivity is available (Iglesias-Groth & Cataldo, 2022) and apply an upward correction to the total flux for each molecular specie. As we have used full aperture extraction spectra, band fluxes are converted into I tot dividing by the subtended area in the sky by the corresponding slit of each module of the IRS spectrograph.
The third parameter needed to infer column densities is the amino acid UV absorption cross section, UV. The aromatic amino acids contain conjugated aromatic rings and therefore are very efficient absorbing light in the UV range. UV absorption cross sections can be computed from laboratory measurements of molar absorption coefficients () using the relation ()= 1000 ()/(NA log (e)) where NA is the Avogadro number, and log (e) is the decimal logarithm of the Euler number. Given the expected stellar radiation field the most relevant wavelength range for determining effective UV absorption cross sections is from 190 to 230 nm. This is determined by the radiation emitted by the most luminous stars in IC 348. The resulting effective molar extinction coefficients, are 10850, 5640, 3530, 90 and 50 mol -1 cm -1, for tryptophan, tyrosine, phenylalanine, isoleucine and glycine, respectively. Adopting these values, we obtain for the corresponding UV absorption cross sections 4, 2, 1, 0.03 and 0.02 x 10⁻¹⁷cm 2, for tryptophan, tyrosine, phenylalanine, isoleucine and glycine, respectively. The resulting column densities for the aromatic amino acids are then: phenylalanine n(Phe)= 1 x 10 11 cm -2, tyrosine n(Tyr)= 0.8 x 1011 cm -2 , and tryptophan n(Trp)= 0.6 x 10 11 cm -2. For Isoleucine we find a much higher column density n(Ile)= 2 x 10 12 cm -2. For glycine, the column density appears to be the highest n(Gly) = 9 x 1012 cm -2.
Glycine is the most abundant amino acid in any type of carbonaceous chondrites with abundances of order 5-6 ppm in CM2 types and 200 ppm in CR2 types, the meteorites with a higher abundance of amino acids. In both types, isoleucine, phenylalanine and tyrosine are systematically detected although at lower concentrations (Cobb & Pudritz, 2014), of order 1.0, 0.8 and 0.9 ppm, respectively, for CM2 types. In CR2 types, isoleucine is more abundant with values of order 30 ppm, followed by phenylalanine 20 ppm, while tyrosine is at the level 0.7 ppm. Among the amino acids studied in this work, glycine and isoleucine are the most abundant in CR2 meteorites. They appear to be also the most abundant in the ISM of IC 348. On the other hand tryptophan, which we find to be the less abundant of the five studied amino acids in Perseus, interestingly it is undetected in meteorites. Another relevant comparison with meteorites is the fraction of gas phase of carbon locked in amino acids. The results are fC = 0.08, 0.09, 0.1, 1.8 and 2.4 x 10⁻⁶ for tryptophan, tyrosine, phenylalanine, isoleucine and glycine, respectively. Remarkably, these values for isoleucine and glycine are very close to the 3 parts per million versus carbon reported in several types of carbonaceous chondrites. The emission features assigned to amino acids in the ISM spectrum of IC 348 are also present in the combined ISM spectrum from star-forming regions which also displays similar relative intensities. This suggests that amino acids may be widely distributed across the Galaxy. Future JWST observations at much higher S/N and spectral resolution will show if this is the case.
6 CONCLUSIONS
We have conducted a search for mid-IR (10-30 m) transitions of five amino acids (tryptophan, tyrosine, phenylalanine, glycine and isoleucine,) in the Spitzer spectrum obtained averaging observations from various ISM locations in the core of the IC 348 star-forming region. Each of the strongest laboratory bands of these amino acids have a counterpart emission feature in this spectrum. While reliable detections require better signal to noise and higher resolution spectra (which can be obtained with JWST), from the tentative assignments proposed here, preliminary column densities have been obtained. Interestingly, we find the relative abundance pattern of these molecules in the ISM of IC 348 would be similar to that in meteorites, with glycine and isoleucine being much more abundant than any of the other three aromatic amino acids. If, as suggested by these preliminary findings, amino acids are present in the ISM of star-forming regions, they could also be part of the inventory of organic molecules in proto-planetary disks. Searches in protostars and pro-toplanetary disks in Perseus and other molecular cloud complexes are worthwhile as they should provide valuable insight on the delivery of complex organics by meteoritic and cometary material to planets in early stages of formation and, ultimately, on the processes relevant to the origen of life on Earth.
Acknowledgements.
We acknowledge the support of the Gobierno de Canarias (Spain) via project P/302125GOB-CAN. We are indebted to Prof. F. Cataldo for his work on characterization of amino acids and to the CASSIS team for the use of their public spectroscopic database.References
- Berné et al. (2017) Berné, O., Cox, N.L.J., Mulas, G., & Joblin, C. 2017, A&A, 605, L1
- Botta & Bada (2002) Botta, O. & Bada, J.L. 2002, SGeo, 23, 411
- Ceccarelli et al. (2000) Ceccarelli, C., Loinard, L., Castets, A., Faure, A., & Lefloch, B. 2000, A&A362, 1122
- Cobb & Pudritz (2014) Cobb, A.K., & Pudritz, R.E. 2014, ApJ, 783, 140
- Cunningham et al. (2007) Cunningham, M. R., Jones, P. A., Godfrey, P. D., Cragg, D. M., Bains, I., Burton, M. G., et al. 2007, MNRAS, 376, 1201
- Ehrenfreund & Charnley (2000) Ehrenfreud, P. & Charnley S.B. 2000, ARAA, 38, 427
- Elsila et al. (2007) Elsila, J.E., Dworkin, J.P., Bernstein, M.P., Martin, M.P., & Sandford, S.A. 2007, ApJ, 660, 911
- Elsila et al. (2009) Elsila, J.E., Glavin, D.P., & Dworkin, J.P. 2009, Meteorit Planet Sci 44, 1323.
- Favre et al. (2018) Favre, C., Fedele, D., Semenov, D., et al. 2018, ApJL, 862, L2
- Iglesias-Groth & Cataldo (2018) Iglesias-Groth, S., & Cataldo, F., 2018, MNRAS, 478, 3430
- Iglesias-Groth (2019) Iglesias-Groth, S. 2019, MNRAS, 489, 1509
- Iglesias-Groth & Cataldo (2021) Iglesias-Groth, S., & Cataldo, F. 2021, Astrobiology 21, 526
- Iglesias-Groth & Cataldo (2022) Iglesias-Groth, S., & Cataldo, F. 2022, Astrobiology 22, 462
- Koga & Naraoka (2017) Koga, T., & Naraoka, H. 2017, Sci Rep, 7, 636
- Kuan et al. (2003) Kuan, Y.-J., Charnley, S.B., Huang, H.-C., Tseng, W.-L., & Kisiel, Z. 2003, ApJ, 593, 848
- Lebouteiller et al. (2015) Lebouteiller, V., Barry, D., Goes, C., et al. 2015, Astrophys J Suppl Ser. 218, 21
- Lefloch et al. (2017) Lefloch, B., Ceccarelli, C., Codella, C., et al. 2017, MNRAS, 469, L73
- Luhman et al. (2016) Luhman, K.L., Esplin, T.L., & Loutrel, N.P. 2016, ApJ, 827, 52
- Matei et al. (2005) Matei, A.D., Drichko, N., Gompf, B., & Dressel, M. 2005, Chem. Phys. 316, 61
- Pizzarello & Shock (2017) Pizzarello, S., & Shock, E. 2017, Origins Life Evol B 47, 249
- Redondo et al. (2017) Redondo, P., Barrientos, C., & Largo, A. 2017, ApJ, 836, 240
- Rosado et al. (1998) Rosado, M., Duarte, M.L., & Rui Fausto, A. 1998, Vibrat. Spectros., 16, 35-54