Follow Us and Become Famous! Insights and Guidelines
From Instagram Engagement Mechanisms
Abstract.
With 1.3 billion users, Instagram (IG) has also become a business tool. IG influencer marketing, expected to generate $33.25 billion in 2022, encourages companies and influencers to create trending content. Various methods have been proposed for predicting a post’s popularity, i.e., how much engagement (e.g., Likes) it will generate. However, these methods are limited: first, they focus on forecasting the likes, ignoring the number of comments, which became crucial in 2021. Secondly, studies often use biased or limited data. Third, researchers focused on Deep Learning models to increase predictive performance, which are difficult to interpret. As a result, end-users can only estimate engagement after a post is created, which is inefficient and expensive. A better approach is to generate a post based on what people and IG like, e.g., by following guidelines.
In this work, we uncover part of the underlying mechanisms driving IG engagement. To achieve this goal, we rely on statistical analysis and interpretable models rather than Deep Learning (black-box) approaches. We conduct extensive experiments using a worldwide dataset of 10 million posts created by 34K global influencers in nine different categories. With our simple yet powerful algorithms, we can predict engagement up to 94% of F1-Score, making us comparable and even superior to Deep Learning-based method. Furthermore, we propose a novel unsupervised algorithm for finding highly engaging topics on IG. Thanks to our interpretable approaches, we conclude by outlining guidelines for creating successful posts.
1. Introduction
People post photos on Instagram (IG) for many purposes, e.g., to convey personal identity, connect with others, or promote worthwhile content (Ransaw, 2021). Getting approval from others is highly rewarding, to the point that engagement metrics (e.g., Likes, Comments, Views) have become addictive, especially for low self-esteem people (Martinez-Pecino and Garcia-Gavilán, 2019). Some people use IG for only a few minutes each day, but for others, e.g., the influencers, it has become a way of life. In short, influencers are people who can influence society. Due to their ability to reach people, companies have used them to market their products (Maslowska et al., 2019), so much so that influencer marketing is estimated to generate $33.25 billion in 2022 (Insiderintelligence, 2021, 2022). Whatever the reason, everyone strives to get as much engagement as possible under their posts, even at the cost of buying it (Zarei et al., 2020; Tricomi et al., 2022). For influencers, planning popular posts is a time-consuming and costly activity, that has no guarantees of success. In this regard, a tool that can predict the popularity of a post in advance would be of great interest, especially when sponsored posts are highly remunerated (e.g, Cristiano Ronaldo is paid around $1 Million for a single post (Conti et al., 2022)).
Researchers have proposed algorithms for predicting the popularity of posts, but they are far from perfect (§2.1). The first limitation is they measure engagement only in terms of likes, not incorporating stronger forms of interaction or what IG favors, i.e., the number of comments (Statusbrew, 2021). Then, the lack of a universal dataset for such predictive tasks lead to outcomes based on limited or biased data. Furthermore, these models often make use of Deep Learning (DL) models that may be difficult (or even impossible) to interpret (Rudin, 2019; Hee et al., 2022). As a result, end-users must first create the post going through an expensive and time-consuming process, and then assess posts’ popularity using such black-box models.
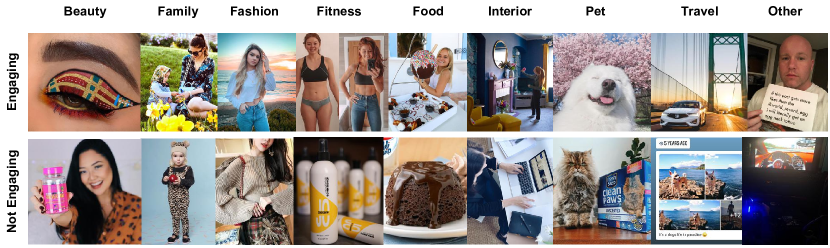
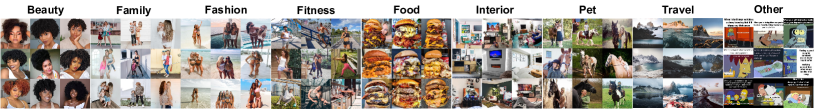
Contribution. Our goal is to understand and explain the underlying mechanisms driving IG engagement. We extract domain-relevant features leveraging the well-known capabilities of DL models, but entrust the prediction to interpretable Machine Learning (ML) algorithms (Molnar, 2020), allowing us to draw guidelines. According to IG recommendation algorithm, we consider both likes and comments as engagement metrics. We conduct extensive experiments on a recent dataset of 10M posts from 34K influencers, demonstrating through statistical analysis that influencer tiers (i.e., their audience wideness) and categories (i.e., the primary topic they cover) are crucial to predict posts’ popularity. Figure 1 shows engaging and non-engaging posts, which supports the intuition that the characteristics determining engagement differ by category.
Last, we propose a novel unsupervised approach to detect hot topics (i.e., highly engaging) for each category, which overcomes the need for domain knowledge to extract meaningful features. We summarize our contributions as follows:
-
•
We analyze the underlying mechanisms of IG engagement, in terms of likes and comments, from a dataset of 10M posts, divided into nine categories and five tiers of influencers, leveraging statistical analysis and interpretable ML algorithms;
-
•
We propose an interpretable model to predict posts’ engagement and define handy guidelines, exploiting several features extracted by State-of-the-Art (SotA) Deep Learning models;
-
•
We propose a novel unsupervised approach for spotting highly engaging topics in each tier and category, considering both visual and textual content;
-
•
We release our enriched dataset111It will be released upon publication. as a possible baseline for future works.
Organization. §2 presents related works. §3 describes the dataset and preliminary assessments, while the engagement prediction and interpretation are conducted in §4. The hot topic detection appears in §5, and the final guidelines are provided in §6. §7 concludes the paper.
Transparency. To promote transparency and reproducibility, we created a repository222It will be made public upon publication. containing exhaustive details on our study, the source code, and our dataset.
2. Related Works
The popularity of IG posts has been mainly assessed by predicting the number of likes they received, usually divided by the number of followers of the posting user, or after a log-scaled transformation. Mazloom et al. (Mazloom et al., 2016) predicted the popularity of brand-related posts by defining engagement parameters important in marketing and using a Support Vector Regression. The authors extended further their work (Mazloom et al., 2018) for different categories such as activities, landscapes, people, and animals. De et al. (De et al., 2017) trained a Deep Neural Network (DNN) on posts’ metadata (e.g., creation date, users tagged, hashtags) to predict the popularity of future posts of an Indian lifestyle magazine. Similarly, Zhourian et al. (Zohourian et al., 2018) approached popularity prediction both as a regression and classification task, focusing on posts of Iranian business IG accounts. Rather than predicting popularity in general, Zhang et al. (Zhang et al., 2018a) implemented a dual-attention mechanism to perform user-specific posts’ popularity prediction. Ding et al. (Ding et al., 2019) tried to isolate the contribution of the visual content by predicting the intrinsic image popularity through a DNN. Gayberi et al. (Gayberi and Oguducu, 2019) extracted concepts and objects features using a pre-trained model on Microsoft COCO Dataset (Lin et al., 2014) and used several Machine Learning algorithms to predict the likes of a post. Riis et al. (Riis et al., 2020) extracted visual semantics such as concepts, scenes, and objects through transfer learning and tried to set an explainable baseline for population-based popularity prediction. Carta et al. (Carta et al., 2020) proposed an approach based on Gradient Boosting and feature engineering of users’ and posts’ metadata to predict popularity in classification fashion. Last, Purba et. al (Purba et al., 2021) attempted to create a global dataset of around 20K posts from 16K users, and leveraged features extracted from hashtags, image analysis, and user history, predicting the number of likes over followers using a Support Vector Regression (SVR).
2.1. Limitations of Existing Literature
In this section, we briefly describe why the past literature in the area is incomplete, and how our work closes such gaps.
Incomplete Popularity Metric. Prior works focused exclusively on the number of likes to measure post popularity, which is outdated and discrepant with the current IG algorithm. The IG algorithm was changed in 2021 (Statusbrew, 2021) to show users content based on their interests, not just their social graph. The shift to such recommendation media changed how posts became popular. The content must be engaged with, mainly through likes and comments, so that Instagram spreads it on many users’ feeds, and only then it can become popular. Consequently, it is crucial to consider the number of comments as an indicator of engagement, given they provide a higher users’ expression than likes (Aldous et al., 2019), and thus are more relevant for the IG recommendation algorithm (Statusbrew, 2021). As far as we know, we are the first to include comments in our engagement metrics.
Limited or Biased Dataset. Since Meta’s APIs333https://developers.facebook.com/docs/instagram-api/ are limited, there are no public datasets to use as baselines. Most prior works collected their datasets, focusing on limited portions of the population (De et al., 2017; Zohourian et al., 2018). Moreover, except for Mazloom et al. (Mazloom et al., 2018), they do not consider the different categories and tiers of the creators, although, for example, a pictures of a dog and a top model would become popular for different reasons. The influencer tier, instead, was not previously considered. However, the engagement rate of influencers with millions rather than a few thousand followers reaches different levels (Geyser, 2021), and normalizing the metrics is not sufficient. In §3.3, we demonstrate that influencer categories and tiers strongly influence engagement metrics (-value¡0.001), and thus need to be treated separately to yield accurate predictions.
Poor Results Explanation. As deep learning algorithms and ensemble machine learning algorithms have improved performance, recent works have largely relied on end-to-end black-box models (Zhang et al., 2018a; Ding et al., 2019; Riis et al., 2020) rather than extracting specific features to train simple regressors or classifiers (Mazloom et al., 2016; Zohourian et al., 2018). While the model is more accurate, it is difficult (or impossible) to understand what has been learned (Rudin, 2019; Hee et al., 2022; Sharma et al., 2022). As extensively demonstrated in the landmark Nature paper by Rudin (Rudin, 2019), interpretable models must be preferred to (complicated) black-box models when explainability is critical. Often, if the problem has structured data and meaningful features, there is no significant difference in performance between more complex classifiers (i.e., DNNs, ensemble methods) and simpler ones. Furthermore, in our scenario, using a black-box model for post popularity means that the user must create the post first, which can be extremely costly (Conti et al., 2022). Thus, we use an interpretable model (i.e., a Decision Tree) to provide guidelines that can be followed before generating a post that wishes to gain popularity.
3. Dataset & Preliminary Assessments
In the following section we will describe the dataset (§3.1), the engagement metrics (§3.2), the importance of dissecting the data in categories and inner tiers (§3.3), and the features we considered and extracted for the study (§3.4).
3.1. Dataset Description
In our work, we utilize the dataset proposed by Kim et al. (Kim et al., 2020) that contains 10,180,500 posts from 33,935 influencers collected in 92 days in total. The influencers are divided into nine categories, namely Beauty, Family, Fashion, Fitness, Food, Interior, Pet, Travel, and Other, depending on their content type. Furthermore, we categorize each influencer in the five well-known tiers based on their number of followers (Tricomi et al., 2022): Nano [1K, 10K), Micro [10K, 50K), Mid [50K, 500K), Macro [500K,1M), Mega [1M, ].
Each post is composed of the image, caption, metadata (e.g., publish time, location), and engagement metrics (i.e., the number of likes and comments)444We did not further process these metrics, e.g., by removing spam comments, since IG algorithm accounts for quantity, and not quality (Statusbrew, 2021).. Similar to previous works (Zohourian et al., 2018; Riis et al., 2020; Purba et al., 2021), we normalize our target features (likes and comments) dividing them by the number of followers of the post’s creator, allowing a fair comparison between posts of different users555As a convenience, we refer to the normalized numbers simply as likes and comments.. Given that creators’ followers were taken only at the end of the collection, we remove posts older than thirty days, a period within the followers’ growth remains mostly stable (Newberry, 2022). Moreover, since an IG post engagement growth usually last one to three days (Geyser, 2021), we exclude posts younger than five days. In the end, our dataset counts 650,118 posts created by 33,935 influencers. Table 1 shows the number of posts (and influencers) per tier and category. The small presence of some categories (e.g., food, interior, pet) for very popular influencers is aligned with the actual IG categories distribution (HypeAuditor, 2022).
| Nano | Micro | Mid | Macro | Mega | |
|---|---|---|---|---|---|
| Beauty | 8449 (546) | 7879 (537) | 6998 (387) | 745 (35) | 835 (37) |
| Family | 29744 (1887) | 23432 (1330) | 12740 (674) | 1267 (77) | 2145 (102) |
| Fashion | 49622 (3154) | 82895 (4841) | 68737 (3238) | 8833 (325) | 8987 (355) |
| Fitness | 5060 (301) | 6194 (424) | 6256 (342) | 352 (27) | 748 (39) |
| Food | 27697 (1511) | 28191 (1440) | 14805 (583) | 936 (25) | 305 (6) |
| Interior | 6461 (373) | 9606 (541) | 5525 (261) | 413 (13) | 404 (7) |
| Pet | 3416 (164) | 4073 (260) | 2929 (153) | 87 (6) | 115 (4) |
| Travel | 24445 (1774) | 19630 (1522) | 13098 (838) | 816 (49) | 540 (27) |
| Other | 73213 (2976) | 38967 (1454) | 31874 (1004) | 4255 (120) | 6399 (166) |
3.2. Engagement Metrics: Likes & Comments
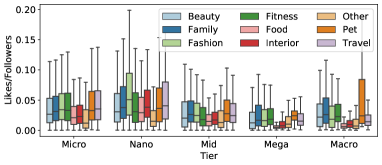
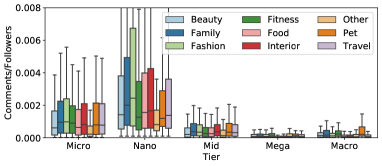
Prior works (§2) focused exclusively on the number of likes as a popularity metrics. Nonetheless, since 2021, comments have become a crucial engagement metric to make a post popular (Statusbrew, 2021). Figure 2 shows the box plots of the likes and comments for every category and tier. There are some common trends, but commenting is less frequent than liking. Such discrepancy is justified by the two different levels of public expression they carry (Aldous et al., 2019). Comments are costly and expose users’ opinions more, while likes are almost immediate and instinctive. Hence, a highly-liked post may not receive many comments. Further demonstrating the independence of the two metrics, we calculated Spearman correlation coefficients () between the distributions of likes and comments. The result (, -value ¡ 0.001) shows a moderate correlation between likes and comments, demonstrating that they need to be analyzed separately as two not-so-dependent phenomena. Thus, we consider as engagement metrics and .
3.3. The Importance of Tiers and Categories
Do the Northern Lights create more engagement than a cute puppy? How about a pineapple pizza in Naples? As these concepts are incomparable, answering these questions a priori is difficult. Similarly, would people react the same way if a celebrity and a normal person divorced? Most likely not. Those are just a few examples behind our hypothesis: influencers’ tiers and categories have a significant effect on the engagement metrics. To demonstrate this hypothesis, we conduct a Multivariate ANOVA (MANOVA) (Maposa et al., 2010), with category and tier as independent variables, and the likes and comments as dependent ones. By such statistical test, we can determine whether the mean scores of engagements differ between our nine categories and five tiers. Before conducting MANOVA, we normalize the likes and comment distributions as explained in §3.2. Among the MANOVA results, we adopted Pillai’s trace test, which is robust when MANOVA assumptions are violated (Tabachnick et al., 2007). Pillai’s trace test returned 0.0942 and 0.2646 for category and tier respectively, both with -value ¡ 0.0001. Since the -value is less than the significance level , we reject the null hypothesis of the MANOVA and conclude that the explanatory variables (tier and category) have a significant effect on the values of the response variables (likes and comments). In particular, the tier resulted contributing more than the category.
3.4. Features Extraction
Starting from the filtered posts of §3.1, we augmented our dataset with features from each kind of data sources, such as metadata, images, and text, which we now briefly describe.666The complete list of features is available in our repository. In the process, we also employed nine SotA DL algorithms.
3.4.1. Metadata Features
The posts’ metadata provides information on their “discoverability”. This term refers to features that increase post visibility, like hashtags and mentions. Hashtags are used to label the post’s content, while mentions allow tagging someone in a post, so their followers can reach the source profile. Therefore, we created two counters to keep track of the number of hashtags and tagged users. In addition, we specify whether the post is a video, sponsored, has a location, and time-related information, for a total of 10 features.
3.4.2. Images Features
We extract features from images on multiple levels to fully describe the image content, including the scene features, people features, and aesthetic features.
Scene features. To describe the environment where the picture is set we leverage the Places365 DL model (Zhou et al., 2017). The model can identify up to 365 different places mapped to 3 macro categories (indoor, outdoor natural, outdoor man-made) and 16 micro categories (e.g., shopping/dining, transportation). Moreover, we perform object detection of 80 different classes mapped in 12 categories using Faster R-CNN MobileNetV3 (Paszke et al., 2019)) trained on MS COCO dataset (Lin et al., 2014), counting the objects belonging to each category.
People Features. Using RetinaFace (Deng et al., 2020) we perform faces boundaries detection and then estimate the age and gender (mowshon, 2022) of the detected people. For each post, we save the number of females and males, and min, max, mean and standard deviation of people’s age. Furthermore, guided by the well-known impact of nudity in advertising (Sherman and Quester, 2006), we perform nudity detection using NudeNet (notAI.tech, 2022) for Beauty and Fashion categories, in which the main subject is the human body. The model determines whether 16 parts of the body (e.g., breast, belly, feet, buttocks) are exposed.
Aesthetic features. Taking inspiration from Guntuku et al. (Chandra Guntuku et al., 2019), we derive aesthetic features of the image. In particular, we first extract the percentage of red, green, and blue channels. Then, from the HSV (Hue, Saturation, Value) representation, we obtain the percentage of luminance, warm and cold colors, pleasure, arousal, and dominance scores (Mehrabian and Russell, 1974; Valdez and Mehrabian, 1994). Furthermore, we leverage Kong et al. (Kong et al., 2016) model to obtain eleven high-level aesthetic features (e.g., color harmony, motion blur, symmetry of the content). Last, we extracted the sentiment score conveyed by the image through the model proposed by Campos et al. (Campos et al., 2017).
Other features. For the Pet category, we calculated pets’ cuteness scores through a Cute Animal Detector (Kangasharju, 2022). In total, we obtained 80 visual features.
3.4.3. Text Features
From the posts’ captions we extracted features such as the caption length, the number of Emojis, and their relative sentiment (Kralj Novak et al., 2015). Moreover, we retrieve the sentiment of the whole text leveraging Google Cognitive Services (GCP) (Google, 2022), expressed as a score (, where is negative, is neutral and is positive) and magnitude (), that is representing the strength of the sentiment. We translated non-English text using GCP, and obtained five textual features in total.
4. Predict & Interpret the Engagement
Through correlation analysis, we uncover features that correlate with engagement. Then, we use interpretable models to predict engagement and develop guidelines for producing engaging content.
4.1. Correlation Analysis
To determine which features contribute the most to raising engagement, we correlate the features with our two engagement metrics (Likes and Comments). To this aim, we use Spearman’s rank correlation coefficient (Zwillinger and Kokoska, 1999). This method offers the advantages of producing feature ranks, being insensitive to outliers, and not requiring any specific normalization of the data. The Spearman’s correlation coefficient is based on Pearson’s correlation coefficient (Myers et al., 2010) and it is defined as follows. For observations, the scores , , are converted to ranks as and , and is computed as:
| (1) |
where denotes Pearson correlation coefficient but applied to the rank variables, is the covariance of the rank variables, and are the standard deviations of the rank variables. As for Pearson’s correlation coefficient, the Spearman correlation values are expressed in the range along with their that express their significance that is higher as much as the value is small.
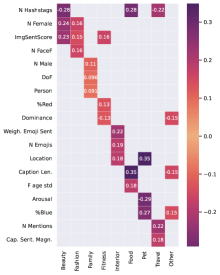
For each one of the influencers categories (i.e., beauty, fashion, etc.) and for each one of the tiers (i.e., nano, micro, etc.) we perform the correlation analysis of the features against the engagement metrics777We made all the results available in our repository.. As the first result, we notice immediately, as depicted in Figure 3, how the most relevant features in different categories are very similar when the tiers are small (e.g., Nano and Micro). In contrast, behavior becomes category-specific as tier size increases (e.g., Macro and Mega), and this behavior holds for both likes and comments. As we can see, small influencers, or users aspiring to become influencers, use similar strategies in every category. These include the use of many mentions, a long caption, and location tags.

Likes Engagement. By examining how features correlate to likes, it is possible to observe how the engagement mechanism differs for each type of influencer. Generally, we can notice that the strongest features are related to the images and their content rather than to the text (i.e., the caption), while almost the opposite occurs for the comments. The number of mentions generally has a positive impact on likes, even if their relevance decreases as tiers increase. A similar pattern can be observed in the number of hashtags having a negative effect, which tends to intensify in larger tiers. Availability of the location is very relevant up to the micro tier, after which it becomes category-specific.
Comments Engagement. Similarly to the likes engagement, we observe an overall positive correlation for the number of mentions, even though the relevance goes decreasing as the tier increases. Even in this case, the number of hashtags plays an antagonist role in comments engagement, instead the presence of the location field in a post is generally helpful. This type of engagement benefits from text-specific features such as caption length, sentiment magnitude, and Emoji usage.
Takeaway: Likes engagement differs from Comments engagement in that they are oriented toward images and captions, respectively. Additionally, low-tier influencers tend to adopt the same strategy to grow, while high-tier influencers exhibit more category-specific characteristics. \endMakeFramed
4.2. Engagement Prediction & Guidelines Methodology
| Nano | Micro | Mid | Macro | Mega | ||||||||||||||||
|---|---|---|---|---|---|---|---|---|---|---|---|---|---|---|---|---|---|---|---|---|
| Like | Comments | Like | Comments | Like | Comments | Like | Comments | Like | Comments | |||||||||||
| DT | Dum. | DT | Dum. | DT | Dum. | DT | Dum. | DT | Dum. | DT | Dum. | DT | Dum. | DT | Dum. | DT | Dum. | DT | Dum. | |
| Beauty | ||||||||||||||||||||
| Fashion | ||||||||||||||||||||
| Family | ||||||||||||||||||||
| Fitness | ||||||||||||||||||||
| Food | ||||||||||||||||||||
| Interior | ||||||||||||||||||||
| Other | ||||||||||||||||||||
| Pet | ||||||||||||||||||||
| Travel | ||||||||||||||||||||
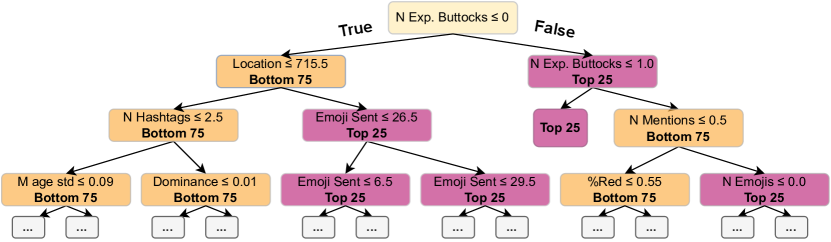
Besides explaining which characteristics of Instagram posts build engagement, we also aim to form guidelines for producing the ideal engaging post. Having such guidelines for influencers results in saving time and money consistently since the process for producing a high-engagement post is well-defined. To this aim, we leverage interpretable models, even if this could reduce the overall accuracy. Deep learning models are well known for their capability of solving complex tasks, but by definition, they work as a black box, that we cannot really explain (Rudin, 2019). For this reason, we decided to utilize Decision Trees (DT) (Quinlan, 1986). By training a DT classifier to predict low or high engagement (bottom 0.75 and top 0.25 quantile) we can explain how to produce top engagement posts simply by following the binary classification tree. The paths to reach the top 0.25 quantile leaves represents guidelines for creating high-engagement posts.
4.2.1. Implementation
Since influencers behave differently according to their category and tier, as they want to reach a different public, our analysis is performed per each category and tier. With the aim of building an accurate estimator, for each dataset, we fine-tune the Decision Tree Classifier through a Grid Search (cv=5) that is evaluating more than 20K combinations of parameter fits, so to achieve the best F1-Score (macro weighted) possible. To further reduce the bias due to the random split of the dataset, we repeated the evaluation three times on three different partitions. Each best classifier is then trained on 75% of the dataset and tested on the remaining 25%. Considering low and high engagement based on 0.75 and 0.25 quantiles implies having heavily unbalanced classes that make the learning process harder. Therefore, we also introduce as tuning parameters the use of well-known under-sampling and over-sampling techniques, i.e., SMOTE and Tomek links (Zeng et al., 2016; Lemaître et al., 2017).
4.2.2. Results
The results on the test sets are reported in Table 2. All the results surpass the dummy classifier, showing our method can effectively predict posts’ engagement. Moreover, the standard deviations are fairly low, suggesting the models are stable. In terms of Likes, predictions are generally more accurate for Macro and Mega influencers, raging around 60-80% F1-score (20-40% better than the dummy). The reason can be that these high-tier influencers tend to be more diversified as we found in the correlation analysis, making some characteristics more effective. Accordingly, our classifier exhibited difficulties in the lower tiers of Fashion, in which influencers tend to post similar content, and Other, in which the content was extremely diverse. On average, we reached the best performances for Pet, Interior, and Beauty. Regarding Comments, we find a behavior similar to Likes, except for the best performances for Fashion and Family, which appear for Nano influencers. A possible reason is that many Nano influencers might not know the best practices for creating engaging captions, which are strongly correlated to comments engagement as shown in correlation analysis. The best categories we predicted are Pet, Food, and Travel. Last, we reached the best Likes and Comments prediction score (94% and 87%, respectively) for the Pet Macro posts. An example888All the results are available in our repository. of guideline with a DT structures is depicted in Figure 4. Following the nodes conditions (i.e., post characteristics), a label will be assigned when reaching a leaf (i.e., bottom 0.75 or top 0.25 quantile). We will present more examples of guidelines in §6.
4.2.3. Baselines Comparisons
As Mazloom et al. (Mazloom et al., 2018), Gayberi and Oguducu (Gayberi and Oguducu, 2019), and other similar studies mentioned, comparison with other works in this area is not completely possible. The main reasons are the use of private algorithms and data, and how the problem is formulated. Unfortunately, IG policies999https://help.instagram.com/581066165581870, accessed: Sep 2022. never allowed automatic collection and release of common users’ posts, forcing previous works to create a new (private) dataset everytime (Mazloom et al., 2016, 2018; Zohourian et al., 2018; Gayberi and Oguducu, 2019; De et al., 2017; Carta et al., 2020; Purba et al., 2021). Moreover, given the lack of a common dataset to work on, some works focused on a regression problems (Zohourian et al., 2018; Gayberi and Oguducu, 2019; Purba et al., 2021), other on a classification problem (Zohourian et al., 2018; De et al., 2017; Carta et al., 2020), adopting different metrics, such as the log-normalized number of likes (Gayberi and Oguducu, 2019; Ding et al., 2019) or the likes divided by the number of followers (Zohourian et al., 2018; Riis et al., 2020; Purba et al., 2021). Thus, to set up baselines despite the aforementioned limitations,101010Note that some features used in previous works were not available in our dataset, limiting the comparison. we adopted four models: (i) I2PA of Ding et al. (Ding et al., 2019) (the only one publicly released); (ii) a Decision Neural Network (Dec-NN) for prior works which first extract generic visual or textual features, and then trained a non-interpretable classifier (similar to (Mazloom et al., 2018; Gayberi and Oguducu, 2019; Riis et al., 2020)); (iii) End-to-End Deep NN (EE-DNN) for prior works that relied on end-to-end black-box DL models, giving in input both posts’ images and captions simultaneously (similar to (Zhang et al., 2018a)); (iv) a stratified dummy classifier,111111https://scikit-learn.org/stable/modules/generated/sklearn.dummy.DummyClassifier.html, which predicts targets based on the training set distribution. Both Dec-NN and EE-DNN extract posts’ image and caption embeddings (through ResNet50 (He et al., 2016) and Sentence-Bert (Reimers and Gurevych, 2019)); however, EE-DNN fine-tunes them before the fusion, while Dec-NN receives their early-fusion as input. The decision is taken through three ReLU feed-forward layers (sizes = 2048+768 256 128 2). Both NN were Adam optimized and trained for 50 epochs with early stopping (patience = 5).
The results of Table 3 show that our approach outperformed the baselines for each category, except for Fashion and Other, in which we achieved comparable performance, demonstrating the superiority of our simple DT over Deep Learning models. For the categories Beauty, Fitness, Food, Interior, Pet, and Travel, our results are statistically significantly higher than the second-best model (calculated through unpaired t-test, two-tailed p-value ¡ 0.05). Particularly noteworthy is the result against I2PA and EE-DNN, which represents SotA end-to-end DL models. In particular, EE-DNN performs pretty poorly likely because fine-tuning the feature extraction modules led to overfitting. On the other hand, Dec-NN, which is more similar to our strategy, generalized better by not tuning the image and text general representations. Probably, we surpassed such baselines mainly because of the category-related features we extracted, again stressing that developing a cross-category engagement predictor could be unfeasible. Accordingly, we probably could not beat Dec-NN in the Other category because of the lack of category-related features.
Although the comparison with previous work is not completely fair for the reasons mentioned above, our results are comparable (Zhang et al., 2018a; De et al., 2017) or better (Riis et al., 2020; Carta et al., 2020; Purba et al., 2021) than the ones reported on their own data. Anyhow, we remind the reader that our goal is to explain the engagement, and not necessarily surpass the prediction of existing non-interpretable models. Last, our dataset was collected using IG APIs from business accounts and is thus shareable. We believe our dataset could serve as a baseline for future works.
[t] Category DT (Our) I2PA Dec-NN EE-DNN Dummy Beauty Fashion Family Fitness Food Interior Other Pet Travel
-
Underlined results are statistically significantly higher (two-tailed
-value ¡ 0.05) than the second-best.
4.2.4. Feature Importance
Guidelines to create engaging posts results from following the tree generated by the DT classifier. In addition, similarly to correlation analysis, the content creator can inspect the model’s feature importance to determine which features are impacting the engagement predictions. Thus, we studied the features used by the models, checking whether they match with correlation results. A representative example121212All the results are available in our repository. of this analysis is shown in Table 4, which suggests good correspondence with the factors expressed in §4.1. For example, the presence of common features in small tiers, followed by category-specific features with increasing tier size. As for the correlation analysis, the number of mentions and whether a location is set result in importance that is inversely proportional to the tier size.
| # | Feature | Imp. |
|---|---|---|
| 1 | N Mentions | 1.0 |
| 2 | Age avg | 0.80 |
| 3 | Dominance | 0.73 |
| 4 | N Exp.Buttocks | 0.46 |
| 5 | Outdoor Natural Env. | 0.19 |
| # | Feature | Imp. |
|---|---|---|
| 1 | N Exp. Buttocks | 1.0 |
| 2 | N Mentions | 0.64 |
| 3 | Caption Len. | 0.18 |
| 4 | N Emojis | 0.16 |
| 5 | Cap. Sent. Magn. | 0.13 |
Takeaway: A simple and interpretable Decision Tree can outperform Deep Learning algorithms if leveraging domain-knowledge features. Prediction results and feature importance analysis confirm the consideration drawn by feature correlation, showing how similar and dissimilar tiers and category behaves. \endMakeFramed
5. Spotting Instagram Hot Topics
Our features allow us to predict a post’s engagement with good accuracy, but there is room for improvement. In our interpretable approach, features have to be extracted a priori instead of being learned “automatically” by a deep learning model. Thus, our features are limited by our educated guesses of what could be engaging, and by the concepts obtainable through existing SotA deep learning models. For instance, if available, we would have used a love or a marriage scene detector, which are likely to produce high engagement. Although such detectors could be implemented through classical approaches (e.g., by fine-tuning an image recognition NN like ResNet (He et al., 2016)), we opted for defining an unsupervised strategy to detect general hot topics. In particular, we aim to find (if any) topics or concepts that, if present in a post, would create high engagement independently from the publisher. In this context, unsupervised means we make no assumptions on which topics are engaging (as we did to extract category-related features for §4), but rather explore users’ interests (Zarrinkalam et al., 2020).
From §4 we learned that likes and comments are mainly driven by the image and caption, respectively. Thus, in the next experiments, we focus on finding likes-related hot topics through visual features, and comments-related hot topics through textual features. We now present our methodology and findings.
5.1. Methodology
The idea behind our method is to group together semantically similar images and captions, and observe whether some of these groups reach high engagement on average.
Embeddings. To define image and text semantic similarity, we rely on the concept of embedding. An embedding is a vector representation of an object (e.g., image, text) in which objects with similar semantics have similar vector profiles (Le and Mikolov, 2014). Embeddings are usually extracted by taking the output of the penultimate layer of a deep neural network performing a classification task. In our experiments, we retrieved image embeddings using ResNet50 (He et al., 2016) pre-trained on the ImageNet dataset, and text-embeddings using Sentence-Bert (Reimers and Gurevych, 2019) (in particular, in its version all-mpnet-base-v2 (Face, 2022)). Before extracting the text embeddings, we translated non-English text leveraging Google Cloud Platform (Google, 2022), so to perform language detection and translation automatically.
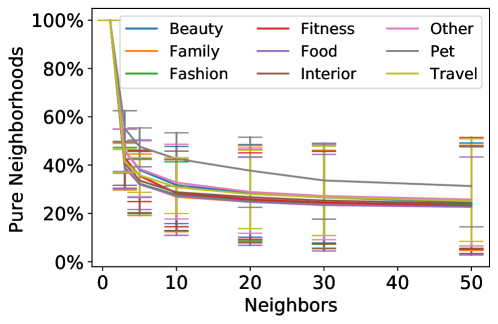
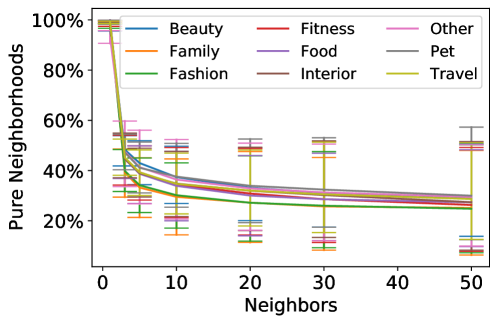
Semantically Similar Neighborhood. As a first approach, we could create clusters of similar images or captions, and see whether some clusters present higher engagement than others. However, as shown in the literature (Niu et al., 2021), current cluster algorithms suffer the decision of the number of clusters beforehand. Moreover, finding hot topics is challenging (Zhang et al., 2018b), since they could be small and lost in a big cluster. Thus, we prefer a Nearest Neighbors approach, to find neighborhoods of points with similar engagement. In particular, we first divided our posts into five engagement classes determined by the percentiles [0-20, 20-40, 40-60, 60-80, 80-100], saving the thresholds of each percentile. Then, for each point, we search its N nearest neighbors, calculate their engagement average, and see whether the average falls in the same engagement class as the point under consideration. If so, that neighborhood is considered “pure”, and new posts falling in it would likely produce that particular class of engagement. To find the nearest neighbors, we first reduced the dimensionality of the embeddings using PCA (100 components), and then applied Nearest Neighbor algorithm leveraging Scikit-Learn implementation (Pedregosa et al., 2011) using Euclidean Distance as the distance metric. Figure 5 depicts the percentage of pure neighborhoods for different N = [1, 3, 5, 10, 20, 30, 50] for the mid-tier. On average, around 20% (N=50) of the points are in a pure neighborhood, which suggests that some topics are more (or less) engaging than others. The pet category presents the highest average, probably because its topics can be the species and breed of animals (visually similar), and some could be liked more (or less) than others.
5.2. General vs User-specific Hot topics
The percentage of the pure neighborhoods found in §5.1 is comprehensive of neighborhoods made only by a single influencer, i.e., not a general hot topic. In this case, we identified what we can call a user-specific hot topic, which is very useful to understand what topic is engaging (or not) for that particular influencer. Thus, what differentiates general vs user-specific hot topics is how many influencers participate in a pure neighborhood, and with how many posts. We call this parameter User Diversity. To calculate it, we took inspiration from the Simpson’s Diversity Index (Simpson, 1949), used in ecology to quantify the biodiversity of a habitat. It takes into account the number of species present, as well as the abundance of each species. The diversity index is expressed as:
| (2) |
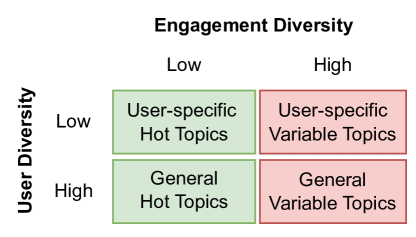
where is the total sample size, the number of species, and is the number of organisms of the specie. ranges from 0 to 1, where 0 is minimum diversity and 1 is maximum diversity. In our scenario, the species are the influencers, and the organisms the posts. Similarly, we can define an Engagement Diversity, which measures the posts’ diversity in terms of engagement. This metric is needed since we created pure neighborhoods based only the average engagement of their posts, therefore, within a pure neighborhood there can be posts belonging to different engagement classes. To recap, by measuring the Engagement and User Diversity of our pure neighborhoods, we can define topics as depicted in Figure 6. Obviously, we are more interested in the green part, since neighborhoods with high engagement diversity are less reliable. We set the threshold between low and high at 0.5.
Findings. We concentrated our research of hot topics only on the highest engagement class (i.e., posts falling in top 20% percentile), focusing on each tier and category differently. During the automatic search, we removed neighborhoods that overlapped for more than 80% of the points. We explored the resulting neighborhoods and found several hot topics, which we did not think about in the feature extraction phase, and could not be detected by SotA models, confirming the benefits of this unsupervised research. All the neighborhoods can be browsed on our repository, while in Figure 7 we reported an example for each category. For instance, we found “mother with her child” for Family, “two (or more) girls in bikini” for Fashion, or “girl/kid near/riding a horse” for Pet. For captions, we found less category-specific hot topics, and more common strategies. For instance, giveaways attracts a lot of comments, since participants usually have to comment and tag other friends. Furthermore, we found the a working strategy of asking users’ opinions on a topic, general questions, or requests for upcoming content. More general hot topics are presented in §6.
Takeaway: Instagram offers both visual and textual hot topics that are likely to generate high engagement levels. Captions tend to use similar strategies across categories despite visual hot topics being category-specific. \endMakeFramed
6. Guidelines Insights
This section provides some guidelines to get more Likes and Comments for each category, resulting from both DT engagement classifiers (§4) and hot topics detection (§5). We also provide some suggestions to make an engaging caption.
6.1. Guidelines for Likes, Comments, and Topics
Each category presents different characteristics to build engagement. We now present guidelines to get more Likes and Comments along the hot topics we found.
Beauty. Likes are mainly driven by exposed buttocks and feet, a high image pleasure, and positive emoji sentiment. Exposed buttocks also generate many comments, as well as a low age average, having the location set, and the use of many mentions. Wavy hair is much appreciated, and hot topics include couples and eye make-up with perfect eyebrows. Users usually love when the influencers receive new make-up products, recreate famous make-up (e.g., from movies), and talk about personal problems.
Family. Likes and Comments are driven by similar factors. People’s features like age and gender are predominant. The mean age of female subjects should be low, with a high standard deviation. This suggests that mothers with children are a hot topic, as detected in §5.2. Indoor or outdoor-natural environments are preferred, and location, colors, and the number of mentions are highly impacting. As hot topics, we found pregnancy, childbirth, and body changes, during which followers feel closer to the influencer.
Fashion. In terms of Likes, a higher number of mentions is suggested for small tiers, whereas colors-related features (e.g., dominance, arousal) contribute heavily to high-tier influencers. A predominant role is held by exposed buttocks, which contribute to both likes and comments. Exposed feet generate many comments, as well as outdoor pictures, short captions with many hashtags, and positive emoji sentiments. As hot topics, girls in bikinis and men with six-packs are successful. Discussing outfits for special events is highly engaging, such as traveling, going to concerts, birthdays, gallant dinners, or simply starting the week.
Fitness. Likes are driven by warm colors, and high dominance of female subjects with low age standard deviation, preferably in their workout outfit. A short caption with positive sentiment helps in receiving both likes and comments. Low arousal generates many comments, according to the body transformation hot topic. The caption should motivate people to try harder in their workouts.
Food. Males are more common and generate more likes in this category. Extreme burgers and spirits are highly appreciated, as well as perfect and very colored food compositions. Pictures in kitchens or outside restaurants help to get likes. The location is important for getting comments, as well as high arousal and a positive caption with many Emojis. The caption should include a brief description of the plate and questions about favorite food. Pizza days, chocolate, and vegan food are often in the middle of heated discussions.
Interior. To get likes, indoor environments like a living room and cold colors are preferred, as well as the presence of kids and female subjects. The location is relevant for both likes and comments, but avoid commercial buildings and food pictures. Luminous and pleasant pictures generate more comments, as well as the presence of animals. A good caption combines positive Emoji sentiment, a few hashtags, and general questions, like what to do on the weekend.
Pet. Pictures should be in an indoor or outdoor-natural environment, use warm colors, and convey a positive sentiment to get many likes. The use of the location and mentions helps a lot for comments, as well as very high or very low animal cuteness. Among the most loved animals, we found horses, exotic animals, Siamese cats, and dogs with clothes and ribbons. Many comments will arrive along with a new family member!
Travel. Likes are gained primarily by female subjects and a low number of male presence, with a generally low age standard deviation and a low minimum age. This suggests that travel pictures of young friends or groups of the same age are highly engaging. To get many comments, besides the importance of outdoor-related features, the sentiment conveyed by the text should tend to be positive. Further, hashtags and mentions are crucial, and the picture should be pleasant and arousing, with low dominance. Pictures near the sea are highly appreciated, and users’ engage more with summer and holiday posts.
Other. More likes are obtained by females in indoor places with cold colors and low dominance. Many emojis and short captions help too. Men of the same age in a single picture get many comments, using a neutral sentiment in the caption. Hot topics are many, for example, football, memes, or superheroes. The captions tend to be funny and quite short.
6.2. Guidelines for Engaging Captions
Even if each category and tier require a specific caption to build engagement, we identified some common strategies to generate highly engaging ones. From our explorations, we identified a typical pattern among most hot captions, i.e., asking questions to the audience. Such questions can be very generic (e.g., “how do you feel today?”), or topic-specific (e.g., “which outfit do you prefer?”), which helps engage the users. Moreover, creators often ask people to perform particular actions, such as tagging or sharing content with friends. This behavior, known as call to action, usually generates a lot of engagement. Last, hashtags are generally at the end of the caption, often separated by the rest of the text with one point or dash per line. This behavior forces the users to click on the “View more” button to see the whole caption, generating more engagement.
6.3. Limitations
Our guidelines are the result of analyzing the biggest IG dataset ever released, composed of around 10M posts created by 34K influencers. Nevertheless, it does not include many categories of interest (e.g., sport, cinema, music), and what people like as well as hot topics could change over time. However, we presented two methodologies (supervised §4 and unsupervised §5) that can be applied to any category (possibly enhancing the feature set) at any time, by taking a “snapshot” of IG content produced by influencers of a target category and tier. Moreover, a reader might be concerned that the IG algorithm started considering comments to recommend posts in 2021, whereas our dataset is from 2020. We remark that our paper’s aim is to explain which post’s features induce users to generate more comments (which now are a crucial factor), and not how IG is now recommending posts to users. Indeed, as for likes, the main reason users leave comments is based on the posts themselves (Aldous et al., 2019), not whether users see the posts.
7. Conclusion
In this work, we aimed to close the gap from previous works, explaining the underlying mechanisms of IG engagement and focusing on the interpretable models. In this way, it is possible to create engaging IG content by design, following predefined guidelines, saving time and money. Through a careful and all-inclusive process of feature extraction, we trained predictors that achieved up to 94% of F1-Score. In particular, our results show that likes are mainly driven by images, while comments are primarily stimulated by captions. Further, we demonstrated how influencers’ behavior becomes more category-specific as their tier increases. Last, we proposed a novel unsupervised approach for detecting and analyzing hot topics, to better understand the inner dynamics of each category.
In the future, we plan to improve the predictions through a model that integrates hot topic extraction. Furthermore, more categories should be studied, and a metric that combines likes and comments should be introduced to better understand their relationship. Regarding these metrics, they could be polished by removing fake engagement, for instance. However, as of now, we have no evidence IG algorithm is accounting for such differences. Last, geography should be taken into account to understand whether it impacts engagements mechanisms
References
- (1)
- Aldous et al. (2019) Kholoud Khalil Aldous, Jisun An, and Bernard J Jansen. 2019. View, like, comment, post: Analyzing user engagement by topic at 4 levels across 5 social media platforms for 53 news organizations. In Proceedings of the International AAAI Conference on Web and Social Media, Vol. 13. 47–57.
- Campos et al. (2017) Victor Campos, Brendan Jou, and Xavier Giro-i Nieto. 2017. From pixels to sentiment: Fine-tuning CNNs for visual sentiment prediction. Image and Vision Computing 65 (2017), 15–22.
- Carta et al. (2020) Salvatore Carta, Alessandro Sebastian Podda, Diego Reforgiato Recupero, Roberto Saia, and Giovanni Usai. 2020. Popularity prediction of instagram posts. Information 11, 9 (2020), 453.
- Chandra Guntuku et al. (2019) Sharath Chandra Guntuku, Daniel Preotiuc-Pietro, Johannes C. Eichstaedt, and Lyle H. Ungar. 2019. What Twitter Profile and Posted Images Reveal about Depression and Anxiety. Proceedings of the International AAAI Conference on Web and Social Media 13, 01 (Jul. 2019), 236–246.
- Conti et al. (2022) Mauro Conti, Jenil Gathani, and Pier Paolo Tricomi. 2022. Virtual Influencers in Online Social Media. IEEE Communications Magazine (2022).
- De et al. (2017) Shaunak De, Abhishek Maity, Vritti Goel, Sanjay Shitole, and Avik Bhattacharya. 2017. Predicting the popularity of instagram posts for a lifestyle magazine using deep learning. In 2017 2nd international conference on communication systems, computing and IT applications (CSCITA). IEEE, 174–177.
- Deng et al. (2020) Jiankang Deng, Jia Guo, Evangelos Ververas, Irene Kotsia, and Stefanos Zafeiriou. 2020. Retinaface: Single-shot multi-level face localisation in the wild. In Proceedings of the IEEE/CVF conference on computer vision and pattern recognition. 5203–5212.
- Ding et al. (2019) Keyan Ding, Kede Ma, and Shiqi Wang. 2019. Intrinsic image popularity assessment. In Proceedings of the 27th ACM International Conference on Multimedia. 1979–1987.
- Face (2022) Hugging Face. 2022. https://huggingface.co/sentence-transformers/all-mpnet-base-v2 Accessed: August 2022.
- Gayberi and Oguducu (2019) Mehmetcan Gayberi and Sule Gunduz Oguducu. 2019. Popularity prediction of posts in social networks based on user, post and image features. In Proceedings of the 11th International Conference on Management of Digital EcoSystems. 9–15.
- Geyser (2021) Werner Geyser. 2021. The State of Influencer Marketing 2021: Benchmark Report. https://influencermarketinghub.com/influencer-marketing-benchmark-report-2021/ Accessed: August 2022.
- Google (2022) Google. 2022. Google Cloud Platform. https://cloud.google.com/
- He et al. (2016) Kaiming He, Xiangyu Zhang, Shaoqing Ren, and Jian Sun. 2016. Deep residual learning for image recognition. In Proceedings of the IEEE conference on computer vision and pattern recognition. 770–778.
- Hee et al. (2022) Ming Shan Hee, Roy Ka-Wei Lee, and Wen-Haw Chong. 2022. On Explaining Multimodal Hateful Meme Detection Models. In Proceedings of the ACM Web Conference 2022. 3651–3655.
- HypeAuditor (2022) HypeAuditor. 2022. State of Influencer Marketing 2022. https://hypeauditor.com/blog/wp-content/uploads/2022/01/US-State-of-Influencer-Marketing-2022.pdf Accessed: August 2022.
- Insiderintelligence (2021) Insiderintelligence. 2021. Instagram will net more US ad revenues than core Facebook platform. https://www.insiderintelligence.com/content/instagram-will-net-more-us-ad-revenues-than-core-facebook-platform Accessed: August 2022.
- Insiderintelligence (2022) Insiderintelligence. 2022. Instagram in 2022: Global user statistics, demographics and marketing trends to know. https://www.insiderintelligence.com/insights/instagram-user-statistics-trends/ Accessed: August 2022.
- Kangasharju (2022) Jaakko Kangasharju. 2022. Cuteness Detector. https://github.com/asharov/cute-animal-detector.
- Kim et al. (2020) Seungbae Kim, Jyun-Yu Jiang, Masaki Nakada, Jinyoung Han, and Wei Wang. 2020. Multimodal Post Attentive Profiling for Influencer Marketing. In Proceedings of The Web Conference 2020. 2878–2884.
- Kong et al. (2016) Shu Kong, Xiaohui Shen, Zhe Lin, Radomir Mech, and Charless Fowlkes. 2016. Photo aesthetics ranking network with attributes and content adaptation. In European conference on computer vision. Springer, 662–679.
- Kralj Novak et al. (2015) Petra Kralj Novak, Jasmina Smailović, Borut Sluban, and Igor Mozetič. 2015. Sentiment of Emojis. PLOS ONE 10, 12 (12 2015), 1–22.
- Le and Mikolov (2014) Quoc Le and Tomas Mikolov. 2014. Distributed representations of sentences and documents. In International conference on machine learning. PMLR, 1188–1196.
- Lemaître et al. (2017) Guillaume Lemaître, Fernando Nogueira, and Christos K. Aridas. 2017. Imbalanced-learn: A Python Toolbox to Tackle the Curse of Imbalanced Datasets in Machine Learning. Journal of Machine Learning Research 18, 17 (2017), 1–5. http://jmlr.org/papers/v18/16-365.html
- Lin et al. (2014) Tsung-Yi Lin, Michael Maire, Serge J. Belongie, and Others. 2014. Microsoft COCO: Common Objects in Context. CoRR abs/1405.0312 (2014). arXiv:1405.0312
- Maposa et al. (2010) Daniel Maposa, Edinah Mudimu, and Olina Ngwenya. 2010. A multivariate analysis of variance (MANOVA) of the performance of sorghum lines in different agro-ecological regions of Zimbabwe. African Journal of Agricultural Research 5 (02 2010), 196–203.
- Martinez-Pecino and Garcia-Gavilán (2019) Roberto Martinez-Pecino and Marta Garcia-Gavilán. 2019. Likes and problematic Instagram use: the moderating role of self-esteem. Cyberpsychology, Behavior, and Social Networking 22, 6 (2019), 412–416.
- Maslowska et al. (2019) Ewa Maslowska, Su Jung Kim, Edward C Malthouse, and Vijay Viswanathan. 2019. Online reviews as customers’ dialogues with and about brands. In Handbook of research on customer engagement. Edward Elgar Publishing.
- Mazloom et al. (2018) Masoud Mazloom, Iliana Pappi, and Marcel Worring. 2018. Category specific post popularity prediction. In International Conference on Multimedia Modeling. Springer, 594–607.
- Mazloom et al. (2016) Masoud Mazloom, Robert Rietveld, Stevan Rudinac, Marcel Worring, and Willemijn Van Dolen. 2016. Multimodal popularity prediction of brand-related social media posts. In Proceedings of the 24th ACM international conference on Multimedia. 197–201.
- Mehrabian and Russell (1974) Albert Mehrabian and James A Russell. 1974. An approach to environmental psychology. the MIT Press.
- Molnar (2020) Christoph Molnar. 2020. Interpretable machine learning. Lulu. com.
- mowshon (2022) mowshon. 2022. Age and Gender. https://github.com/mowshon/age-and-gender
- Myers et al. (2010) J.L. Myers, A. Well, and R.F. Lorch. 2010. Research Design and Statistical Analysis. Routledge.
- Newberry (2022) Christina Newberry. 2022. 12 Foolproof Instagram Growth Strategies for 2022. https://blog.hootsuite.com/instagram-growth/ Accessed: August 2022.
- Niu et al. (2021) Chuang Niu, Hongming Shan, and Ge Wang. 2021. Spice: Semantic pseudo-labeling for image clustering. arXiv preprint arXiv:2103.09382 (2021).
- notAI.tech (2022) notAI.tech. 2022. NudeNet: Neural Nets for Nudity Classification, Detection and Selective Censoring. https://github.com/notAI-tech/NudeNet Accessed: August 2022.
- Paszke et al. (2019) Adam Paszke, Sam Gross, Massa, et al. 2019. PyTorch: An Imperative Style, High-Performance Deep Learning Library. In Advances in Neural Information Processing Systems 32, H. Wallach, H. Larochelle, A. Beygelzimer, F. d'Alché-Buc, E. Fox, and R. Garnett (Eds.). Curran Associates, Inc., 8024–8035.
- Pedregosa et al. (2011) F. Pedregosa, G. Varoquaux, et al. 2011. Scikit-learn: Machine Learning in Python. Journal of Machine Learning Research 12 (2011), 2825–2830.
- Purba et al. (2021) Kristo Radion Purba, David Asirvatham, and Raja Kumar Murugesan. 2021. Instagram post popularity trend analysis and prediction using hashtag, image assessment, and user history features. Int. Arab J. Inf. Technol. 18, 1 (2021), 85–94.
- Quinlan (1986) J. Ross Quinlan. 1986. Induction of decision trees. Machine learning 1, 1 (1986), 81–106.
- Ransaw (2021) Rosalyn Ransaw. 2021. The Psychology Behind Why We Share on Social Media. https://www.shutterstock.com/blog/the-psychology-behind-why-we-share-on-social-media Accessed: August 2022.
- Reimers and Gurevych (2019) Nils Reimers and Iryna Gurevych. 2019. Sentence-BERT: Sentence Embeddings using Siamese BERT-Networks. (2019), 3982–3992.
- Riis et al. (2020) Christoffer Riis, Damian Konrad Kowalczyk, and Lars Kai Hansen. 2020. On the limits to multi-modal popularity prediction on instagram–a new robust, efficient and explainable baseline. arXiv preprint arXiv:2004.12482 (2020).
- Rudin (2019) Cynthia Rudin. 2019. Stop explaining black box machine learning models for high stakes decisions and use interpretable models instead. Nature Machine Intelligence 1, 5 (2019), 206–215.
- Sharma et al. (2022) Shivam Sharma, Firoj Alam, Md Akhtar, Dimitar Dimitrov, Giovanni Da San Martino, Hamed Firooz, Alon Halevy, Fabrizio Silvestri, Preslav Nakov, Tanmoy Chakraborty, et al. 2022. Detecting and Understanding Harmful Memes: A Survey. arXiv preprint arXiv:2205.04274 (2022).
- Sherman and Quester (2006) Claire Sherman and Pascale Quester. 2006. The influence of product/nudity congruence on advertising effectiveness. Journal of Promotion Management 11, 2-3 (2006), 61–89.
- Simpson (1949) Edward H Simpson. 1949. Measurement of diversity. nature 163, 4148 (1949), 688–688.
- Statusbrew (2021) Statusbrew. 2021. Instagram Algorithm 2022: How To Conquer It. https://statusbrew.com/insights/instagram-algorithm/ Accessed: August 2022.
- Tabachnick et al. (2007) Barbara G Tabachnick, Linda S Fidell, and Jodie B Ullman. 2007. Using multivariate statistics. Vol. 5. pearson Boston, MA.
- Tricomi et al. (2022) Pier Paolo Tricomi, Sousan Tarahomi, Christian Cattai, Francesco Martini, and Mauro Conti. 2022. Are We All in a Truman Show? Spotting Instagram Crowdturfing through Self-Training. arXiv preprint arXiv:2206.12904 (2022).
- Valdez and Mehrabian (1994) Patricia Valdez and Albert Mehrabian. 1994. Effects of color on emotions. Journal of experimental psychology: General 123, 4 (1994), 394.
- Zarei et al. (2020) Koosha Zarei, Reza Farahbakhsh, and Noël Crespi. 2020. How impersonators exploit Instagram to generate fake engagement?. In ICC 2020-2020 IEEE International Conference on Communications (ICC). IEEE, 1–6.
- Zarrinkalam et al. (2020) Fattane Zarrinkalam, Stefano Faralli, Guangyuan Piao, Ebrahim Bagheri, et al. 2020. Extracting, mining and predicting users’ interests from social media. Foundations and Trends® in Information Retrieval 14, 5 (2020), 445–617.
- Zeng et al. (2016) Min Zeng, Beiji Zou, Faran Wei, Xiyao Liu, and Lei Wang. 2016. Effective prediction of three common diseases by combining SMOTE with Tomek links technique for imbalanced medical data. In 2016 IEEE International Conference of Online Analysis and Computing Science (ICOACS). IEEE, 225–228.
- Zhang et al. (2018b) Lei Zhang, Paul Jones, Kent Aaron Otis, Jonathan Gale, and Evelyn Chan. 2018b. Trending topic extraction from social media. US Patent 10,095,686.
- Zhang et al. (2018a) Zhongping Zhang, Tianlang Chen, Zheng Zhou, Jiaxin Li, and Jiebo Luo. 2018a. How to become instagram famous: Post popularity prediction with dual-attention. In 2018 IEEE international conference on big data (big data). IEEE, 2383–2392.
- Zhou et al. (2017) Bolei Zhou, Agata Lapedriza, Aditya Khosla, Aude Oliva, and Antonio Torralba. 2017. Places: A 10 million Image Database for Scene Recognition. IEEE Transactions on Pattern Analysis and Machine Intelligence (2017).
- Zohourian et al. (2018) Alireza Zohourian, Hedieh Sajedi, and Arefeh Yavary. 2018. Popularity prediction of images and videos on Instagram. In 2018 4th International Conference on Web Research (ICWR). IEEE, 111–117.
- Zwillinger and Kokoska (1999) Daniel Zwillinger and Stephen Kokoska. 1999. CRC standard probability and statistics tables and formulae. Crc Press.