On Human Visual Contrast Sensitivity and Machine Vision Robustness:
A Comparative Study
Abstract
It is well established in neuroscience that color vision plays an essential part in the human visual perception system. Meanwhile, many novel designs for computer vision inspired by human vision have achieved success in a wide range of tasks and applications. Nonetheless, how color differences affect machine vision has not been well explored. Our work tries to bridge this gap between the human color vision aspect of visual recognition and that of the machine. To achieve this, we curate two datasets: CIFAR10-F and CIFAR100-F, which are based on the foreground colors of the popular CIFAR datasets. Together with CIFAR10-B and CIFAR100-B, the existing counterpart datasets with information on the background colors of CIFAR test sets, we assign each image based on its color contrast level per its foreground and background color labels and use this as a proxy to study how color contrast affects machine vision. We call the combined datasets CIFAR-CoCo and first conduct a proof-of-concept study, showing that color difference does affect the model’s perception, thus validating the use of our datasets.
Furthermore, on a broader level, an important characteristic of human vision is its robustness against ambient changes; therefore, drawing inspirations from ophthalmology and the robustness literature, we analogize contrast sensitivity from the human visual aspect to machine vision and complement the current robustness study using corrupted images with our CIFAR-CoCo datasets.
In summary, motivated by neuroscience and equipped with the datasets we curate, we devise a new framework in two dimensions to perform extensive analyses on the effect of color contrast and corrupted images: (1) model architecture, (2) model size, to measure the perception ability of machine vision beyond total accuracy. We also explore how task complexity and data augmentation play a role in this setup. Our results call attention to new evaluation approaches for human-like machine perception.
1 Introduction
Deep learning (DL) has a history of close connections to neuroscience and cognitive science[21]. For instance, convolutional neural networks (CNN)[16, 7] have enjoyed successes in various tasks in computer vision by modeling the human visual cortex system. More recently, Transformers[24] has become a widely adopted architecture as it models human attention mechanism that allows it to contextually focus on certain information and has since extended its success beyond natural language processing to computer vision[4]. Some recent studies explore behavioral aspects of DL models for object recognition [23, 5, 10]. However, there are other human mechanisms that remain underexplored, such as color vision[20, 12], a neuroscience domain that studies how color affects human perception. Motivated by neuroscience and ophthalmology, we go beyond total accuracy as the only objective and curate datasets to first study visual recognition as a proxy task to connect the color vision aspects of human vision with those of machine vision (more details for color vision are discussed in §2), and then extend the analysis to a broader visual perception setting.
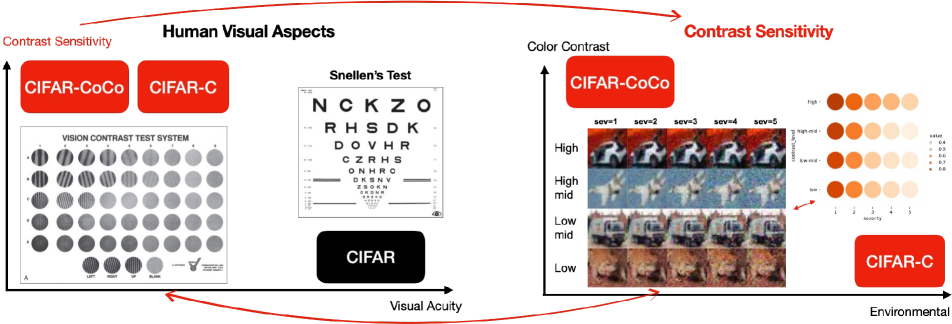
We borrow concepts of visual acuity and contrast sensitivity [19, 17] (see §2 for details) from ophthalmology to guide us in mapping human vision aspects to machine vision. We analogize raw overall performance on any benchmark as the ability on the visual acuity; and to measure the ability along contrast sensitivity we leverage color contrasts in color vision[20, 11] to make the distinctions. Hence, we manually separate CIFAR10 and CIFAR100 into eight coarse-grained groups based on the foreground color of each image; along with CIFAR-Background (CIFAR10-B & CIFAR100-B) [1] (Fig. 3), we can derive color contrast[11] for each image. Fig. 1 demonstrates how we borrow the two ophthalmologic concepts to shape our approach. In the following sections, we will call the combined datasets CIFAR-Color Contrast (CIFAR-CoCo).
We further group CIFAR-CoCo into {‘low’, ‘low-mid’, ‘high-mid’, ‘high’}, four coarse-grained subgroups based on foreground/background color pairs for higher level analyses (§3). In §4, we conduct a proof-of-principle analysis to validate our datasets by testing DL model’s performance under these contrast groups. Note that color vision and color discrimination are the same concepts, as are computer vision and machine vision, and we will use them interchangeably throughout our paper.
Moreover, for a broader analysis of visual capability[19, 17], we aim to simulate and understand the contrast sensitivity under different surroundings in our setting as human eyes are adept in changing environment[20, 12], so we leverage CIFAR-C[8], the corrupted version of CIFAR test sets. This extends the analysis in contrast sensitivity along an environmental dimension (i.e., data shifts). The main distinction between CIFAR-C and CIFAR-CoCo is: CIFAR-CoCo provides information about color contrast intrinsic to the images, and CIFAR-C adds nine-teen types of corruptions such as blurrings, noises by external image processing, so we can consider it as environment factors to contrast sensitivity. We deem CIFAR-C and CIFAR-CoCo complementary.
For comprehensive evaluations, we devise a framework to understand contrast sensitivity in machine vision: we test CIFAR-CoCo and CIFAR-C on different model sizes and architectures as prior works in robustness have shown that larger models[9] show stronger performances in robustness measures. Lastly, we explore how data augmentations (DA) affect model performances on the contrast groups, as they serve as one of the most effective approaches for out-of-distribution (OOD) performance [29, 27].
This evaluation framework could be beneficial in different ways: it helps us understand (1) which model size we demand, (2) which architecture, and (3) what type of DA we prefer to apply, under different environmental and color contrasts. Our study serves as an essential step to understanding computer vision architectures and augmentations, and facilitating efforts in benchmarking and evaluation for future studies.
To summarize, our contributions are four-fold,
-
•
Inspired by visual acuity and contrast sensitivity in human vision, we curate two datasets, CIFAR10-F and CIFAR100-F, and form CIFAR-CoCo for studying color vision in computer vision.
-
•
Along with CIFAR-C, we devise a comprehensive framework to evaluate a broader visual perception ability for computer vision.
-
•
We conduct extensive analyses in four dimensions, model size, architectural choice, task complexity, and data augmentation.
-
•
As an additional benefit, we use our findings to provide a guideline to improve future machine vision tasks under different scenarios.
2 Bridging Human Vision and Machine Vision
We, as humans, rely on stimuli from light that reflect on objects to our eyes[20, 12] to perceive objects. More importantly, our retinal cone cells respond differently to wavelength in a diverse spectrum of light[20, 12]. For instance, three different types of cone cells respond predominately to red, green, and blue. This color vision mechanism helps us discriminate objects under different luminance, contrast, environments[20, 12], etc., and is an essential part why our vision can adapt quickly[20, 12] and thus become more robust. More concretely, the opponent-process theory, a theory that different wavelengths would oppress one type of cell[20, 12], explains how psychological perception, i.e., the color contrast, would affect our way of discriminating objects[20, 12]. Such phenomena have important real-life applications, for example, a red apple would be more clearly identified when placed on a white background than on an orange background; army soldiers would wear green and brown uniforms for better camouflage in the forests.
For humans, to measure vision perceptual ability, a common routine is to perform the Snellen’s test, where people are asked to discriminate black alphabets in a white background from a certain distance (Fig. 1 left-middle). This test measures our visual acuity, or sharpness of vision, the ability to distinguish shapes and the details of objects[19, 17], and we analogize this to the test accuracy in image classification tasks. However, in modern times, ophthalmologists have discovered that a 20/20 vision does not indicate perfect vision[19, 17], and have proposed the contrast sensitivity test to measure another aspect of visual function. Contrast sensitivity test requires people to answer their judgment along two dimensions (1) the actual contrast change and (2) the number of gratings (Fig. 1 left-most), and the purpose is to investigate if people can discriminate finer and finer increments of contrast. Experts deem contrast sensitivity test a more complete assessment of vision[17]. In this work, we go beyond drawing analogies to neuroscience and ophthalmology, to test the ability of machine vision in this regard.
Onto machine vision for visual recognition: the success of convolutional neural nets (CNNs)[16, 14] has heavily relied on inductive biases such as translational invariance; and more recently, vision transformers (ViT)[4, 22] provide a new paradigm as to how we can use deep neural nets (DNNs) to learn useful image representations. However, unlike human vision, even though these models reach human-level performances on diverse tasks[26, 25], they are not always robust[6, 15], which means there are gaps to true human-level vision. Hence, instead of revolving around performances on generalization errors, which corresponds to visual acuity in the author’s analogy, we take a step back and ask: What are the aspects that we missed? Inspired by the aforementioned neuroscience and ophthalmology literature, our answer is to study contrast sensitivity for machine vision.
3 Benchmark Datasets for Color Vision
In the section, we introduce our CIFAR10-F and CIFAR100-F, datasets with eight foreground information which base on the test sets of the CIFAR datasets[14]. Together with CIFAR10-B and CIFAR100-B (Fig. 3), we can create color contrast for measuring color discrimination ability in computer vision visual recognition.
3.1 Labeling Process
-
1.
We label the color that has the most coverage of object. In Fig. 4(a), the ship is almost red everywhere so we label it as “red”.
-
2.
When two or three colors have similar coverage, we make a judgment call on the color that has more coverage. We label the example in Fig. 4(b) as “brown”.
-
3.
When multiple colors appear on the object and none is significantly larger than the rest, or when the perceived color does not belong to our categories, we put it in the “others” category (Fig. 4(c)).


3.2 Creating Color Contrast Groups
We create five color contrast groups, {‘high’, ‘high-mid’, ‘low-mid’, ‘low’, ‘others’}, using the color pairs in CIFAR-B and CIFAR-F (Fig. 2 & 3) and assign each image to a matching group. We denote the combined datasets CIFAR-CoCo. Table 1 presents the statistics for the number of color pairs in each contrast group and the number of test images in each group for CIFAR10 and CIFAR100. In the following sections, we focus on the four contrast groups from “low” to “high”, and for completeness, we still show the performance of “others” but it is not our focus. Details of the color pairs are provided in the Appendix.
| Contrast level | #pairs | #instances | |
|---|---|---|---|
| CIFAR10 | CIFAR100 | ||
| High | 7 | 2820 | 2866 |
| High-mid | 6 | 2124 | 1656 |
| Low-mid | 9 | 2615 | 3082 |
| Low | 7 | 1690 | 1498 |
| Others | 8 | 751 | 898 |
4 Proof of Concept Experiment
In this section, we conduct a proof of concept experiment to showcase CIFAR10-CoCo’s ability in testing machine vision in color contrast. We first discuss the framework we devise for studying our subject and its reasoning, and then discuss our findings.


4.1 Analysis Framework
Does architecture matter?
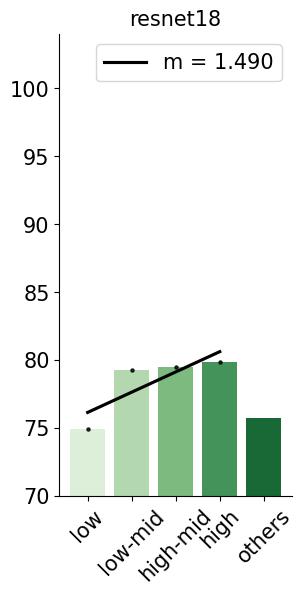
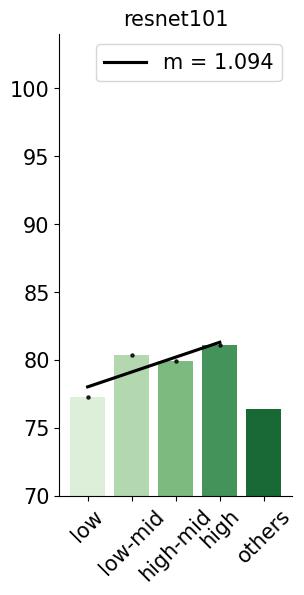
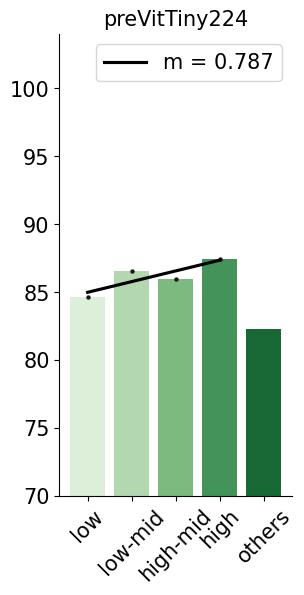
We choose the classical Resnet[7] and vision transformer (ViT)[4, 22] as test beds. Resnet represents models that use the CNN architecture, which assumes more inductive biases, while ViT claims to rely less on the inductive bias. Based on these priors, we expect Resnet to be more like humans, more sensitive to color contrast, and ViT to be less sensitive to color contrast.
| Model | #parameters |
|---|---|
| Resnet18 | 11.4M |
| Resnet101 | 42.8M |
| ViT Tiny | 5M |
| ViT Small | 22M |
Does model size matter?
[9] suggests larger models are more robust. Therefore, for both Resnet and ViT we choose two different model sizes: Resnet18 and Resnet 101, and ViT Tiny and ViT Small. Both ViT Small and Resnet101 are about four times larger than the smaller models. Tab. 2 shows the model size of these architectures.
Training details.
We train Resnet18 and Resnet101 for 250 epochs with stochastic gradient descent (SGD), weight decay of 0.0005, initial learning rate 0.1 and milestone learning rate decay at epochs [150, 200] with a decay factor of 0.1. For ViTs, we follow the procedure in [4] to fine-tune ViT Tiny and ViT Small (preVitSmall224) on resized CIFAR10 and CIFAR100 with SGD, learning rate 0.003 and no weight decay. We use these training setups and models to evaluate throughout the paper. Furthermore, as ViT are pre-trained on Imagenet, for fairness, we also include pre-trained Resnets (preResnet) that emulate the protocol in [13] to fine-tune with milestone learning rate decay schedule at one-third and two-thirds of the process. All models are trained with a batch size of 128111In [13] they use batch size of 512 but we find that the results are not good and also for a fair comparison we finally choose batch size as 128.. For more details on training, please refer to the Appendix.
4.2 Discussion
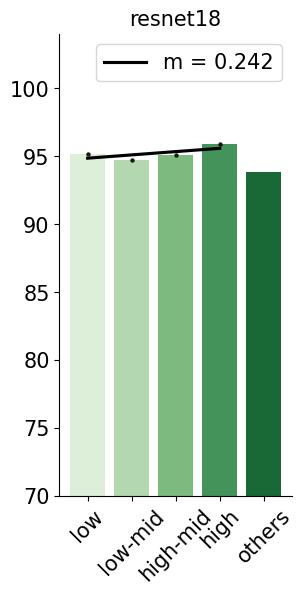
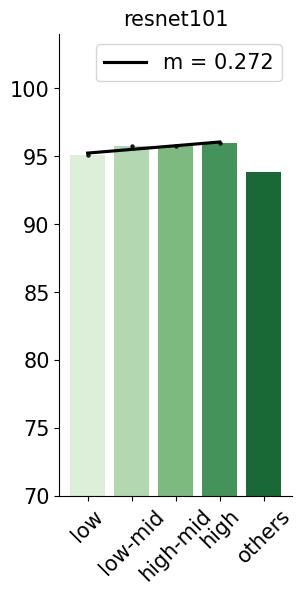
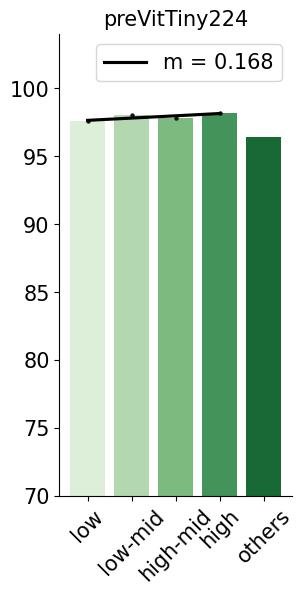
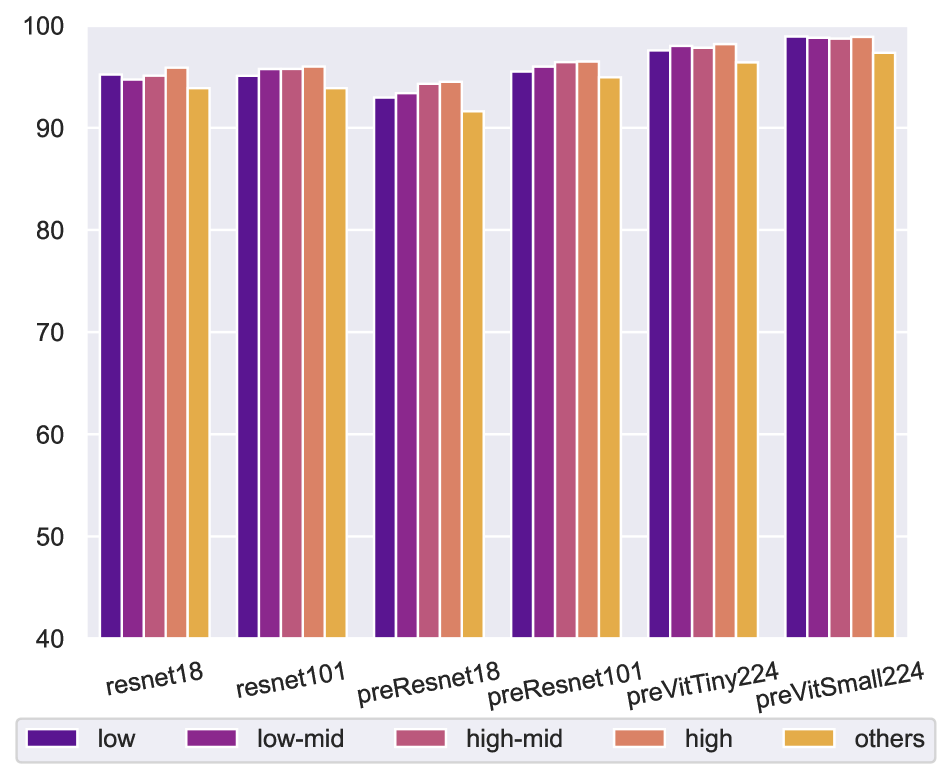
We use CIFAR10-CoCo and the groups defined in §3.1 to measure the accuracy under different color contrasts. Fig. 5 shows the performances of the aforementioned six models. In general, we see that the result for the high contrast group is better, meaning that in this evaluation, machine vision is like human vision in the sense that it also relies on color contrast or has the color vision aspect. Moreover, we perform a regression analysis for the four color contrast groups and observe there exist a positive trend between accuracy with color contrast, the higher the more reliant on color contrast. Additionally, pre-trained Resnet models seem to use more color contrast as a predictive signal. Also, ViTs are relatively less sensitive to color contrast, which also confirms the claim that ViT relies less on inductive biases[4].
This proof of principle study confirms our hypothesis that color contrast plays a key role in machine vision for visual recognition.
5 Evaluating Deep Neural Networks using CIFAR-CoCo Datasets
After validating the ability of CIFAR10-CoCo, we now proceed to explore other directions of model ability using our datasets. In this section, we test model ability in dataset complexity and then extend the analysis with CIFAR-C for more complete contrast sensitivity evaluations. Finally, we discuss the findings and their implications.
5.1 From 10 Classes to 100 Classes
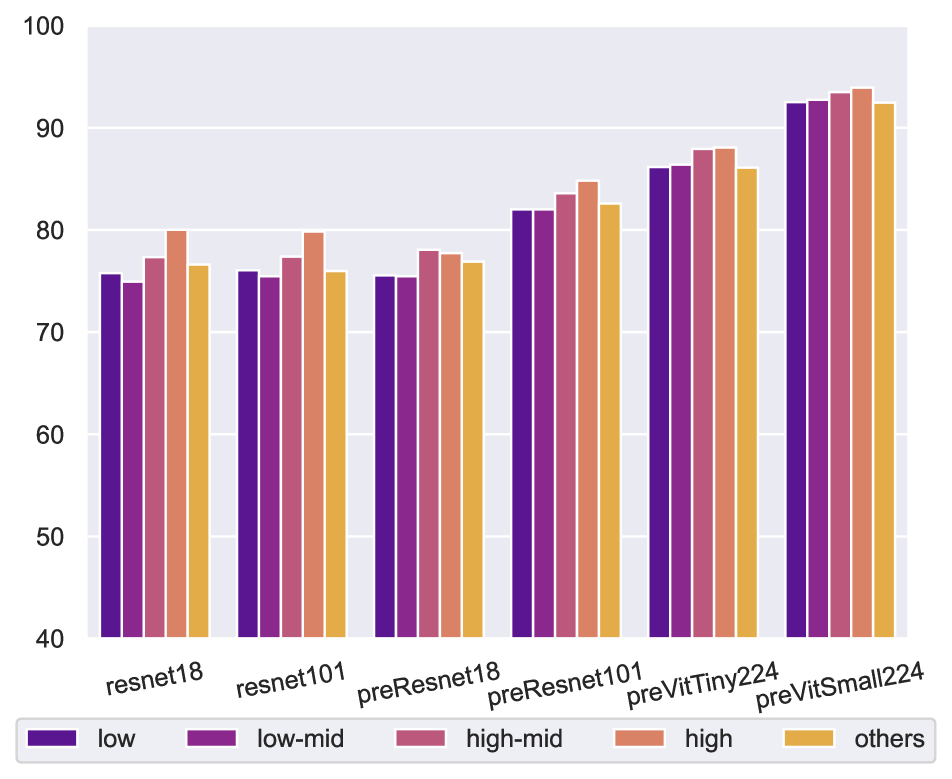
We are interested in how a more difficult and realistic dataset such as CIFAR-100 changes the model’s reliance on color contrast. We expect harder scenarios would require added contrast in helping predictions. Thus, we compare models in §4 with CIFAR100-CoCo. Fig. 6 shows that our intuition is correct: machine vision relies more on color contrast when tasked with a more complex dataset, as measured by larger linear regression line slopes in CIFAR100-CoCo compared to CIFAR10-CoCo for all six models. Also, the regression analysis confirms our prior belief that ViTs rely less on inductive biases than CNNs. However, surprisingly, pre-training and model size differences on Resnets do not seem to significantly affect the reliance trend.


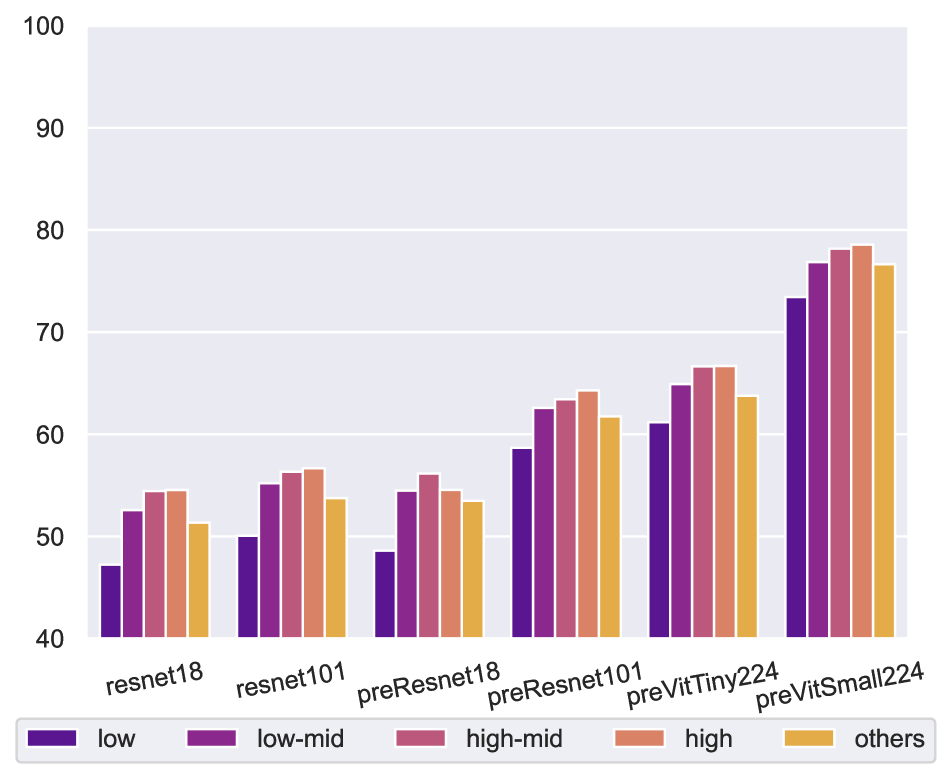
5.2 Adding Environmental Factors
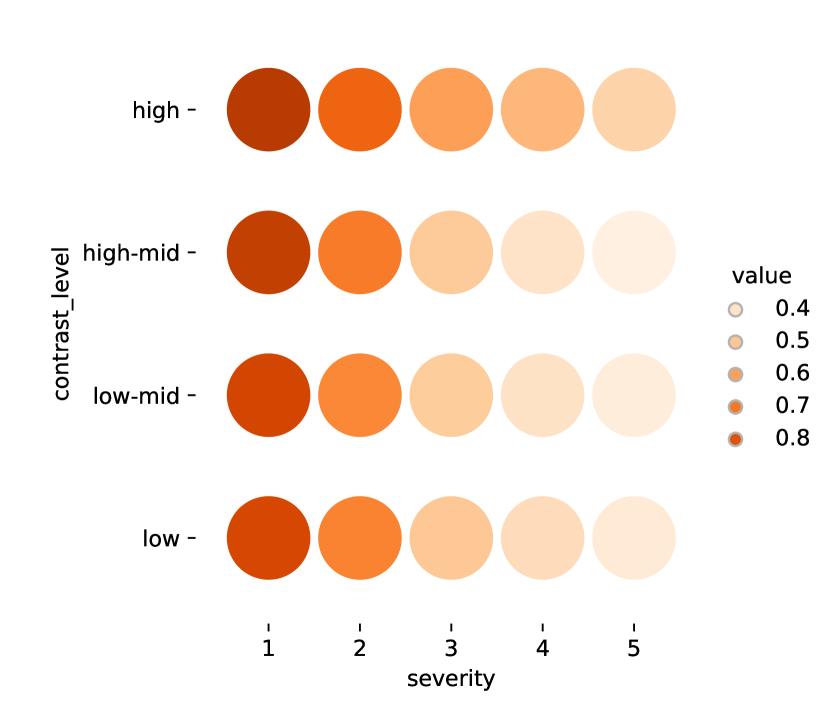
We task models with more complex environments this time by using corrupted datasets. Fig. 7 & 9 show a consistent trend that color contrast plays a more important role when tasks become more complicated, both from CIFAR10 to CIFAR100 and from CIFAR10 to CIFAR10-C. However, the degree of effect on each model from CIFAR10 to CIFAR100 and from CIFAR10 to CIFAR10-C is not consistent. For example, ViTs show less increased dependency on color contrast on CIFAR10-C than on CIFAR100 (Fig. 6 & 7) suggesting different mechanism are in action when models are subject to different types of increasing complexity. To bolster this, Fig. 8 shows non-uniform change along severity and color contrast, especially at high severity.
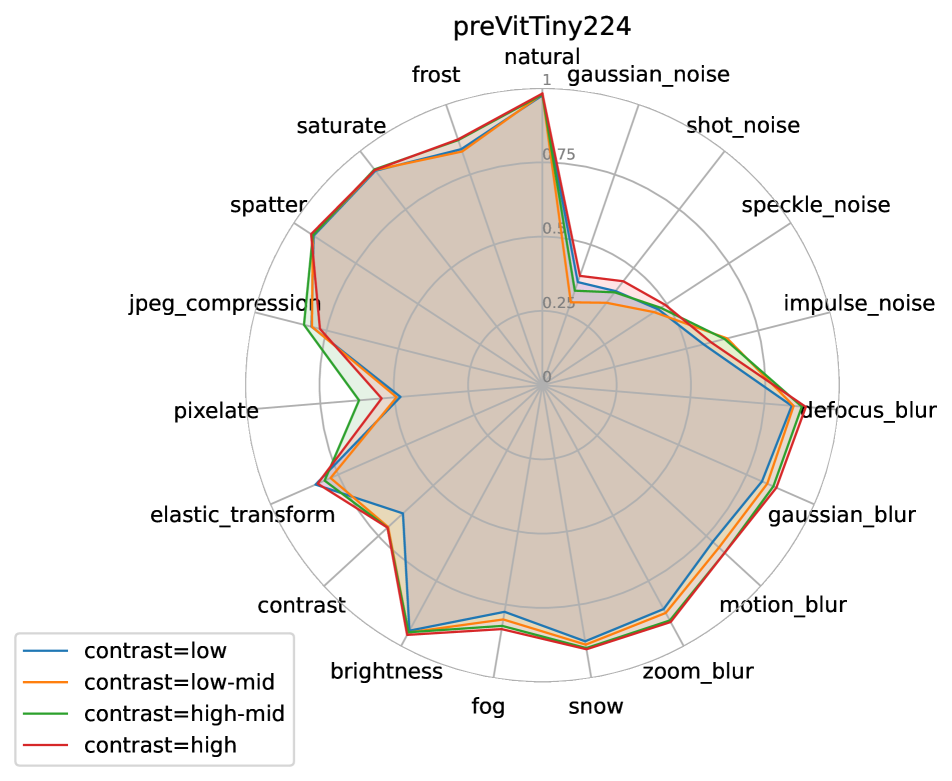
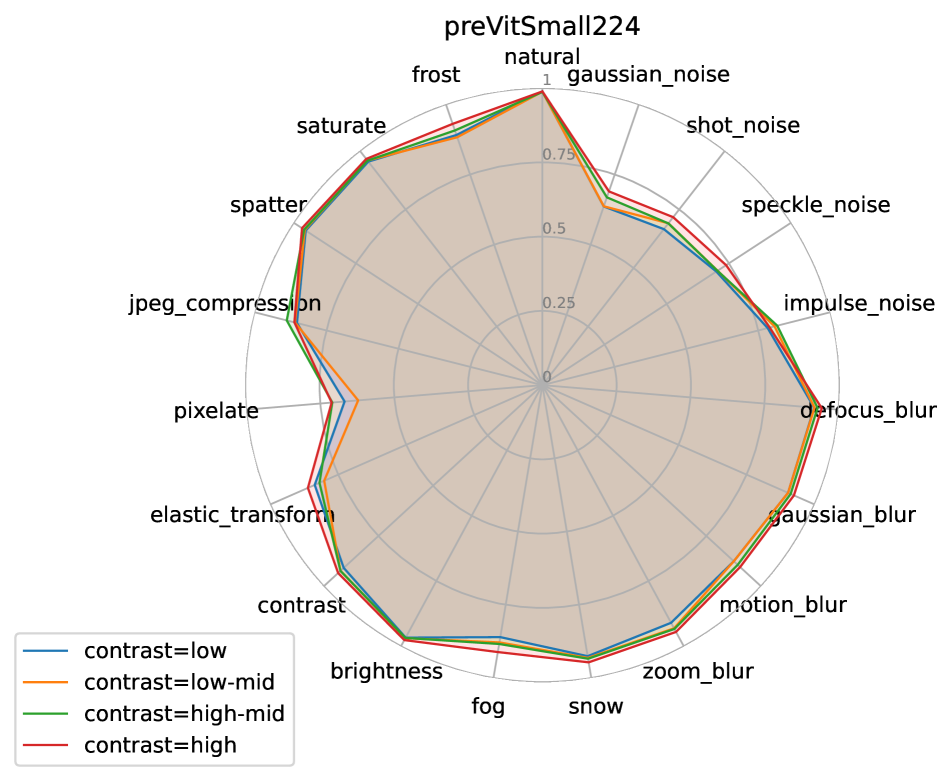
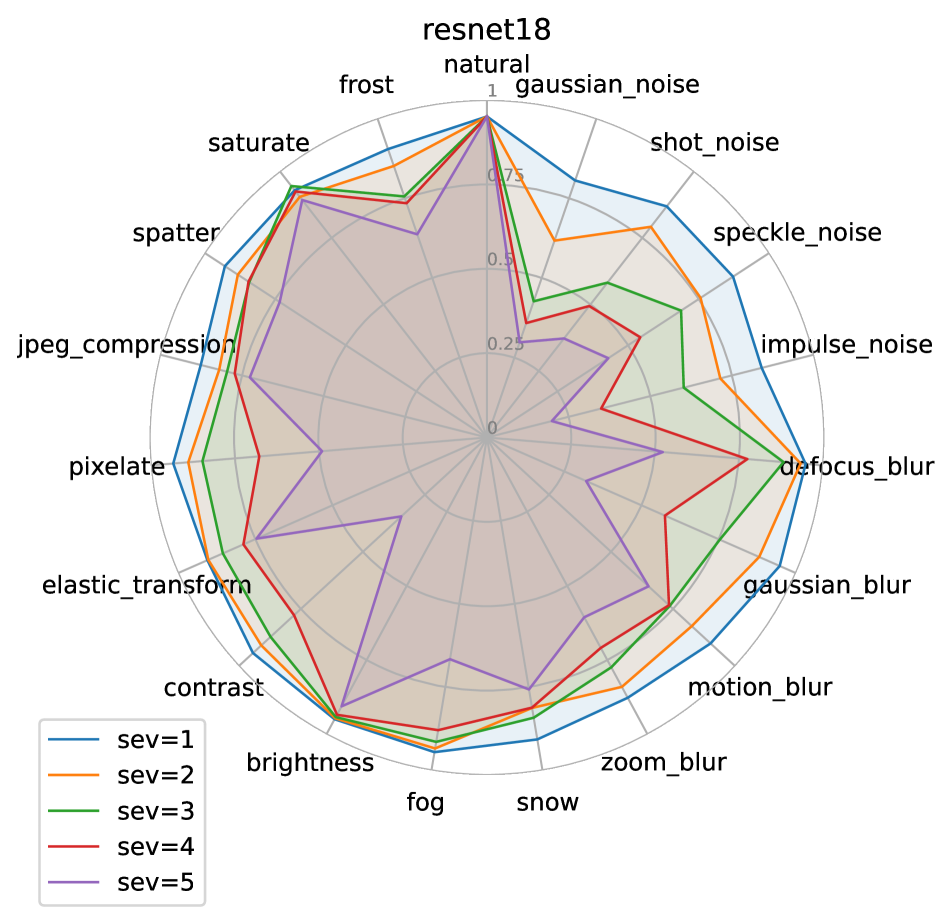
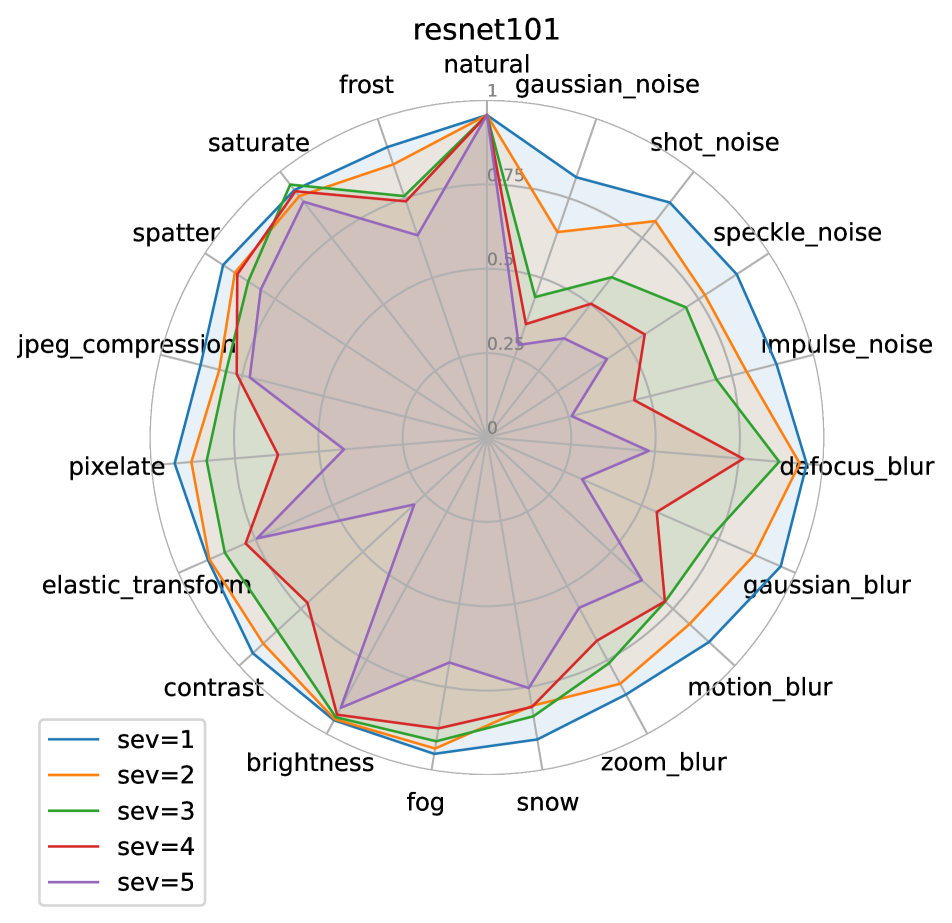
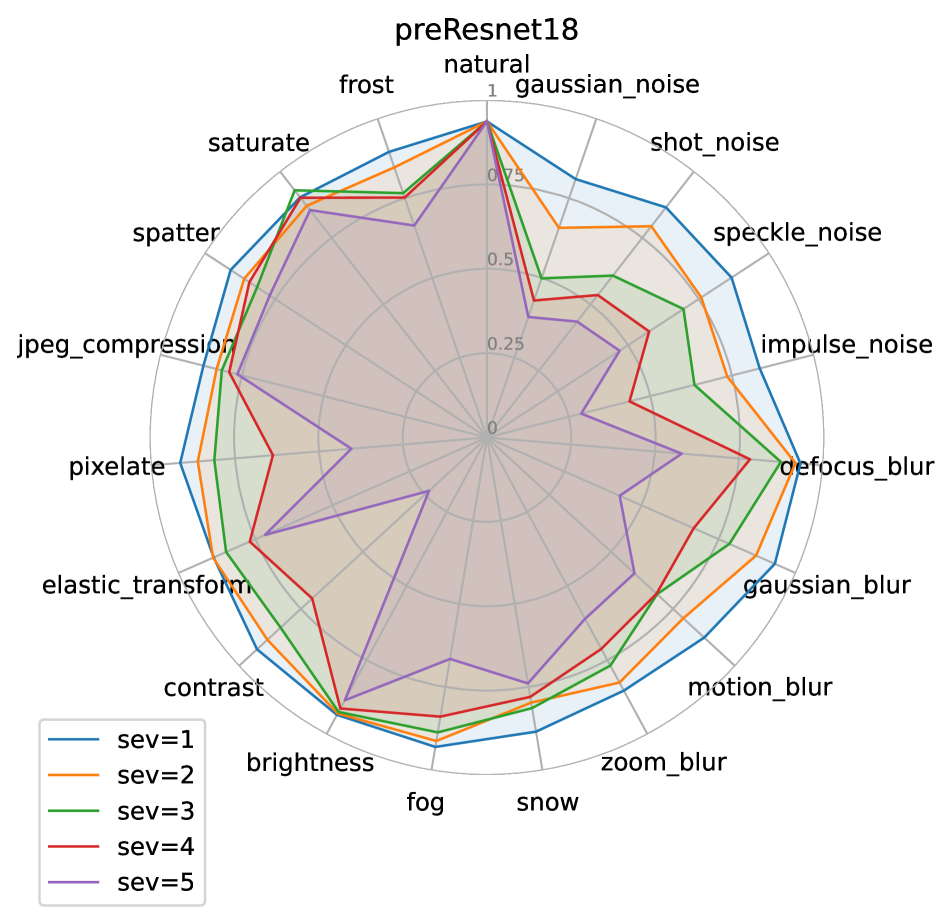
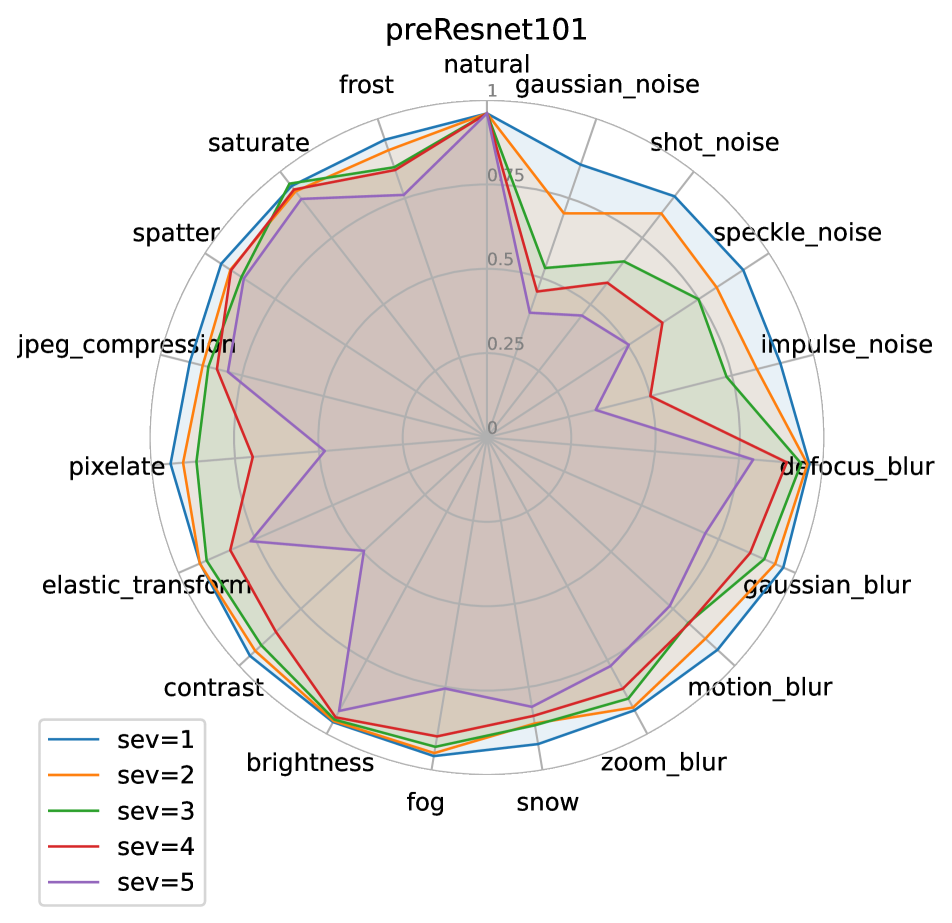
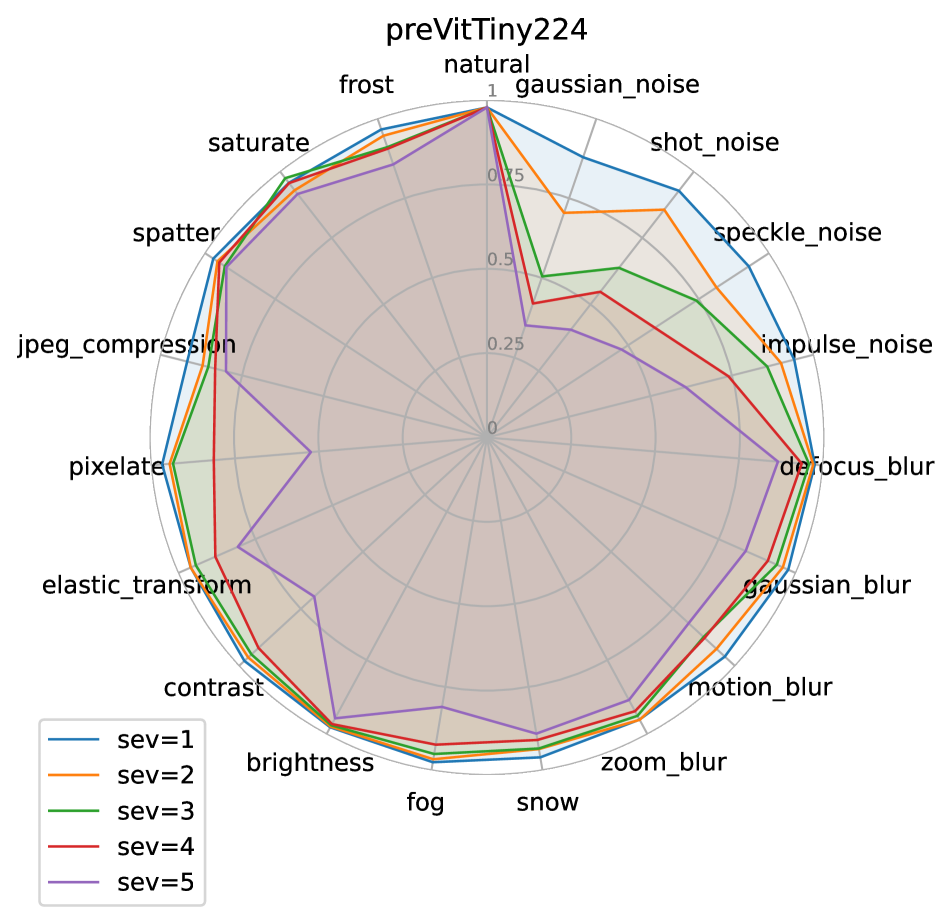
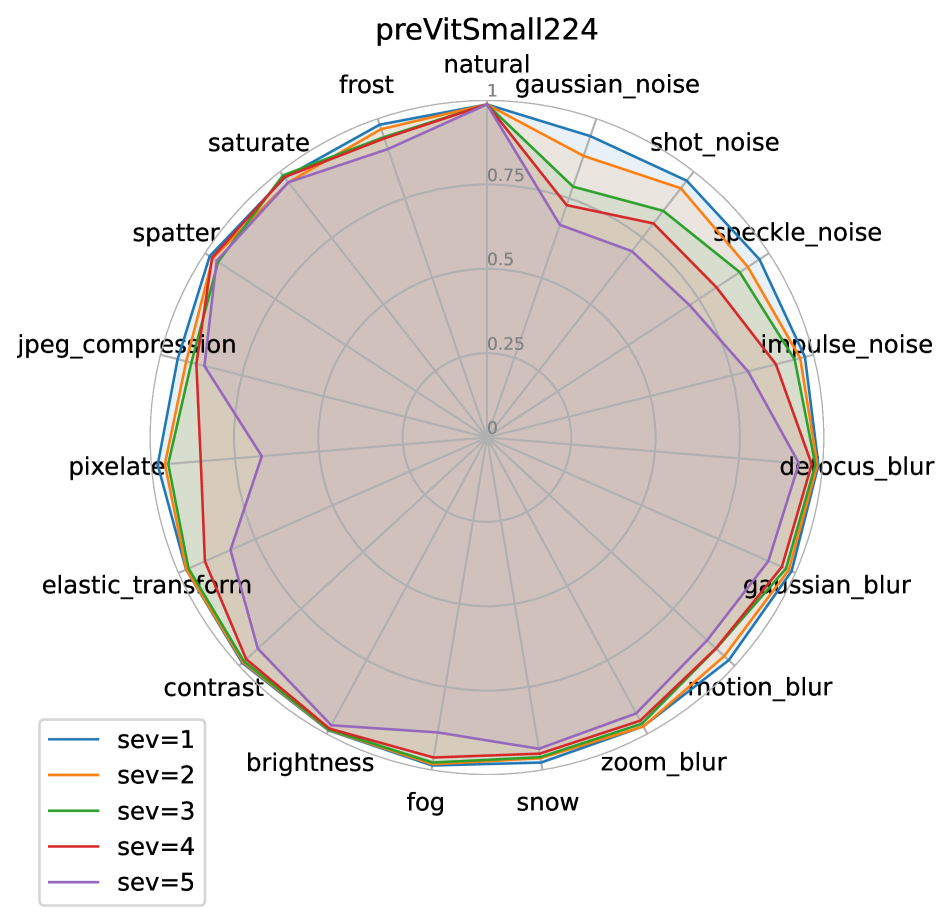
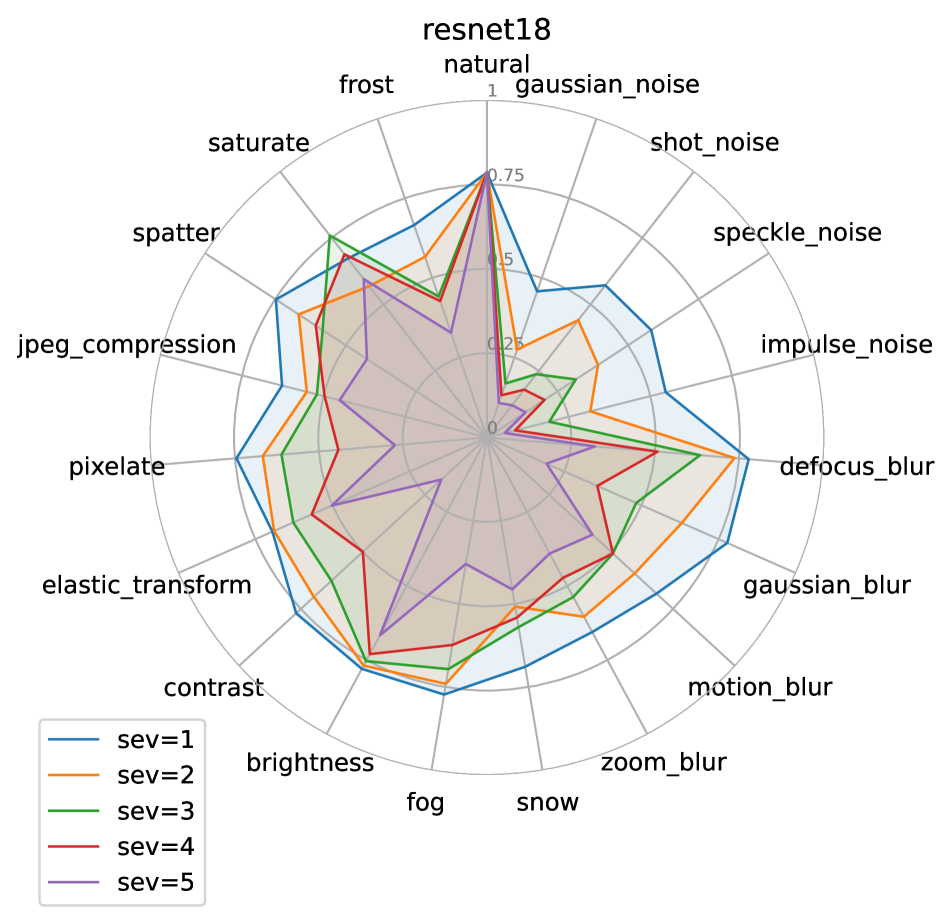
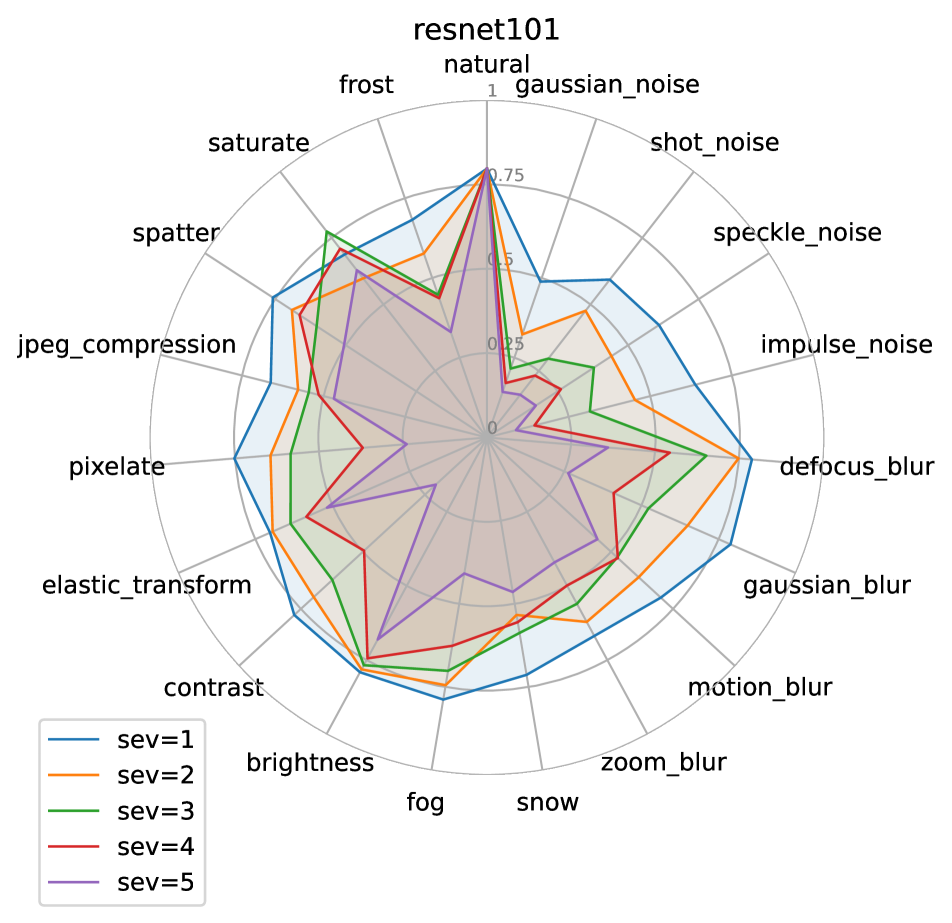
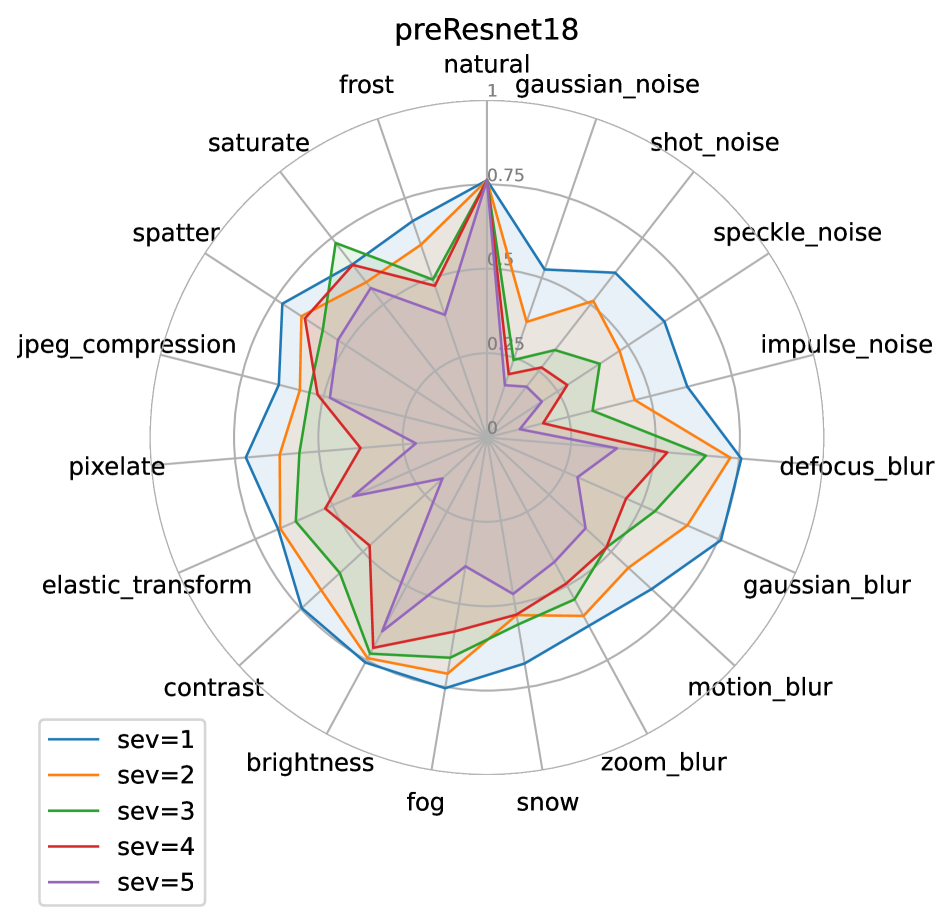
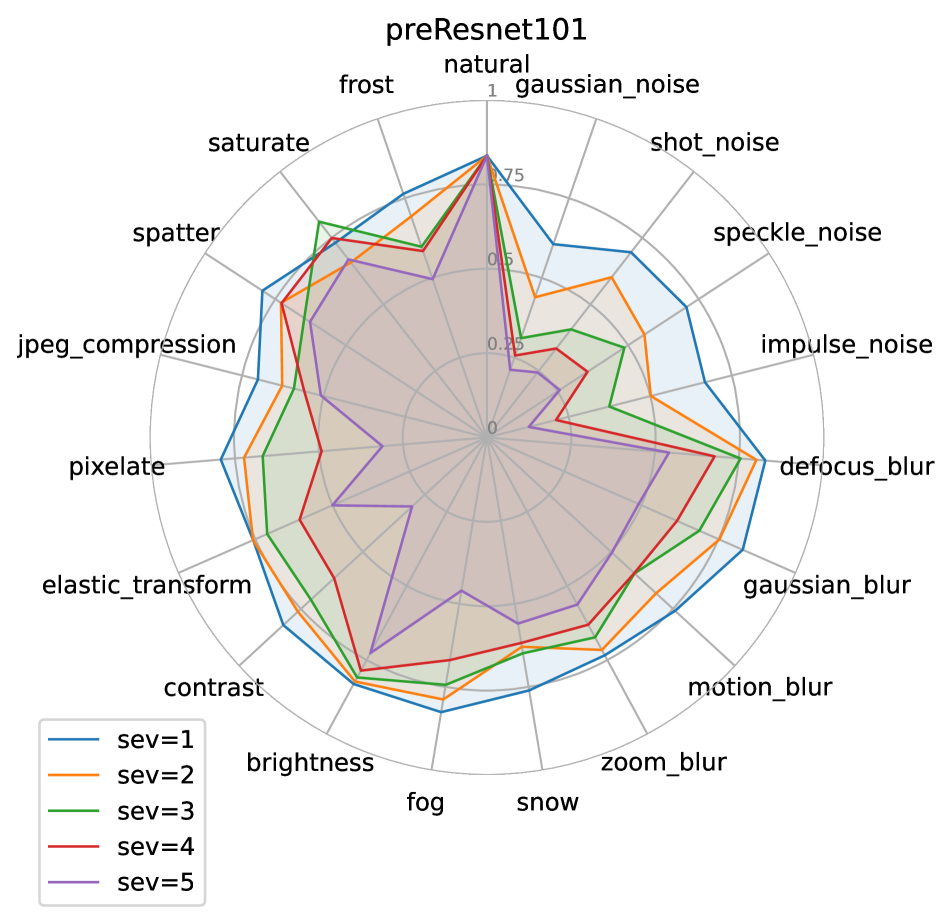
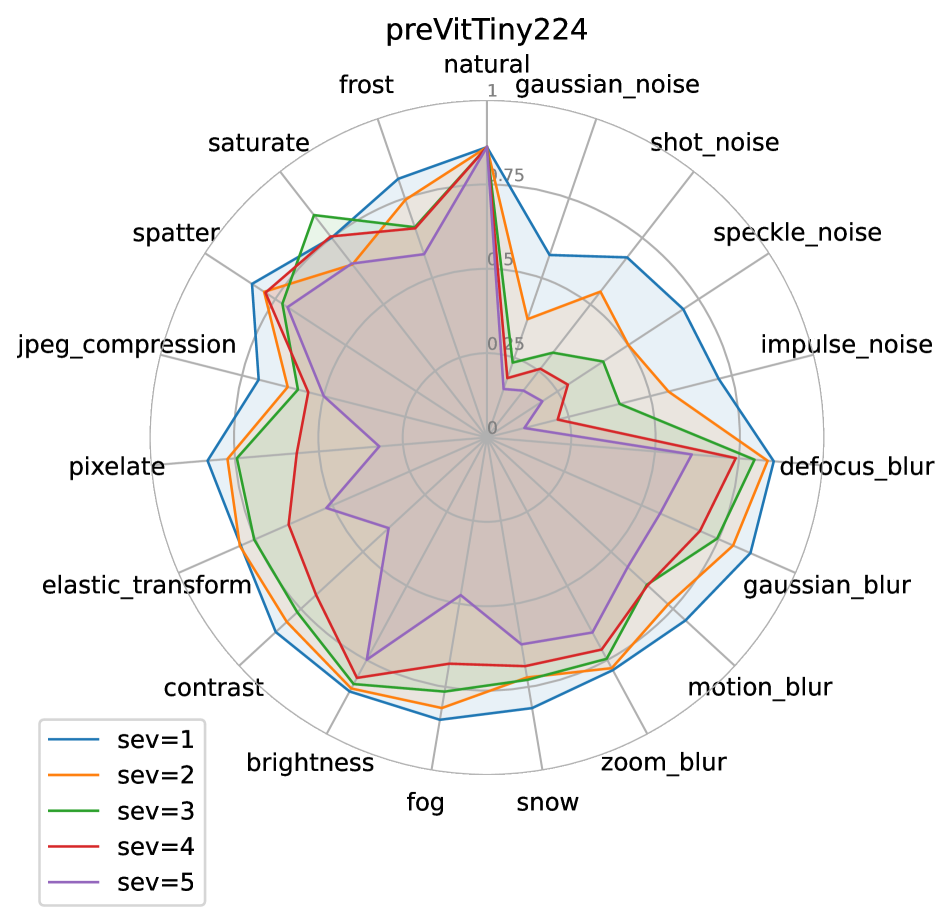
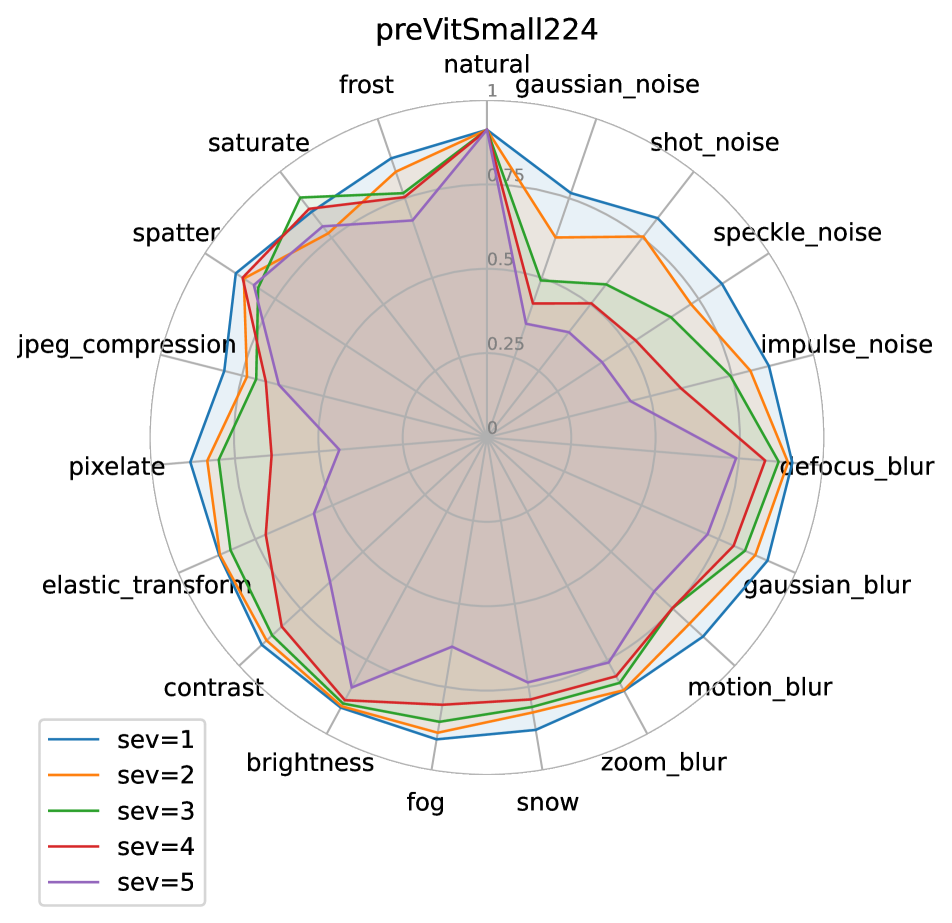
Therefore, we ask how color contrast affects different types of environmental factors. Fig. 10 presents model performances on all CIFAR-C corruption types by different color contrast levels. We observe that performance varies between different corruption types on all models, but higher contrast groups (high and high-mid) show better results.
An interesting contradiction to our expectations is observed. We expect image processing such as compression and blurring to be affected the most by color contrast since they are more artificial, while noises such as Gaussian noise are symmetric and more natural. But the analysis result indicates the contrary: on Resnets, noises stand out as being affected by contrast level the most.
In general, pre-trained Resnets are more robust to contrast change under corruptions compared to plain Resnets and ViTs again perform more consistently in different contrast groups.


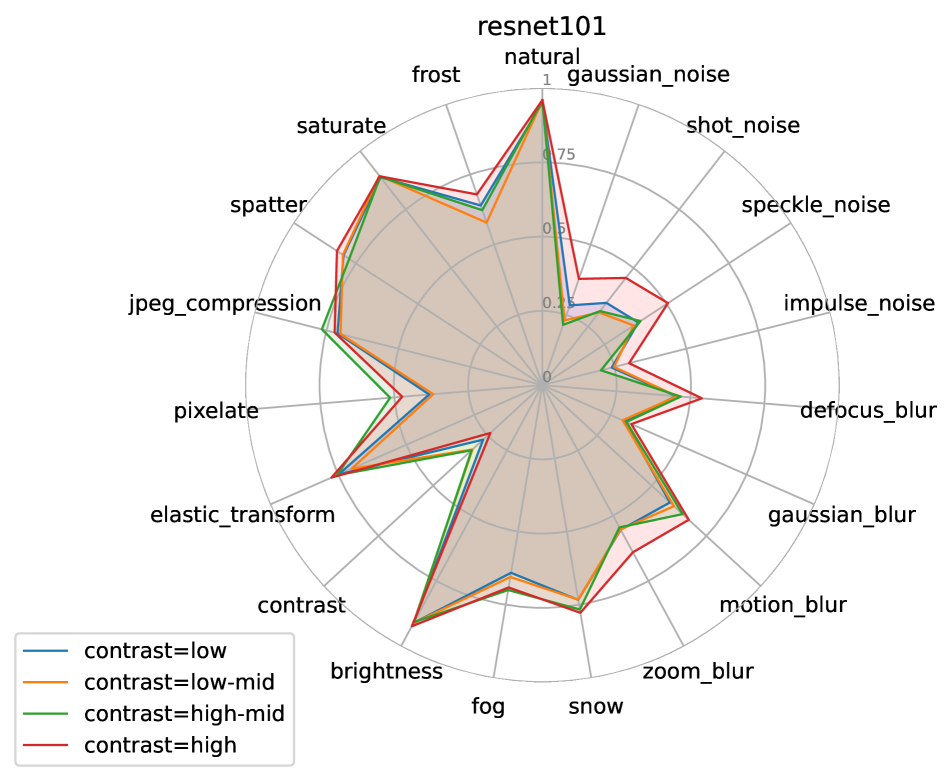

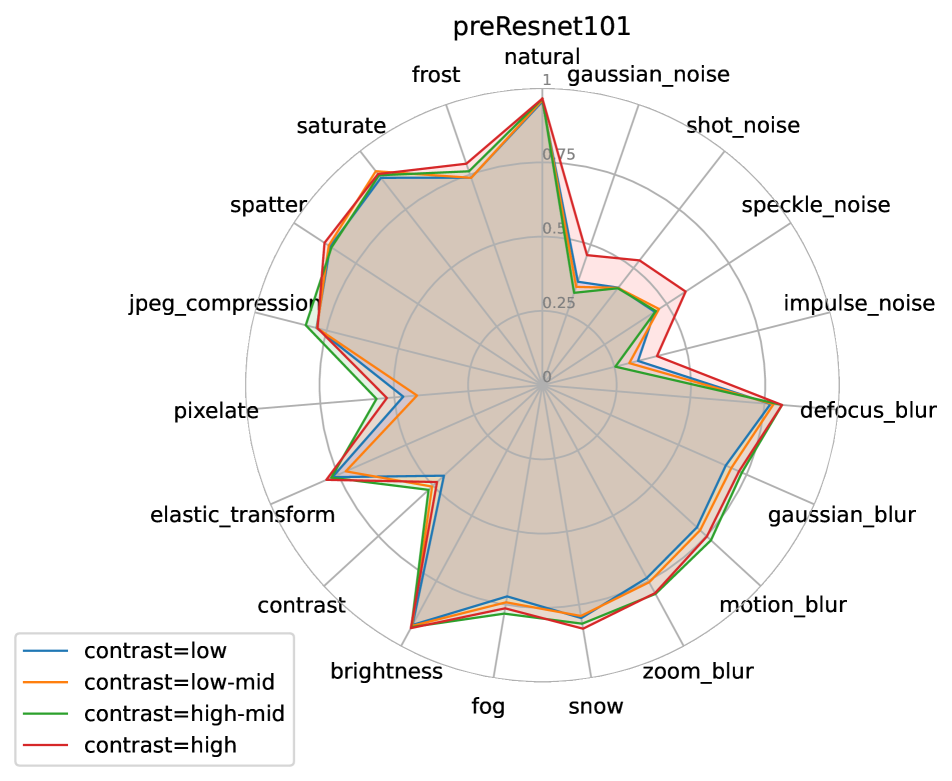
These findings have huge implications and insights since it is essential to enhance color contrast for object recognition tasks on CNNs in Gaussian noise-like environments or broader noisy scenarios for robust computer vision. In §5.4, we perform a deeper case study on Gaussian noise. We can also perform similar studies for different corruption types.
5.3 Quantifying the Effects of Contrast & Severity
While the regression line slope can be viewed as a metric of model dependency on color contrast level, we also intend to quantify model sensitivity to color contrast. We propose to use a weighted standard deviation, which accounts for the sample size of each subgroup:
| (1) |
where ’s are the contrast subgroup accuracies, the weighted mean, ’s the weights determined by the number of examples in the group, the number of contrast groups (usually 4 in our case) and dof is the degree of freedom.
Notice that a model with a large between-subgroup performance difference can have a regression slope equal to zero, indicating no dependence on color contrast, but the high sensitivity score of this model will show its low robustness to color contrast. We use the same metric to quantify the model’s sensitivity to corruption severity.
5.4 Sensitivity to Color Contrast and Corruptions: A Case Study
Fig. 11 shows the joint effect of color contrast and corruptions: the relative sensitivity to color contrast and severity measured by weighted standard deviation on the tested models. We compare model sensitivity when all corruption types are pooled together and when only Gaussian noise is considered. We pick Gaussian noise from the noises since Gaussian noise is the most commonly seen in signal processing.
When all corruption types are pooled, models show consistent sensitivity behavior on CIFAR10-C & CIFAR100-C. Resnet18 (blue) shows the highest sensitivity to contrast, suggesting that a small CNN model without pre-training suffers more instability in color contrast. In addition, pre-trained models appear to be more robust to color contrast and corruption, and bigger model in general perform better in terms of sensitivity on CIFAR-C, matching our expectations.
Onto Gaussian noise, model sensitivity behaviors are less consistent from CIFAR10-C to CIFAR100-C. While sensitivity to contrast remains similar, sensitivity to corruption severity appears to flip to a diagonal one. We do not have good insight into this phenomenon, and it shows there is a deficit in understanding machine vision.


6 How do Data Augmentations play a role?
We are interested in how DAs affect the color vision ability of machine vision, as prior works in robustness and OOD literature suggest that data augmentations are by far one of the most effective ways to improve OOD[27, 29]. For simplicity, we only consider low-level DA in our work.
6.1 Methods
We conduct four types of low-level DAs to our models: (1) fill-in-with-blank, (2) mixing by fill-in-the-blank, (3) combinations of image manipulations, and (4) mixing by interpolations. We report results that use the best setups reported in their papers.
Cutout
[3] crops out a rectangular part of an image randomly and fills the area with a certain color, while the label remains unchanged.
Cutmix
[30] crops out a rectangular area of an image and fills the area with a portion of the same size from another image. The label of the new image is altered according to the proportion of the area of two involved images.
Autoaug
[2] uses reinforcement learning to optimize a pre-selected set of image processing policies that are combinations of low-level image manipulation, and then learns the best policy.
Mixup
[31] does interpolation on two images and create a new image as where , and it does the same to the label, .
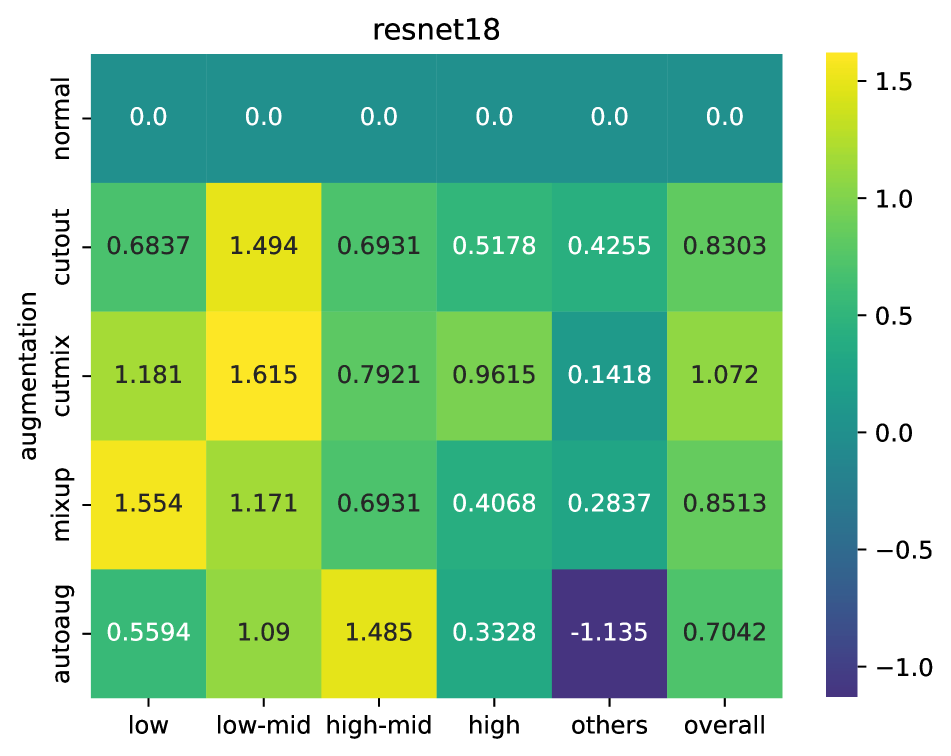
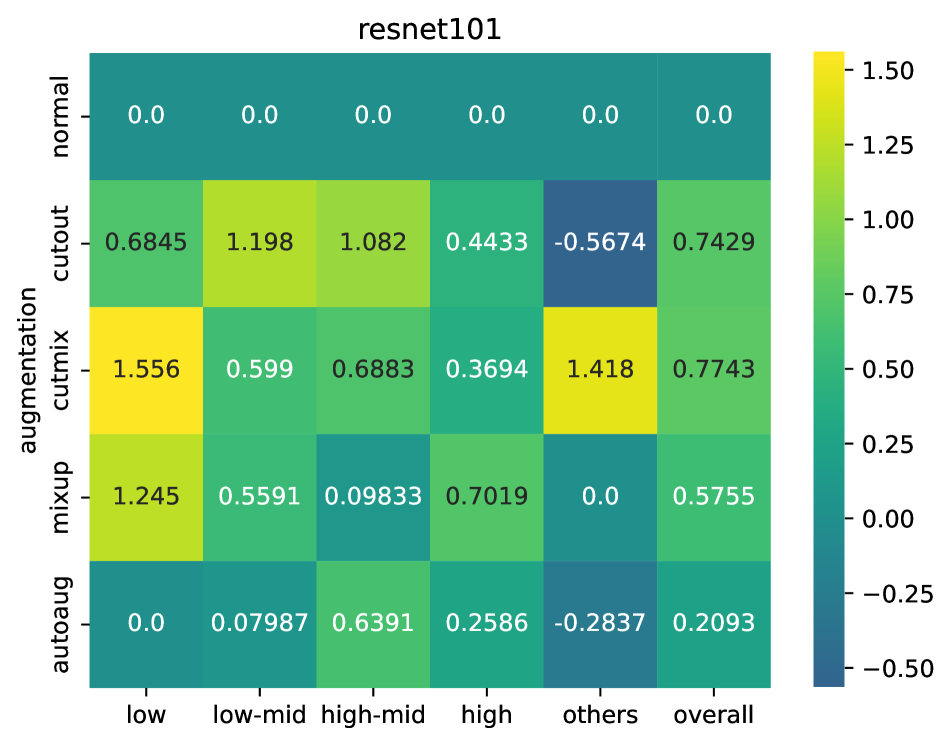
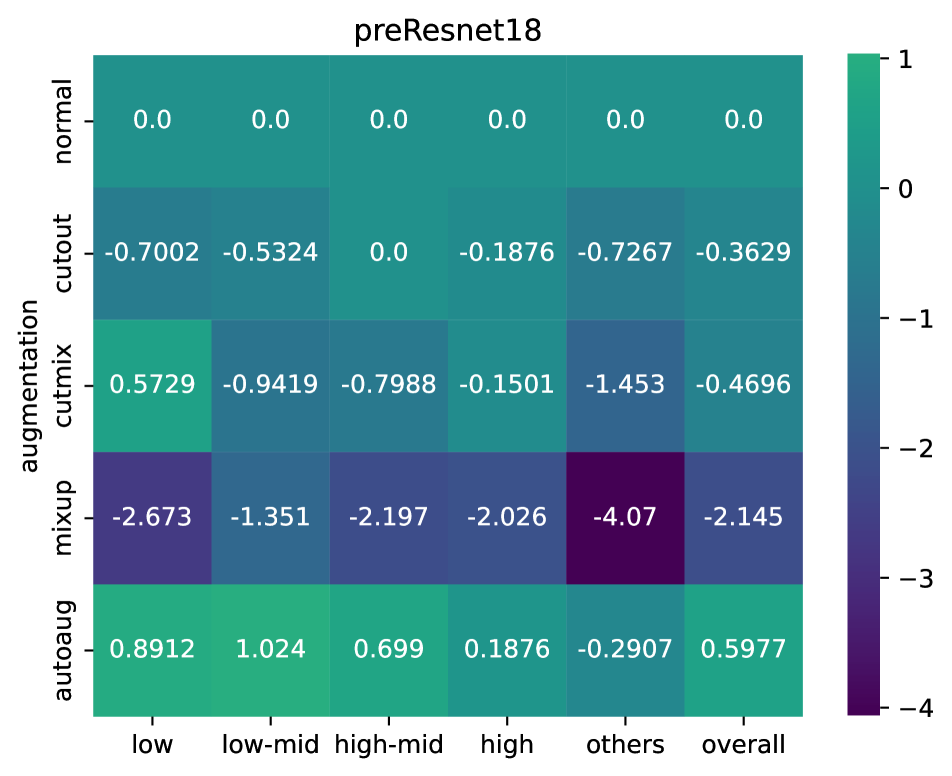
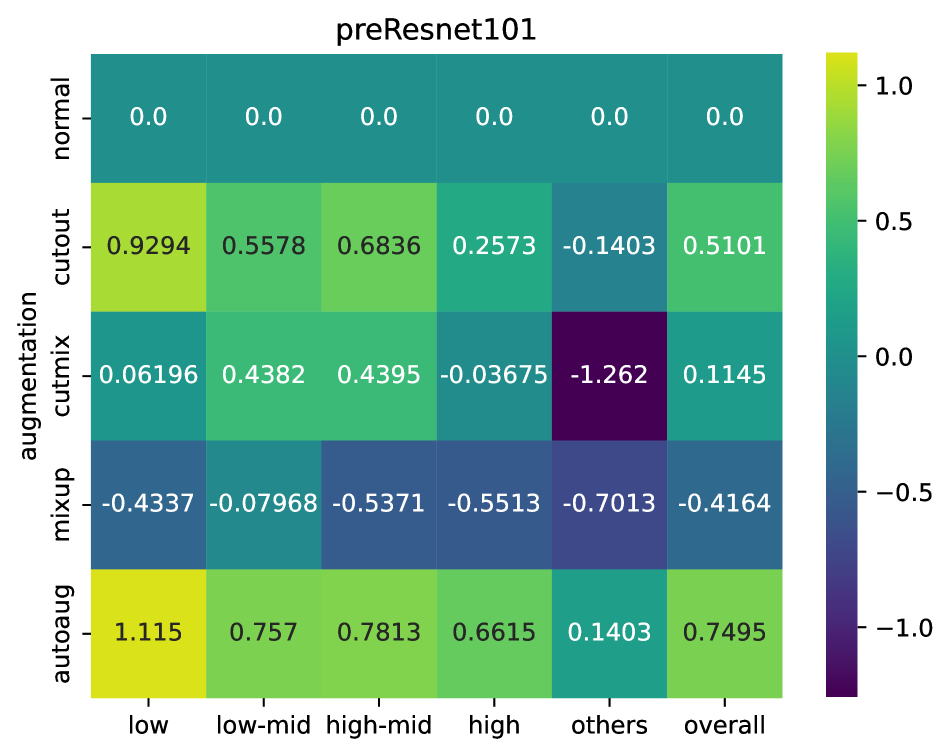
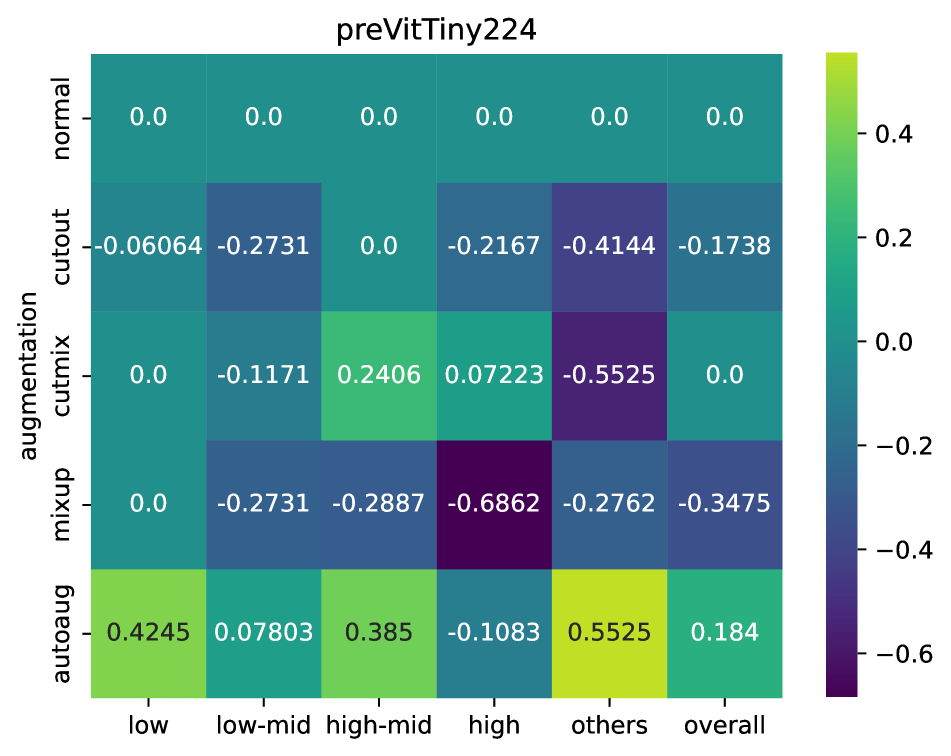
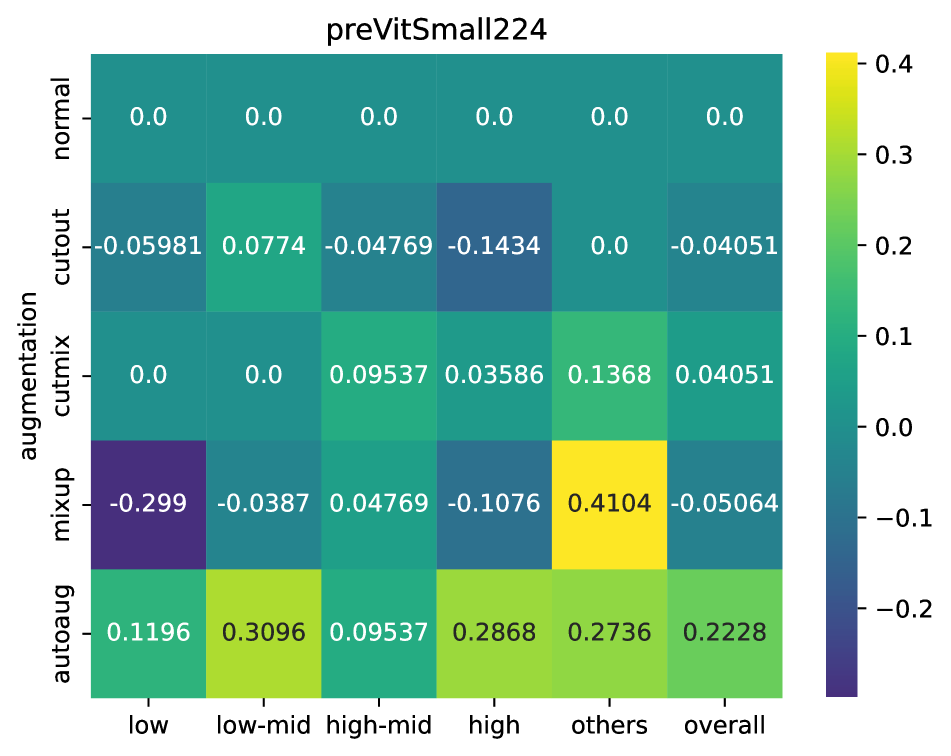
6.2 Findings
Fig. 12 presents how much each type of DA changes the accuracy in the respective contrast group. Although the overall performances are enhanced, we find that we cannot simply apply any augmentation data to any contrast group as it can hurt the performance. For instance, Cutmix and Mixup show reversed behavior on Resnets and pre-trained Resnets. Our results suggest DA are not created equal in different scenarios.
These findings have important practical meanings, future works may want to be careful when choosing DA type that suit the application domain.
7 Discussion
In this work, we argue there is more to machine vision evaluations than current literature and construct two new datasets and CIFAR-CoCo that verify the color vision aspect of object recognition. Next, we provide a framework for a comprehensive analysis of contrast sensitivity for machine vision. Furthermore, we explore DA’s effect and observe findings that have implications for practical use cases.
Our framework provides new evaluation tools and opens up an avenue to studying a broader notion of human-like ability for machine vision. Our analyses are by no means exhaustive, and we encourage sounder evaluations such as going one step further in studying each type of corruption, diving into each background and foreground color subgroup, and then conducting analysis per our framework. Also, advanced DA could change model behaviors in contrast sensitivity.
Last but not least, due to the limitation of computing resources, we did not test larger models or other state-of-the-art architectures. We will release our framework to the public so that the community can use it to evaluate their own models.
References
- [1] Ming-Chang Chiu. Cifar-background, 2022.
- [2] Ekin Dogus Cubuk, Barret Zoph, Dandelion Mané, Vijay Vasudevan, and Quoc V. Le. Autoaugment: Learning augmentation policies from data. ArXiv, abs/1805.09501, 2018.
- [3] Terrance Devries and Graham W. Taylor. Improved regularization of convolutional neural networks with cutout. ArXiv, abs/1708.04552, 2017.
- [4] Alexey Dosovitskiy, Lucas Beyer, Alexander Kolesnikov, Dirk Weissenborn, Xiaohua Zhai, Thomas Unterthiner, Mostafa Dehghani, Matthias Minderer, Georg Heigold, Sylvain Gelly, et al. An image is worth 16x16 words: Transformers for image recognition at scale. arXiv preprint arXiv:2010.11929, 2020.
- [5] Robert Geirhos, Kristof Meding, and Felix Wichmann. Beyond accuracy: quantifying trial-by-trial behaviour of cnns and humans by measuring error consistency. ArXiv, abs/2006.16736, 2020.
- [6] I. Goodfellow, Jonathon Shlens, and Christian Szegedy. Explaining and harnessing adversarial examples. In ICLR, volume abs/1412.6572, 2015.
- [7] Kaiming He, Xiangyu Zhang, Shaoqing Ren, and Jian Sun. Deep residual learning for image recognition. In Proceedings of the IEEE conference on computer vision and pattern recognition, pages 770–778, 2016.
- [8] Dan Hendrycks and Thomas Dietterich. Benchmarking neural network robustness to common corruptions and perturbations. Proceedings of the International Conference on Learning Representations, 2019.
- [9] Dan Hendrycks, Norman Mu, Ekin D. Cubuk, Barret Zoph, Justin Gilmer, and Balaji Lakshminarayanan. Augmix: A simple data processing method to improve robustness and uncertainty, 2019.
- [10] Katherine Hermann, Ting Chen, and Simon Kornblith. The origins and prevalence of texture bias in convolutional neural networks. Advances in Neural Information Processing Systems, 33:19000–19015, 2020.
- [11] Adobe Inc. Color contrast in photography., 2022.
- [12] G.H. Jacobs. Encyclopedia of Biological Chemistry (Second Edition). Elsevier, 2013.
- [13] Alexander Kolesnikov, Lucas Beyer, Xiaohua Zhai, Joan Puigcerver, Jessica Yung, Sylvain Gelly, and Neil Houlsby. Big transfer (bit): General visual representation learning, 2019.
- [14] Alex Krizhevsky. Learning multiple layers of features from tiny images. 2009.
- [15] Alexey Kurakin, I. Goodfellow, and S. Bengio. Adversarial machine learning at scale. ArXiv, abs/1611.01236, 2017.
- [16] Yann LeCun, Bernhard Boser, John S Denker, Donnie Henderson, Richard E Howard, Wayne Hubbard, and Lawrence D Jackel. Backpropagation applied to handwritten zip code recognition. Neural computation, 1(4):541–551, 1989.
- [17] Cynthia Owsley and Michael E Sloane. Contrast sensitivity, acuity, and the perception of’real-world’targets. British Journal of Ophthalmology, 71(10):791–796, 1987.
- [18] Adam Paszke, Sam Gross, Francisco Massa, Adam Lerer, James Bradbury, Gregory Chanan, Trevor Killeen, Zeming Lin, Natalia Gimelshein, Luca Antiga, Alban Desmaison, Andreas Kopf, Edward Yang, Zachary DeVito, Martin Raison, Alykhan Tejani, Sasank Chilamkurthy, Benoit Steiner, Lu Fang, Junjie Bai, and Soumith Chintala. Pytorch: An imperative style, high-performance deep learning library. In Advances in Neural Information Processing Systems 32, pages 8024–8035. Curran Associates, Inc., 2019.
- [19] Daniel Porter. Visual acuity, 2022.
- [20] Dale Purves, George J Augustine, David Fitzpatrick, Lawrence C Katz, Anthony-Samuel LaMantia, James O McNamara, and S Mark Williams. Neuroscience. 2nd edition. Sinauer Associates, 2001.
- [21] Blake A Richards, Timothy P Lillicrap, Philippe Beaudoin, Yoshua Bengio, Rafal Bogacz, Amelia Christensen, Claudia Clopath, Rui Ponte Costa, Archy de Berker, Surya Ganguli, et al. A deep learning framework for neuroscience. Nature neuroscience, 22(11):1761–1770, 2019.
- [22] Hugo Touvron, Matthieu Cord, Matthijs Douze, Francisco Massa, Alexandre Sablayrolles, and Hervé Jégou. Training data-efficient image transformers: distillation through attention, 2020.
- [23] Shikhar Tuli, Ishita Dasgupta, Erin Grant, and Thomas L Griffiths. Are convolutional neural networks or transformers more like human vision? arXiv preprint arXiv:2105.07197, 2021.
- [24] Ashish Vaswani, Noam Shazeer, Niki Parmar, Jakob Uszkoreit, Llion Jones, Aidan N Gomez, Łukasz Kaiser, and Illia Polosukhin. Attention is all you need. Advances in neural information processing systems, 30, 2017.
- [25] Chien-Yao Wang, Alexey Bochkovskiy, and Hong-Yuan Mark Liao. Yolov7: Trainable bag-of-freebies sets new state-of-the-art for real-time object detectors, 2022.
- [26] Wenhui Wang, Hangbo Bao, Li Dong, Johan Bjorck, Zhiliang Peng, Qiang Liu, Kriti Aggarwal, Owais Khan Mohammed, Saksham Singhal, Subhojit Som, and Furu Wei. Image as a foreign language: Beit pretraining for all vision and vision-language tasks, 2022.
- [27] Florian Wenzel, Andrea Dittadi, Peter Vincent Gehler, Carl-Johann Simon-Gabriel, Max Horn, Dominik Zietlow, David Kernert, Chris Russell, Thomas Brox, Bernt Schiele, Bernhard Schölkopf, and Francesco Locatello. Assaying out-of-distribution generalization in transfer learning, 2022.
- [28] Ross Wightman. Pytorch image models. https://github.com/rwightman/pytorch-image-models, 2019.
- [29] Jingkang Yang, Pengyun Wang, Dejian Zou, Zitang Zhou, Kunyuan Ding, Wenxuan Peng, Haoqi Wang, Guangyao Chen, Bo Li, Yiyou Sun, Xuefeng Du, Kaiyang Zhou, Wayne Zhang, Dan Hendrycks, Yixuan Li, and Ziwei Liu. Openood: Benchmarking generalized out-of-distribution detection, 2022.
- [30] Sangdoo Yun, Dongyoon Han, Seong Joon Oh, Sanghyuk Chun, Junsuk Choe, and Young Joon Yoo. Cutmix: Regularization strategy to train strong classifiers with localizable features. 2019 IEEE/CVF International Conference on Computer Vision (ICCV), pages 6022–6031, 2019.
- [31] Hongyi Zhang, Moustapha Cissé, Yann Dauphin, and David Lopez-Paz. mixup: Beyond empirical risk minimization. ArXiv, abs/1710.09412, 2018.
Appendix A Color Pairs
| CIFAR-B | CIFAR-F | CIFAR-CoCo |
|---|---|---|
| red | red | low |
| red | green | high |
| red | gray | low-mid |
| red | blue | high |
| red | brown | high-mid |
| red | white | high |
| red | black | high |
| red | others | others |
| green | green | low |
| green | blue | low-mid |
| green | brown | high |
| green | gray | low-mid |
| green | white | high-mid |
| green | black | high-mid |
| green | others | others |
| blue | blue | low |
| blue | brown | high |
| blue | gray | low-mid |
| blue | white | high-mid |
| blue | black | high-mid |
| blue | others | others |
| brown | brown | low |
| brown | gray | low-mid |
| brown | white | low-mid |
| brown | black | low-mid |
| brown | others | others |
| gray | gray | low |
| gray | white | low-mid |
| gray | black | low-mid |
| gray | others | others |
| white | white | low |
| white | black | high |
| white | others | others |
| black | black | low |
| black | others | others |
| others | others | others |
Appendix B CIFAR-C by Corruption by Severity
Appendix C Training Details
We emphasize that we do not compete for test set accuracy in this work so generalization performance is not our concern as long as they are reasonable. Here we detail our training procedures and their respective performances.
Vision Transformers (preVit224).
We use [28] for ViT implementation. [4] fine-tunes models on CIFAR images resized to resolution 384 and a batch size of 512 for 10k steps (about 25 epochs). Due to our computation-resource limit, we instead resize to resolution 224 and use a batch size of 128. Essentially we prolong the training. Using our recipe, for Tiny ViT, we achieve 97.83% and 86.08% on CIFAR10 and CIFAR100 respectively, which is not far away from ViT-B/16 reported in [4]; for Small ViT, we even achieve accuracy 98.73% on CIFAR10 and 91.2% on CIFAR100, even better than what is reported in [4]. Note that the model size of Tiny ViT or Small ViT is smaller or equal to what is used in [4].
Pre-trained Resnets (preResnet).
We use the pre-trained weights released by PyTorch[18]. The original recipe in [13] is to fine-tune Resnets with a batch size of 512 for 10k steps and learning rate decay at and through the process. To have fair procedures as ViTs, we follow the same setups but not resizing. We use a batch size of 128 to fine-tune on CIFAR for 25 epochs and decay learning rate at 8th and 16th epoch. We found using our recipe is much better than using the original recipe: with the original recipe we achieve accuracy 89.49% and 66.17% on CIFAR10 and CIFAR100 respectively, but our recipe can reach 93.7% and 76.26%.
Resnets.
Resnet training is the same as in §4, and we achieve accuracy 95.16% on CIFAR10 and 78.52% on CIFAR100.
Appendix D Code Release
We attach the dataset in supplementary material. Cleaned code, and datasets will be released upon the the acceptance of this paper.
Appendix E CIFAR-Foreground (CIFAR-F) Statsitics
Classes Green Gray Blue White Black Brown Red Others cat 0 115 3 85 133 527 0 137 dog 0 19 0 377 114 386 1 103 truck 72 31 135 294 50 102 270 46 bird 43 90 37 102 198 441 37 52 airplane 108 150 138 298 152 86 45 23 ship 39 61 117 429 98 87 110 59 frog 420 69 8 6 29 396 23 49 horse 6 21 7 288 142 510 3 23 deer 6 46 3 29 75 834 0 7 automobile 56 129 187 227 116 87 192 6
Classes Green Gray Blue White Black Brown Red Others streetcar 21 2 6 5 3 19 38 6 apple 6 0 0 0 0 9 69 16 palm_tree 95 0 0 0 1 1 0 3 man 0 0 0 72 6 5 0 17 forest 53 0 0 0 9 26 1 11 butterfly 3 1 6 5 14 58 10 3 lamp 3 4 8 16 26 32 4 7 wardrobe 0 3 0 13 0 81 2 1 pear 37 1 0 4 0 46 6 6 raccoon 0 6 0 5 4 84 1 0 crab 8 2 0 0 9 15 51 15 tractor 8 1 6 0 0 72 12 1 aquarium_fish 0 2 20 3 0 21 28 26 can 12 11 10 18 3 11 16 19 tank 55 14 1 0 12 15 0 3 snail 6 6 1 10 0 71 2 4 bed 0 5 11 42 1 16 8 17 cup 10 9 8 14 6 24 3 26 television 0 37 3 9 43 7 1 0 turtle 29 5 13 3 10 33 0 7 boy 0 0 0 72 18 4 0 6 mushroom 1 0 0 26 0 65 5 3 bee 0 0 0 1 32 64 0 3 fox 0 0 0 7 0 93 0 0 willow_tree 78 3 2 0 0 12 3 2 couch 8 4 11 22 10 29 7 9 dolphin 5 53 19 1 18 4 0 0 cattle 0 0 0 13 24 55 0 8 maple_tree 58 0 0 1 5 8 24 4 plain 53 2 3 1 2 38 1 0 bear 0 0 0 20 30 49 0 1 bridge 5 36 1 9 18 20 6 5 leopard 2 6 0 11 2 77 0 2 hamster 1 2 0 23 0 74 0 0 lawn_mower 26 2 0 0 15 8 35 14 lobster 12 1 8 3 9 20 37 10 camel 0 0 0 17 7 74 0 2 tiger 0 0 0 3 0 96 0 1 road 2 38 0 3 43 14 0 0 whale 0 23 14 7 54 2 0 0 motorcycle 5 0 21 6 19 13 25 11 crocodile 50 1 4 4 10 29 1 1 dinosaur 37 2 7 1 2 40 4 7 chair 6 5 11 8 8 49 10 3 bus 7 6 11 30 1 24 13 8 plate 8 1 13 34 1 11 1 31 otter 6 3 0 11 6 74 0 0 rose 0 0 1 7 0 10 80 2 seal 4 4 5 19 8 56 0 4 telephone 1 7 11 23 50 7 1 0 mouse 3 16 0 11 5 62 2 1
Classes Green Gray Blue White Black Brown Red Others tulip 0 0 5 12 0 22 61 0 porcupine 0 4 0 1 8 85 0 2 beaver 0 7 0 0 10 82 0 1 wolf 0 31 0 17 4 48 0 0 lizard 37 7 3 1 0 32 2 18 flatfish 10 5 2 22 5 52 1 3 beetle 30 2 7 0 18 13 22 8 chimpanzee 0 7 0 1 59 33 0 0 poppy 0 0 3 3 0 35 56 3 bowl 10 0 8 17 4 19 7 35 table 6 4 3 25 0 58 2 2 shrew 0 3 0 2 18 77 0 0 skyscraper 6 33 44 0 9 8 0 0 kangaroo 0 3 0 9 7 81 0 0 cloud 0 5 7 74 6 1 5 2 girl 0 0 0 79 11 10 0 0 worm 18 6 16 4 10 32 11 3 train 13 7 13 0 10 23 15 19 house 6 4 6 27 0 35 3 19 caterpillar 45 0 1 6 8 10 8 22 spider 6 0 3 5 19 34 0 33 rabbit 0 4 0 33 10 52 0 1 cockroach 2 0 2 0 32 58 3 3 rocket 11 10 2 43 20 7 1 6 castle 0 22 1 32 0 42 1 2 bicycle 10 10 11 5 27 4 13 20 baby 0 0 0 63 8 7 16 6 mountain 15 10 7 43 2 19 1 3 sweet_pepper 29 0 0 0 0 27 25 19 orchid 5 0 1 31 0 7 53 3 sea 2 12 64 5 7 2 0 8 skunk 0 0 0 1 79 19 0 1 oak_tree 96 0 0 0 2 2 0 0 squirrel 1 12 0 2 7 78 0 0 ray 10 23 21 9 14 12 1 10 bottle 19 1 1 1 13 32 5 28 pickup_truck 7 6 15 16 12 14 28 2 keyboard 5 13 9 46 17 4 0 6 lion 0 3 0 2 1 94 0 0 clock 1 2 15 15 15 41 8 3 trout 30 10 4 10 2 28 4 12 orange 0 0 0 0 0 98 2 0 woman 0 0 0 36 49 14 0 1 shark 8 24 29 20 8 7 1 3 sunflower 1 0 0 1 0 96 2 0 pine_tree 80 2 0 3 13 1 0 1 snake 21 4 4 0 18 23 11 19 elephant 0 73 0 1 25 1 0 0 possum 0 20 3 10 6 58 0 3