Better May Not Be Fairer: A Study on Subgroup Discrepancy
in Image Classification
Abstract
In this paper, we provide 20,000 non-trivial human annotations on popular datasets as a first step to bridge gap to studying how natural semantic spurious features affect image classification, as prior works often study datasets mixing low-level features due to limitations in accessing realistic datasets. We investigate how natural background colors play a role as spurious features by annotating the test sets of CIFAR10 and CIFAR100 into subgroups based on the background color of each image. We name our datasets CIFAR10-B and CIFAR100-B111Dataset is released at https://github.com/charismaticchiu/Better-May-Not-Be-Fairer-A-Study-Study-on-Subgroup-Discrepancy-in-Image-Classification and integrate them with CIFAR-Cs.
We find that overall human-level accuracy does not guarantee consistent subgroup performances, and the phenomenon remains even on models pre-trained on ImageNet or after data augmentation (DA). To alleviate this issue, we propose FlowAug, a semantic DA that leverages decoupled semantic representations captured by a pre-trained generative flow. Experimental results show that FlowAug achieves more consistent subgroup results than other types of DA methods on CIFAR10/100 and on CIFAR10/100-C. Additionally, it shows better generalization performance.
Furthermore, we propose a generic metric, MacroStd, for studying model robustness to spurious correlations, where we take a macro average on the weighted standard deviations across different classes. We show MacroStd being more predictive of better performances; per our metric, FlowAug demonstrates improvements on subgroup discrepancy. Although this metric is proposed to study our curated datasets, it applies to all datasets that have subgroups or subclasses. Lastly, we also show superior out-of-distribution results on CIFAR10.1.
1 Introduction
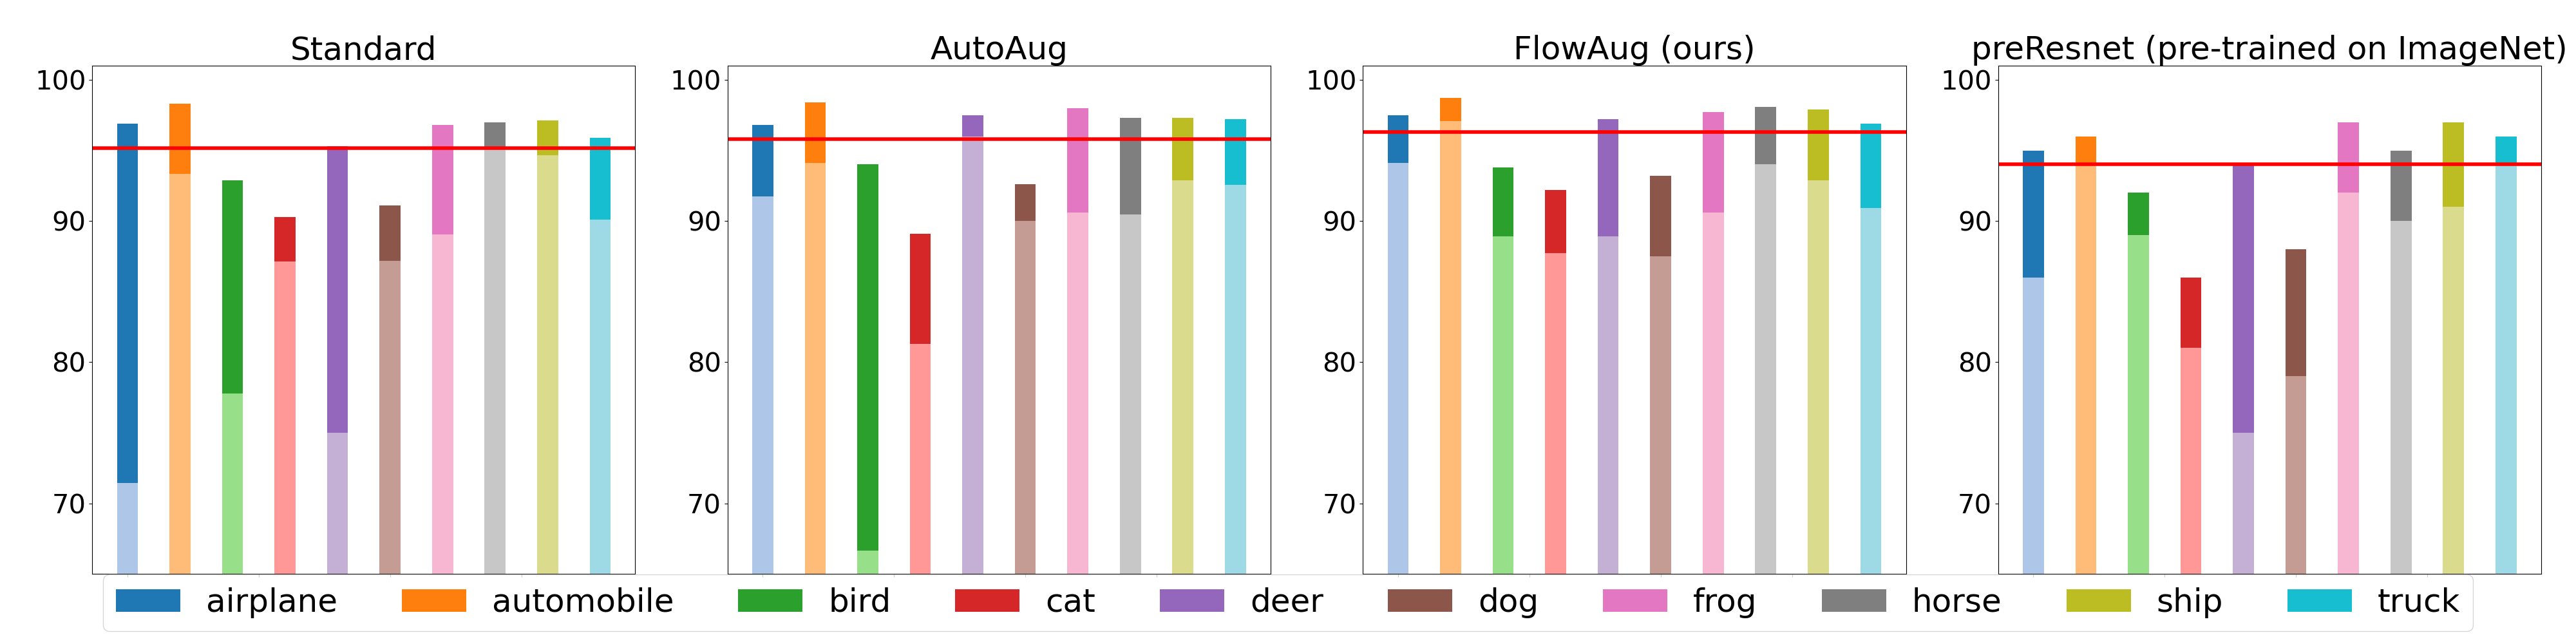
Deep neural networks (DNNs, e.g., [25, 19]), properly trained via empirical risk minimization (ERM), have been demonstrated to significantly improve benchmark performances in a wide range of application domains. However, minimizing empirical risk over finite or biased datasets often results in models latching on to spurious correlations that do not show a robust relationship between the input data and output labels. Moreover, benchmark evaluations based solely on average accuracy may overlook these critical issues. For instance, Fig. 1 shows that on CIFAR10, even though a standard ERM model reaches human-level test accuracy (red line), if we dive deeper into each class and compute their respective worst test accuracy stratified by background colors, they are inconsistent across the ten classes and the degradation from total accuracy is huge (black line) for some. Such inconsistency and discrepancy have huge real-world implications, suggesting DNN models may make biased decisions against or in favor of specific spurious factors, such as certain background colors.
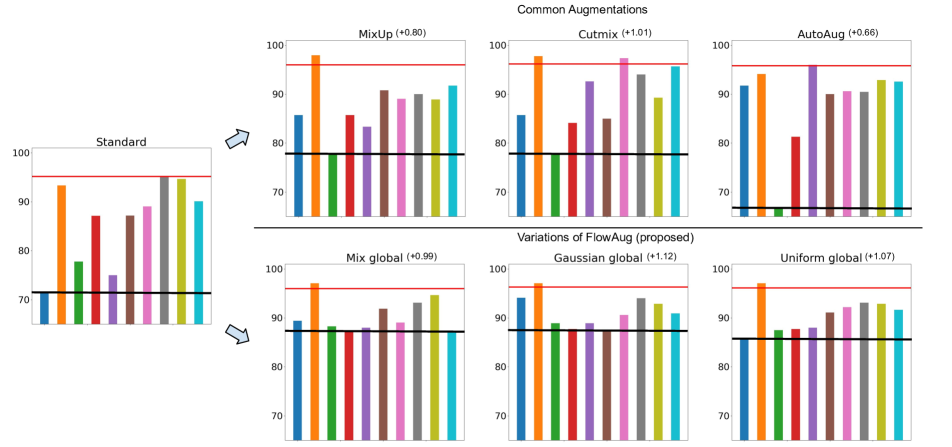
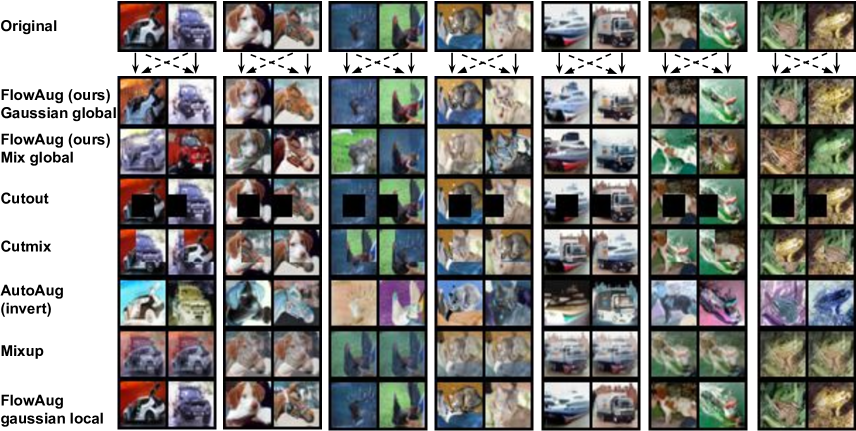
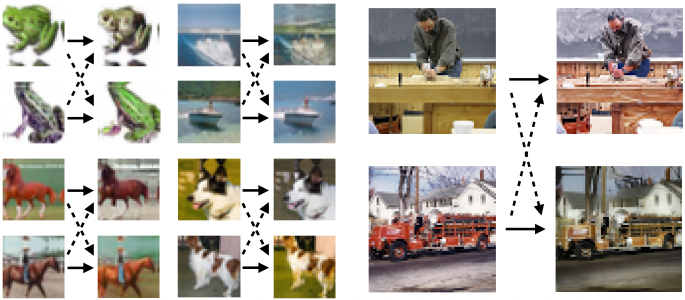
Researchers have been working in different directions to understand the effect of spurious correlations, including model over-parameterization [35], causality [1] and information theory [27, 53]. Various techniques have emerged over the years to address this challenge, among which DA [41] has stood out for its simplicity and effectiveness. DA shows better generalization results in various machine learning tasks than other approaches [52, 50, 47, 18, 46, 39]. These augmentation methods, however, are often based on heuristic and coarse image processing techniques such as flipping, rotating, blurring, or manipulating images by mixing attributes from other inputs [52, 50, 11, 21] (Fig. 2); therefore, they can only address limited aspects of spurious correlations, for which we will show an example in § 2. To address this limitation, instead of mixing low-level features, we seek to augment the training set by learning semantic deep representations and then using them to generate new images.


In this paper, as the very first step towards comprehensive evaluation of subgroup performance against semantically meaningful and realistic spurious correlations in image classification, we conduct a case study experiment to investigate background colors as spurious features (§2), for their commonality in image classification and immediate implications for trustworthiness [34]. To directly quantify the results, we annotated the test data of CIFAR10 and CIFAR100 into subgroups based on natural image background colors (see Fig. 3), yielding CIFAR10-Background and CIFAR100-Background. To the best of our knowledge, our datasets are two of the only human-annotated benchmark datasets with a natural semantic bias. We argue that the background color bias should be a necessary spurious correlation for future studies on robustness to benchmark on and so our work can facilitate future works to benchmark their capabilities on reducing learning spurious factors. Equipped with our datasets, we can investigate the reliance on background color of deep neural models in a multi-class multi-subgroup setup.
We reveal that even though standard DNNs have achieved human-level accuracy in image classification tasks, the performances fluctuate across different subgroups. This phenomenon demonstrates the reliance on background colors as spurious features. Moreover, applying some popular DA methods or pre-training on larger dataset such as ImageNet do not prevent the models from producing uneven accuracies across subgroups, as shown in Fig. 1 & 5, which further shows that low-level feature manipulations or brute-force pre-training are not sufficient to address spurious correlations and better methods are needed. To quantify our observations, we propose MacroStd, a metric to quantify subgroup performance discrepancy and imply the reliance on spurious correlations (§ 3.4).
To enable semantic data augmentations and address the issue of uneven accuracies, we propose FlowAug, a novel DA method which is capable of manipulating images semantically via decoupled representations learned from invertible generative flows [28] (§3). Concretely, our deep generative augmentation approach incorporates a novel flow-based generative model that encourages disentanglement of local and global representations from images, which arguably correspond to the image “style” and “content” [15, 54], respectively. By operating on the global representation that is isolated with the image class label, FlowAug semantically creates new images for DA.
More consistent performance across subgroups demonstrates the effectiveness of FlowAug. Also, we integrate our CIFAR-Bs with CIFAR-Cs [20] for broader out-of-distribution (OOD) evaluations and observe similar consistent subgroup performances. Furthermore, though not our main foci, we also find that superior experimental results on various in-distribution (ID) and OOD benchmarks, including CIFAR10, CIFAR100 [23], CIFAR10.1[33, 42] bolster our belief that low-level manipulations or brute-force pre-training are not sufficient.
To summarize, our contributions are four-fold,
-
•
We curate 20,000 human-annotated labels and two CIFAR-B datasets that reveal the subgroup discrepancy phenomenon and allow us to (1) study semantically meaningful and realistic spurious correlations in a multi-class multi-subgroup setup, and (2) integrate with CIFAR-C for OOD evaluations.
-
•
We propose FlowAug, a novel augmentation method that leverages “expert knowledge” of the deep generative model to change semantic attributes of images and empirically shown to reduce subgroup discrepancy.
-
•
We propose a generic metric that captures the subgroup discrepancy phenomenon of ERM and common DA methods and measures the sensitivity of model performances to spurious correlations, and demonstrate FlowAug’s effectiveness in this regard.
-
•
As an additional benefit, we conduct experiments on CIFAR10/100 and CIFAR10.1 and show FlowAug can further provide superior performances on ID and OOD datasets.


2 A Motivating Example of Subgroup
Discrepancy
We investigate background color as the spurious correlation with our CIFAR10-B (§ 3.2) by first training a standard Resnet18 for 250 epochs with weight decay , initial learning rate 0.1 and learning rate decay at [100, 150] epochs by a factor of 0.1. We observe significant performance degradation in the subgroups of some classes, for example class “airplane,” “bird” and “deer” (Fig. 5 (left)). Moreover, after applying DAs such as AutoAug [9], the same phenomenon remains, for instance observe the “bird” class in the mid-left plot in Fig. 5. More surprisingly, even after we fine-tune Resnet18 pre-trained on ImageNet (preResnet) with similar protocol to [22], the degradation continues to exist (Fig. 5 (right)).
In summary, though a Resnet model with or without popular DAs achieve more than 90% class accuracies, their respective background subgroup performances can be surprisingly low. This phenomenon, which we call “subgroup discrepancy” or “in-class variability,” shows that background colors play a role in the performance of a standard DNN model and constitute spurious correlations; otherwise, the performances should be relatively consistent. This triggers our interest in mitigating the performance variability in subgroups, i.e. the reliance on background attributes. And we show in Fig. 1 & Fig. 5 that using FlowAug achieves more consistent subgroup results.
Furthermore, fine-tuning model pre-trained on larger benchmark such as ImageNet does not reduce subgroup discrepancy even on dataset like CIFAR, so we reasonably conjecture that this phenomenon will exist in other datasets.
3 Methods
In principle, DA takes the form of a particular set of transformation functions where each transforms an input in a particular fashion. Moreover, an expert may have the knowledge to design label-preserving transformations in a way that ’s leave the label unchanged.
After the transformations, the dataset will be augmented to , where is the number of times is transformed. From a frequentist point of view, we can apply any MLE algorithm to the augmented dataset, and the hope is that the learned model can better estimate the true model since we have more data.
In this section, we discuss our generative flow model, present our datasets CIFAR10-B and CIFAR100-B for studying spurious correlation, and detail our augmentation algorithms. Lastly, we introduce two metrics to quantify the effect of spurious correlation.
3.1 Decoupling representations with Flow-based Generative Models
Prior work has shown that embedding a invertible normalizing flow model as a decoder in a variational autoencoder (VAE) can decouple global () and local () representations of images in an unsupervised fashion [28], and can switch the decoupled representations of different images to alter their semantic attributes (see Appendix). We presume the global information corresponds to the style of the image and local leans toward the content in the neural style transfer literature [15, 54]. In this work, we apply the flow model to encode images into global and local representations and also decode them back to image space like VAEs,
| (1) |
where , and are neural networks learned from the data, and . is a -dimensional vector where is the dimension of the latent space and the size of is the same as the input image .
We further hypothesize that includes information on colors or more, which are spurious to the ground truth, and bears information about the shape, object, etc., which are more indicative of the labels. In § 5.1, we will do an ablation study to attest this hypothesis.
3.2 Datasets quantifying spurious background correlations
We curate CIFAR-10-B & CIFAR-100-B to identify and study spurious information in images, and we choose to label the major background colors of CIFAR10 and CIFAR100 validation sets. By learning the subgroup performances, we can measure the sensitivity of a model to different spuriously correlated colors. As shown in Fig. 3, we manually label the background colors of CIFAR10 and CIFAR100, and split them into eight separate groups. We understand people have different criteria toward determining the background color; therefore, we provide our four main labeling principles as follows,
-
1.
We label the color that has the most coverage around the object. In Fig. 4 (a), one may argue the red patch or blue ocean has taken up most of the image in the background, but the “baby” is surrounded completely by the green area, and the “flatfish” is in the red area.
-
2.
When two colors take almost the same coverage other than the object, we choose the color that appears further away. In Fig. 4 (b), black is farther away from the “bowl”, and so is the blue sky for the “can”.
-
3.
When two colors take almost the same coverage and appear to be at a similar distance, we make a judgment call on the color that has more coverage (Fig. 4 (c)).
-
4.
When multiple colors appear in the background and none is significantly larger than the rest (Fig. 4 (d)), or when the object takes up almost all the space in the picture so that we cannot judge the color in the background, or when the perceived color does not belong to our categories, we put it in the “others” category.
3.3 Algorithms
Knowing properties of and discussed in §3.1, we design two families of transformations to operate on global : (1) : we add perturbations to , and (2) : we interpolate global information extracted from different images. The over-arching rationale behind is: by equipping models with label-preserving images under diverse environments (i.e., backgrounds), the model should learn more robust correlations[1]. The second and third row of Fig. 2 demonstrate our method ability in this regard.
More specifically, in we add truncated Gaussian perturbation to ,
instead of a Gaussian noise, since a Gaussian noise may sample large numbers that potentially destroy the decoding of . For , we decode two random images to retrieve and then interpolate and stochastically with a parameter drawn from a Beta distribution,
We train our models with the following learning objectives: (1) training only with transformed images from or instead of the original examples, (2) in addition to transformed images, adding the original dataset, and (3) combining the two algorithms and the original dataset,
| (2) |
| (3) |
| (4) |
3.4 Quantifying subgroup discrepancy
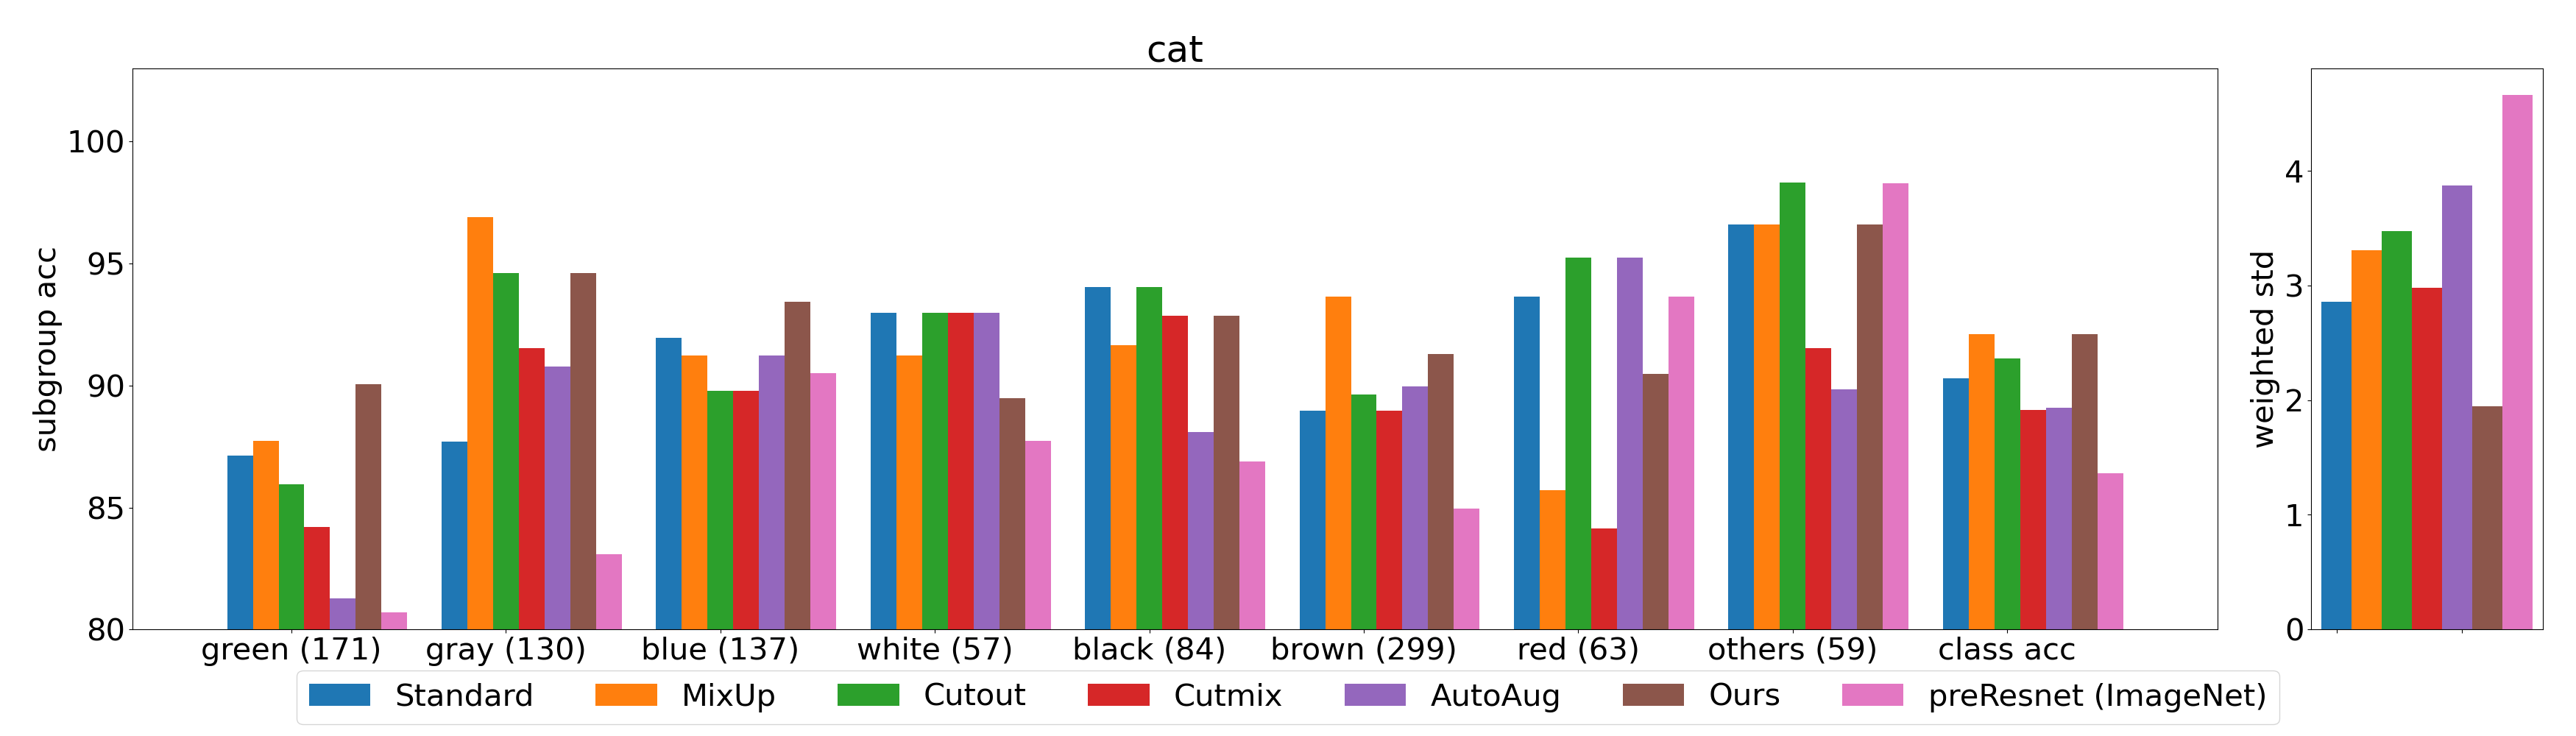
To quantify the reliance on background attributes, we first propose using the weighted standard deviation,
| (5) |
where ’s are the subgroup accuracies, the weighted mean, ’s the weights determined by the number of examples in the subgroup, the number of groups. Weighted Std can be applied to subgroups performances within a class (as in Fig. 6), and across all accuracies from different classes and subgroups.
The second metric we propose is macro standard deviation (MacroStd),
| (6) |
where is the weighted standard deviation for each class, and is the number of classes.
MacroStd treats each class equally and measures the sensitivity of a model performance across classes. If MacroStd is high, this suggests the model has imbalanced performances across classes and also could be affected by background colors. We conduct a correlation analysis to show our metric is a better indicator for both sensitivity and accuracy (see Appendix).
4 Experiments
In this section, we discuss our empirical results on the study of spurious correlation with our CIFAR10-B & CIFAR100-B and their integration with OOD datasets such as CIFAR10-C and CIFAR100-C. Secondly, although not our primary foci, we present ID and OOD image classification experiments on three datasets — CIFAR10, CIFAR100, CIFAR10.1 — to test the generalization capabilities of applying FlowAug. Lastly, we analyze and provide intuitions on how our approach is superior. Furthermore, the comparing baselines and implementation details are provided.
Due to human resource limit, we are not able to scale labeling efforts to larger benchmark such as ImageNet, but our work has pinpointed critical issues in the subgroup discrepancy in image classification. And we reasonably believe the phenomenon will persist in other datasets given the result from preResnet (Fig. 5 (right)). In addition, a recent benchmark work [13] shows that CIFARs are not necessarily easier than ImageNet, which also validates our efforts.
4.1 Datasets
Other than our CIFAR10-B and CIFAR100-B that are based on CIFAR10 and CIFAR100 [23], we integrate them with CIFAR10-C & CIFAR100-C [20], which are benchmark datasets to model generalization abilities in the presence of 18 shallow corruptions including blurring, contrast, shift, etc. Finally, CIFAR10.1 [33] is a test set consists of 2000 images collected from TinyImages [42] and contains the same class labels as CIFAR10. Additionally, we include ImageNet-10 based on our labeling method and discuss the results in the Appendix.
4.2 Baselines
We compare our proposed method with four types of low-level DA methods (1) mixing by interpolations, (2) fill-in-with-blank, (3) mixing by fill-in-the-blank, (4) combinations of image manipulations. In our experiments, we compare with the best setups reported in their papers. We include more discussion on rationale behind the selecting the chosen baselines and additional comparisons with composite data augmentations such as AugMix and AugMax in the Appendix.
Mixup
[52] does linear interpolation on two random images and mix them as where , and the same applies to the label, .
Cutout
[11] randomly crops out a portion of an image and fills it with a specific color, and the label remains unchanged.
Cutmix
[50] crops out an area of image, but fills the area with a portion of the same size from another image. The label of the augmented image is adjusted according to the proportion of the area of two engaging examples.
Autoaug
[9] uses reinforcement learning to optimize a pre-defined set of policies, combinations of low-level image manipulation, and then learns the best policy for DA.
Standard
refers to the models trained on the original datasets, without using any DA methods.
4.3 Implementation Details
Generative models
We pre-train the normalizing flow models as in [28], and they achieve the negative log-likelihood scores in bits/dim (BPD) 3.27 and 3.31 on CIFAR10 and CIFAR100, respectively.
Hyperparameters
In Algorithm 1, we simply set and for the truncated Gaussian distribution. As for truncation , we empirically find that has an average maximum value around 4 and so we set . In Algorithm 2, we simply set and . For all models reported in Table 2, we train Resnet18 for 250 epochs with weight decay 0.0005. Also, the learning rate starts at 0.1 and is divided by 10 at [100, 150] epochs. For our learning objectives, we lightly fine-tune in Eq. (3) with values of , and in Eq. (4) with and . The generative flow models are trained on two NVIDIA A40 GPUs, while the Resnet18 are trained on one NVIDIA A40 GPU.
4.4 Empirical Results
MacroStd and WeightedStd
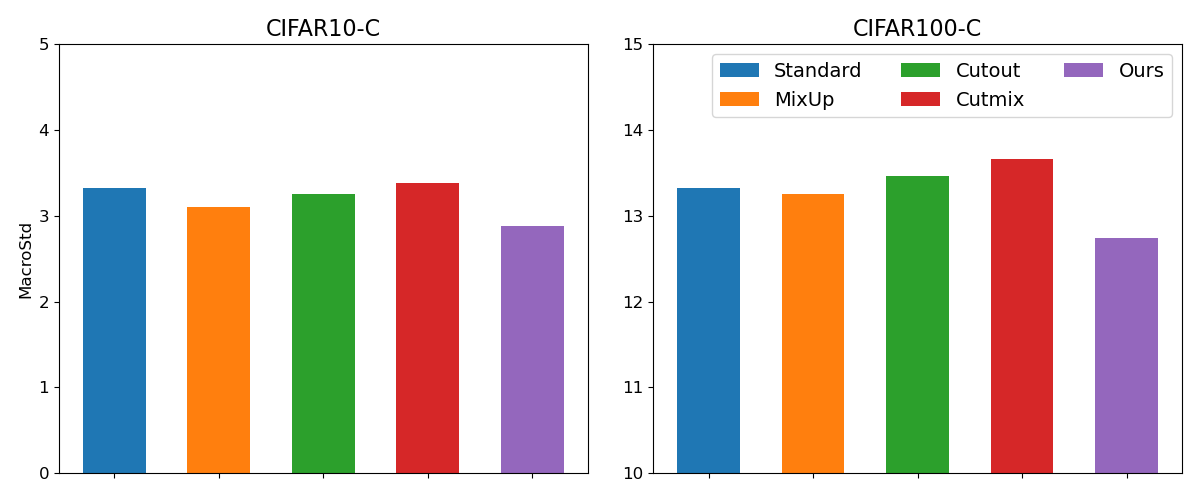
Table 1 reports the MacroStd and the weighted standard deviation of subgroup performances from the whole dataset. Our approach consistently has both lower MacroStd and lower WeightedStd over the baselines. Moreover, in Fig. 6, our approach also achieves lower WeightedStd at the class level. These results show evidence that our approach is less affected by the background colors and hence is more robust.
MacroStd Weighted Std CIFAR10 CIFAR100 CIFAR10 CIFAR100 Standard 2.24 12.24 3.45 16.44 Mixup 2.17 11.94 3.02 16.75 Cutout 1.91 12.45 2.94 16.52 Cutmix 1.91 12.62 3.34 16.87 AutoAug 2.11 11.74 3.54 16.30 Ours (Mix ) 1.99 11.73 2.92 15.96 + Std 1.81 12.49 2.76 16.76 Ours (Uniform on ) 1.83 12.17 2.98 16.57 + Std 1.81 11.59 3.26 15.95 + Mix 1.85 11.72 2.89 16.31 + Std + Mix 1.86 11.23 3.12 16.01 Ours (Trunc Gaussian on ) 1.91 12.00 2.82 16.23 + Std 1.65 11.55 3.08 16.02 + Mix 1.89 11.95 3.09 16.35 + Std + Mix 1.66 11.78 2.71 15.92 Trunc Gaussian on 1.94 12.68 2.81 16.70 Mix 2.50 13.27 4.21 18.46
CIFAR10-C and CIFAR100-C
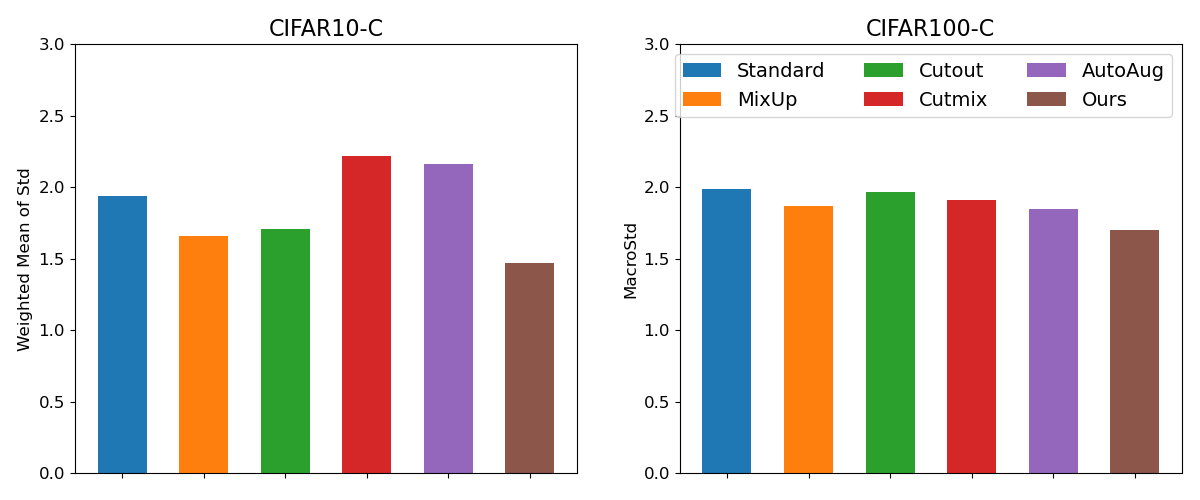
Another benefit of our datasets is the compatibility with CIFAR-Cs. Together with CIFAR-Cs we are able to evaluate the subgroup discrepancy phenomenon in an OOD setting. Fig. 7 shows that FlowAug has reduced subgroup discrepancy than other DAs. We exclude AutoAug in Fig. 7 because it contains policies resembling some corruption types of CIFAR-C so we deem it not a fair comparison.
CIFAR10 and CIFAR100
Although ID and OOD generalization performances are not our main foci, our FlowAug demonstrates significant gains on CIFAR10 and CIFAR100 and we report our experimental results in Table 2. Algorithm 1 itself achieves results better than all the baselines. Algorithm 2 also performs better than the Standard baseline and is competitive with other methods. When Algorithm 1 and 2 are combined or also add the Standard loss (Eq. (4)), they can further enhance the performances.
In Algorithm 1, we do an ablation study with uniform distribution in Sec. 5.2. The best improvements on CIFAR10 and CIFAR100 are at 1.42% and 1.47% respectively. The superior results of our deep generative augmentation approach with decoupled representations have shown greater generalization potential.
CIFAR-10 CIFAR10.1 CIFAR-100 best / last best / last best / last Standard 95.16 / 95.00 88.70 / 88.25 78.52 / 78.52 Mixup 95.96 / 95.82 89.75 / 88.85 77.91 / 76.99 Cutout 95.94 / 95.60 90.40 / 89.70 78.21 / 78.00 Cutmix 96.17 / 96.04 90.05 / 90.20 78.87 / 78.42 AutoAug 95.82 / 95.47 89.85 / 89.80 78.57 / 78.12 Ours (Mix ) 95.98 / 95.59 90.35 / 89.30 78.58 / 78.07 + Std 96.15 / 95.73 90.25 / 90.20 78.96 / 78.33 Ours (Uniform on ) 96.12 / 96.11 90.35 / 90.45 79.45 / 79.24 + Std 96.28 / 96.14 90.95 / 91.15 79.68 / 79.67 + Mix 96.58 / 96.37 91.40 / 91.65 79.68 / 79.52 + Std + Mix 96.44 / 96.31 91.05 / 91.00 79.68 / 79.51 Ours (Trunc Gaussian on ) 96.23 / 96.23 90.15 / 90.25 79.30 / 79.04 + Std 96.22 / 96.04 90.55 / 89.80 79.62 / 79.62 + Mix 96.49 / 96.42 90.05 / 90.25 79.51 / 79.18 + Std + Mix 96.53 / 96.29 90.75 / 91.20 79.99 / 79.54 Trunc Gaussian on 95.70 / 95.45 88.70 / 89.25 78.50 / 78.41 Mix 94.22 / 93.43 87.55 / 85.50 74.05 / 71.42
CIFAR10.1
On another OOD dataset CIFAR10.1, we also observe significant improvements in performances from FlowAug over the baselines (up to +1% better than the best of all five baselines). These results again demonstrate that FlowAug is more robust and has better generalizability.
Our CIFAR10.1, CIFAR10-C, and CIFAR100-C experiments demonstrate FlowAug’s generalizability to OOD data and validate our approach of using deep decoupled representations for DA.
4.5 Analysis
Our two FlowAug algorithms 1 & 2 both improve over the baselines, and combining the two shows even superior results. Conceptually, we know that the flow model can map to a Gaussian prior distribution (cf. Eq. 1), but not necessarily all the points in the Gaussian distribution would follow the reverse to a realistic image. Then intuitively, given that come from real images, Algorithm 2’s interpolating of can be interpreted as finding an optimal point between two proven optimal points in the space, i.e., Algorithm 2 explores the Gaussian space in an efficient way.
On the other hand, adding a sampled perturbation to as in Algorithm 1 can stretch the search space to outside of the Gaussian, which brings good performances. It also explains why a combined approach such as Eq. 4 can generally achieve superior performances over the rest since Algorithm 1 and 2 can be complementary.
5 Ablation Studies
To further study global and local representations, we can make some design choices applied to and . In § 3, we assume and carry information about the background and ground truth respectively, and we want to test the assumptions and the generality of Algorithm 1.
5.1 Perturbing Local () or Global ()?
§ 4 has shown that perturbing improves generalization and the robustness of models. On the other hand, we can also decode realistic images by perturbing (Fig. 2(h)), which we assume affects the prediction. We apply Algorithm 1 & 2 with the same parameters on , and the results deteriorate on all datasets by at least 0.5% and up to 7%, suggesting that our assumption about ’s correspondence to the ground truth label is reasonable.
5.2 Does perturbation type matter? A case study of Gaussian vs Uniform distributions
Algorithm 1 uses a truncated Gaussian perturbation, but in fact, we can also add noise sampled from other distributions, such as a Uniform perturbation. To have about the same amount of probability density in the same range as , we choose for our study. Table 2 shows that adding uniform noise is comparable to adding truncated Gaussian, and when combined with algorithm 2 and(or) Standard, the improvements are top-2, achieving over a 1% gain on CIFAR10 and CIFAR100, and more than a 2% gain on CIFAR10.1. This study suggests the generalization capability of FlowAug on symmetric noise distributions.
5.3 Can FlowAug be composited with another method?
Composite DA sometimes offer additional benefit to generalization [45, 21, 44]. Thus, we investigate if FlowAug possesses the flexibility of being composited and run an additional experiment combining our simplest Algorithm 1 variation and Cutmix. Tab.3 shows combining FlowAug and Cutmix further mitigates subgroup degradation and also enhances generalization. In addition, on CIFAR100, the test accuracy is better than any methods using Resnet18 to our knowledge. This experiment showcases the possibility of chaining FlowAug with other methods for attaining “SOTA” performances in both mitigating bias or enhancing generalization. We compare FlowAug with other recent composite DA such as AugMix, AugMax in the Appendix.
CIFAR10 MacroStd W-Std CIFAR100 MacroStd W-Std Standard 95.16 2.24 3.45 78.52 12.24 16.44 Cutmix 96.17 1.91 3.34 78.87 12.62 16.87 Ours-alg1 96.23 1.83 2.98 79.45 12.17 16.57 Ours-alg1+Cutmix 96.34 1.65 2.91 81.57 11.20 15.34
6 Correlation Analysis on MacroStd and Performances
WeightedStd is the most common measure to quantify sensitivity in statistics. However, we want to justify our MacroStd to be a more suitable metric in quantifying subgroup degradation. We perform correlation analyses between accuracy and MacroStd(ours)/WeightedStd. The statistics are summarized in Table 4, and on both CIFAR10 and CIFAR10.1, our metric is a better indicator for sensitivity and accuracy (coefficients the lower the better), which validates the novelty of our metric.
CIFAR-10 CIFAR10.1 best / last best / last MacroStd (ours) -0.89 / -0.85 -0.83 / -0.88 WeightedStd -0.78 / -0.77 -0.62 / -0.70
7 Related Works
Representation Learning.
Deep learning models’ success is generally attributed to their ability to learn complex and meaningful representations [3], and most attempts to learning quality representations require certain inductive biases, for instance, space invariance of CNNs [26]. Of particular interest to our work, generative models such as VAEs [5, 31, 7, 40] enforce constraints such as independent multivariate Gaussain in the latent layers to learn disentangled representations. Our work leverages a model that learns two decoupled representations instead of the factorial ones.
Data Augmentation.
DA often helps achieve improved generalization. One line of approach performs low-level basic image operations such as mixing examples [52], or random erasing [50, 11], etc. Another approach uses reinforcement learning to learn the best policy of basic image operations [9, 10]. [30] use causal inference to guide their method and add interventions during the generation process. Our work uses decoupled global representations to isolate spurious correlations and then learn robust correlations to the objects. We refer readers to [14] for recent surveys.
Robustness.
Robustness in DNNs has drawn the attention of the community largely since [17, 24]. Multiple lines of research were proposed to study robustness, including using Distributionally Robust Optimization [12, 2], Adversarial Training [29, 6, 36, 49], and certifiable bounds [51, 8]. [1] proposed a scenario where representations learned should be robust in different environments, and [37, 38] suggests that learning Causal Representations can be an ultimate approach to robustness in deep learning. [16] studied the effect of shape and texture to CNNs. Our work is in line with the idea of [1] and studies color as a spurious factor orthogonal to concept of texture [4].
8 Conclusion and Future Work
In this work, we contributed 20,000 non-trivial human annotations in two datasets to reveal the phenomenon of subgroup discrepancy in various (pre)training techniques, and proposed a semantic DA method, FlowAug which trains more robust models evaluated on CIFARs and CIFAR-Cs. Additionally, we showed the potential of using disentangled representations for DA by achieving superior generalization performances on both ID and OOD datasets.
We believe our work serves as a leap forward in studies of fairness, robustness, and even causality in DNNs, as we can use CIFAR-Bs to quantify the effect of a hidden bias and we learn that high-level DA is suited to achieve consistent predictions. Last but not least, due to human and computing resource limits, we are not able to scale the labeling effort nor the experiments to larger datasets such as ImageNet, but our results on ImageNet-10 and CIFARs have shown it is an impactful direction and should further enhance the performances.
References
- [1] Martín Arjovsky, Léon Bottou, Ishaan Gulrajani, and David Lopez-Paz. Invariant risk minimization. ArXiv, abs/1907.02893, 2019.
- [2] Aharon Ben-Tal, Dick den Hertog, Anja De Waegenaere, Bertrand Melenberg, and Gijs Rennen. Robust solutions of optimization problems affected by uncertain probabilities. Management Science, 59(2):341–357, 2013.
- [3] Yoshua Bengio, Aaron Courville, and Pascal Vincent. Representation learning: A review and new perspectives. IEEE Transactions on Pattern Analysis and Machine Intelligence, 35(8):1798–1828, 2013.
- [4] Francesco Bianconi, Antonio Fernández, Fabrizio Smeraldi, and Giulia Pascoletti. Colour and texture descriptors for visual recognition: A historical overview. Journal of Imaging, 7(11):245, 2021.
- [5] Christopher P. Burgess, Irina Higgins, Arka Pal, Loïc Matthey, Nicholas Watters, Guillaume Desjardins, and Alexander Lerchner. Understanding disentangling in -vae. arXiv: Machine Learning, 2018.
- [6] Jian Chen, Xuxin Zhang, Rui Zhang, Chen Wang, and Ling Liu. De-pois: An attack-agnostic defense against data poisoning attacks. In IEEE Transactions on Information Forensics and Security, 2021.
- [7] Tian Qi Chen, Xuechen Li, Roger B. Grosse, and David Kristjanson Duvenaud. Isolating sources of disentanglement in variational autoencoders. In NeurIPS, 2018.
- [8] Jeremy Cohen, Elan Rosenfeld, and Zico Kolter. Certified adversarial robustness via randomized smoothing. In Proceedings of the 36th International Conference on Machine Learning, 2019.
- [9] Ekin Dogus Cubuk, Barret Zoph, Dandelion Mané, Vijay Vasudevan, and Quoc V. Le. Autoaugment: Learning augmentation policies from data. ArXiv, abs/1805.09501, 2018.
- [10] Ekin Dogus Cubuk, Barret Zoph, Jonathon Shlens, and Quoc V. Le. Randaugment: Practical automated data augmentation with a reduced search space. 2020 IEEE/CVF Conference on Computer Vision and Pattern Recognition Workshops (CVPRW), pages 3008–3017, 2020.
- [11] Terrance Devries and Graham W. Taylor. Improved regularization of convolutional neural networks with cutout. ArXiv, abs/1708.04552, 2017.
- [12] John Duchi and Hongseok Namkoong. Learning models with uniform performance via distributionally robust optimization. ArXiv, 2020.
- [13] Yang et. al. OpenOOD: Benchmarking generalized out-of-distribution detection. In NeurIPS, 2022.
- [14] Steven Y. Feng, Varun Gangal, Jason Wei, Sarath Chandar, Soroush Vosoughi, Teruko Mitamura, and Eduard H. Hovy. A survey of data augmentation approaches for nlp. ArXiv, abs/2105.03075, 2021.
- [15] Leon A. Gatys, Alexander S. Ecker, and Matthias Bethge. A neural algorithm of artistic style. ArXiv, abs/1508.06576, 2015.
- [16] Robert Geirhos, Patricia Rubisch, Claudio Michaelis, Matthias Bethge, Felix A Wichmann, and Wieland Brendel. Imagenet-trained cnns are biased towards texture; increasing shape bias improves accuracy and robustness. arXiv preprint arXiv:1811.12231, 2018.
- [17] I. Goodfellow, Jonathon Shlens, and Christian Szegedy. Explaining and harnessing adversarial examples. In ICLR, volume abs/1412.6572, 2015.
- [18] Hongyu Guo, Yongyi Mao, and Richong Zhang. Augmenting data with mixup for sentence classification: An empirical study. ArXiv, abs/1905.08941, 2019.
- [19] Kaiming He, X. Zhang, Shaoqing Ren, and Jian Sun. Deep residual learning for image recognition. 2016 IEEE Conference on Computer Vision and Pattern Recognition (CVPR), pages 770–778, 2016.
- [20] Dan Hendrycks and Thomas Dietterich. Benchmarking neural network robustness to common corruptions and perturbations. Proceedings of the International Conference on Learning Representations, 2019.
- [21] Dan Hendrycks, Norman Mu, Ekin Dogus Cubuk, Barret Zoph, Justin Gilmer, and Balaji Lakshminarayanan. Augmix: A simple data processing method to improve robustness and uncertainty. ArXiv, abs/1912.02781, 2020.
- [22] Alexander Kolesnikov, Lucas Beyer, Xiaohua Zhai, Joan Puigcerver, Jessica Yung, Sylvain Gelly, and Neil Houlsby. Big transfer (bit): General visual representation learning, 2019.
- [23] Alex Krizhevsky. Learning multiple layers of features from tiny images. 2009.
- [24] Alexey Kurakin, I. Goodfellow, and S. Bengio. Adversarial machine learning at scale. ArXiv, abs/1611.01236, 2017.
- [25] Yann LeCun, Yoshua Bengio, and Geoffrey Hinton. Deep learning. nature, 521(7553):436–444, 2015.
- [26] Y. Lecun, L. Bottou, Y. Bengio, and P. Haffner. Gradient-based learning applied to document recognition. Proceedings of the IEEE, 86(11):2278–2324, 1998.
- [27] Charles Lovering, Rohan Jha, Tal Linzen, and Ellie Pavlick. Predicting inductive biases of pre-trained models. In International Conference on Learning Representations, 2020.
- [28] Xuezhe Ma, Xiang Kong, Shanghang Zhang, and Eduard Hovy. Decoupling global and local representations via invertible generative flows. In Proceedings of the 9th International Conference on Learning Representations (ICLR-2021), May 2021.
- [29] A. Madry, Aleksandar Makelov, Ludwig Schmidt, D. Tsipras, and Adrian Vladu. Towards deep learning models resistant to adversarial attacks. ArXiv, abs/1706.06083, 2018.
- [30] Chengzhi Mao, Amogh Gupta, Augustine Cha, Hongya Wang, Junfeng Yang, and Carl Vondrick. Generative interventions for causal learning. 2021 IEEE/CVF Conference on Computer Vision and Pattern Recognition (CVPR), pages 3946–3955, 2021.
- [31] Emile Mathieu, Tom Rainforth, Siddharth Narayanaswamy, and Yee Whye Teh. Disentangling disentanglement. ArXiv, abs/1812.02833, 2018.
- [32] Curtis G Northcutt, Anish Athalye, and Jonas Mueller. Pervasive label errors in test sets destabilize machine learning benchmarks. arXiv preprint arXiv:2103.14749, 2021.
- [33] Benjamin Recht, Rebecca Roelofs, Ludwig Schmidt, and Vaishaal Shankar. Do cifar-10 classifiers generalize to cifar-10? 2018. https://arxiv.org/abs/1806.00451.
- [34] Marco Tulio Ribeiro, Sameer Singh, and Carlos Guestrin. ”why should i trust you?”: Explaining the predictions of any classifier. In Proceedings of the 22nd ACM SIGKDD International Conference on Knowledge Discovery and Data Mining, KDD ’16, page 1135–1144, New York, NY, USA, 2016. Association for Computing Machinery.
- [35] Shiori Sagawa, Aditi Raghunathan, Pang Wei Koh, and Percy Liang. An investigation of why overparameterization exacerbates spurious correlations. In International Conference on Machine Learning, pages 8346–8356. PMLR, 2020.
- [36] Hadi Salman, Mingjie Sun, Greg Yang, Ashish Kapoor, and J. Zico Kolter. Black-box smoothing: A provable defense for pretrained classifiers. In NeurIPS, volume abs/2003.01908, 2020.
- [37] Bernhard Scholkopf, Francesco Locatello, Stefan Bauer, Nan Rosemary Ke, Nal Kalchbrenner, Anirudh Goyal, and Yoshua Bengio. Toward causal representation learning. Proceedings of the IEEE, 109:612–634, 2021.
- [38] Bernhard Scholkopf and Julius von Kügelgen. From statistical to causal learning. ArXiv, abs/2204.00607, 2022.
- [39] Dinghan Shen, Ming Zheng, Yelong Shen, Yanru Qu, and Weizhu Chen. A simple but tough-to-beat data augmentation approach for natural language understanding and generation. ArXiv, abs/2009.13818, 2020.
- [40] Zheng sheng Ding, Yifan Xu, Weijian Xu, Gaurav Parmar, Yang Yang, Max Welling, and Zhuowen Tu. Guided variational autoencoder for disentanglement learning. 2020 IEEE/CVF Conference on Computer Vision and Pattern Recognition (CVPR), pages 7917–7926, 2020.
- [41] Connor Shorten and Taghi M Khoshgoftaar. A survey on image data augmentation for deep learning. Journal of big data, 6(1):1–48, 2019.
- [42] Antonio Torralba, Rob Fergus, and William T. Freeman. 80 million tiny images: A large data set for nonparametric object and scene recognition. IEEE Transactions on Pattern Analysis and Machine Intelligence, 30(11):1958–1970, 2008.
- [43] Hugo Touvron, Matthieu Cord, Matthijs Douze, Francisco Massa, Alexandre Sablayrolles, and Hervé Jégou. Training data-efficient image transformers & distillation through attention. In International conference on machine learning, pages 10347–10357. PMLR, 2021.
- [44] Vasilis Vryniotis. How to train state-of-the-art models using torchvision’s latest primitives, 2021.
- [45] Haotao Wang, Chaowei Xiao, Jean Kossaifi, Zhiding Yu, Anima Anandkumar, and Zhangyang Wang. Augmax: Adversarial composition of random augmentations for robust training. Advances in neural information processing systems, 34:237–250, 2021.
- [46] Luyu Wang and Aäron van den Oord. Multi-format contrastive learning of audio representations. ArXiv, abs/2103.06508, 2021.
- [47] Jason Wei and Kai Zou. EDA: Easy data augmentation techniques for boosting performance on text classification tasks. In Proceedings of the 2019 Conference on Empirical Methods in Natural Language Processing and the 9th International Joint Conference on Natural Language Processing (EMNLP-IJCNLP), pages 6382–6388, Hong Kong, China, Nov. 2019. Association for Computational Linguistics.
- [48] Ross Wightman, Hugo Touvron, and Hervé Jégou. Resnet strikes back: An improved training procedure in timm, 2021.
- [49] Eric Wong, Frank Schmidt, Jan Hendrik Metzen, and J. Zico Kolter. Scaling provable adversarial defenses. In Advances in Neural Information Processing Systems, 2018.
- [50] Sangdoo Yun, Dongyoon Han, Seong Joon Oh, Sanghyuk Chun, Junsuk Choe, and Young Joon Yoo. Cutmix: Regularization strategy to train strong classifiers with localizable features. 2019 IEEE/CVF International Conference on Computer Vision (ICCV), pages 6022–6031, 2019.
- [51] Huan Zhang, Hongge Chen, Chaowei Xiao, Bo Li, Duane S. Boning, and Cho-Jui Hsieh. Towards stable and efficient training of verifiably robust neural networks. ArXiv, abs/1906.06316, 2019.
- [52] Hongyi Zhang, Moustapha Cissé, Yann Dauphin, and David Lopez-Paz. mixup: Beyond empirical risk minimization. ArXiv, abs/1710.09412, 2018.
- [53] Chunting Zhou, Xuezhe Ma, Paul Michel, and Graham Neubig. Examining and combating spurious features under distribution shift. In International Conference on Machine Learning, pages 12857–12867. PMLR, 2021.
- [54] Jun-Yan Zhu, Taesung Park, Phillip Isola, and Alexei A Efros. Unpaired image-to-image translation using cycle-consistent adversarial networkss. In Computer Vision (ICCV), 2017 IEEE International Conference on, 2017.
Appendix A CIFAR10-B Statistics
Classes Green Gray Blue White Black Brown Red Others cat 171 130 137 57 84 299 63 59 dog 271 90 124 39 81 297 58 40 truck 121 180 278 187 24 177 2 31 bird 453 58 179 32 32 237 0 9 airplane 85 112 609 81 7 102 4 0 ship 71 88 711 45 15 56 0 14 frog 417 64 75 56 49 238 15 86 horse 493 29 108 41 50 251 7 21 deer 604 27 99 8 25 227 4 6 automobile 177 262 147 130 34 230 15 5
Appendix B More discussion on chosen baselines and comparison to AugMix & AugMax
We choose the DAs that are strong and commonly studied in recent works such as [48, 43, 44]. PyTorch’s official “SOTA” training method [44] also uses the combinations of our chosen baselines along with other perfected hyperparameters such as longer training; however, we isolated each baseline to measure the individual contribution of a single method. In addition, we compare with two recent works AugMix and AugMax, which are recent methods evaluated on plain Resnet18, and our generalization results are superior, as per reported in [45] (see Tab.6-left). AugMix and AugMax are not a single method but a combinations of different ones and were designed for other robustness purposes. Lastly, we want to re-iterate that generalization performance is not our main focus but an additional benefit when reducing the model bias toward specific colors.
CIFAR10 CIFAR100 AugMix 95.79 78.23 AugMax 95.76 78.96 Ours 96.58 79.99 Acc. MacroStd W-Std Standard 91.80 9.57 11.17 Autoaug 93.40 8.84 9.99 Ours-Alg1 94.80 8.39 9.96
Appendix C ImageNet-10
We labeled ImageNet-10 and found similar subgroup degradation aspect on ImageNet, and our method can still mitigate the issue using standard training procedure without fine-tuning (Tab.6-right); therefore, we believe FlowAug will work on high-resolution/larger datasets
Appendix D Selection of Color Groups
While labeling the datasets, we add one color only if it has a couple of images. This prevents having many colors with 0 images. For example, in CIFAR10, classes like “bird” and “ship” do not contain images with a red background, but it has some presence in other classes, so we added red as a color group.
Appendix E Generalization on CIFAR10-C and CIFAR100-C
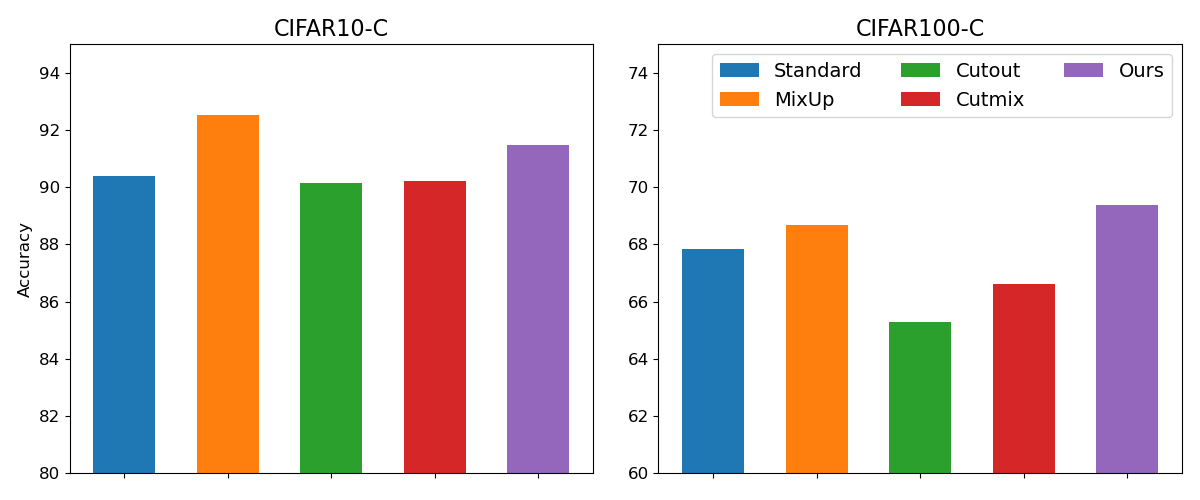
Aside from generalization on i.i.d. data, we are interested in FlowAug’s capabilities to generalize to out-of-domain (OOD) data, which is another aspect of robustness. We use models of the last epoch from Table 2 to test on CIFAR10-C and CIFAR100-C. Although FlowAug does not explicitly add corruptions such as various kinds of blurring, contrast and so on to training data, we observe comparable performances (Fig. 8) with augmentation methods that have corruption effects, such as MixUp, and FlowAug is better than Cutout and Cutmix (+1.35% and +1.26%, respectively).
Appendix F Switch Operation
Appendix G Label Quality
The background color labels are labeled by a person with an experienced computer vision background for consistency and are verified twice. As a quality check, two people with strong technical backgrounds checked 500 random images. The rate of agreement is 91.8 percent, and 5.4 percent of images that did not agree in the first round agree with the labels we used for experiments after discussion. The disagreement rate is smaller than the average error rate in modern datasets [32]. We will release the dataset and welcome the community to update the background labels.
Appendix H An Additional Protected Attribute
In this work, we studied color as a bias, and we can also study another protected attribute in a hand-wavy fashion. For example on CIFAR10, we can group the ten classes into vehicles and animals and apply our MacroStd to measure sensitivity. A similar study can be conducted on CIFAR100 with its original 20 super-classes. On CIFAR10, since there are only two “super-classes” so we report the weighted average of the standard deviation of vehicle/animal group; on CIFAR100, we report our MacroStd across the 20 superclasses. The results are summarized in Fig. 10, and it shows FlowAug is again superior. We emphasize that this is a conceptual study on an additional protected attribute and is not within the scope of our work.
Appendix I CIFAR100-B Statistics
Classes Green Gray Blue White Black Brown Red Others apple 23 6 9 40 11 11 0 0 aquarium fish 30 5 12 0 38 9 4 2 baby 18 16 25 7 7 21 5 1 bear 56 15 9 1 2 16 1 0 beaver 36 8 18 8 6 24 0 0 bed 8 21 7 18 3 42 0 1 bee 24 8 10 6 4 33 8 7 beetle 29 13 8 15 1 28 3 3 bicycle 24 30 17 7 3 17 2 0 bottle 10 24 9 17 7 28 4 1 bowl 6 19 19 14 22 18 2 0 boy 21 13 16 13 8 21 5 3 bridge 11 9 67 5 5 2 1 0 bus 14 19 23 18 8 14 0 4 butterfly 53 12 3 7 4 17 2 2 camel 31 10 25 3 9 19 2 1 can 5 24 12 25 7 27 0 0 castle 4 12 65 15 1 2 0 1 caterpillar 63 6 7 0 6 15 2 1 cattle 47 5 13 8 5 20 1 1 chair 3 10 4 71 4 6 0 2 chimpanzee 65 3 4 3 1 20 1 3 clock 3 21 12 34 4 20 1 5 cloud 0 2 80 2 8 2 2 4 cockroach 2 19 13 44 1 14 5 2 couch 5 14 19 24 6 27 3 2 crab 9 23 16 16 15 16 3 2 crocodile 39 13 11 2 5 28 2 0 cup 9 27 18 17 14 11 1 3 dinosaur 23 14 12 26 7 17 0 1 dolphin 14 11 74 0 0 1 0 0 elephant 48 6 17 3 3 19 2 2 flatfish 15 14 34 13 6 12 6 0 forest 4 7 22 7 0 11 3 46 fox 32 11 19 1 7 26 2 2 girl 15 11 15 10 13 26 7 3 hamster 11 23 22 4 8 22 9 1 house 20 4 42 20 3 7 0 4 kangaroo 44 14 4 2 3 31 1 1 keyboard 8 15 23 8 5 23 3 15 lamp 5 20 23 14 12 20 5 1 lawn_mower 32 6 6 45 2 9 0 0 leopard 31 14 20 1 8 22 1 3 lion 36 4 19 1 3 31 3 3 lizard 13 14 21 5 8 30 5 4 lobster 14 12 18 17 11 15 6 7 man 15 19 14 9 18 24 1 0 maple_tree 11 6 48 29 2 4 0 0
Classes Green Gray Blue White Black Brown Red Others motorcycle 11 28 10 30 2 16 3 0 mountain 0 7 83 6 1 1 2 0 mouse 15 13 13 12 6 34 1 6 mushroom 57 9 5 3 7 19 0 0 oak_tree 6 2 72 15 1 4 0 0 orange 13 11 17 20 20 6 3 10 orchid 35 4 7 4 35 9 1 5 otter 28 14 27 3 5 22 1 0 palm_tree 3 7 62 13 5 5 0 5 pear 19 13 10 28 7 20 0 3 pickup_truck 31 27 16 6 5 14 0 1 pine_tree 7 11 61 13 1 7 0 0 plain 0 13 70 14 0 3 0 0 plate 3 22 15 26 17 13 2 2 poppy 57 4 7 4 14 4 2 8 porcupine 51 11 8 1 11 17 0 1 possum 27 19 10 1 16 22 2 3 rabbit 34 6 12 2 16 28 2 0 raccoon 30 6 14 5 21 23 1 0 ray 23 11 49 3 6 8 0 0 road 47 7 34 2 2 7 1 0 rocket 7 14 66 5 4 4 0 0 rose 54 3 10 9 11 5 1 7 sea 2 6 74 2 0 12 1 3 seal 17 14 43 4 6 12 1 3 shark 12 3 68 1 13 2 1 0 shrew 30 8 17 5 5 31 3 1 skunk 42 13 5 3 6 30 1 0 skyscraper 1 5 80 9 2 2 0 1 snail 45 7 12 3 5 26 1 1 snake 21 15 13 7 4 30 7 3 spider 37 18 15 2 9 11 7 1 squirrel 36 6 14 5 8 30 0 1 streetcar 22 10 32 11 4 13 7 1 sunflower 44 1 26 9 7 3 2 8 sweet_pepper 15 7 9 27 14 14 6 8 table 10 17 18 17 7 29 2 0 tank 16 13 30 17 1 23 0 0 telephone 5 11 5 59 4 13 3 0 television 4 24 10 26 10 21 2 3 tiger 45 3 14 8 9 16 0 5 tractor 33 8 34 10 1 14 0 0 train 18 16 42 13 4 7 0 0 trout 20 6 15 28 14 16 1 0 tulip 53 2 11 4 16 13 1 0 turtle 14 9 37 10 6 22 2 0 wardrobe 10 22 10 20 9 20 2 7 whale 1 4 85 7 0 3 0 0 willow_tree 13 3 43 26 2 5 0 8 wolf 17 10 22 5 22 18 6 0 woman 12 21 16 19 7 15 8 2 worm 13 13 26 8 17 15 7 1