Moritz Nottebaummoritz.nottebaum@stud.tu-darmstadt.de1
\addauthorStefan Rothstefan.roth@visinf.tu-darmstadt.de1,2
\addauthorSimone Schaub-Meyersimone.schaub@visinf.tu-darmstadt.de1,2
\addinstitution
Department of Computer Science
TU Darmstadt
\addinstitution
hessian.AI
Feature Extraction for Video Frame Interpolation
\newciteslatexReferences
Efficient Feature Extraction for High-resolution Video Frame Interpolation
Abstract
Most deep learning methods for video frame interpolation consist of three main components: feature extraction, motion estimation, and image synthesis. Existing approaches are mainly distinguishable in terms of how these modules are designed. However, when interpolating high-resolution images, e.g\bmvaOneDot at 4K, the design choices for achieving high accuracy within reasonable memory requirements are limited. The feature extraction layers help to compress the input and extract relevant information for the latter stages, such as motion estimation. However, these layers are often costly in parameters, computation time, and memory. We show how ideas from dimensionality reduction combined with a lightweight optimization can be used to compress the input representation while keeping the extracted information suitable for frame interpolation. Further, we require neither a pretrained flow network nor a synthesis network, additionally reducing the number of trainable parameters and required memory. When evaluating on three 4K benchmarks, we achieve state-of-the-art image quality among the methods without pretrained flow while having the lowest network complexity and memory requirements overall. ††Code and additional resources (test set and supplemental material) are available at https://github.com/visinf/fldr-vfi
1 Introduction
Video frame interpolation (VFI) is one of the classic problems in video processing. Generating intermediate frames in a video sequence can be used for various applications, e.g\bmvaOneDot, video compression (Djelouah et al., 2019; Wu et al., 2018), video editing (Meyer et al., 2018a), animation (Briedis et al., 2021; Li et al., 2021), and event cameras (Tulyakov et al., 2021, 2020).
Deep learning-based approaches for VFI (Liu et al., 2017; Sim et al., 2021; Jiang et al., 2018; Park et al., 2021) commonly consist of three modules: feature extraction, motion estimation, and image synthesis, which can be realized and combined in various forms. The higher the input image resolution is, however, the more important an efficient feature representation becomes to allow the subsequent modules to handle the large input space within reasonable memory constraints. Convolutional neural networks (CNNs) can reduce the spatial dimensions with an encoder network. This still requires initially applying the convolutional filters at the full image resolution, however. We suggest instead to first compress the images with a block-wise transformation inspired by linear dimensionality reduction methods such as principal component analysis (PCA) (F.R.S., 1901). PCA is known to efficiently represent image data, but is not directly suitable as a representation for neural networks as it projects each input image to a different low-dimensional space. We propose a method that finetunes an initial block-based PCA basis end-to-end for video frame interpolation. This has two advantages: First, it results in one general projection space for all images and resolutions. Second, it allows us to optimize the representation for the targeted task of video frame interpolation.
Our main contribution is a deep learning architecture for video frame interpolation that first applies linear dimensionality reduction to efficiently compress and represent images. Our approach is carefully designed to learn from the projected data as well as avoids a memory and computation intensive synthesis network in favor of a learned weighting of the (warped) input images. As a result, the overall complexity of the network architecture can be significantly reduced, which makes it particularly suitable for high-resolution videos and limited hardware resources. To evaluate the generalization of our approach to various video scenes, we introduce a novel 4K test set, with an order of magnitude more video scenes than existing ones. We achieve highly competitive results and even outperform existing methods for larger motions across various benchmarks with only a fraction of the network complexity.
2 Related Work
Feature extraction.
Most deep learning-based VFI methods encode the input with CNNs due to their general suitability for feature representation (Simonyan and Zisserman, 2015; Krizhevsky et al., 2012). However, for compressing images and videos, algorithms used in standard codecs (Wallace, 1992; Taubman and Marcellin, 2002; Wiegand et al., 2003) still rely on mathematical transformations like the discrete cosine transform (DCT). The advantage of well defined mathematical transformations like DCT, PCA, and DFT (discrete Fourier transformation) is that they are comparably cheap to compute while also entailing a good compression ratio. Some exemplary work showed their use in neural networks in different scenarios, e.g\bmvaOneDot, DFT (Riad et al., 2022; Meyer et al., 2018b) and PCA (Benkaddour and Bounoua, 2017). The advantage of CNNs is their task-specific adaptability, while PCA dimensionality reduction only adapts to the input data, not the task. Here, we show how we can still use the benefits of dimensionality reduction in a neural network architecture.
Video frame interpolation.
Generating intermediate frames between two frames requires some understanding of the temporal relationship between the input frames. We can generally categorize VFI methods in terms of whether they estimate the motion explicitly, e.g\bmvaOneDotoptical flow, or implicitly. VFI methods representing the motion implicitly either directly estimate the intermediate frame (Long et al., 2016), use phase-based (Meyer et al., 2015, 2018b) or a kernel-based (Niklaus et al., 2017a, b; Cheng and Chen, 2020) representation, or apply PixelShuffle (Choi et al., 2020). However, most of them are limited to generating a single intermediate frame. Kernel-based methods are further limited, due to the kernel size, in the amount of pixel displacement they can handle. This makes them unsuitable for high-resolution imagery.
Traditionally, explicit methods for VFI combine optical flow estimation (Baker et al., 2011; Sun et al., 2010) and correspondence-based image warping (Baker et al., 2011). As a result, they heavily depend on the quality of the optical flow. Thus, deep learning-based methods using flow estimation often not only estimate the bi-directional flow between the input images but further refine the intermediate flow vectors (Jiang et al., 2018; Sim et al., 2021) or the output with a synthesis network (Niklaus and Liu, 2018) to address inaccuracies. Two recent advances have enabled the current state-of-the-art in frame interpolation: On the one hand, pretrained flow estimation modules (Sun et al., 2018; Teed and Deng, 2020; Xu et al., 2022) became more powerful and can be used as a starting point; on the other hand, using forward warping instead of backward warping allows to directly compute the intermediate flow vectors without approximating them (Niklaus and Liu, 2020; Hu et al., 2022). However, their performance heavily depends on the pretrained flow network used as well as on the image resolution of the input (Hu et al., 2022). M2M-PWC (Hu et al., 2022), for example, requires bilinear downscaling of 4K images for optimal performance. Furthermore, such models have many trainable parameters and require a lot of memory.
Applying VFI techniques successfully and efficiently to high-resolution data remains a challenging task. Most successful high-resolution models have in common that they do not compute the flow via an expensive cost volume (e.g\bmvaOneDot, Huang et al., 2022) and use a multi-scale approach, incorporating some kind of weight sharing between the different scales of the input images (e.g\bmvaOneDot, Sim et al., 2021; Park et al., 2021; Reda et al., 2022). We take these ideas a step further and combine the shared multi-resolution approach with a preceding image compression based on linear dimensionality reduction.
3 Dimensionality Reduction for Feature Extraction
As our approach to obtaining a compact image representation is inspired by principal component analysis (PCA) F.R.S. (1901), let us first recap its basics. PCA describes the process of computing principal components from the data. The principal components represent an orthonormal basis of the zero-centered data. PCA can be used to perform a change of basis of the data, where the first basis vector maximizes the variance of the projected data, the second accounts for the largest remaining variability, and so on. Because of this characteristic, the PCA basis is commonly used for dimensionality reduction by projecting each data point onto only the first few principal components. As a result, the lower-dimensional, projected data preserves as much of the data’s variation as possible with a linear transformation.
Instead of extracting a compact feature representation with a neural network directly from the high-resolution input image, we here argue that dimensionality reduction can be used to first compress the image data. This reduces the memory footprint of the input data significantly without resorting to downscaling. There are two main advantages of combining explicit dimensionality reduction with neural networks: (i) Using a compressed representation of the input reduces the memory requirements of the subsequent neural network modules. (ii) Due to the compressed representation also the model capacity of the subsequent neural network modules can be reduced, decreasing the number of trainable parameters.
Block-based PCA.
Similar to (Taur and Tao, 1996), we use block-based PCA to compress a single image. We split an image into blocks, where each block, vectorized, represents a data point , which are concatenated into a matrix as . The number of blocks depends on the image resolution, i. e., . After subtracting the mean from , resulting in , we compute the covariance matrix of as . We perform an eigendecomposition of and take the first eigenvectors as our projection axes, i. e., . We compute the projected data as . Reshaping back yields the compressed image representation with a compression ratio of w. r. t. the original image .
Simply applying block-based PCA to each image is computationally not ideal as the principal components have to be recomputed every time. Further, the projected data is not directly suitable as input to a neural network. First, the data range can be very large and second, representing each image in a different projected space makes it difficult for the network to learn from it. We address these challenges explicitly in our framework design.
4 fLDR-Net for Video Frame Interpolation
Given two images, and , the goal of video frame interpolation is to generate several intermediate images for . The focus of our method is to propose a lightweight framework in terms of memory and the number of trainable parameters that is especially suitable for high-resolution images, in our case 4K, and limited hardware resources. We achieve this by compressing the input images using ideas from dimensionality reduction and projecting the data into a low-dimensional space. However, it is not trivial how to use this different representation efficiently in a neural network. Following the recap of the basics of principal component analysis PCA in Sec. 3, we now explain how to use a block-based linear representation successfully in a neural network, as well as our overall framework design to further reduce the computational overhead.
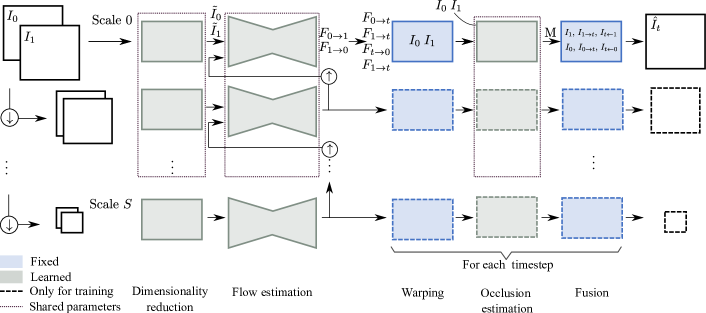
Overview.
Fig. 1 shows our proposed framework. It consists of three trainable modules, namely the finetuned linear dimensionality reduction (fLDR), flow estimation, and occlusion estimation. The image synthesis part at each time step is very lightweight in terms of trainable network modules and memory. We do not perform any learned refinement of the estimated flow vectors or image synthesis besides the occlusion estimation. In the following, we describe each part in detail. To simplify the notation, we focus on scale level . If not mentioned otherwise, the other scales are carried out in the same way except that the input image is first bilinearly downscaled by a factor of from the previous level.
Finetuned linear dimensionality reduction (fLDR).
We apply dimensionality reduction of the input images inspired by block-based PCA as described in Sec. 3. However, we cannot apply this to each image separately as this would lead to different, data-dependent low-dimensional projection spaces, unfavorable for neural networks. Additionally, the projection spaces should be consistent among the scales, in order to enable parameter sharing. This requires a single set of projection vectors suitable for all images at all scales. We achieve this by using the first block-based PCA projection vectors of one random sample image as initialization and treating the eigenvectors and the mean vector of the computed initial PCA decomposition as trainable parameters, optimized end-to-end for the task of frame interpolation. We call this procedure finetuned block-based linear dimensionality reduction, short fLDR, yielding the compressed image . Before further processing , we divide each projected data point by the mean of its absolute values along the principal direction dimensions and normalize the whole matrix to values in the range of suitable for neural networks.
Flow estimation.
Existing flow estimation modules often estimate flow only at a downsampled input resolution, e.g\bmvaOneDot ((Sun et al., 2018; Sim et al., 2021)) or ((Teed and Deng, 2020)), for computational reasons. Because the input to the flow estimation is in our case already a compressed image representation obtained from the fLDR module, we estimate the flow at the same resolution as the compressed input representation, i. e., at resolution. We use the high-level idea of XVFI (Sim et al., 2021) of resharing the parameters across scales for efficient multi-scale optical flow estimation without a pretrained flow network. We also estimate the flow at different scales with shared parameters, except for the lowest level . This allows to increase the number of scales at test time, when the input image has a significantly larger resolution than at training time (e.g\bmvaOneDot, 4K vs. training patch size). Contrary to XVFI (Sim et al., 2021), we can further significantly simplify the flow estimation module and only need one encoder-decoder network instead of two to predict the intermediate flow fields. The reasons are our compressed image representation as input as well as changes in the pipeline, mainly using forward warping instead of backward warping.
As illustrated in Fig. 1, we predict and at each scale . The flow is estimated from the compressed image representation , which first gets passed through two convolutional layers. On all levels except , the feature representation is concatenated with the bilinearly upscaled flow estimation from the previous level. Architectural network details are provided in the supplemental material.
To compute the intermediate image , we need the flow from and to the intermediate time step . To compute the forward flow, we can simply scale it accordingly:
| (1) |
Computing the backward flow, and , is only possible in an approximated manner (Jiang et al., 2018). XVFI (Sim et al., 2021) uses a second neural network for this, while we opt for a direct, non-trainable approximation. In order to obtain , we can take the flow , adjusting the magnitude by multiplying it with and warping it to the position from which it points at time . We do the latter by backward warping with the flow , scaled with , approximating the starting point of the flow vector at time . is approximated analogously as
| (2) |
where describes the backward warping function.
Image warping.
Before we can use the computed flow vectors for warping, we upscale them bilinearly to the non-compressed image resolution at each scale. We can then warp the input images, and , to the intermediate time step . We do this by forward warping them with softmax splatting Niklaus and Liu (2020), noted as , with occlusion estimation (Baker et al., 2011) as importance metric:
| (3) |
The advantage of forward splatting is that we can directly use the intermediate flow vectors and . However, forward splatting can lead to small holes due to occlusions and divergent flow vectors. Backward warping, on the other hand, would give a dense result, but requires an approximation of the backward flow. Video frame interpolation methods that use backward warping often use an additional network to refine and , e.g\bmvaOneDot, XVFI (Sim et al., 2021) for better accuracy. In our case, we only use the backward images as additional input to compute the occlusion mask. Therefore, the directly computed flow vectors from Eq. 2 are enough and no further learned refinement is needed. The backward warping gives us two additional images at time instant :
| (4) |
Occlusion estimation.
In order to accurately merge the different warped images at time step , we propose a simple occlusion estimation network to estimate a weighting map , where corresponds to the number of images to merge. The input to the occlusion estimation are the warped images as well as the input images. In the last layer of the estimation network, we apply a softmax along the last dimension, yielding a probability distribution for every output pixel. We include temperature scaling (Guo et al., 2017) of the softmax function to better calibrate the distribution. The details of the temperature scaling and the network architecture can be found in the supplemental material.
Image synthesis.
We omit a dedicated image synthesis network to predict . Instead, we directly fuse the warped images by weighting them with the predicted occlusion map (by pixelwise multiplication ) as well as the temporal distance from the input images:
| (5) |
Loss functions.
We train our model with a similar loss function as in XVFI (Sim et al., 2021), consisting of an image reconstruction loss, , at all levels and an edge-aware smoothness loss, , on the estimated flow vectors and at the finest scale . We add an additional term to supervise the flow estimation at the highest resolution by computing the warping error, , yielding the total loss
| (6) |
where define the weighting factors. Details are given in the supplemental.
5 Experiments
5.1 Setup
Training.
We train our method on X-Train (Sim et al., 2021), mainly following the training procedure of XVFI (Sim et al., 2021). X-Train consists of 4,408 clips of images cropped from the original 4K frames. Each clip consists of 65 consecutive frames. Following (Sim et al., 2021), we also select random triplets from the sequences, at most 32 frames apart, and randomly select training patches of . We train on one Nvidia 3080Ti (12GB) GPU with a batch size of 8 for 200 epochs. We use the Adam (Kingma and Ba, 2015) optimizer and an initial learning rate of , which is decreased by 0.25 after each 50 epochs, starting after 70 epochs. The optimization of the temperature parameter (Guo et al., 2017) is done with a learning rate of . Because the projection vectors are very sensitive to changes, we use a learning rate of for the linear dimensionality reduction layer. We use for training. For evaluation, we take the best checkpoint based on the validation set. The full list of hyperparameters is given in the supplemental.
Testing.
We use during testing, i. e. 2 scale levels more than during training to handle the high-resolution images. For evaluation, we focus on datasets consisting of 4K video frames. The two commonly used 4K datasets in frame interpolation are the videos from Xiph111from xiph.org as described in (Niklaus and Liu, 2020), as well as X-Test from (Sim et al., 2021). However, both of them have limited variability. X-Test only has 15 image pairs, each with 7 intermediate frames. The selected clips have a lot of camera motion leading to large, dominating flow magnitudes. Xiph, on the other hand, has only 8 videos, with much less camera motion and mainly object motion, resulting in most of the flow vectors having a small magnitude. This is summarized in Tab. 1. To have more variability, we selected additional evaluation scenes from the Inter4K (Stergiou and Poppe, 2021) test set. The original test set consists of 100 videos with up to 60 fps and 300 frames per video. We only take the videos with 60 fps and split them into their different scenes by thresholding the pixel difference between consecutive frames. We create two different versions to evaluate different degrees of motion. For Inter4K-S, we take the first 9 frames of each scene, and for Inter4K-L the first 17, respectively. Both test sets analyze 8 temporal interpolation with 7 intermediate frames, meaning for Inter4K-L every second intermediate frame is skipped to simulate larger motion.
| Interpolation factor | # clips | # eval. frames clip | # total eval. frames | PWC-Net (Sun et al., 2018) | |||
|---|---|---|---|---|---|---|---|
| Dataset | |||||||
| Xiph-4K | 2 | 8 | 49 | 392 | 9.1 | 14.1 | 25.0 |
| X-Test (Sim et al., 2021) | 8 | 15 | 7 | 105 | 23.9 | 81.9 | 138.5 |
| Inter4K-S | 8 | 144 | 7 | 1008 | 7.6 | 30.9 | 102.0 |
| Inter4K-L | 8 | 133 | 7 | 931 | 13.4 | 56.7 | 162.5 |
| Pretrained flow | # Param. (Mill.) | Memory (for 4K) | Training dataset | Xiph-4K | X-Test | Inter4K-S | Inter4K-L | Inference (in s/f) | |
| SoftSplat Niklaus and Liu (2020) | ✓ | 7.7 | – | Vimeo90K | 34.2∗(Niklaus et al., 2022) | 25.48∗(Hu et al., 2022) | OOM | OOM | – |
| M2M-PWC Hu et al. (2022) | ✓ | 7.6 | 10 GB | Vimeo90K | 34.88 | 30.81 | 29.22 | 24.87 | 0.21 |
| M2M-DIS Hu et al. (2022) | ✓ | – | – | Vimeo90K | – | 30.18∗(Hu et al., 2022) | – | – | – |
| ABME Park et al. (2021) | ✗ | 18.1∗(Park et al., 2021) | – | Vimeo90K | OOM | 30.16∗(Park et al., 2021) | OOM | OOM | – |
| RIFEm Huang et al. (2022) | ✗ | 9.8 | 6.8 GB | Vimeo90K | 34.80 | 26.80 | 28.37 | 24.40 | 0.40 |
| RIFE Huang et al. (2022) | ✗ | 9.8 | 6.8 GB | X-Train | 34.00 | 28.06 | 28.36 | 24.47 | 0.40 |
| XVFI⋄ Sim et al. (2021) | ✗ | 5.5 | >12 GB | X-Train | 34.04 | 30.34 | 28.82 | 24.62 | – |
| Ours | ✗ | 0.9 | 4.6 GB | X-Train | 34.16 | 30.45 | 29.29 | 25.16 | 0.51 |
5.2 Comparison with the state of the art
We compare to SoftSplat (Niklaus and Liu, 2020) and M2M (Hu et al., 2022), which both rely on pretrained flow and forward splatting, as well as to ABME (Park et al., 2021), RIFE (Huang et al., 2022), and XVFI (Sim et al., 2021), which do not use a pretrained flow network. All methods support interpolation at arbitrary time steps.
Whenever possible, we used the original code and checkpoints from the authors. The performance of M2M (Hu et al., 2022) heavily depends on the input image resolution to the flow network, e.g\bmvaOneDot, M2M-PWC Hu et al. (2022) performs best for 4K input when images are first downscaled by a factor of 8 or 16, while M2M-DIS is less sensitive, and performs best at the original input. For M2M-DIS, we report the numbers from the original paper (Hu et al., 2022) as the code is not online. For M2M-PWC, we test different scale factors for each dataset, reporting the results for the best option. For RIFE (Huang et al., 2022), we use the RIFEm model, which supports arbitrary interpolation. We also retrain it on X-Train with an increased patch size of , as we observed this to slightly improve the results. We evaluate the models on a Nvidia 3080 Ti (12GB) GPU. With the available memory, we were not able the evaluate SoftSplat (Niklaus and Liu, 2020) and ABME (Park et al., 2021) on 4K images and hence report numbers from the referenced papers instead.
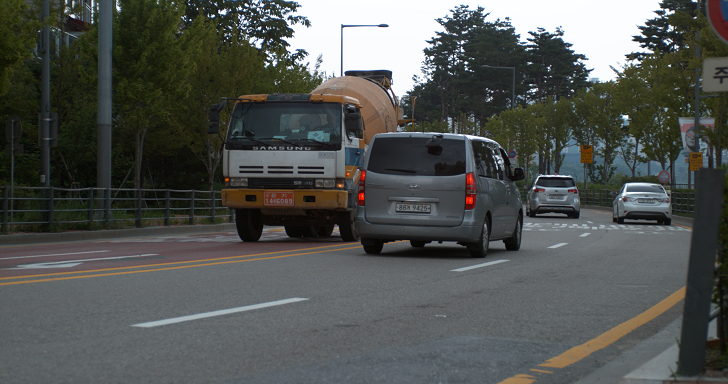
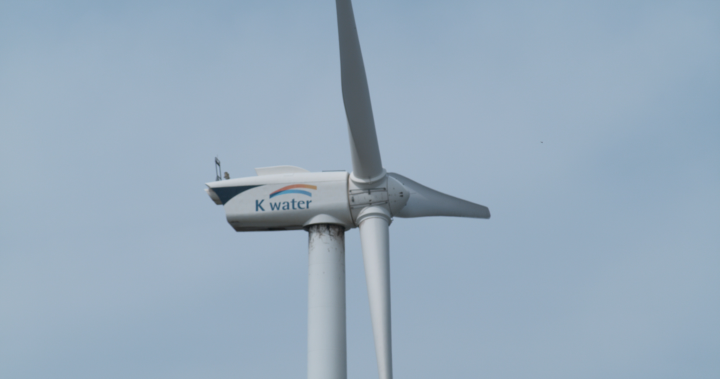
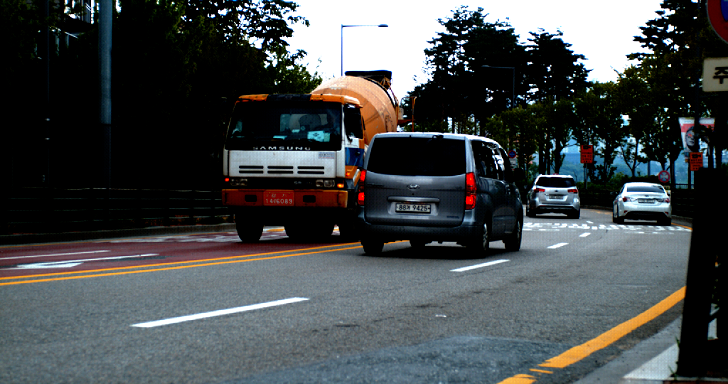
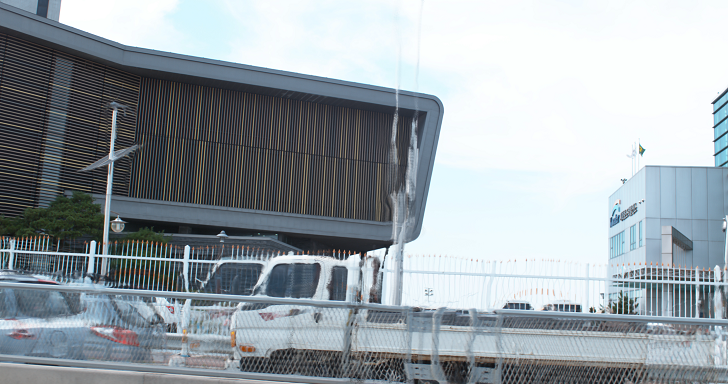
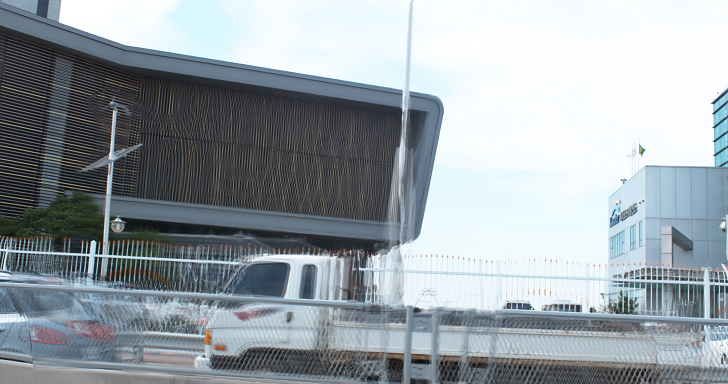
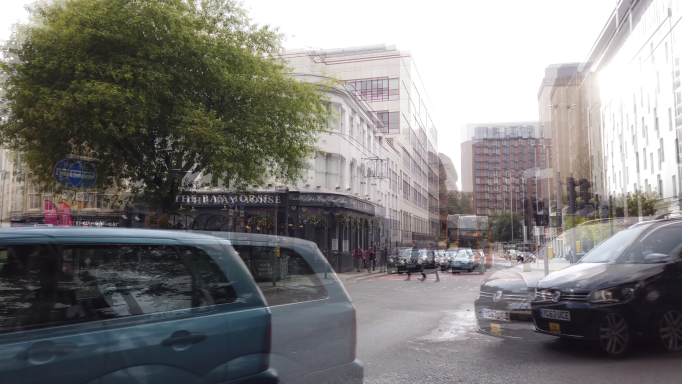
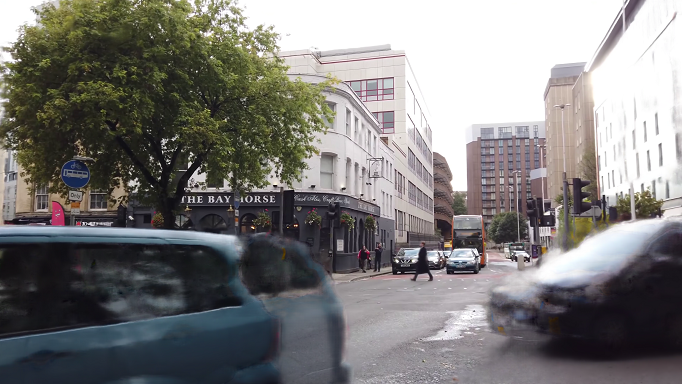
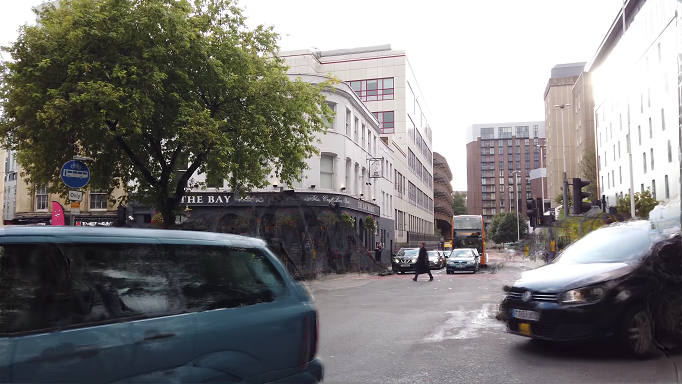
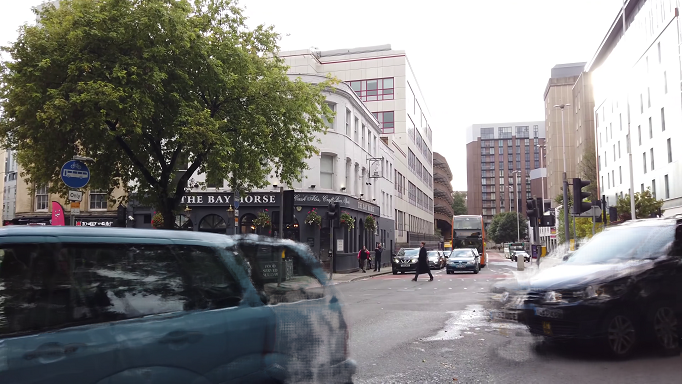
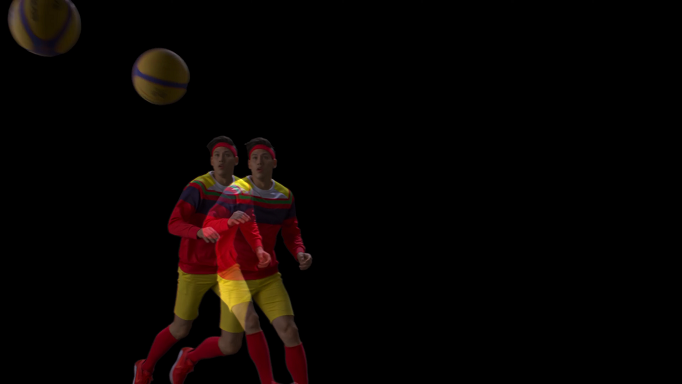
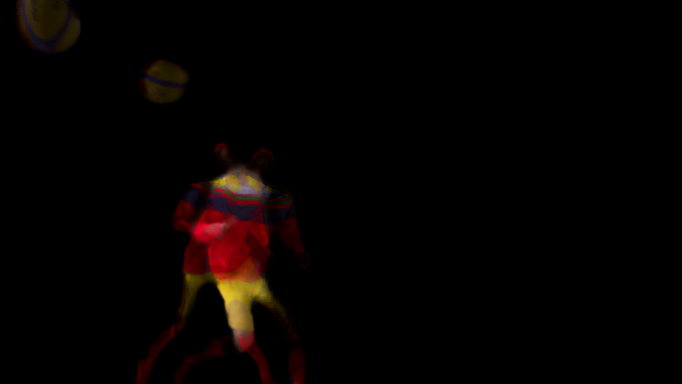
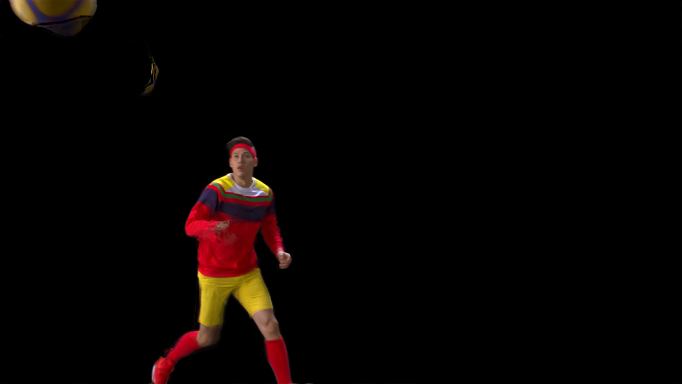
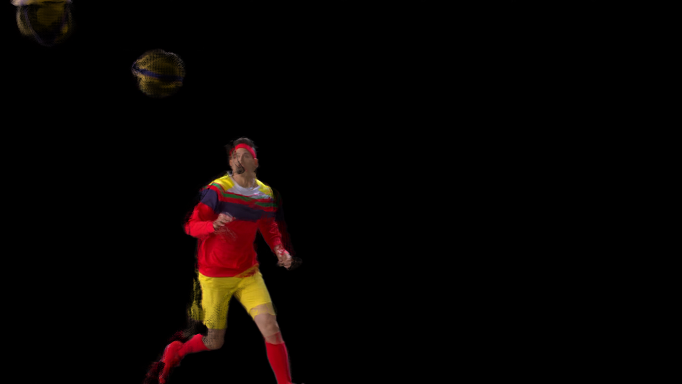
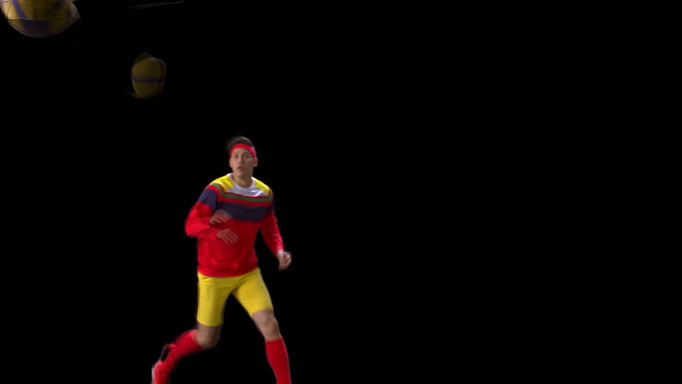
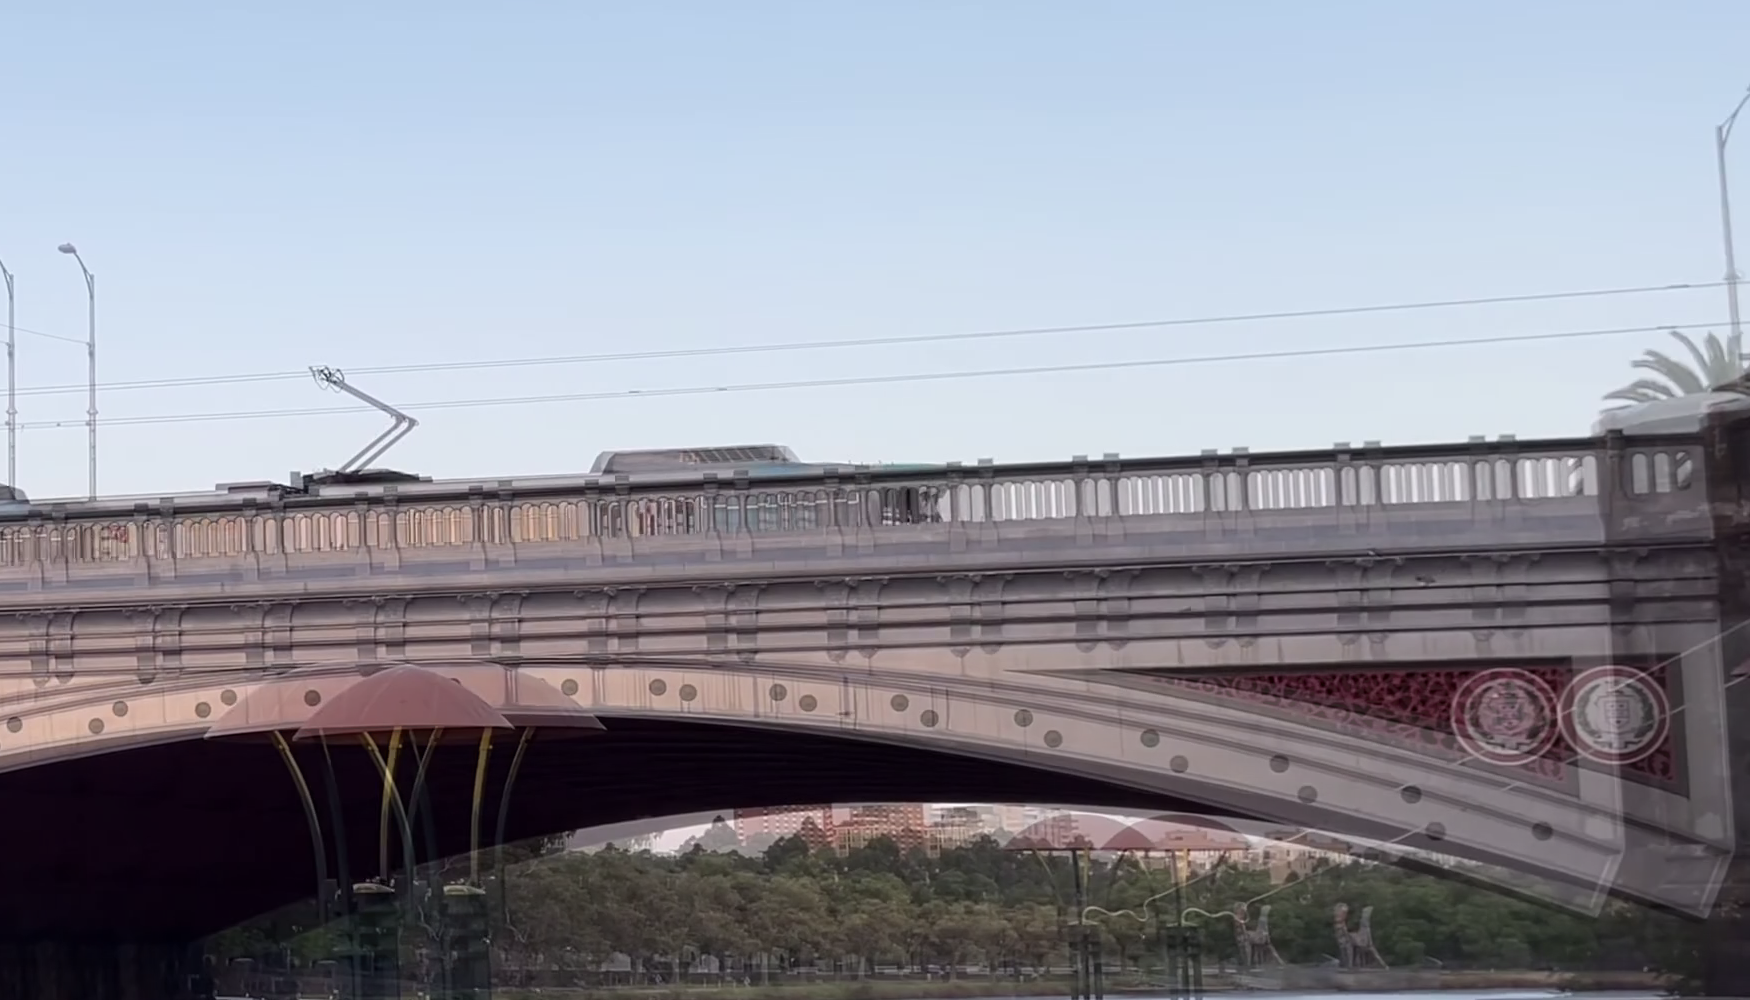
Tab. 2 gives a quantitative comparison. We achieve state-of-the-art accuracy for most of the datasets among the methods without pretrained flow. A powerful pretrained flow network can occasionally help, but the results are heavily dependent on the type of flow network and amount of motion. Our approach yields consistently high PSNR values, especially for the datasets with larger motion, despite having by far the fewest trainable parameters as well as the lowest memory requirements. In comparison to XVFI (Sim et al., 2021), we can see how our conceptual contributions lead to a significant reduction of memory and parameters, yet an increase in PSNR of up to dB. Without specifically optimizing for inference time, we can achieve competitive runtimes comparable to most of the other methods (M2M-PWC downscales the input image first by a factor of , leading to faster inference) without the need for large, high-end GPUs. Qualitative visual results are shown in Fig. 4 and in the supplemental video.
| fDLR | Flow estim. | Warping | Occl. estim. | Fusion | Full model | |
|---|---|---|---|---|---|---|
| Memory (GB) | 3.5 | 2.7 | 4.6 | 4.0 | 4.6 | 4.6 |
| # Parameters | 1k | 733k | 1 | 194k | 0 | 0.9M |
| Inference time (ms) | 30 | 22 | 410 | 44 | 3.1 | 510 |
| # Param. (in Mill.) | Memory (for 4K) | Xiph-4K | X-Test | Inter4K-S | Inter4K-L | |
|---|---|---|---|---|---|---|
| Ours (full) | 0.9 | 4.6GB | 34.16 | 30.45 | 29.29 | 25.16 |
| w/o finetuning projection vectors | 0.9 | 4.6GB | 33.92 | 29.46 | 28.34 | 24.43 |
| w/o backward flow ( & ) | 0.9 | 4.6GB | 33.95 | 30.13 | 28.81 | 24.77 |
| w/o | 0.9 | 4.6GB | 33.99 | 30.25 | 28.97 | 24.96 |
| w/o scaling | 0.9 | 4.6GB | 34.13 | 30.41 | 29.20 | 25.09 |
| with synthesis (from (Sim et al., 2021)) | 2.6 | 9.5GB | 34.20 | 30.59 | 29.12 | 25.07 |
5.3 Method analysis
Efficiency.
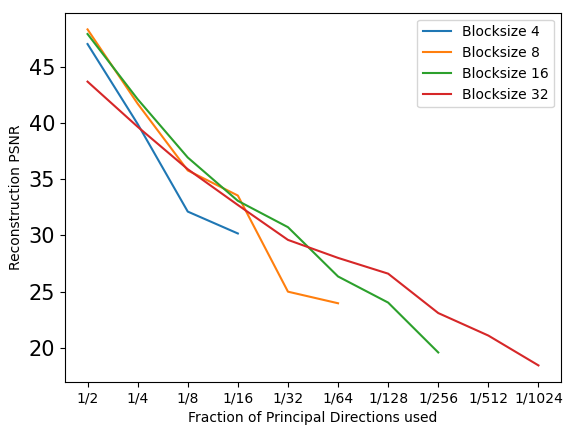
The focus of our method is to reduce the complexity of the network and the required memory. To select an ideal block size and the number of projection dimensions , we analyze the general compression capability of block-based PCA by computing the basis from a single image of , taking a fraction of it to reconstruct the images in X-Test (Sim et al., 2021), and averaging the reconstruction PSNR. For a targeted compression rate of , Fig. 3 shows that a block size of or has the best reconstruction accuracy. Because the compressed image representation is directly used for the flow computation and, therefore, a higher image resolution is preferable, we choose and thus . Fig. 3 shows the comparison of reconstructed images when using the original PCA vectors and after finetuning with our fLDR module. The finetuned vectors increase the contrast, highlighting features that intuitively seem suitable for flow estimation in the context of frame interpolation. The efficiency in feature representation using fLDR becomes evident when looking at the remaining trainable parameters of our framework. In Tab. 3 we report the memory usage, number of trainable parameters, and inference time w. r. t. the individual modules. Our flow network only has million (M) parameters, while XVFI (Sim et al., 2021) needs M for flow estimation plus an additional M for flow refinement. By replacing the synthesis network of XVFI (Sim et al., 2021) with weighted averaging (our fusion module), we save another M parameters. Estimating optical flow with a pretrained PWC-Net (Sun et al., 2018) requires 90ms at half the image resolution (to fit on our GPU), 9.4M trainable parameters, and 5.1GB memory. Visualizations of the optical flow are provided in the supplemental. Our inference time is dominated by our warping module, designed to reduce the number of trainable parameters.222One trainable parameter is needed to compute the importance metric for forward warping as described in Niklaus and Liu (2020).
Ablation design choices.
In Tab. 4 we analyze the effect of our design choices. Finetuning the projection vectors is crucial and leads to a PSNR improvement of up to 1dB. The variance of the final image quality (PSNR) for selecting different images for initialization of the projection dimensions is for Xiph-4K and X-Test only 0.02dB and 0.05dB, respectively. The Inter4K dataset has a larger variability in images, leading to a slighter higher variance of around 0.14dB. The powerful synthesis network only gives a slight positive effect in accuracy on one dataset, which is not proportional to the overhead it adds. The remaining design choices have a positive effect on the PSNR value while not adding any notable overhead.
|
|
|
|
|
|
|
|
|

|
|
|
|
|
|
|

|
|
|
|
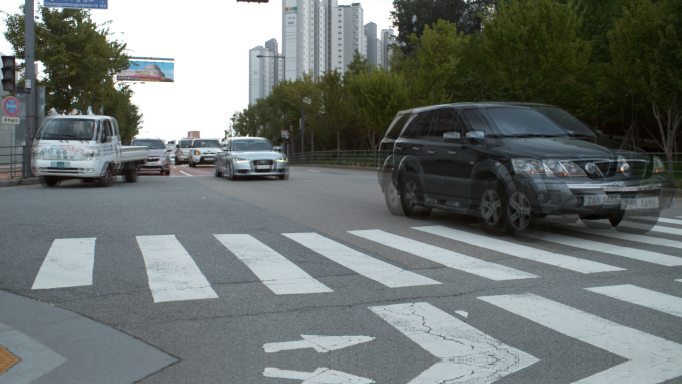
| (a) Overlaid inputs | (b) RIFEm (Huang et al., 2022) | (c) XVFI (Sim et al., 2021) | (d) M2M-PWC (Hu et al., 2022) | (e) Ours |
Limitations.
Our framework has been explicitly and carefully designed for high-resolution video. Before flow computation, we compress the frames using linear dimensionality reduction on blocks. For this reason, flow can only be computed using of the original image resolution as input. This makes our approach perform comparatively worse on smaller images such as the common Vimeo90K (Xue et al., 2019) test set, as the input to the flow estimation is not fine-grained enough w. r. t. to the full image resolution. Evaluating our method (trained on X-Train) directly on Vimeo-90k, we obtain a PSNR of 33.03dB using 1.7GB of memory. For small images, where memory constraints are less of an issue, better accuracy can be obtained with more memory intensive approaches; e.g\bmvaOneDot, SoftSplat(Niklaus and Liu, 2020) achieves a PSNR of 36.10dB.
6 Conclusion
We present a method for video frame interpolation in high-resolution videos, which uses linear dimensionality reduction and a lightweight neural network architecture to boost the efficiency. By compressing images first with our finetuned projection vectors, we can significantly reduce the number of trainable parameters and the overall memory requirements in the subsequent network modules. We show that we can achieve highly competitive results on various 4K datasets with only a fraction of trainable parameters and low memory footprint.
Acknowledgments and disclosure of funding
This project has received funding from the European Research Council (ERC) under the European Union’s Horizon 2020 research and innovation programme (grant agreement No. 866008). The project has also been supported in part by the State of Hesse through the cluster project “The Third Wave of Artificial Intelligence (3AI)”.
References
- Baker et al. (2011) Simon Baker, Daniel Scharstein, J. P. Lewis, Stefan Roth, Michael J. Black, and Richard Szeliski. A database and evaluation methodology for optical flow. International Journal of Computer Vision, 92(1):1–31, 2011.
- Benkaddour and Bounoua (2017) Mohammed Kamel Benkaddour and Abdennacer Bounoua. Feature extraction and classification using deep convolutional neural networks, PCA and SVC for face recognition. Traitement du Signal, 34(1-2):77–91, 2017.
- Briedis et al. (2021) Karlis Martins Briedis, Abdelaziz Djelouah, Mark Meyer, Ian McGonigal, Markus H. Gross, and Christopher Schroers. Neural frame interpolation for rendered content. ACM Transactions on Graphics, 40(6):239:1–239:13, 2021.
- Cheng and Chen (2020) Xianhang Cheng and Zhenzhong Chen. Video frame interpolation via deformable separable convolution. In Proceedings of the Thirty-Second AAAI Conference on Artificial Intelligence, 2020.
- Choi et al. (2020) Myungsub Choi, Heewon Kim, Bohyung Han, Ning Xu, and Kyoung Mu Lee. Channel attention is all you need for video frame interpolation. In Proceedings of the Thirty-Second AAAI Conference on Artificial Intelligence, 2020.
- Djelouah et al. (2019) Abdelaziz Djelouah, Joaquim Campos, Simone Schaub-Meyer, and Christopher Schroers. Neural inter-frame compression for video coding. In Proceedings of the Seventeenth IEEE International Conference on Computer Vision, 2019.
- F.R.S. (1901) Karl Pearson F.R.S. LIII. On lines and planes of closest fit to systems of points in space. The London, Edinburgh, and Dublin Philosophical Magazine and Journal of Science, 2(11):559–572, 1901.
- Guo et al. (2017) Chuan Guo, Geoff Pleiss, Yu Sun, and Kilian Q. Weinberger. On calibration of modern neural networks. In Doina Precup and Yee Whye Teh, editors, Proceedings of the 34rd International Conference on Machine Learning, 2017.
- Hu et al. (2022) Ping Hu, Simon Niklaus, Stan Sclaroff, and Kate Saenko. Many-to-many splatting for efficient video frame interpolation. In Proceedings of the IEEE/CVF Conference on Computer Vision and Pattern Recognition, 2022.
- Huang et al. (2022) Zhewei Huang, Tianyuan Zhang, Wen Heng, Boxin Shi, and Shuchang Zhou. Real-time intermediate flow estimation for video frame interpolation. In Proceedings of the 17th European Conference on Computer Vision, Lecture Notes in Computer Science. Springer, 2022.
- Jiang et al. (2018) Huaizu Jiang, Deqing Sun, Varun Jampani, Ming-Hsuan Yang, Erik G. Learned-Miller, and Jan Kautz. Super SloMo: High quality estimation of multiple intermediate frames for video interpolation. In Proceedings of the IEEE/CVF Conference on Computer Vision and Pattern Recognition, 2018.
- Kingma and Ba (2015) Diederik P. Kingma and Jimmy Ba. Adam: A method for stochastic optimization. In Proceedings of the International Conference on Learning Representations, 2015.
- Krizhevsky et al. (2012) Alex Krizhevsky, Ilya Sutskever, and Geoffrey E. Hinton. ImageNet classification with deep convolutional neural networks. In Peter L. Bartlett, Fernando C. N. Pereira, Christopher J. C. Burges, Léon Bottou, and Kilian Q. Weinberger, editors, Advances in Neural Information Processing Systems, 2012.
- Li et al. (2021) Siyao Li, Shiyu Zhao, Weijiang Yu, Wenxiu Sun, Dimitris N. Metaxas, Chen Change Loy, and Ziwei Liu. Deep animation video interpolation in the wild. In Proceedings of the IEEE/CVF Conference on Computer Vision and Pattern Recognition, 2021.
- Liu et al. (2017) Ziwei Liu, Raymond A. Yeh, Xiaoou Tang, Yiming Liu, and Aseem Agarwala. Video frame synthesis using deep voxel flow. In Proceedings of the Sixteenth IEEE International Conference on Computer Vision, 2017.
- Long et al. (2016) Gucan Long, Laurent Kneip, Jose M. Alvarez, Hongdong Li, Xiaohu Zhang, and Qifeng Yu. Learning image matching by simply watching video. In Proceedings of the 14th European Conference on Computer Vision, Lecture Notes in Computer Science. Springer, 2016.
- Meyer et al. (2015) Simone Meyer, Oliver Wang, Henning Zimmer, Max Grosse, and Alexander Sorkine-Hornung. Phase-based frame interpolation for video. In Proceedings of the IEEE Conference on Computer Vision and Pattern Recognition, 2015.
- Meyer et al. (2018a) Simone Meyer, Victor Cornillère, Abdelaziz Djelouah, Christopher Schroers, and Markus H. Gross. Deep video color propagation. In Proceedings of the British Machine Vision Conference, 2018a.
- Meyer et al. (2018b) Simone Meyer, Abdelaziz Djelouah, Brian McWilliams, Alexander Sorkine-Hornung, Markus H. Gross, and Christopher Schroers. PhaseNet for video frame interpolation. In Proceedings of the IEEE/CVF Conference on Computer Vision and Pattern Recognition, 2018b.
- Nair and Hinton (2010) Vinod Nair and Geoffrey E. Hinton. Rectified linear units improve restricted Boltzmann machines. In Proceedings of the 27th International Conference on Machine Learning, 2010.
- Niklaus and Liu (2018) Simon Niklaus and Feng Liu. Context-aware synthesis for video frame interpolation. In Proceedings of the IEEE/CVF Conference on Computer Vision and Pattern Recognition, 2018.
- Niklaus and Liu (2020) Simon Niklaus and Feng Liu. Softmax splatting for video frame interpolation. In Proceedings of the IEEE/CVF Conference on Computer Vision and Pattern Recognition, 2020.
- Niklaus et al. (2017a) Simon Niklaus, Long Mai, and Feng Liu. Video frame interpolation via adaptive convolution. In Proceedings of the IEEE Conference on Computer Vision and Pattern Recognition, 2017a.
- Niklaus et al. (2017b) Simon Niklaus, Long Mai, and Feng Liu. Video frame interpolation via adaptive separable convolution. In Proceedings of the Sixteenth IEEE International Conference on Computer Vision, 2017b.
- Niklaus et al. (2022) Simon Niklaus, Ping Hu, and Jiawen Chen. Splatting-based synthesis for video frame interpolation. arXiv:2201.10075 [cs.CV], 2022.
- Park et al. (2021) Junheum Park, Chul Lee, and Chang-Su Kim. Asymmetric bilateral motion estimation for video frame interpolation. In Proceedings of the Eightteenth IEEE International Conference on Computer Vision, 2021.
- Reda et al. (2022) Fitsum A. Reda, Janne Kontkanen, Eric Tabellion, Deqing Sun, Caroline Pantofaru, and Brian Curless. FILM: Frame interpolation for large motion. In Proceedings of the 17th European Conference on Computer Vision, Lecture Notes in Computer Science. Springer, 2022.
- Riad et al. (2022) Rachid Riad, Olivier Teboul, David Grangier, and Neil Zeghidour. Learning strides in convolutional neural networks. In Proceedings of the Tenth International Conference on Learning Representations, 2022.
- Sim et al. (2021) Hyeonjun Sim, Jihyong Oh, and Munchurl Kim. XVFI: eXtreme video frame interpolation. In Proceedings of the Eightteenth IEEE International Conference on Computer Vision, 2021.
- Simonyan and Zisserman (2015) Karen Simonyan and Andrew Zisserman. Very deep convolutional networks for large-scale image recognition. In Yoshua Bengio and Yann LeCun, editors, Proceedings of the International Conference on Learning Representations, 2015.
- Stergiou and Poppe (2021) Alexandros Stergiou and Ronald Poppe. Adapool: Exponential adaptive pooling for information-retaining downsampling. arXiv:2111.00772 [cs.CV], 2021.
- Sun et al. (2010) Deqing Sun, Stefan Roth, and Michael J. Black. Secrets of optical flow estimation and their principles. In Proceedings of the IEEE Conference on Computer Vision and Pattern Recognition, 2010.
- Sun et al. (2018) Deqing Sun, Xiaodong Yang, Ming-Yu Liu, and Jan Kautz. PWC-Net: CNNs for optical flow using pyramid, warping, and cost volume. In Proceedings of the IEEE/CVF Conference on Computer Vision and Pattern Recognition, 2018.
- Taubman and Marcellin (2002) David S. Taubman and Michael W. Marcellin. JPEG2000: standard for interactive imaging. Proceedings of the IEEE, 90(8):1336–1357, 2002.
- Taur and Tao (1996) Jin-Shiuh Taur and Chin-Wang Tao. Medical image compression using principal component analysis. In Proceedings of the IEEE International Conference on Image Processing, 1996.
- Teed and Deng (2020) Zachary Teed and Jia Deng. RAFT: Recurrent all-pairs field transforms for optical flow. In Proceedings of the 16th European Conference on Computer Vision, Lecture Notes in Computer Science. Springer, 2020.
- Tulyakov et al. (2020) Stepan Tulyakov, Alfredo Bochicchio, Daniel Gehrig, Stamatios Georgoulis, Yuanyou Li, and Davide Scaramuzza. Time Lens++: Event-based frame interpolation with parametric non-linear flow and multi-scale fusion. In Proceedings of the IEEE/CVF Conference on Computer Vision and Pattern Recognition, 2020.
- Tulyakov et al. (2021) Stepan Tulyakov, Daniel Gehrig, Stamatios Georgoulis, Julius Erbach, Mathias Gehrig, Yuanyou Li, and Davide Scaramuzza. Time Lens: Event-based video frame interpolation. In Proceedings of the IEEE/CVF Conference on Computer Vision and Pattern Recognition, 2021.
- Wallace (1992) Gregory K. Wallace. The JPEG still picture compression standard. IEEE Transactions on Consumer Electronics, 38(1):xviii–xxxiv, 1992.
- Wang et al. (2004) Zhou Wang, Alan C. Bovik, Hamid R. Sheikh, and Eero P. Simoncelli. Image quality assessment: From error visibility to structural similarity. IEEE Transactions on Image Processing, 13(4):600–612, 2004.
- Wiegand et al. (2003) Thomas Wiegand, Gary J. Sullivan, Gisle Bjøntegaard, and Ajay Luthra. Overview of the H.264/AVC video coding standard. IEEE Transactions on Circuits and Systems for Video Technology, 13(7):560–576, 2003.
- Wu et al. (2018) Chao-Yuan Wu, Nayan Singhal, and Philipp Krähenbühl. Video compression through image interpolation. In Proceedings of the 15th European Conference on Computer Vision, Lecture Notes in Computer Science. Springer, 2018.
- Xu et al. (2022) Haofei Xu, Jing Zhang, Jianfei Cai, Hamid Rezatofighi, and Dacheng Tao. Gmflow: Learning optical flow via global matching. In Proceedings of the IEEE/CVF Conference on Computer Vision and Pattern Recognition, 2022.
- Xue et al. (2019) Tianfan Xue, Baian Chen, Jiajun Wu, Donglai Wei, and William T. Freeman. Video enhancement with task-oriented flow. International Journal of Computer Vision, 127(8):1106–1125, 2019.
- Zhang et al. (2018) Richard Zhang, Phillip Isola, Alexei A Efros, Eli Shechtman, and Oliver Wang. The unreasonable effectiveness of deep features as a perceptual metric. In Proceedings of the IEEE/CVF Conference on Computer Vision and Pattern Recognition, 2018.
Appendix A Overview
This appendix provides additional details related to training and the architectural setup for reproducibility purposes, which were omitted in the main paper due to space limitations. We further report evaluations with additional metrics and visualizations of the computed flow. The supplemental video333Available at https://github.com/visinf/fldr-vfi. contains additional, temporal visual results and comparisons.
Appendix B Training Details
We give here the full formulas for the used loss functions. The total loss in Eq. 6 consists of
| (7) | ||||
| (8) | ||||
| (9) |
where , , , , , and define the scale, the channel index, an edge weighting factor, a spatial coordinate, the weighting factors, and the forward warping function, respectively. The values for the hyperparameters are given in Tab. 5.
| 3 | 150 | 0.125 | 0.5 |
As mentioned in the occlusion estimation in Sec. 4, we apply the softmax function along the last dimension of the weighting map, creating a probability distribution for every output pixel. Using the softmax function allows for temperature scaling (Guo et al., 2017), for which we divide the estimated occlusion map by the scalar temperature parameter before taking the softmax. This allows to soften the distribution or make it more peaked, depending on whether its greater or smaller than . After training the full pipeline with and , we additionally end-to-end optimize for while keeping all other parameters fixed. We finetune with a learning rate of using the mean-squared-error of the image reconstruction loss for 10 epochs.
Appendix C Network Architecture
Tabs. 6 and 7 list the details of our flow estimation network for the coarsest scale and all higher levels, respectively. After each convolutional layer, ReLU nonlinearities (Nair and Hinton, 2010) are applied except for conv2d_7 in Tab. 6, and conv2d_3i and conv2d_8 in Tab. 7. The kernel size of each convolutional layer is . Layer conv2d_1 and conv2d_2 in Tabs. 6 and 7 share their parameters, as well as conv2d_30 and conv2d_31 in Tab. 7. , is the result of our finetuned linear dimensionality reduction (fLDR) of image and at scale , i. e. .
Tab. 7 shows the architecture of our flow estimation network for , with and defined as follows:
| (10) | ||||
| (11) |
where and are the estimated, bidirectional flows from the previous, coarser scale and as well as are the outputs of the convolutional layer conv2d_2, split along the channel dimension, such that they represent the features of input image and , respectively. The flow has been upscaled () bilinearly.
The configuration of the occlusion estimation network is listed in Tab. 8. After each convolutional layer, ReLU nonlinearities (Nair and Hinton, 2010) are applied except for layer dec_3.
| Layer name | Input | # Channels In/Out | Reuse weights |
|---|---|---|---|
| conv2d_1 | False | ||
| conv2d_2 | conv2d_1 | False | |
| conv2d_3 | conv2d_2 + | False | |
| conv2d_4 | conv2d_3 | False | |
| conv2d_5 | conv2d_4 | False | |
| conv2d_6 | conv2d_5 | False | |
| conv2d_7 | conv2d_6 | False |
| Layer name | Input | # Channels In/Out | Reuse weights |
|---|---|---|---|
| conv2d_1 | conv2d_1 (Tab. 6) | ||
| conv2d_2 | conv2d_1 | conv2d_2 (Tab. 6) | |
| conv2d_30 | False | ||
| conv2d_31 | conv2d_30 | ||
| conv2d_4 | [] | False | |
| conv2d_5 | conv2d_4 | False | |
| conv2d_6 | conv2d_5 | False | |
| conv2d_7 | conv2d_6 | False | |
| conv2d_8 | conv2d_7 | False |
| Layer name | Filter Size | # Input Filters | # Output Filters |
|---|---|---|---|
| enc_0 | |||
| enc_1 | |||
| enc_2 | |||
| dec_0 | 64 | ||
| dec_1 | |||
| dec_2 | |||
| dec_3 |
Appendix D Quantitative Results
In Tab. 9 we provide, in addition to the PSNR values in Tab. 2, a quantitative analysis with SSIM (Wang et al., 2004), LPIPS Zhang et al. (2018), and inference time, where possible. We can only measure the inference time for models where we have the code and which are running on our Nvidia 3080Ti (12GB) GPU. Unfortunately, XVFI with scales run out of memory on our GPU with 12 GB and the error metric computation has been computed on CPU. We, therefore, provide the inference time only for (‡). We did not optimize our method for inference time. Nevertheless, we obtain inference times comparable to most of the other methods. M2M-PWC downscales the input image first by a factor of , leading to faster inference.
| Xiph-4K | X-Test | Inter4K-S | Inter4K-L | Inference (in s/f) | |
|---|---|---|---|---|---|
| M2M-PWC Hu et al. (2022) | 0.949/0.219 | 0.914/0.086 | 0.942/0.076 | 0.883/0.145 | 0.21 |
| RIFE Huang et al. (2022) | 0.910/0.171 | 0.793/0.227 | 0.894/0.117 | 0.826/0.196 | 0.40 |
| RIFEm Huang et al. (2022) | 0.904/0.228 | 0.751/0.260 | 0.893/0.123 | 0.829/0.197 | 0.40 |
| XVFI⋄ Sim et al. (2021) | 0.910/0.175 | 0.874/0.085 | 0.915/0.085 | 0.850/0.145 | 0.66‡/ N/A |
| Ours | 0.913/0.144 | 0.871/0.099 | 0.917/0.084 | 0.904/0.139 | 0.50‡/0.51 |
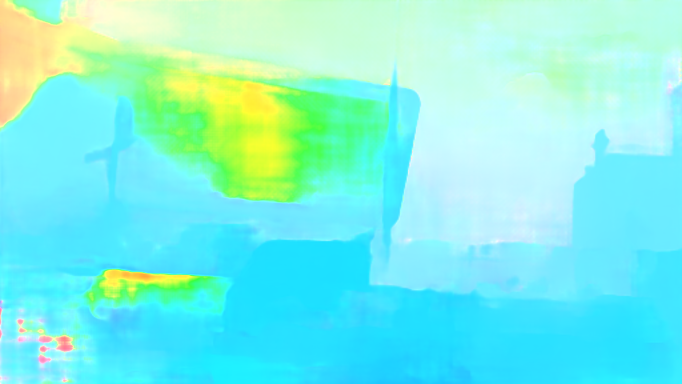
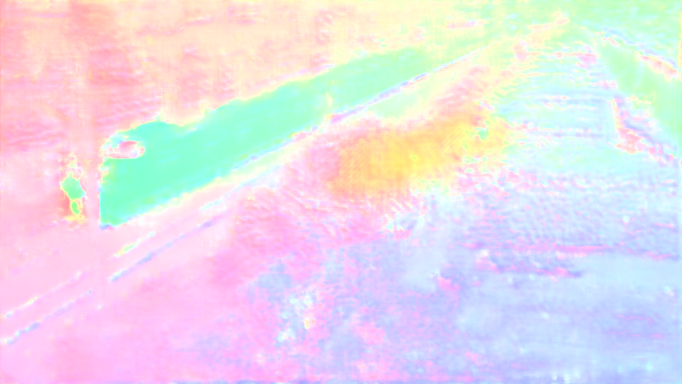
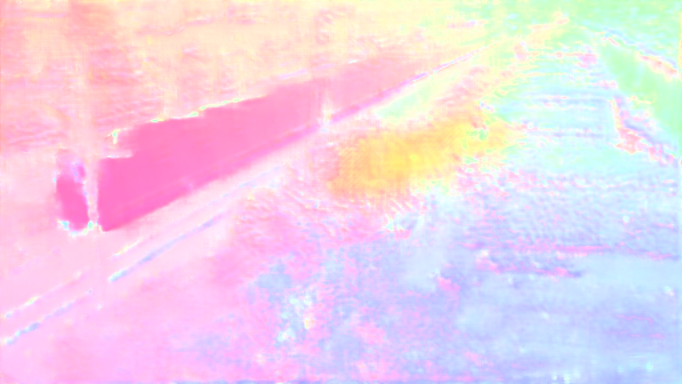
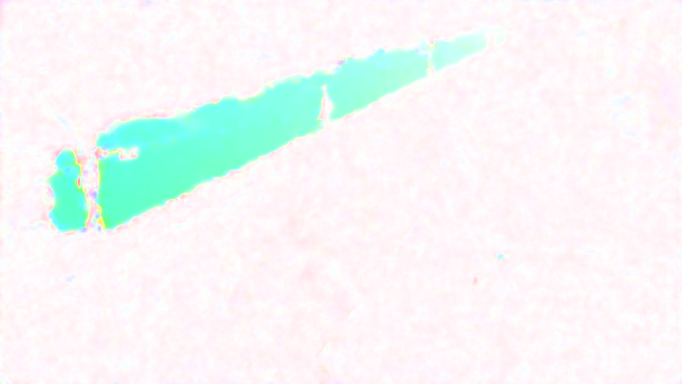
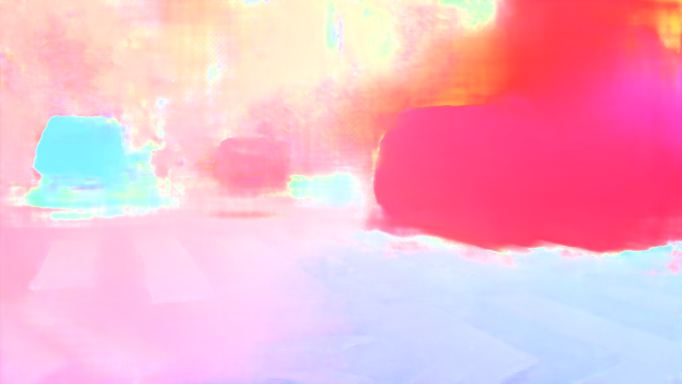
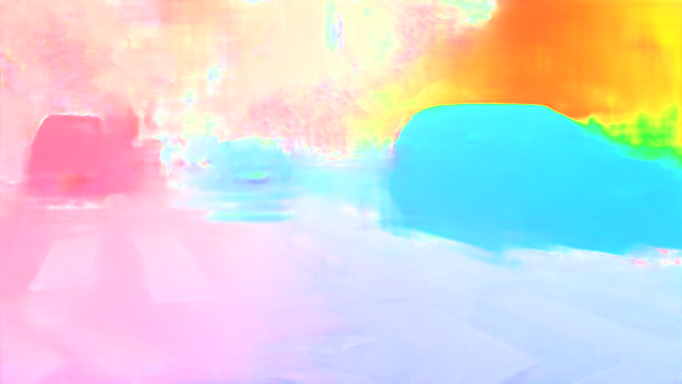
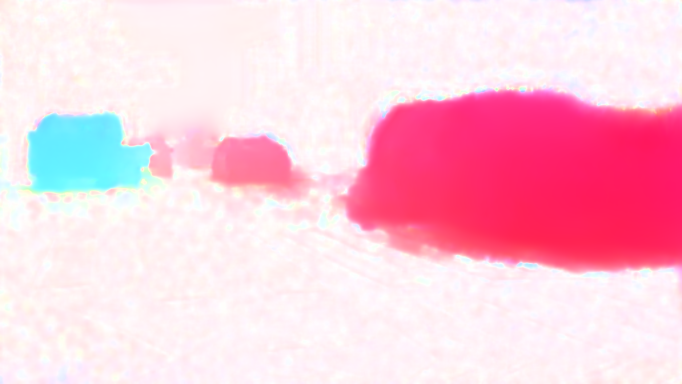
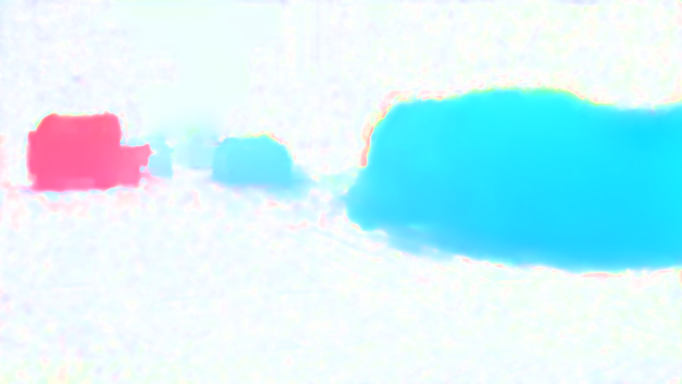
Appendix E Optical Flow Visualizations
In Fig. 5 we show some visualizations of our predicted flow in comparison to the computationally more expensive pretrained PWC-Net (Sun et al., 2018) often used in frame interpolation methods (Niklaus and Liu, 2020; Hu et al., 2022). However, the flow shown here, is computed with the original PWC-Net without yet finetuning for the task of frame interpolation as this depends on the used frame interpolation method.