3D sympathetic cooling and detection of levitated nanoparticles
Abstract
Cooling the center-of-mass motion of levitated nanoparticles provides a route to quantum experiments at mesoscopic scales. Here we demonstrate three-dimensional sympathetic cooling and detection of the center-of-mass motion of a levitated silica nanoparticle. The nanoparticle is electrostatically coupled to a feedback-cooled particle while both particles are trapped in the same Paul trap. We identify two regimes, based on the strength of the cooling: in the first regime, the sympathetically cooled particle thermalizes with the directly cooled one, while in the second regime, the sympathetically cooled particle reaches a minimum temperature. This result provides a route to efficiently cool and detect particles that cannot be illuminated with strong laser light, such as absorptive particles, and paves the way for controlling the motion of arrays of several trapped nanoparticles.
Levitated particles are a promising experimental platform for testing fundamental physics and detecting weak forces [1, 2, 3]. Having recently entered the quantum regime [4, 5, 6, 7], levitated particles offer a means to study quantum mechanics at mesoscopic scales and to build sensors with quantum-enhanced sensitivity. In particular, it has been proposed to use levitated particles with internal degrees of freedom, such as magnetic particles or nanodiamonds with color centers, to create macroscopic superposition states [8, 9] and to study spin-mechanical coupling [10]. However, optical trapping of such absorptive particles in high and ultra-high vacuum is challenging due to the increase in their bulk temperature, which can lead to burning and graphitization [11, 12, 13]. Moreover, in the quantum regime, elevated internal temperature is associated with the decoherence of the center-of-mass (CoM) motion [14]. Electrodynamic levitation removes the trapping laser field as a heating mechanism and has already been employed to trap absorptive particles [12, 15, 16, 17]. Nonetheless, state-of-the-art experiments with electrodynamic traps still rely on laser fields to cool [18, 19] and interrogate the particle [15, 20].
Sympathetic methods provide a solution: if an absorptive particle is electrostatically coupled to one or more transparent particles, cooling and detection of the absorptive particle can be achieved when only the transparent particles are exposed to laser light; the absorptive particle remains in the dark. Sympathetic cooling has been realized in experiments with neutral atoms [21], atomic ions [22], molecular ions [23], positrons [24] and proteins [25], while sympathetic detection has made possible indirect observation of ions in a Paul trap [23, 26]. Recently, one-dimensional sympathetic cooling has been demonstrated with two levitated micro- and nanoparticles coupled via electrostatic [27, 28] or light forces [29]. However, stabilization of the motion in the two remaining dimensions is still necessary to counteract trapping instabilities [4, 5, 6, 7]. Moreover, in order to understand whether sympathetic cooling will be sufficient to reach the quantum regime with absorptive particles, the limitations of the technique need to be studied. Finally, sympathetic detection has not previously been demonstrated for mesoscopic particles.
Here we report on sympathetic cooling and detection along all three spatial axes in a system of two levitated mesoscopic particles. We investigate different regimes of the feedback cooling strength and identify the optimum strategy to achieve the minimum temperature of the sympathetically cooled particle. Finally, we reconstruct the motion of a levitated particle via interaction with an auxiliary particle present in the trap. In this proof-of-principle demonstration, both particles are transparent to laser radiation, but it is possible to extend the same techniques to particles with arbitrary optical properties. Optimal detection and cooling along all three axes of motion thus paves the way for experiments with absorptive particles in high and ultra-high vacuum and provides a tool to control the motion of arrays of several particles, which could be used in the search for dark matter [30, 31, 32] and in investigations of quantum gravity [33].
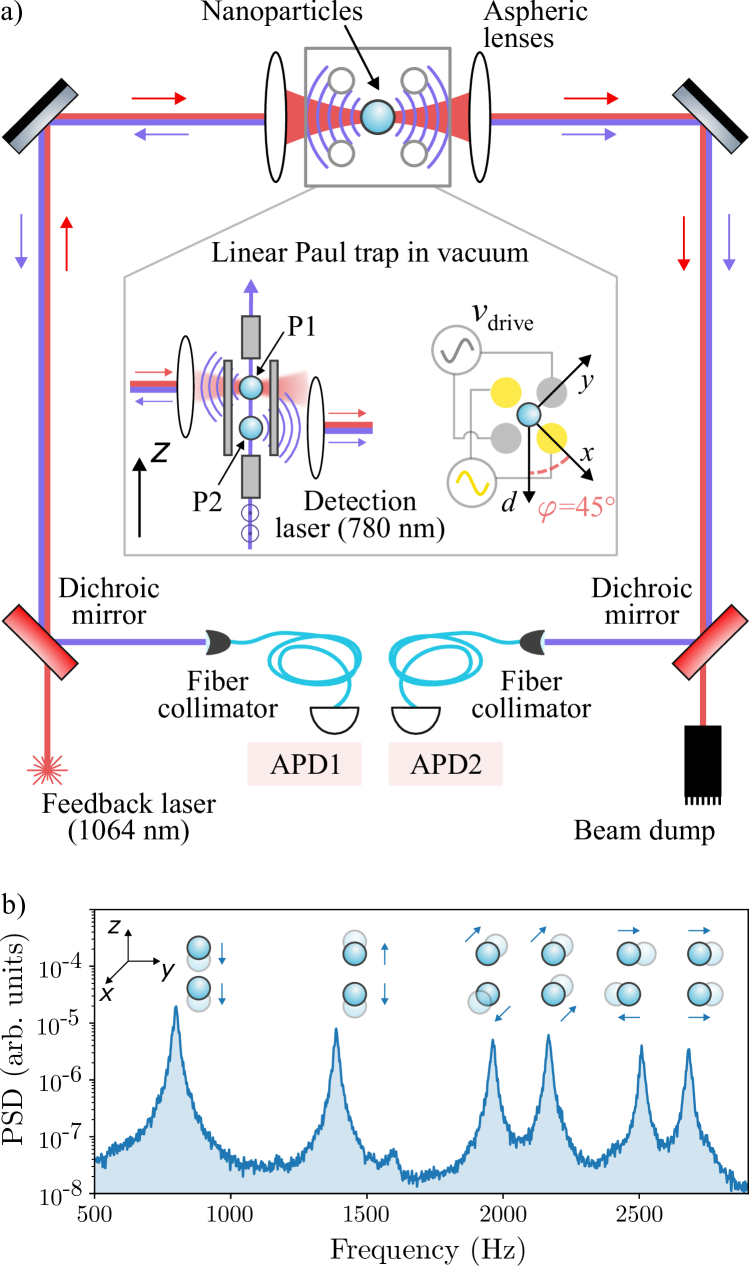
A schematic of the experimental setup is shown in Fig. 1a. We levitate a pair of silica spheres in diameter (Bangs Laboratories, Inc.) in a linear Paul trap at pressures between and . Each particle carries lementary charges 111See Supplemental Material at [ref. from the journal] for more details on equations of motion, temperature estimation, thermally driven oscillations, particle charging, characterization of the particles, and the transfer function for sympathetic detection, including Refs. [43, 44, 45, 46, 18]. The distance between opposing radiofrequency (RF) electrodes is , while the distance between the endcap electrodes is . We drive the trap with a peak-to-peak voltage of at and a DC offset on the RF electrodes of . The DC voltage on the endcaps is varied between and , depending on the experiment. The endcap voltage sets the distance between the two particles and thus the strength of their electrostatic interaction.
In order to verify sympathetic cooling and detection, we measure the position of each particle independently via optical detection. The endcap electrodes are hollow cylinders, through which a weakly focused laser beam at illuminates the particles (Fig. 1a). Light scattered by the particles is collected by a pair of aspheric lenses and guided to fiber collimators. One lens collects light from the top particle, P1, while the second lens collects light from the bottom particle, P2; each lens and collimator image their particle on the end facet of a fiber. The power coupled into each fiber depends on the particle position [35, 36] and is measured with avalanche photodiodes (Thorlabs APD440A). A linear relationship between the position of each particle and the photodiode signal is achieved by displacing the image to one side of the fiber core. Cross-talk between the detection channels is below the detection noise. We choose this detection scheme for its simplicity; we find that it has roughly the same sensitivity () as that of the standard scheme based on the interference of forward-scattered light and a Gaussian reference beam, although we have not made a detailed comparison of the two schemes’ efficiencies. From the equations of motion of two coupled harmonic oscillators, one finds two eigenmodes of oscillation along each spatial axis , corresponding to the particles’ collective in-phase and out-of-phase motion [34].
Figure 1b shows an example of the power spectral density (PSD) of particle P2’s center-of-mass motion, in which each peak corresponds to an eigenmode. The frequencies of these modes are .
A second laser beam at is coupled through a dichroic mirror and focused onto particle P1. The laser power is modulated with an acousto-optic modulator (not shown) controlled via a field-programmable gate array (FPGA). This configuration allows us to apply optical cold damping to P1 [18].
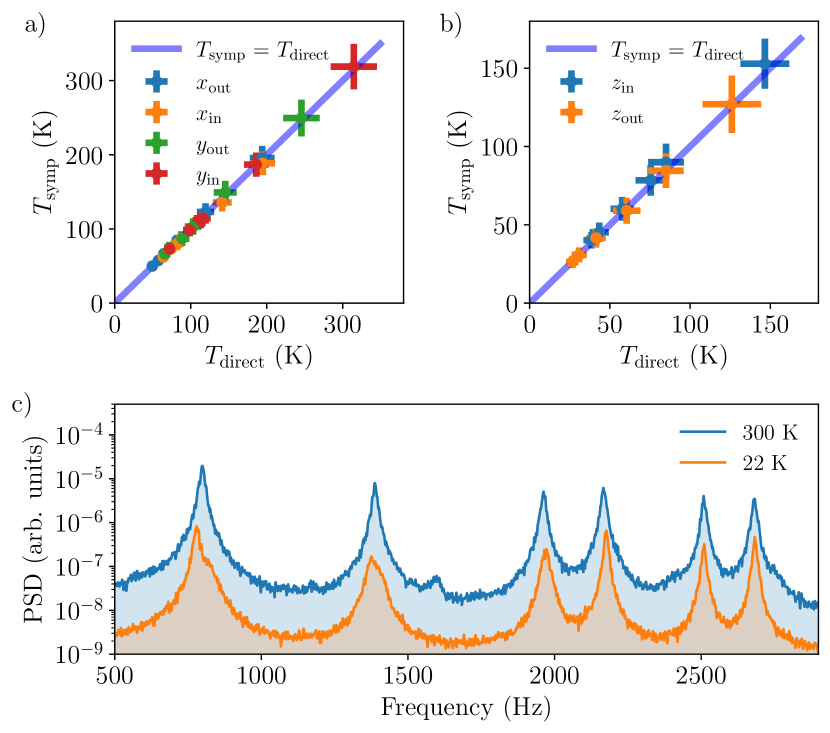
Having reviewed the setup, we now present experimental results on sympathetic cooling of particle P2. All data presented in the current manuscript were obtained with the same pair of nanoparticles; the nanoparticles have the same size and the same charge [34]. We start with an analysis of the weak cooling regime. In this case, the rate of feedback cooling applied to particle P1 along axis is much smaller than the frequency splitting between the collective oscillation modes: . Here , is a coupling constant and is the resonance frequency of a single particle in the Paul trap along axis [34]. We study the cooling of each mode individually. The motional temperature of P1 is set via the strength of the cold damping, which is controlled by the feedback gain on the FPGA. For each setting of the feedback gain, we determine the temperatures of both P1 (directly cooled) and P2 (sympathetically cooled) by fitting the PSD with a Lorentzian function [34]. Figures 2a and 2b show the dependence of the temperature of P2 on the temperature of P1 for each collective mode. In this regime, we find that the temperatures of the effective CoM motion of the two particles are equal, that is, the temperature of P1 is fully transferred to P2. This result is consistent with the transfer of energy between the particles being significantly faster than the cooling rate of the directly cooled particle. The minimum temperatures shown in Fig. 2 are determined by the feedback gain set via the FPGA and by the background gas pressure. We choose to work at for convenience: this pressure makes the trapping robust against accidental excitation of the motion (and subsequent loss of the particles) while still allowing us to work in the weak cooling regime. There are no intrinsic limitations to extending sympathetic cooling to lower pressures [28].
It is possible to sympathetically cool not only individual modes but also all six degrees of freedom simultaneously. To this end, we apply cold damping via six FPGAs, each configured to address a single mode. The six output signals of the FPGAs are mixed and used to modulate the power of the laser. Figure 2c compares the PSDs of the sympathetically cooled particle at room temperature and under the influence of feedback cooling. The room-temperature PSD is measured at , while the PSD of the cooled particle is obtained at . (We intended to take both data sets at the same pressure, but due to a citywide power failure, the particles were lost from the trap before we could do so.) The mean CoM temperature of the particle under feedback cooling is ; just as for the individual modes, it is determined by the feedback gain and the background gas pressure.
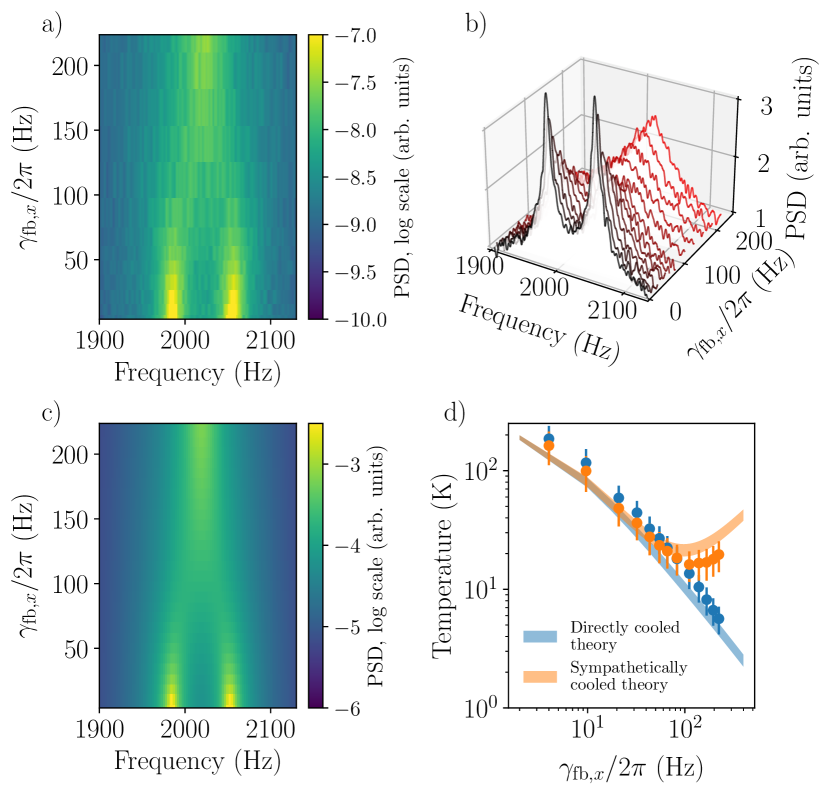
Next, we examine the regime of strong cooling. In this regime, the cooling rate is comparable to or larger than the normal-mode frequency difference: . We consider motion along the axis. By reducing the endcap voltage and thus increasing the particle separation, we reduce the mode splitting to ; we then vary the cooling rate from to and record PSDs of both particles’ motion. The cooling rate is determined as follows: In the weak cooling regime, fits of the mode linewidths allow us to extract cooling rates for a range of electronic gains [37]. We then have a known relationship between the electronic gain and the cooling rate that also applies in the strong cooling regime.
The PSD of the sympathetically cooled particle P2 as a function of the cooling rate is shown in Figs. 3a and 3b. For weak cooling, we observe two distinct peaks of the resonant motion. As the cooling rate is increased into the strong cooling regime, the peaks broaden and merge into a single peak, the height of which increases. A detailed theoretical analysis based on the model of coupled harmonic oscillators [34] shows that the two modes are still present. However, only one of them is not overdamped and thus is still visible in the PSD. We extend the model by coupling the oscillators to a thermal bath [34] and calculate PSDs for different feedback cooling rates. The resulting plot is shown in Fig. 3c. We find good agreement between the measured and the calculated evolution of the PSD, suggesting that the model captures the essential features of the cooling process.
With this understanding of the feedback cooling process in hand, we analyze the particles’ temperatures as a function of the cooling rate. Since the two individual modes cannot be resolved in the strong cooling regime, we calculate the effective temperature of motion along the axis from the area under the velocity PSD [34]. Figure 3d shows the extracted temperatures as a function of the cooling rate applied to the directly cooled particle P1. For cooling rates below the frequency of the normal-mode splitting, the two particles have equal temperatures, similar to the data shown in Fig. 1. As the cooling rate increases, the temperature of P1 continues to decrease monotonically, while the temperature of P2 reaches a minimum. We also plot the temperatures extracted from the calculated PSDs of Fig. 3c, which are in agreement with the experimental data.
To gain intuition about the origin of the temperature minimum under sympathetic cooling, one can consider the efficiency of the energy exchange between the two particles as coupled harmonic oscillators. First, this efficiency is limited by the coupling strength. In the strong cooling regime, we extract energy from P1 faster than it flows from P2 to P1. At this point, increasing the cooling rate further does not lower the temperature of P2. Second, two coupled oscillators exchange energy most efficiently when their bare resonance frequencies, i.e., in the absence of coupling, are equal. Damping applied to P1 shifts the particle’s bare resonance to a lower frequency than that of P2, making the energy exchange inefficient. As a result, in the strong cooling regime, the flow of energy from P2 to P1 is reduced.
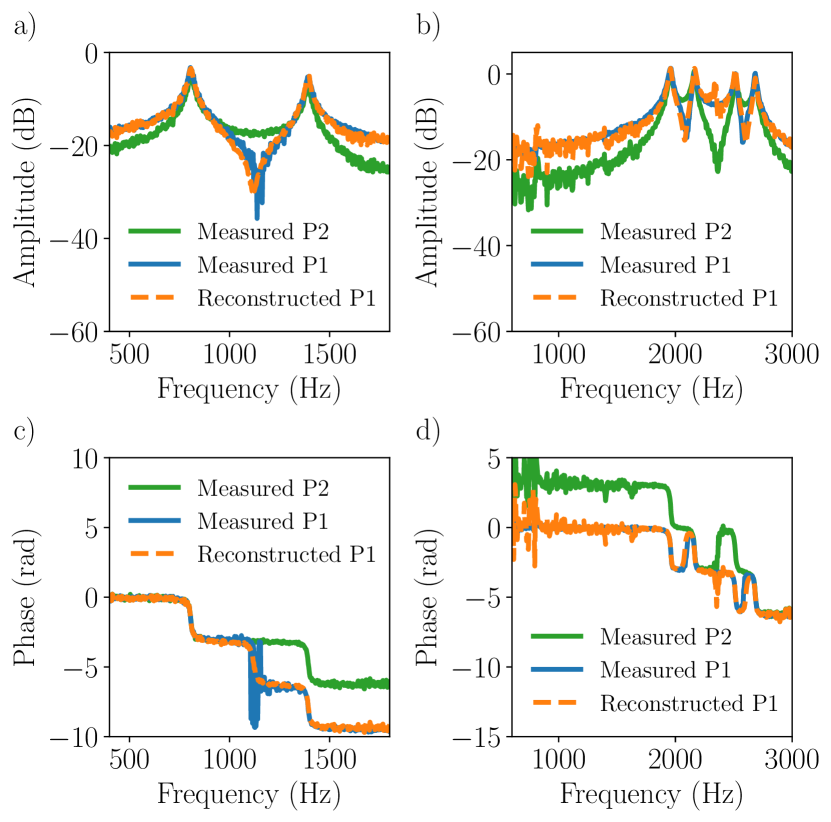
Not only can an auxiliary particle in an ion trap be exploited for sympathetic cooling, but also it can be used to detect the motion of the particle of interest, which is especially useful when that motion cannot be read out directly. We implement sympathetic detection, for which the roles of particles P1 and P2 are reversed: P2 is used to detect the motion of P1. We excite the motion of P1 by applying a sinusoidal optical force to it via the laser beam. No external driving force is applied to P2. We scan the frequency of the force and measure the amplitude and phase response of both particles, which are shown in Fig. 4. The amplitude response of P2 to the external drive of P1 allows us to calculate a transfer function that connects the motion of P1 and P2 [34]. From the transfer function, we reconstruct the amplitude and the phase response of P1 from the measurements of P2 via
| (1) |
where and are the amplitude and phase responses of the particles. The reconstructed response functions and , plotted in Fig. 4, are in excellent agreement with the independently measured values of P1, establishing that sympathetic detection can be used to reconstruct the motion of P1. The dip between the in-phase and out-of-phase modes in the amplitude response of P1 is due to destructive interference of the motion in those modes when one particle is driven, an effect analogous to electromagnetically induced transparency [38].
In conclusion, we have demonstrated both sympathetic cooling and detection of nanoparticles levitated in a Paul trap and coupled via electrostatic interaction. If the cooling rate is smaller than the normal-mode frequency difference, the temperature of the sympathetically cooled particles equals the temperature of the directly cooled particle. For higher cooling rates, the temperature of the sympathetically cooled particle reaches a minimum value due to reduced efficiency of the energy exchange between two coupled harmonic oscillators. Both methods pave the way for experiments with absorptive particles in high and ultra-high vacuum in the absence of light. For example, a nanodiamond with nitrogen vacancies could be co-trapped with a silica nanoparticle; both particles’ charge and mass could be calibrated at low vacuum, where the diamond is not significantly heated by laser light; subsequently, at ultra-high vacuum, the silica nanoparticle could be used to measure and control the motion of the nanodiamond. Furthermore, the technique provides a tool to detect and control the modes of collective oscillations of a string of particles by acting on just a single particle in the chain. Building on the spin-mechanical coupling recently demonstrated with a single levitated diamond hosting nitrogen-vacancy defects [39], our work opens up new experimental possibilities for realizing a quantum spin transducer based on levitated particles. Such particles could be used as long-lived quantum memories for quantum information applications [40, 41] or for force sensing below the standard quantum limit in the search for new physics [30, 31, 32].
Acknowledgements.
This work was supported by Austrian Science Fund (FWF) Projects No. W1259 and Y951, by the ESQ Discovery Grant “Sympathetic detection and cooling of nanoparticles levitated in a Paul trap” of the Austrian Academy of Sciences, and by the European Union’s Horizon 2020 research and innovation program under the Marie Skłodowska-Curie Grant Agreement No. 801110. Data underlying the results of this study are available at [42].References
- Neukirch and Vamivakas [2015] L. P. Neukirch and A. N. Vamivakas, Contemp. Phys 56, 48 (2015).
- Millen et al. [2020] J. Millen, T. S. Monteiro, R. Pettit, and A. N. Vamivakas, Rep. Prog. Phys 83, 026401 (2020).
- Gonzalez-Ballestero et al. [2021] C. Gonzalez-Ballestero, M. Aspelmeyer, L. Novotny, R. Quidant, and O. Romero-Isart, Science 374, eabg3027 (2021).
- Delić et al. [2020] U. Delić, M. Reisenbauer, K. Dare, D. Grass, V. Vuletić, N. Kiesel, and M. Aspelmeyer, Science 367, 892 (2020).
- Tebbenjohanns et al. [2020] F. Tebbenjohanns, M. Frimmer, V. Jain, D. Windey, and L. Novotny, Phys. Rev. Lett. 124, 013603 (2020).
- Tebbenjohanns et al. [2021] F. Tebbenjohanns, M. L. Mattana, M. Rossi, M. Frimmer, and L. Novotny, Nature 595, 378 (2021).
- Magrini et al. [2021] L. Magrini, P. Rosenzweig, C. Bach, A. Deutschmann-Olek, S. G. Hofer, S. Hong, N. Kiesel, A. Kugi, and M. Aspelmeyer, Nature 595, 373 (2021).
- Yin et al. [2013] Z.-q. Yin, T. Li, X. Zhang, and L. M. Duan, Phys. Rev. A 88, 033614 (2013).
- Scala et al. [2013] M. Scala, M. S. Kim, G. W. Morley, P. F. Barker, and S. Bose, Phys. Rev. Lett. 111, 180403 (2013).
- Wachter et al. [2021] V. Wachter, V. A. S. V. Bittencourt, S. Xie, S. Sharma, N. Joly, P. S. Russell, F. Marquardt, and S. V. Kusminskiy, J. Opt. Soc. Am. B 38, 3858 (2021).
- Neukirch et al. [2015] L. P. Neukirch, E. von Haartman, J. M. Rosenholm, and A. N. Vamivakas, Nat. Photonics 9, 653–657 (2015).
- Delord et al. [2017] T. Delord, L. Nicolas, M. Bodini, and G. Hétet, Appl. Phys. Lett. 111, 013101 (2017).
- Rahman et al. [2016] A. T. M. A. Rahman, A. C. Frangeskou, M. S. Kim, S. Bose, G. W. Morley, and P. F. Barker, Sci. Rep 6, 21633 (2016).
- Kaltenbaek et al. [2016] R. Kaltenbaek, M. Aspelmeyer, P. F. Barker, A. Bassi, J. Bateman, K. Bongs, S. Bose, C. Braxmaier, Č. Brukner, B. Christophe, M. Chwalla, P.-F. Cohadon, A. M. Cruise, C. Curceanu, K. Dholakia, L. Diósi, K. Döringshoff, W. Ertmer, J. Gieseler, N. Gürlebeck, G. Hechenblaikner, A. Heidmann, S. Herrmann, S. Hossenfelder, U. Johann, N. Kiesel, M. Kim, C. Lämmerzahl, A. Lambrecht, M. Mazilu, G. J. Milburn, H. Müller, L. Novotny, M. Paternostro, A. Peters, I. Pikovski, A. P. Zanoni, E. M. Rasel, S. Reynaud, C. J. Riedel, M. Rodrigues, L. Rondin, A. Roura, W. P. Schleich, J. Schmiedmayer, T. Schuldt, K. C. Schwab, M. Tajmar, G. M. Tino, H. Ulbricht, R. Ursin, and V. Vedral, EPJ Quantum Technol. 3, 1 (2016).
- Conangla et al. [2018] G. P. Conangla, A. W. Schell, R. A. Rica, and R. Quidant, Nano Lett. 18, 3956 (2018).
- Kuhlicke et al. [2014] A. Kuhlicke, A. W. Schell, J. Zoll, and O. Benson, Appl. Phys. Lett. 105, 073101 (2014).
- Nagornykh et al. [2017] P. Nagornykh, J. E. Coppock, J. P. J. Murphy, and B. E. Kane, Phys. Rev. B 96, 035402 (2017).
- Dania et al. [2021] L. Dania, D. S. Bykov, M. Knoll, P. Mestres, and T. E. Northup, Phys. Rev. Research 3, 013018 (2021).
- Millen et al. [2015] J. Millen, P. Z. G. Fonseca, T. Mavrogordatos, T. S. Monteiro, and P. F. Barker, Phys. Rev. Lett. 114, 123602 (2015).
- Nagornykh et al. [2015] P. Nagornykh, J. E. Coppock, and B. E. Kane, Appl. Phys. Lett. 106, 244102 (2015).
- Myatt et al. [1997] C. J. Myatt, E. A. Burt, R. W. Ghrist, E. A. Cornell, and C. E. Wieman, Phys. Rev. Lett. 78, 586 (1997).
- Bruzewicz et al. [2019] C. D. Bruzewicz, J. Chiaverini, R. McConnell, and J. M. Sage, Appl. Phys. Rev. 6, 021314 (2019).
- Willitsch [2012] S. Willitsch, Int Rev Phys Chem 31, 175 (2012).
- Baker et al. [2021] C. J. Baker, W. Bertsche, A. Capra, C. L. Cesar, M. Charlton, A. C. Mathad, S. Eriksson, A. Evans, N. Evetts, S. Fabbri, J. Fajans, T. Friesen, M. C. Fujiwara, P. Grandemange, P. Granum, J. S. Hangst, M. E. Hayden, D. Hodgkinson, C. A. Isaac, M. A. Johnson, J. M. Jones, S. A. Jones, S. Jonsell, L. Kurchaninov, N. Madsen, D. Maxwell, J. T. K. McKenna, S. Menary, T. Momose, P. Mullan, K. Olchanski, A. Olin, J. Peszka, A. Powell, P. Pusa, C. Ø. Rasmussen, F. Robicheaux, R. L. Sacramento, M. Sameed, E. Sarid, D. M. Silveira, G. Stutter, C. So, T. D. Tharp, R. I. Thompson, D. P. van der Werf, and J. S. Wurtele, Nat. Commun. 12, 6139 (2021).
- Offenberg et al. [2008] D. Offenberg, C. B. Zhang, C. Wellers, B. Roth, and S. Schiller, Phys. Rev. A 78, 061401 (2008).
- Guggemos et al. [2015] M. Guggemos, D. Heinrich, O. A. Herrera-Sancho, R. Blatt, and C. F. Roos, New J. Phys. 17, 103001 (2015).
- Slezak and D’Urso [2019] B. R. Slezak and B. D’Urso, Appl. Phys. Lett. 114, 244102 (2019).
- Penny et al. [2023] T. W. Penny, A. Pontin, and P. F. Barker, Phys. Rev. Res. 5, 013070 (2023).
- Arita et al. [2022] Y. Arita, G. D. Bruce, E. M. Wright, S. H. Simpson, P. Zemánek, and K. Dholakia, Optica 9, 1000 (2022).
- Moore and Geraci [2021] D. C. Moore and A. A. Geraci, Quantum Sci. and Technol. 6, 014008 (2021).
- Carney et al. [2021] D. Carney, G. Krnjaic, D. C. Moore, C. A. Regal, G. Afek, S. Bhave, B. Brubaker, T. Corbitt, J. Cripe, N. Crisosto, A. Geraci, S. Ghosh, J. G. E. Harris, A. Hook, E. W. Kolb, J. Kunjummen, R. F. Lang, T. Li, T. Lin, Z. Liu, J. Lykken, L. Magrini, J. Manley, N. Matsumoto, A. Monte, F. Monteiro, T. Purdy, C. J. Riedel, R. Singh, S. Singh, K. Sinha, J. M. Taylor, J. Qin, D. J. Wilson, and Y. Zhao, Quantum Sci. Technol. 6, 024002 (2021).
- Afek et al. [2022] G. Afek, D. Carney, and D. C. Moore, Phys. Rev. Lett. 128, 101301 (2022).
- Bose et al. [2017] S. Bose, A. Mazumdar, G. W. Morley, H. Ulbricht, M. Toroš, M. Paternostro, A. A. Geraci, P. F. Barker, M. S. Kim, and G. Milburn, Phys. Rev. Lett. 119, 240401 (2017).
- Note [1] See Supplemental Material at [ref. from the journal] for more details on equations of motion, temperature estimation, thermally driven oscillations, particle charging, characterization of the particles, and the transfer function for sympathetic detection, including Refs. [43, 44, 45, 46, 18].
- Vamivakas et al. [2007] A. N. Vamivakas, S. B. Ippolito, A. K. Swan, M. S. Ünlü, M. Dogan, E. R. Behringer, and B. B. Goldberg, Opt. Lett. 32, 970 (2007).
- Xiong et al. [2021] F. Xiong, P. Yin, T. Wu, H. Xie, R. Li, Y. Leng, Y. Li, C. Duan, X. Kong, P. Huang, and J. Du, Phys. Rev. Appl 16, L011003 (2021).
- Zanette [2018] D. H. Zanette, J. Phys. Commun. 2, 095015 (2018).
- Alzar et al. [2002] C. L. G. Alzar, M. A. G. Martinez, and P. Nussenzveig, Am. J. Phys. 70, 37 (2002).
- Delord et al. [2020] T. Delord, P. Huillery, L. Nicolas, and G. Hétet, Nature 580, 56 (2020).
- Rabl et al. [2010] P. Rabl, S. J. Kolkowitz, F. H. L. Koppens, J. G. E. Harris, P. Zoller, and M. D. Lukin, Nature Physics 6, 602 (2010).
- Rosenfeld et al. [2021] E. Rosenfeld, R. Riedinger, J. Gieseler, M. Schuetz, and M. D. Lukin, Phys. Rev. Lett. 126, 250505 (2021).
- Bykov et al. [2022] D. S. Bykov, L. Dania, F. Goschin, and T. E. Northup, 10.5281/zenodo.7225126 (2022).
- Berkeland et al. [1998] D. J. Berkeland, J. D. Miller, J. C. Bergquist, W. M. Itano, and D. J. Wineland, J. Appl. Phys. 83, 5025 (1998).
- Politzer [2015] D. Politzer, Am. J. Phys. 83, 395 (2015).
- Wübbena et al. [2012] J. B. Wübbena, S. Amairi, O. Mandel, and P. O. Schmidt, Phys. Rev. A 85, 043412 (2012).
- Hebestreit et al. [2018] E. Hebestreit, M. Frimmer, R. Reimann, C. Dellago, F. Ricci, and L. Novotny, Rev. Sci. Instrum. 89, 033111 (2018).