Transition-Edge Sensors for cryogenic X-ray imaging spectrometers
Abstract
Large arrays of superconducting transition-edge sensor (TES) microcalorimeters are becoming the key technology for future space-based X-ray observatories and ground-based experiments in the fields of astrophysics, laboratory astrophysics, plasma physics, particle physics and material analysis. Thanks to their sharp superconducting-to-normal transition, TESs can achieve very high sensitivity in detecting small temperature changes at very low temperature. TES based X-ray detectors are non-dispersive spectrometers bringing together high resolving power, imaging capability and high-quantum efficiency simultaneously. In this chapter, we highlight the basic principles behind the operation and design of TESs, and their fundamental noise limits. We will further elaborate on the key fundamental physics processes that guide the design and optimization of the detector. We will then describe pulse-processing and important calibration considerations for space flight instruments, before introducing novel multi-pixel TES designs and discussing applications in future X-ray space missions over the coming decades.
Keywords:
I1 Keywords
maging spectroscopy, transition-edge sensor, microcalorimeter array, superconductivity, weak-link, X-ray astrophysics, laboratory astrophysics.
2 Introduction
X-ray spectroscopy provides an excellent diagnostic probe of the energetics and physical conditions in nearly all classes of cosmic objects throughout the observable universe. X-rays are emitted by various high-energy processes. By observing their spectra we can obtain information about the temperature, electron density and ionic composition of hot plasma’s, and answer many questions across astrophysics (from understanding turbulence in galaxy clusters to the accretion processes in binary systems or active galactic nuclei.)
Microcalorimeters are non-dispersive thermal detectors that will provide the next major step in imaging spectroscopy capabilities compared to gas proportional counters or charge coupled devices (CCD) which have been extensively used in X-ray space instrumentation over the past several decades. Microcalorimeters will full-fill the needs of X-ray astrophysics in the 21st century, combining eV level energy resolution in the soft X-ray energy range in large format imaging arrays with potentially 1000’s of pixels. With resolving powers 1000, microcalorimeters are competitive with dispersive grating spectrometers, but with the advantage of high collection efficiency. This enables efficient observations of point sources and extended sources with the same instrument. The sensor technology used in microcalorimeters can come in different forms - silicon thermistors, transition-edge sensors (TESs) and magnetic microcalorimeters (MMCs) - but the basic principle is the same. A microcalorimeter measures the temperature rise resulting from the energy deposited by a single X-ray photon. The sensor transduces the change in temperature to an electrical signal (either through a resistance change for thermistors and TESs or a change in magnetism for MMCs), from which the photon energy can then be determined. In order to achieve resolving powers of 1000’s at keV energies, extremely low detector noise is required, only achievable when operating at mK temperatures. The potential power of microcalorimeters to revolutionize X-ray astrophysics has already been demonstrated by the observation of the Perseus galaxy cluster by the Hitomi satellite’s Soft X-ray Imaging Spectrometer (SXS) Hitomi Collaboration et al. (2016).
In this chapter, we describe microcalorimeters based around highly sensitive transition-edge-sensors (TESs). TESs are next generation microcalorimeters based on a thin superconducting film that is electrically biased in the narrow region between superconducting (zero-resistance) state and the normal resistive state. The transition region is typically only a few mK in width and as such, TES detectors are extremely sensitive to temperature changes making them ideal detectors for high resolution X-ray spectroscopy. We start by outlining the basic principles behind the operation and design of TESs, and their fundamental noise limits. We will elaborate on the key fundamental physics effects that guide the design and optimization of the TESs. We will then describe important calibration considerations for space flight instruments. We will continue by introducing novel multi-pixel TES designs and conclude the chapter by presenting the applications in future X-ray space missions over the coming decades.
3 Theoretical and Experimental Background
3.1 Basic Principles
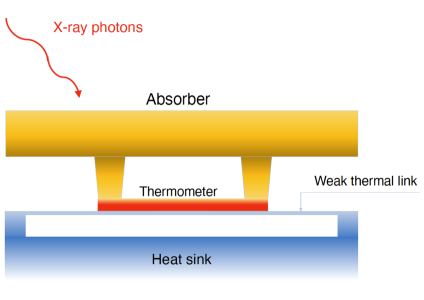
A TES-based X-ray detector is a thermal equilibrium calorimeter. It consists of three fundamental components: an absorber with heat capacity , a thermometer (the TES), and a weak thermal link, with a conductivity , to the heat sink at temperature , which is below the operating temperature of the device. Details on the design of each of these components is described in Section 4. A simplified scheme of a TES calorimeter is shown in Fig. (1).
TESs are based on superconducting thin films, voltage biased in the narrow transition region between the onset of resistance and the fully normal state. A single photon deposits its energy into the absorber, which converts it into heat. The temperature rise, proportional to the energy, causes a change in resistance of the TES. The resistance change is determined by monitoring the current through the TES using a superconducting quantum interference device (SQUID) ammeter. Within this general description, there is room for countless variations. Important device parameters such as the noise, and are strongly dependent on the operating temperature of the device. Thus, the transition temperature of the TES must be chosen to achieve the desired energy resolution and response time, whilst being compatible with the instrument cryogenic architecture. For typical astrophysics applications a transition temperature of below 100 mK is ideal.
Thermal equilibrium detectors can achieve excellent energy resolution. A fundamental limit for the minimum energy resolution offered by a calorimeter is given by the random exchange of energy between the detector and the thermal bath McCammon (2005). This thermodynamic limit is given by . It depends quadratically on the temperature of the calorimeter, linearly on the detector heat capacity , and it is independent on the thermal conductance of the thermal link.
The ultimate sensitivity of a TES microcalorimeter depends on the shape of the TES superconducting-to-normal transition and the intrinsic noise sources of the detector and the read-out circuit. The resistance, , of a TES is generally a function of both the temperature of the device, , and the current flowing through it, . For small changes about the equilibrium bias conditions () the device resistance can be expressed as
| (1) |
The two dimensionless parameters and , calculated at a constant current and temperature respectively, are conveniently used to parameterize the current and temperature sensitivity of the resistive transition at the operating point Lindeman et al. (2004a).
The energy resolution of an ideal TES calorimeter, limited only by the fundamental thermal fluctuations due to the exchange of energy between the calorimeter and the thermal bath, is given by McCammon (2005)
| (2) |
where the logarithmic derivative of resistance , introduced above, describes the steepness of the superconducting transition. By developing TESs with a large temperature sensitivity , the photon energy can be measured with a much higher resolution than the magnitude set by thermodynamic fluctuations. Eq. (2) tells us that low heat capacity devices, operating at very low temperature , could achieve very high energy resolution. However, the value of , and are constrained by the maximum energy to be detected. For high energetic photons, the temperature excursion could be so high to drive the TES in the normal state and to saturate the detector. The saturation energy is proportional to , which effectively means that the theoretical energy resolution .
A detail analysis of the noise, the electrothermal response and the ultimate sensitivity of a TES microcalorimeter will be presented in the following sections.
3.2 TES Electrical and Thermal Response
A TES detector can be electrically voltage biased in its transition region using either an AC or DC voltage biasing scheme. Although the design of the electrical bias circuit is naturally different for the two approaches, the resulting electrothermal behaviour of the TES is generally equivalent. Whether a TES is AC or DC biased can, however, affect the transition shape and noise properties of the device and may lead to different optimal pixel designs Gottardi and Nagayashi (2021).
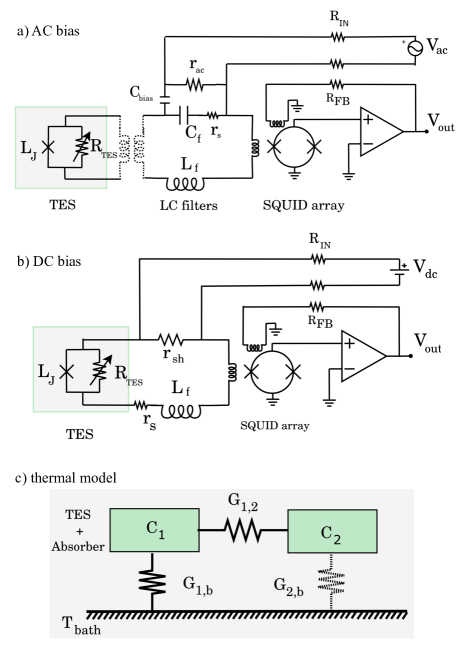
A schematic diagram of the AC and DC bias read-out circuit and the detector thermal model are shown in Fig. (2). The fundamental difference between the two bias configurations is that, in the AC bias case, the TES is brought into transition by the rms power generated by an alternating voltage at few MHz frequency, while in the DC bias case a constant voltage is applied.
Under AC bias the TES is placed in series with a high- superconducting filter Bruijn et al. (2018, 2014) and the input coil of the SQUID current amplifier Kiviranta et al. (2002). An optional superconducting transformer, shown in the picture in dashed lines, could be used to optimize the impedance matching between detector and amplifier. The AC voltage bias, tuned at the filter resonant frequency , is provided via a capacitive divider in parallel with an AC shunt resistor. From a simple Thevenin equivalent circuit analysis, the bias network is equivalent to a shunt resistance , in series with the resonator, where accounts for the intrinsic loss in the -filters Gottardi et al. (2019a). The DC bias circuit is shown in Fig. (2)b. where is the Nyquist inductor added to limit the read-out bandwidth, is a low ohmic shunt resistors needed to provide a stiff dc voltage bias to the TES, and indicates any parasitic resistance in the bias circuit. Both for the AC and DC read-out the following should hold: . The standard electrothermal linear model that describes the noise and the small signal response to photons of a DC biased TES calorimeter has been extensively presented and analysed in the literature Irwin and Hilton (2005); Lindeman et al. (2004a). The formalism for the AC biased case was first reported by van der Kuur, J. et al. in van der Kuur et al. (2011). In this model, the TES resistance is linearly approximated as in Eq. (1) with no assumptions made on the physical phenomena occurring at the superconducting transition. This simplified model has been successfully used to understand the behaviour of TES-based detectors in many works that followed. As observed in many experiments Takei et al. (2008); Kinnunen et al. (2012); Maasilta (2012); Goldie et al. (2009); Wakeham et al. (2019), due to the presence of parasitic heat capacitance and a limited thermal conductance in the TES-absorber structures, a single-body thermal model for a TES calorimeter is not always sufficient to explain the detector thermal response. It can be shown that a two-body model, as drawn in Fig. (2)c with two heat capacitance and linked by a thermal conductance , is sufficiently general to account for parasitic thermal effects in TES-based detectors. The heat capacity is typically the sum of the TES bilayer and the absorber heat capacity, since the two structures are generally thermally well coupled, while is a potential decoupled heat capacitance which could have different physical sources, like a fraction of the TES bilayer, the supporting membrane, or the leads Takei et al. (2008); Goldie et al. (2009); Wakeham et al. (2019); Lindeman et al. (2011). A more detailed analysis for even more complex thermal structures can be found for example in Kinnunen et al. (2012); Maasilta (2012). One has to keep in mind, however, that the model could be unconstrained when too many thermal bodies are added into the system of equations. As a consequence, the physical interpretation of the results becomes impossible.
The detector response is regulated by the Joule power provided by the bias circuit, and the power flowing to the thermal bath, given by
| (3) |
where , with the differential thermal conductance to the thermal bath, the thermal conductance exponent, and the bath temperature Irwin and Hilton (2005). The parameters and are material and geometry dependent parameters that depend on the design of the physical link to the heat bath (see Section 4.2). The system is characterized by two fundamental time constants, and , defining respectively the thermal and electrical bandwidth.
The Langevin electrothermal equations for a TES calorimeter, generalized for the DC and AC biased case have been extensively studied in the literature Irwin and Hilton (2005); Lindeman et al. (2011); Ullom and Bennett (2015); Wakeham et al. (2019); Gottardi and Nagayashi (2021). The system of coupled non-linear differential electrothermal equations is typically solved in the small signal regime and in the linear approximation. In this case, the detector physics is generally ignored and is parametrized as in Eq. (1) Irwin and Hilton (2005); Lindeman et al. (2004a, 2011); van der Kuur et al. (2011); Taralli et al. (2019). For this system of coupled linear differential equations there exist analytical solutions, which are either over-,under-, or critically damped. The stability criteria is discussed in the following section.
As it will be shown in Section 5, many of the physical phenomena observed at the TES transition can be explained in the framework of the weak-superconductivity. The detector physics can then be formally included in the electrothermal equations as shown in Gottardi and Nagayashi (2021). They have been fully solved numerically, for an AC biased pixel, in the simplified single-thermal body case Kirsch et al. (2020). This numerical time-domain model can be used to simulate the TES response to the incoming photons in the non-linear and large signal regime, as it is done for example in the end-to-end simulator under development for the X-IFU on Athena Wilms et al. (2016); Lorenz et al. (2020).
3.3 Negative Electrothermal Feedback
The thermal and electrical circuits of a TES are coupled via the cross-terms in the thermal-electrical differential equations Gottardi and Nagayashi (2021). A temperature change in the TES leads to an electrical current signal as a result of a change in the TES resistance. Under voltage-bias conditions (), the electrical current signal change is restored by a change of the Joule power, , which decreases with increasing temperature. This process is analogous to the electrical feedback in a transistor circuit. It involves both the electrical and the thermal circuits simultaneously, and it has been named, for this reason, electrothermal feedback (ETF). In the voltage bias case, the ETF is negative and the TES is stable against thermal runaway. The zero frequency ETF loop gain depends on the detector intrinsic quiescent parameters such as , , , and the bias circuit shunt resistor , and it is defined as
| (4) |
For a constant current, , and in the limit of , the loop gain reduces to the standard loop gain found in the literature Irwin and Hilton (2005).
As it is the case for transistors, there are significant advantages in operating a TES in the negative EFT mode, such as reduced sensitivity to TES parameter variation, faster response time, increased linearity and dynamic range, self-biasing, and self-calibration. Irwin (1995); Irwin and Hilton (2005). As any feedback scheme, ETF can become unstable depending on the detector and the bias circuit parameters. The stability criteria for a TES micro-calorimeter have been extensively discussed by Irwin Irwin (1995); Irwin and Hilton (2005). For a single thermal body, the stability condition for the solution of the system is met for positive values of the real part of the eigenvalues and derived in Irwin and Hilton (2005), where and are defined as the the rise-time and fall-time of a pulse generated by a X-ray photon absorbed by the detector.
In the limit of a small electrical inductance , the rise-time reduces to the electrical circuit time constant , while the effective thermal time constant of the TES becomes
| (5) |
In the stiff voltage bias limit (), we get
| (6) |
The equations above show that the relaxation time to the steady state after a photon absorption is reduced by the ETF loop gain . Furthermore, the thermal time constant of the detector is directly proportional to the and parameters, and therefore depends significantly on the local properties of the transition.
The condition on the time constants being real for a stable, critically () or overdamped () detector response reduces to a constrain on the inductance L of the bias circuit. For given bias conditions and intrinsic TES properties, the system is underdamped for and the detector shows an oscillating response. The critical inductance is defined in Irwin and Hilton (2005). Typically, the TES calorimeter read-out circuit is dimensioned such that the electrical circuit is faster than the thermal circuit with where the best temperature-to-current responsivity is achieved. In the limit of strong voltage bias and high feedback gain , the critical inductance reduces to
| (7) |
which is defined solely by the TES calorimeter physical parameters.
3.4 Fundamental Noise Sources
Noise sources in a TES-based microcalorimeter can be placed into three categories: (1) noise sources internal to the TES, (2) noise sources from the circuit in which the TES is embedded, such as Johnson noise in the bias resistor and the noise contribution of the readout amplifier, and (3) noise from the external environment such as magnetic field, RF-pickup, stray photon arrivals, and fluctuations in the temperature bath. The read-out amplification chain is typically dimensioned to give a negligible noise contribution on the detector performance, while the noise from the external environment is generally minimized by a proper design of the focal plane assembly. The major intrinsic noise sources in a TES calorimeter originate from the thermal fluctuations in the phonon and electronic ensemble of the device. Three intrinsic noise contributions are generally identified: the phonon noise, the internal thermal fluctuation noise and the Johnson-Nyquist noise. As an example, we show in Fig. (3), the typical current noise spectrum of a TES calorimeter under AC bias Gottardi et al. (2021).
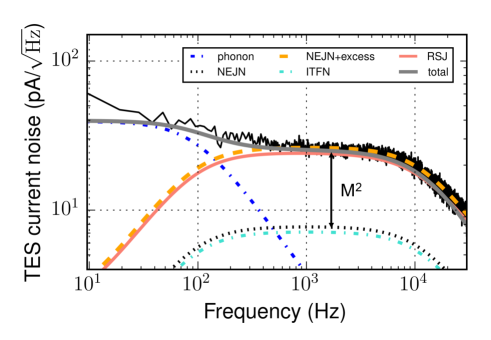
The phonon noise, blue dot-dashed line in Fig. (3), arises from the statistical energy fluctuations generated during the random energy exchange between the TES-absorber body and the heat bath. The power spectral density of this noise is , where is the thermal conductance to the bath at a temperature . For thermal transport where the mean free path of the energy carriers is larger than the length of the link (radiative transport), , Boyle and Rodgers (1959), with the thermal-process dependent exponent. This noise is dominant at low frequencies in the detector thermal bandwidth typically below .
The internal thermal fluctuation noise (ITFN), cyan dot-dashed line, is generated by thermal fluctuation between distributed heat capacities internal to the TES-absorber, as for example in the two-body model shown in Fig. (2). It has a power spectral density , where is the thermal conductance between the two thermal bodies. The ITFN contribution can be derived from a proper characterization of the thermal circuit Hoevers et al. (2000); Takei et al. (2008); Kinnunen et al. (2012); Maasilta (2012); Wakeham et al. (2019, 2020); de Wit et al. (2021).
The third main contribution to the TES total noise is the Johnson-Nyquist noise (JN) of the TES biased in the resistive transition. It can be written in the form of a voltage noise . The response of the TES current to is suppressed at low frequency by the electrothermal feedback Irwin (1995) and becomes significant in the detector electrical band at kHz.The function , which is strongly dependent on the TES current, conveniently describes the noise originated from the non-linear TES resistance nearly at equilibrium at the quiescent temperature . It takes into account the non-linear correction terms to the linear equilibrium Johnson noise. For a linear resistance, . For a TES, the form of is not straightforward to model due to the non-linear and non-equilibrium physical processes involved. The characterization of the noise in the electrical bandwidth is complicated by the fact that both the Nyquist-Johnson noise and the internal thermal fluctuation noise give a similar contribution in the measured TES current noise, after passing through the system transadmittance Maasilta (2012); Wakeham et al. (2018, 2019). To calculate , Irwin Irwin (2006) assumed the TES to be a simple Markovian system with no hidden variables such as internal temperature gradients and fluctuating current paths. By applying the Stratonovich’s nonequilibrium Markovian fluctuation–dissipation relations, he calculated the first order, near-equilibrium, non-linear correction term to the noise to be Irwin (2006).
In this form, the noise model is known as the non-equilibrium Johnson noise and it is extensively used in the literature to model the, dependent, Nyquist–Johnson voltage noise observed in the TES. However, the broadband noise, typically observed in the TES electrical bandwidth Ullom et al. (2004), could only partially be explained after the introduction of the correction term and only at relatively low values Takei et al. (2008); Jethava et al. (2009); Smith et al. (2013). Smith et al. Smith et al. (2013), for example, observed unexplained noise at high frequency after excluding the presence of a significant contribution of the ITFN in their data taken with low resistance, large , high thermal conductance devices.
New experimental results on the noise characterization of TES microcalorimeter Gottardi et al. (2021); Wessels et al. (2021) indicate that the observed Nyquist–Johnson voltage could find a theoretical explanation in the framework of the Josephson effects in the superconducting film described in Section 5. Due to the non-linear current–to-voltage relationship of the TES, the thermal fluctuation noise of the oscillating current induced at the Josephson frequency, much higher than the detector bandwidth, is mixed down and leads to an increase of noise in the TES electrical bandwidth (red solid line labelled RSJ in Fig. (3)). This noise mechanism will be discussed further in Section 5.3.
A detailed analysis of the thermometer sensitivity, the detector noise and the signal bandwidth, shows that the minimum energy resolution achievable with a TES calorimeter can be written as
| (8) |
The unit-less parameter and the thermal conductance exponent depend on the physical nature of the thermal conductance and whether, for example, the phonon transport from the TES to the heat sink is radiative or diffusive McCammon (2005). For a TES, and Irwin and Hilton (2005). To achieve the ultimate sensitivity, for given and , the factor has to be minimized.
3.5 Non-linearity
The equations and discussion outlined in Section 3.1 to 3.4 describe the TES behaviour in the small signal limit. This assumes the TES response as a function of photon energy is purely linear. TESs however, are generally non-linear devices and the pulse shapes (and noise properties during the pulse) will vary depending upon the deposited energy. Non-linearity comes about from two basic effects. Firstly, the shape of the of resistive transition is inherently non-linear (see for example Fig. (9)). The temperature increase of the TES is proportional to the photon energy (). The larger the , the closer the TES resistance is driven towards the normal branch of the transition and eventually the response of the TES will saturate as . Secondly, even for a linear resistive transition (constant dR/dT and dR/dI), non-linearity occurs due to the voltage biased nature of the electrical bias circuit itself. The maximum current change from the X-ray event is constrained by the TES equilibrium bias current , thus the current response will gradually saturate as . The TES current scales roughly as , thus for every doubling of , the corresponding will be reduced by a factor of 2. The current and resistance non-linearity will both contribute to the large signal behaviour of TES detectors. Non-linearity not only affects the pulse shapes, but it also changes the intrinsic detector noise during the X-ray pulse. Generally, as the resistance increases the total detector noise will decrease, this can have a beneficial effect of compensating for the decreased amplitude of the pulse shape due to the non-linearity. The combined effect on the energy resolution is dependent upon the pulse processing method, the details of which will be discussed in Section 3.6.
Multiplexed readout schemes such as time-division-multiplexing (TDM) and frequency-domain-multiplexing (FDM) only have a finite available bandwidth (see Chapter ”Signal readout for Transition-Edge Sensor X-ray imaging spectrometers” for a detailed discussion on these readout schemes). In order to optimally match the bandwidth of the detectors to the readout, a circuit inductance is typically chosen to critically damp the detector response. In the small signal limit, adding circuit inductance changes the detector responsivity, but does not affect the fundamental energy resolution (the signal and noise are affected equally). However it is interesting to consider that the increase in inductance can affect the detector linearity in the larger signal limit.
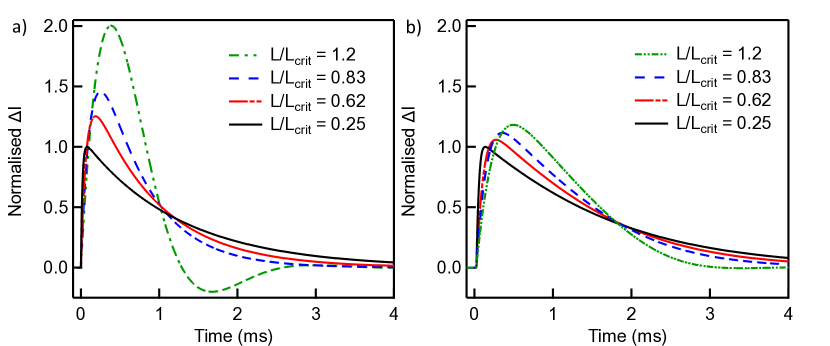
Fig. (4) a) shows the small signal modelled pulse shapes as a function of for an Athena/X-IFU pixel compared to b) the measured pulse shapes at 6 keV as a function of Smith et al. (2021). Data are normalized to the peak of the low inductance pulse-height in both cases. These data show how the small signal (linear) modelled pulse shape is strongly affected by . The TES response is not limited by either current or resistance non-linearity, and the pulses become larger and faster as is increased. Whereas for the real device, which has a non-linear response to 6 keV X-rays, the measured large signal data shows only a modest increase in pulse-height with increasing . This is because the inherent non-linear response of the real device suppresses the increased current and resistance changes predicted from the small signal model. Thus the current response of the real device becomes increasing more nonlinear as a function of energy, with increasing . Significant non-linearity may impact the achievable resolution of the device and complicate the energy scale calibration. Thus for some device designs and applications it may be preferable to operate below the small signal critically damped limit of = 1.
3.6 Pulse Processing
The output signal of a TES calorimeter is typically the amplified and digitised change in the TES current. The time stream of the detector output is sampled into records of a fixed length, which can be represented as a vector . In the small signal limit, and for records containing only a single X-ray pulse of energy , the signal is proportional to the energy , where is the noise-free signal and is the stationary additive noise from the detector and electronics. The best estimate of , when the noise is not-white, would be given by minimising, with respect to , the :
| (9) |
being , the inverse of the noise variance-covariance matrix, where the diagonal elements are the variances, and the off-diagonal elements are the covariances, from the noise sources. This leads to the following definition for the pulse energy
| (10) |
where is the optimal filter. First introduced by Szymkowiak et al. (1993) Szymkowiak et al. (1993), the optimal filtering technique has been used routinely in the analysis of X-ray micro-calorimeter pulses in laboratory experiments Whitford (2005); Fowler et al. (2016, 2017) and on space satellites Boyce et al. (1999); Seta et al. (2012); Tsujimoto et al. (2018).
In practice, the optimal filter is constructed from a model of the pulse shape and the noise. The noiseless signal is obtained by averaging together many records with pulses of a known, identical energy. Depending on whether the filter is build in the time Fixsen et al. (2004) or frequency Szymkowiak et al. (1993) space, the noise is defined by the noise autocorrelation function or by the power spectral density estimated from the pulse-free records. If the noise is stationary, is a convolution or a simple product in the time or frequency space, respectively.
This pulse analysis is optimal under the assumption that Whitford (2005); Fowler et al. (2016): (1) the detector response is linear, (2) the pulse shape for a specific energy is known, (3) the noise is stationary and the autocorrelation function is known, (4) the noise is additive and follows a multivariate Gaussian distribution, (5) the pulses have been acquired while the sensor is in its steady-state condition and the energy from earlier X-rays has been fully dissipated.
In the energy range where the detector response is linear, the pulse shape estimated at one energy could be used to construct the optimal filter for all the energies. In practice, this is never the case and an energy scale calibration program is always required to build an optimal filters look-up table to accurately estimate the incoming photon energy.
Several approaches has been proposed to deal with the detector non-linearity, the non-stationary noise and the position dependency. Those include interpolating the filters for an arbitrary energy Whitford (2005); Shank et al. (2014) , Taylor expansion of a continuous pulse shape model to leading order in energy Fowler et al. (2017), position dependent analysis Smith et al. (2006), calculating the energy dependence of the response of the detector operated in electrothermal feedback mode Hollerith et al. (2006); Fowler et al. (2018), multi-pulse fitting Fowler et al. (2015), and principal component analysis de Vries et al. (2016); Fowler et al. (2020); Busch et al. (2016).
When constructing the optimal filter, the time average of the optimally filtered pulse, or equivalently, the zero frequency bin of the filter calculated in the frequency space, is generally ignored. The zero frequency bin however, contains crucial information on slow varying fluctuations at the detector and the read-out system level and discarding it might result in a signal-to-noise reduction. As it was shown by Doriese et al. Doriese et al. (2009), since the size of the zero-frequency bin is determined by the pulse record-length, the energy resolution of a TES depends as well on the record length. An optimal record length does exist, which is typically defined by the detector internal time constants, the count-rate and the computational resources. It is however possible to at least partially recover the energy resolution degradation by correcting the baseline signal after linear fitting the data before and after the pulse. A post-filtering correlation analysis of the filtered pulse-height and the detector baseline level is routinely used as well to mitigate the effect of slow detector drifts occurring during the pulse acquisitions.
The photon flux experienced by a single pixel during bright sources observation could be so high that it becomes impossible to isolate each single photon and perform optimal filtering. Defocusing techniques could be used to spread the high X-ray flux over a large number of pixels in the array. On the ESA’s Athena mission for example, a defocusing of 35 mm (with respect to the nominal focal length of 12 m) will enable the observations of extremely bright galactic sources with fluxes up to Crab, with only limited spectral resolution degradation Peille et al. (2018); Kammoun et al. (2022).
On a space telescope, most of the data are processed on board. The main on-board processes consist of the trigger algorithm, the event reconstruction algorithm to estimate in real time the arrival time and pulse energy, and the filter generation to compute the template and the optimal filter. The energy scale and the energy scale calibration processes performed on ground shall convert the biased energy estimate into calibrated units, by using fiducial photons from calibration sources. Given the limited amount of computational resources and the limited transmission rate of the satellite telemetry, only a small amount of information is transmitted to Earth. At high photon fluxes, a good strategy is required to estimate the pulse heights with high resolution in the presence of event pile-ups. X-ray instruments on board of the Astro-E Boyce et al. (1999) and Hitomi (Astro-H) Takahashi et al. (2018) introduced the event grading approach as illustrated in Fig. (5).
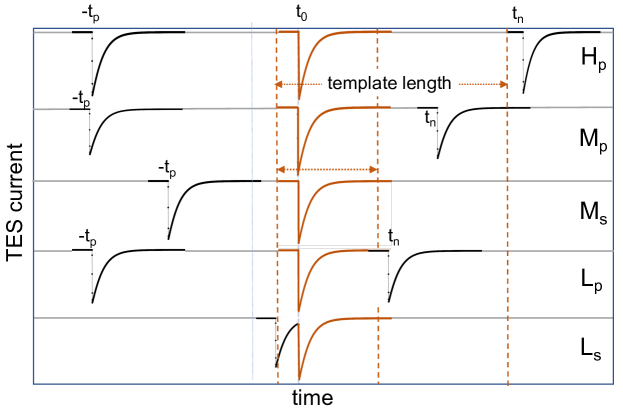
The X-IFU instrument shall follow a similar grading definition. The event grading algorithm qualifies the detected pulses according to the proximity of other events in the same record. On X-IFU, High resolution events corresponds to isolated pulses not affected either by preceding or succeeding ones and have a resolution of 2.5 eV at 7 keV. Medium and Low resolution events have a resolution of and eV, respectively, degraded by another pulse arriving too early after the main one. Fig. (5) shows the definitions of the grades used on Hitomi. A suffix denotes that the current event occurred at least samples after the previous event. When the interval before the next event is more than , between and , or less than samples, the current event is designated , , or (high/medium/low-resolution), respectively. The events following the primary or event are labelled as secondary with an suffix Takeda et al. (2014).
4 Detector Design
4.1 TES Properties
The TES is the core of an X-ray microcalorimeter. Various types of superconducting films have been successfully used for different applications: a single layer of tungsten Rothe et al. (2018); Lita et al. (2005), alloys such as Al-Mn Hubmayr et al. (2011), and proximity-coupled bilayers (or multilayers) made of Ti/Au Nagayoshi et al. (2020), Mo/Au Finkbeiner et al. (2017); Parra-Borderias et al. (2013); Fabrega et al. (2009); Chervenak et al. (2008), Mo/Cu Orlando et al. (2018), Ir/Au Kunieda et al. (2006), and Al/Ti Lolli et al. (2016); Ahmad et al. (2019). These different TES films can all be designed to achieve transition temperatures of 50-100 mK, which is essential for high resolution spectroscopy. The superconducting leads connecting the TES to the rest of the bias circuit must have a higher transition temperature and critical current with respect to the TES film. Niobium is widely used for the leads, but other superconductors such as niobium nitride, molybdenum, and aluminum are also applied.
The TES pixel geometry as well as the design of the coupling between the TES bilayer and the X-ray absorber has direct impact on various properties of the detector. This includes the thermal conductance to the bath Hoevers et al. (2005); Hays-Wehle et al. (2016); Morgan et al. (2017); de Wit et al. (2020), the TES transition smoothness and uniformity Smith et al. (2013); Zhang et al. (2017), the susceptibility to the external magnetic field, the detector normal state resistance Gottardi et al. (2017); Sakai et al. (2018); Morgan et al. (2019); de Wit et al. (2020), and the overall detector noise Ullom et al. (2004); Sadleir et al. (2011); Miniussi et al. (2018); Wakeham et al. (2018); de Wit et al. (2021). In particular, the pixel design optimization is different depending on whether the X-ray microcalorimeters are DC or AC biased Gottardi and Nagayashi (2021). Additional normal metal layers such as ’banks’ that run down the edges of the device, parallel to the direction of current flow, and ’zebra-stripes’, that run perpendicular to the current flow, were widely explored in early TES design for empirically controlling the transition shape and noise properties Ullom et al. (2004); Lindeman et al. (2004b). Whereas the use of zebra-stripes has been found to be beneficial to some designs, they can introduce additional inhomogeneity into the film properties (non-uniform current and magnetic field distribution), which greatly complicates the device physics. This can be detrimental to device performance, particularly reproducibility and uniformity in large format arrays Smith et al. (2013, 2014); Wakeham et al. (2018); Zhang et al. (2017). Thus, these types of features are not universally adopted on all TES devices Miniussi et al. (2018); Smith et al. (2020). Understanding all these geometry dependent effects on TES performance has been an a very active area of research and has enabled better control of the device properties and ever improving energy resolution.
4.2 Thermal Isolation
If the thermal conductance () from the sensor to the heat-bath is too great, the pixel response time may be so fast that it becomes impractical to measure the electrical pulses with the available readout bandwidth. For this reason, it is important to limit the thermal coupling to tune the speed of the detector to meet both the count-rate requirements of the application and bandwidth requirements of the readout. The conductance to the heat-bath depends on the material and geometry of the sensor Morgan et al. (2017); de Wit et al. (2020) and the substrate on which it is deposited. Thermal control is often achieved by isolating the TES on thin SiN (or SOI) membranes which are typically 100 nm to a few m’s thick. In the 2-D ballistic phonon transport limit will scale with the perimeter of the TES in contact with the membrane and scale as Stahle et al. (2002); Hoevers et al. (2005). Additional thermal control has been demonstrated by engineering slots in to the membrane to reduce the phonon emission and thus the conductance to the bath. Metalization layers can also be added to the surface of the membrane to either enhance Hays-Wehle et al. (2016) or suppress Zhang et al. (2019) the phonon transport without changing the geometry of the TES itself. TESs can also be directly fabricated on bulk Si substrates. Without the isolating membrane will be limited by the acoustic mismatch (Kapitza boundary resistance) between the TES and the substrate, and/or electron phonon decoupling Wellstood et al. (1994). The from acoustic mismatch will scale as the area of the TES in contact with the substrate and as . Whereas electron-phonon decoupling scales as the volume of the sensor and (or ). Whichever term dominates will depend upon the geometric details of the devices and the temperature of operation.
4.3 Absorber Design and Properties
For X-ray applications where high density, high fill-factor arrays are required, the absorbers are typically cantilevered above the TES and underlying membrane, making thermal contact with the TES via support columns. The absorber needs to rapidly thermalize the photon energy and conduct it to the TES. If the thermal diffusion from the absorber to the sensor is insufficient, the pixel may exhibit excess thermal noise and position dependent resolution broadening (which occurs when the measured signal at the TES depends on the photon absorption position). The absorber material may also contribute significantly to the total heat-capacity, which is an important design parameter used to tune the desired pixel energy range and resolution. Thus, the composition and geometry of the absorber must be optimized to provide the necessary thermal diffusion and heat-capacity, whilst also achieving the desired vertical quantum efficiency (stopping power) for incident X-rays. High-Z metals such as Au are ideal because they have short X-ray attenuation lengths and thermalize quickly. However, the large carrier density means they also have a relatively high specific heat, making them less ideal for applications requiring large area, high stopping power and high energy resolution. The semi-metal Bi is also an interesting candidate material because it has an intrinsically low carrier density and specific heat. However, the thermalization properties of Bi are highly dependent on the deposition method. TESs with evaporated Bi absorbers have shown non-Gaussian broadening in the measured X-ray spectral response (commonly referred to as ‘low energy tails’). This is not fully understood, but may be related to the trapping of energy in long lived states. Electroplated films tend to have larger grains than than in evaporated films and can achieve a higher Residual-Resistivity Ratio (RRR), defined as the ratio of the resistivity of a material at room temperature and at 4 K, and better thermal characteristics Yan et al. (2017); Brown et al. (2008). Electroplated absorbers have shown the ability to achieve high resolution spectra without significant spectral broadening features Bandler et al. (2008); Brown et al. (2008). For applications where large area absorbers are required, composite Bi/Au absorbers can be used to combine the best properties of both materials. This is the approach for the Athena/X-IFU detectors where a bottom 1 m Au layer provides the desired heat-capacity and rapid thermal diffusion to the sensor. A 5 m Bi layer is added on top, which provides additional stopping power without adding significant additional heat-capacity. These designs provide 90 vertical quantum efficiency at 7 keV combined with 96 filling-factor. To minimize the effect of the absorption of the stray light in the detector, it is also desirable to increase the reflectivity of the absorber for long-wavelength infrared radiation. For this purpose, a Au capping layer on top of the Bi can be added. For pixels being developed for the Athena/X-IFU instrument, an increase in reflectivity, from 45 to 80, has been measured at room temperature after adding a 40 nm Au capping layer Hummatov et al. (2020).
4.4 Current State of the Art
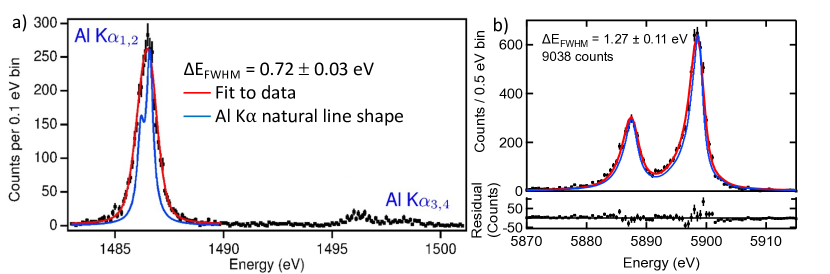
TES detectors for X-ray astrophysics applications have now achieved exquisite resolution performance over a broad range of energies. At an energy of 5.9 keV (Mn-K) TES microcalorimeters can routinely achieve below 2 eV. DC-biased devices developed for various mission concepts at NASA/GSFC, using Mo/Au bilayers and either Au or Au/Bi absorbers, have demonstrated around 1.6 eV FWHM at 5.9 keV (Mn-K) Miniussi et al. (2018); Busch et al. (2016); Smith et al. (2012). With the best energy resolution performance to date being 1.3 eV FWHM Sakai et al. (2019). This was achieved on a 12 m TES with , 4 m thick Au absorber. This very small pixel design is being developed of high angular resolution applications such as NASA’s Lynx Bandler et al. (2019). At an energy of 1.5 keV (Al-K), sub-eV resolution has now been achieved several times with a best resolution of 0.7 eV FWHM Lee et al. (2015) (see Fig. (6)).
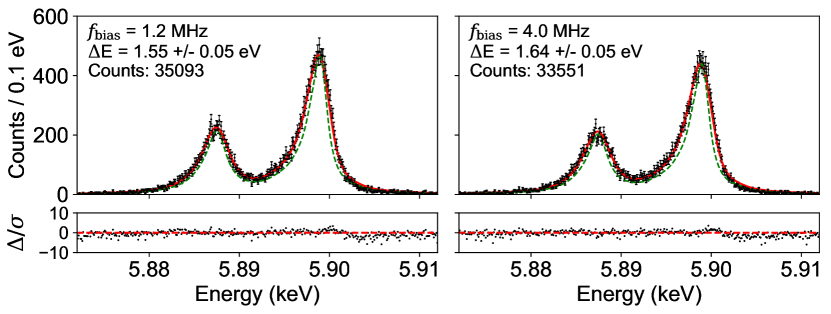
Similar performance has been achieved recently under AC bias using pixels made of Ti/Au TESs with a , thick Au absorber, developed at SRON and optimized for the FDM readout of Athena/X-IFU-like instruments on future X-ray missions. In Fig. (7), the Mn-K spectra for two pixels, biased respectively at 1.2 and 4.0 MHz, are shown. The detectors have a , heat capacity . normal resistance and a thermal conductance to the bath .
These results are representative of the best single pixel spectra achieved to date in X-ray microcalorimeters. The expected performance of a large format array in a space flight instrument will, however, typically be somewhat worse than the best individual pixel results measured in a laboratory environment. This is due a variety of additional sources of noise associated with a large instrument and its environmental conditions. This includes thermal cross-talk between pixels in the array, electrical cross-talk in the bias and readout circuity, noise from the multiplexed readout electronics, drifts from the instrument environment, noise from particle background events, and noise from micro-vibrations. This means that the individual pixel resolution must be optimized to be lower than the final instrument requirement. For the Athena/X-IFU satellite instrument Barret et al. (2018), for example, the individual pixel resolution must be less than 2.1 eV at 7 keV in order to satisfy the full instrument requirement of 2.5 eV.
5 Physics of the Superconducting Transition
5.1 The Superconducting Transition
The superconducting transition of a TES, since its invention, has been described, according to the well established microscopic (BCS theory Bardeen et al. (1957)) and macroscopic theory of superconductivity in low critical temperature material. In particular, the macroscopic Ginzburg-Landau theory Landau and Ginzburg (1950) turned out to be rather successful in explaining the physics near the superconducting transition.
However, while the physics of conventional superconductors is well understood, in two dimensional superconducting films driven in the transition by a large current, like TESs, the observed phenomena are more difficult to explain. For many years, the interpretation of the observed properties of the TES superconducting transition, such as , width , and steepness , was given in the framework of large transport current, Joule heating, self-magnetic field, film impurities, phase slips effects, and vortices generations and annihilations Irwin and Hilton (2005). Interesting enough, researchers overlooked for many years the potential impact on the transition shape of the higher superconducting leads connecting to the TES bilayer. Superconducting structures, in the form of sandwiches or bridges, consisting of a combination of superconducting and normal metal films or superconducting films with different has been studied since the 70’s in the framework of superconducting junctions and weak links Likharev (1979). It was first reported by Sadleir et al. Sadleir et al. (2010, 2011) that TES structures behave as a superconducting weak-link due to the long-range longitudinal proximity effect originating from the superconducting Nb leads. Their conclusion was based on three solid experimental findings: (i) the exponential dependence of the critical current upon the TES length and the square root of the temperature difference , with the intrinsic critical temperature of the bilayer, (ii) the scaling of the effective transition temperature and the transition width as , and (iii) the Fraunhofer-like oscillations of the critical current as a function of the applied perpendicular magnetic field. We will discuss the details of these findings in the next section.
The physics of superconducting junctions and weak-links has been extensively treated in many books and publications Likharev (1979); Barone and Paterno´Gianfranco (1982). In 1962, Brian D. Josephson predicted the existence of several new phenomena in two superconductors weakly coupled to each other by a sufficiently thin insulating material Josephson (1962). Josephson argued that a supercurrent should leak through the thin barrier depending on the voltage across the junction following the law of quantum mechanics. Josephson’s prediction was experimentally verified few years later by P.W. Anderson and J.M Rowell Anderson and Rowell (1963). These works should be considered as milestones for the starting of a new era for the superconducting electronics and quantum physics. Josephson’s predictions turned out to be valid not only in superconducting structures, but in other macroscopic systems as well. The Josephson effects have been observed for example in the beautiful experiments with superfluid He Davis and Packard (2002) and Bose-Einstein condensates in trapped-atom interferometers Levy et al. (2007).
The phenomena described by Josephson are summarized in two fundamental equations, which describe respectively a DC and an AC effect:
| (11) |
and
| (12) |
According to the first equation (dc Josephson effect) the superconducting current has a sinusoidal dependence to the phase difference of the weak-link, i.e. the current through the weak-link is zero when the phase difference is zero, or a multiple of , and is a periodic function with period , such that a change of the current flow direction will cause a change of sign in . The second equation (ac Josephson effect) states that the rate at which the phase difference changes in time is proportional to the voltage across the weak-link. Both Eqs. (11) and (12) can be derived using a straightforward quantum-mechanics formalism describing a two-energy-level system, as it was done for example by Feynman in one of his lectures Feynman (1957). When the junction is a narrow bridge or a thin normal metal film, the dc Josephson equation (Eq. (11)) can be derived following a different approach as described by Aslamazov and Larkin Aslamazov and Larkin (1969). They showed that, for weak-links with length smaller than the superconductors coherence length (), the supercurrent density through the weak-link can be derived from the two Ginzburg-Landau equations as a result of interference of the wavefunctions of the two coupled superconductors.
If the current applied to the junction (or weak-link) exceeds the critical value , dissipation occurs and a normal electron or quasiparticle current starts flowing through the junction as well, in parallel with the superconducting Josephson current . The total current in a junction, with normal-state resistance , is then the sum of the normal current and the Josephson current :
| (13) |
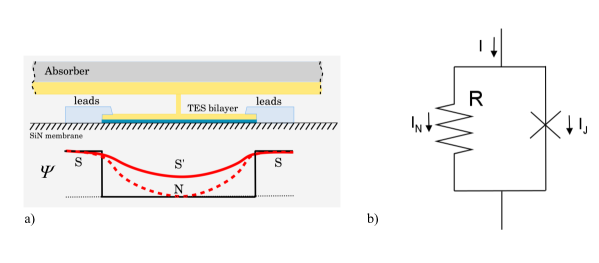
Eq. (13) is the basic equation of the so-called resistively shunted junction model (RSJ), which describes the system as an electrical circuit consisting of a Josephson junction in parallel with a normal resistance (Fig. (8).b).
A typical TES, fabricated from a bilayer with intrinsic critical temperature, , smaller than the critical temperature of the leads , can be treated as a superconducting or weak-link Likharev (1979); Golubov et al. (2004), with the bilayer being when and when .
In some devices however, the Josephson effects described above become less evident and tend to disappear. The TES operates in a stronger superconducting regime, depending on the exact shape of the , the bias current and the operating temperature. As the temperature is further reduced to , the measured critical current follows the behavior typical of the Meissner state for a strongly coupled superconductor. Before the discovery of weak-link effects in TES’s, Irwin et al. Irwin et al. (2018) proposed a simple two-fluid model to describe the total current through a TES biased in the resistive transition
| (14) |
This model is a simplified form of the Skocpol-Beasley-Tinkham (SBT) model [7] of a resistive transition for a superconductor with phase slip lines (PSL) assuming a constant ratio of the time-averaged critical current to the critical current. The model defines a supercurrent as some fraction () of the critical current, and a quasiparticle current, which is equal to divided by some fraction () of the normal resistance. Although it does not provide a physical mechanism for the onset of resistance, the two fluid model has been further used by Bennet et al. Bennett et al. (2012); Ullom and Bennett (2015); Morgan et al. (2017) to make qualitatively good prediction of the logarithmic derivatives of resistance with temperature and current ( and ) of TESs used in X-ray and gamma spectrometers. The original SBT or PSL model, which the two-fluid model is based upon, was later on used by Bennet et al. to explain the bi-stable currents observed in some regions of the IV curve of TESs Bennett et al. (2014). Their finding might suggest that, for TESs outside the weak-link regime, phase-slip lines could be the mechanism for the observed resistance.
5.2 Josephson Effects in DC and AC Biased TESs
In the current and the following sections, we elaborate more on the implication of the Josephson effects on the performance of TESs. The stronger evidence of the behaviour of TES structures as superconducting weak-links due to the long-range longitudinal proximity effect (LoPE) originating from the superconducting Nb leads is the peculiar dependence of the critical current on the temperature , , and on the magnetic field applied perpendicular to the direction of the current flow, . The former shows the exponential dependence upon the TES length and the square root of the temperature difference :
| (15) |
with for . The latter, for , take a form similar to the well known Fraunhofer pattern characteristic of many Josephson structures Likharev (1979); Barone and Paterno´Gianfranco (1982):
| (16) |
The periodicity of the oscillations is , where is the junction length, the width and is the flux quantum. The equation above assumes a sinusoidal current-phase relationship, which corresponds to a uniform current density distribution at zero applied field, and the presence of negligible screening currents Barone and Paterno´Gianfranco (1982).
The longitudinal proximity effect was observed over extraordinary long () distances and it is responsible for the enhancement, in the proximity of the leads, of the spatially varying superconducting order parameters of the TES bilayer (Fig. (8)a). It has been shown as well Sadleir et al. (2011) that the order parameter is suppressed in proximity to normal metal structures deposited along or on top of the TES due to the lateral inverse proximity effect (LaiPE).
Both the effects described by Eqs. (15) and (16), have been experimentally observed over a broad range of TES sizes and geometries, both under DC and AC biasing Sadleir et al. (2010, 2011); Smith et al. (2014); Gottardi et al. (2017); de Wit et al. (2020).
The resistively shunted junction (RSJ) model, introduced above, describes very successfully the macroscopic behaviour of superconducting weak-links of many different kind. The RSJ model was first formalized for a dc-biased TES in the work of Kozorezov et al. Kozorezov et al. (2011), which shows how to derive the TES resistive transition analytically following the Smoluchowski equation approach for quantum Brownian motion in a tilted periodic potential in the presence of thermal fluctuations Coffey et al. (2008). The same approach can be used to calculate exactly the intrinsic TES reactance, which has important implications on the TES response, in particular when operating under MHz voltage biasing Gottardi et al. (2014).
The plot in Fig. (9) gives an example of a TES resistive transition surface calculated following the approach described above.
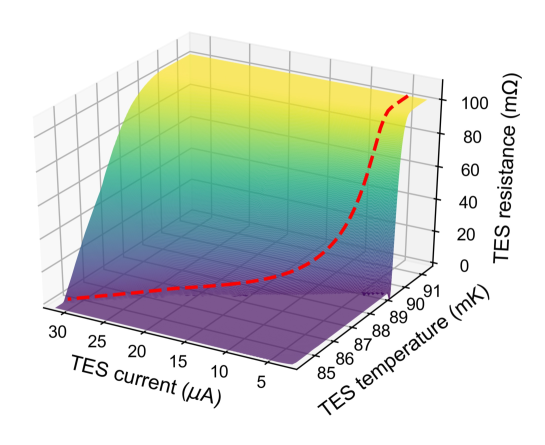
From the Josephson derivation in Eq. (13), the total current in the TES is the sum of two components, the Josephson current and a quasi-particle (normal) current . In the most comprehensive case, the potential across the TES is the sum of a DC and AC voltage . When the TES is dc biased, is the constant voltage applied to the TES and the second term accounts for any potential ac excitation of peak amplitude injected into the bias circuit. In the ac bias case, , and is the applied voltage bias with amplitude and frequency , that drives the TES into transition. The ac voltage across the TES forces the gauge invariant superconducting phase to oscillate at , out-of-phase with respect to the voltage. The peak value depends on . From Eq. (12), the gauge invariant superconducting phase can be written as and the Josephson current density becomes Barone and Paterno´Gianfranco (1982)
| (17) |
where is the effective weak-link area crossed by the dc () and ac () perpendicular magnetic field, respectively. The field is generally a combination of an external field and the self-magnetic field generated by the current flowing in the TES and the TES leads Smith et al. (2014). The equation above is the generalized equation for the Josephson current density in a weak-link and shows the dependency of the current density on the DC and AC voltage across the weak-link and the magnetic field applied perpendicular to the current flow. In the stationary case, , and in the presence of a perpendicular constant magnetic field and uniform current distribution, Eq. (17) reduces to Eq. (16), after the integration over the weak-link area Barone and Paterno´Gianfranco (1982).
At zero magnetic field and under strict DC biasing (), the phase varies in time and an alternating current is generated, , with equal to the Josephson oscillation frequency. In TES micro-calorimeters, the typical dc bias voltage, , is of the order of 40 to 80 nV, depending on the TES geometry and resistance. For these voltages, the Josephson oscillations occur at frequencies between 20 to 40 MHz, which are generally well outside the read-out bandwidth. We will see in the next section, however, that that mixed-down effects might occur, in particular in the noise, observable in the detector kHz bandwidth.
In the frequency division read-out scheme, the TES detectors are AC biased and in Eq. (17). It can bee shown Gottardi et al. (2014); Gottardi and Nagayashi (2021), that an alternating current is then generated through the TES -out-off-phase with respect to the applied voltage . This is equivalent as saying that a TES possesses an intrinsic reactance, which becomes non-negligible when exciting the device at the MHz frequencies Gottardi et al. (2014); Kozorezov et al. (2011).
In Fig. (10).a, the TES in-phase current and the quadrature current normalized to are shown as a function of the TES voltage for an AC-biased low resistance MoAu TES X-ray calorimeter fabricated at NASA/GSFC Miniussi et al. (2018). The quadrature component of the current is a direct measurement of the Josephson current described by Eq. (17). The steps observed in the in-phase current are the results of the intrinsic non-linear reactance expected when a TES behaves as weak-link Gottardi et al. (2018).
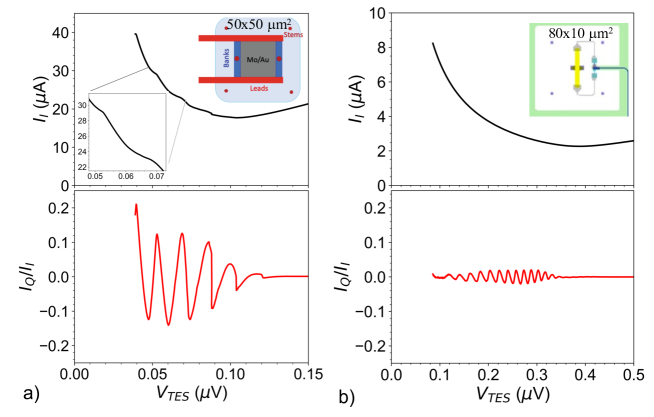
As predicted by the theoretical model presented in this session, the observed non-ideal behaviour of AC biased devices, caused by the Josephson effects, can be minimized by increasing the TES normal resistances, , and by designing the TESs with higher aspect ratio (AR) Gottardi et al. (2018); de Wit et al. (2020). In TESs with higher , operating at the same power , the gauge invariant phase difference across the Josephson weak link is maximized since and the TES is less affected by the Josephson effects. In Fig. (10).b, we give an example of the mitigation of the Josephson effects achievable by using high aspect ratio TESs. We show the current–to–voltage characteristics of an SRON Ti/Au (AR = 8:1, ), measured under AC bias. The device has a 1–2 , compatible with the X-IFU requirement and is biased at . The amplitude of the Josephson current is drastically reduced in the long, high resistance devices, in contrast to the detector of Fig. (10).a. These novel TES design leads to a smoother resistive transition, even at high bias frequency.
The strong non-linear nature of the Josephson current described in Eq. (17) could challenge the calibration of the detector response as a function of energy both under AC and DC bias. In the former case, non-linearity arises from the bias-dependent detector reactance, in the latter case from the strong dependency on the external magnetic field. The Josephson effects have to be minimized, for both the read-out schemes, by a proper detector design. The optimization process is complex and still a subject of active research de Wit et al. (2022); Vaccaro et al. (2022); Smith et al. (2016).
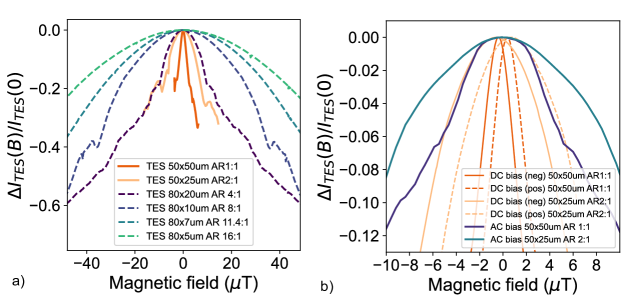
As it is illustrated in Fig. (11)a), the high aspect ratio design drastically reduces the dependency on the perpendicular magnetic field. The relative change in the TES current at the nominal bias condition is shown as a function of the magnetic field perpendicular to the current flow for SRON-fabricated devices with different aspect ratio. The low aspect ratio geometry (oranges lines) are typically used in the DC bias read-out due to their low normal resistance Smith et al. (2021), while the large normal resistance and high aspect ratio geometry (bluish dashed lines), envisioned to minimized the detector reactance, have been used for the AC bias read-out Akamatsu et al. (2021).
The alternating current in the AC bias configuration mitigates the effect of the self-magnetic field observed in DC bias devices thoroughly discussed by Smith et al.Smith et al. (2014). The effect is shown in Fig. (11).b where identical pixels with low aspect ratio design have been measured both under AC and DC bias.
5.3 Implication of the Weak-Link Behaviour on the Detector Noise
The observed excess Johnson noise in TES-based detectors could have a natural explanation within the RSJ theory. Following the work of Likharev and Semenov Likharev and Semenow (1972) and Vystavkin et al. Vystavkin et al. (1974), Kozorezov et al. Kozorezov et al. (2012) calculated the power spectral density of the voltage fluctuations, , across the TES (considered as a resistively shunted junction), averaged over the period of the Josephson oscillations. They obtained
| (18) |
where are the components of the impedance matrix of the biased TES with the index standing for the harmonic of the Josephson oscillation at . This approach was used in Koch et al. Koch et al. (1980) to develop the quantum-noise theory of a resistively shunted Josephson junction and SQUID amplifiers. They showed that to calculate the total low frequency voltage fluctuations, one needs to take into account the mixing down of high frequency noise at harmonics of the Josephson frequency. Following these reasoning, in Kozorezov et al. (2012), the authors argued that the only source of the intrinsic electrical noise in the TES is the equilibrium Johnson normal current noise Likharev and Semenow (1972) enhanced by the nonlinear response of the weak link. Within this framework, there is no need to introduce the nonequilibrium Markovian fluctuation–dissipation relations as discussed in Irwin (2006). The RSJ model predicts a significantly higher broadband noise, with respect to the non-equilibrium Johnson noise theory proposed by Irwin, at the lower part of the resistive transition, as generally observed in many experiments.
A simpler expression for Eq. (18), based on the approximations explained in Kozorezov et al. (2012), has been recently derived by Wessel et al. Wessel et al. (????); Wessels et al. (2021) in the form:
| (19) |
where in Eq. (18) is replaced by , given the fact that the thermal fluctuations are associated with the real part of the TES impedance at the equilibrium value. In the same paper, the authors compare the measured Johnson noise for a few TES microcalorimeters Wakeham et al. (2018) with Eq. (19), the general form derived by Kogan and Nagaev Kogan and Nagaev (1988) (KN) and the prediction from the two-fluid model Wessel et al. (????); Bennett et al. (2013). In the simplified form of the two-fluid model, no mixed-down noise from high to low frequency is predicted, and the expected noise is typically underestimated. A better agreement with the data is observed with the RSJ and the Kogan–Nagaev models.
In a recent study Gottardi et al. (2021) on the noise of high-aspect ratio TESs under development at SRON for the MHz bias read-out, a very good agreement between the observed Johnson noise and the prediction from the RSJ and Kogan–Nagaev has been demonstrated over a large number of TES designs and bias conditions. The authors concluded that the fluctuation-dissipation theorem generalized for a nonlinear system in thermal equilibrium explains well the observed noise and that it is not necessary to introduce the formalism for a nonlinear TES out of equilibrium described in Irwin (2006). By assuming Eq. (19) as the correct expression for the Johnson noise in a TES, de Wit et al. de Wit et al. (2021) performed a study on the impact of the internal thermal fluctuations driven by the TES-absorber coupling design. The work revealed subtle thermal effects and stressed the importance of a proper model for the TES Johnson noise.
6 Detector Calibration Considerations
The measured spectrum from an X-ray observatory will be a convolution of the astrophysical source with the response function of the instrument. In order to realize the exquisite spectroscopic capabilities of TES detectors on a real flight instrument, this response function must be properly calibrated and variations in the time due to changes in the instrument environment must be accounted for. Uncertainties in the knowledge of the overall system performance can lead to systematic errors in the data, and potentially compromise science objectives. Extensive calibration procedures, developed for Si thermistor microcalorimeters for the Astro-E and Astro-H missions Eckart et al. (2018), can be applied to TES technology for missions such as Athena Cucchetti et al. (2018b, a).
6.1 Response Function
The response function includes the effective area and line spread function (energy resolution and redistribution) as a function of energy. The effective area describes the X-ray collecting efficiency of telescope and includes contributions from the mirror, optical blocking filters and the detector. At the detector level the array quantum efficiency, including both the vertical stopping power of the absorbers and the geometric filling factor, must be precisely calibrated (at the few level) as function of energy. This can be achieved through a combination of microscope inspection of the absorber size and gaps between pixels at various point across an array, measuring the change in mass of the detector wafer after the absorber deposition, and directly measuring the transmission of absorber parts at a synchrotron source.
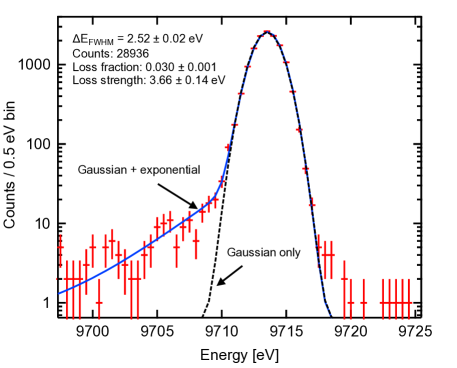
The line spread function (LSF) describes the probability that an incident X-ray event of energy , will be measured in a given energy channel . The LSF consists of the Gaussian core and non-Gaussian or extended components. The core-LSF width is dominated by the intrinsic detector and system noise properties and is typically what is used to describe the energy resolution of the detector. Outside of the core, a small fraction of incident events appear re-distributed to lower energies due to various effects related to absorption physics. The re-distributed features or extended-LSF includes near core exponential tails in the spectrum just below the primary line, as well as electron-loss continuum and absorber escape peaks. Understanding and calibrating the LSF is important to be able to correctly interpret the measured spectrum from astrophysical objects. Uncertainties in the energy resolution will particularly affect measurements of the line broadening in astrophysical sources. Even with high purity electroplated Bi and Au absorbers, low level tails in the measured spectrum can typically be observed when using very narrow beam X-ray sources such as a channel cut crystal monochromator (CCCM) Leutenegger et al. (2020) or an Electron Beam Ion Trap (EBIT) O’Neil et al. (2020b). An example spectrum is shown in Fig. 12 for a prototype Athena X-IFU detector which shows the Gaussian core and a residual low energy tail. Eckart et al. Eckart et al. (2019) studied the energy dependence of these residual low energy tails in similar detectors with Bi/Au absorbers and showed that the number of events redistributed to the low energy tail increased with decreasing photon energy.
The electron loss continuum occurs due to partial thermalization of events that are absorbed near the surface of the absorber. The initial photo-electron that is created by the primary X-ray may be scattered out of the absorber. Consequently only a small fraction of the incident X-ray energy is measured by the detector. This is empirically found to have approximately constant flux per energy interval below the primary X-ray line energy. Only a few of the total events are redistributed to the electron-loss continuum.
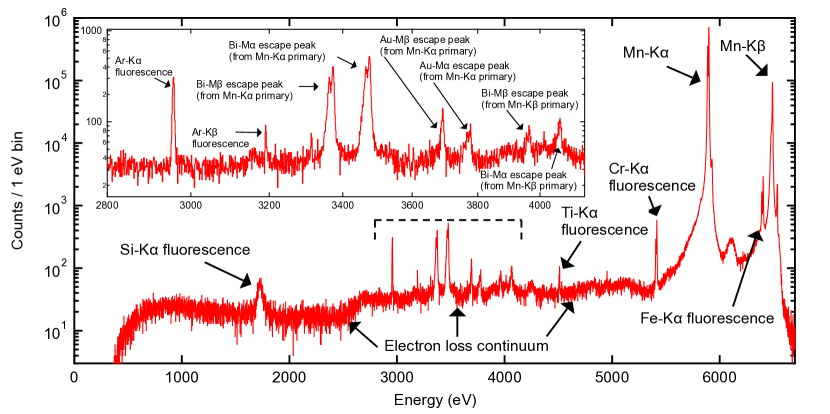
When an X-ray event ejects an inner shell electron, the resulting vacancy may be filled by an outer shell electron and a fluorescent X-ray emitted. If this X-ray escapes the absorber, the detected energy is then equal to the primary X-ray energy less the fluorescent energy of the emitted X-ray. The resulting spectrum will contain a series of ’escape peaks’ whose energies depend upon the primary X-ray energy and the absorber composition. In addition to these extended-LSF components, background peaks may be seen due to fluorescent X-ray emission from parts of the experimental apparatus exposed to the source flux. This could include the detector wafer, parts of the detector housing or cryostat and X-ray source itself. Figure 13 shows a measured spectrum from a prototype Athena/X-IFU array Smith et al. (2021) including over 200 pixels. These devices have composite Bi/Au absorbers. The spectrum shows the primary Mn-K peaks from the source, as well as the extended-LSF and various fluorescent background peaks. Only the Si-K fluorescence line is fundamental to the detector. The main escape peaks are clearly visible above the electron loss continuum and are from Bi and Au M-shell fluorescent emission.
6.2 Energy Scale and Sensitivity to Environmental Fluctuations
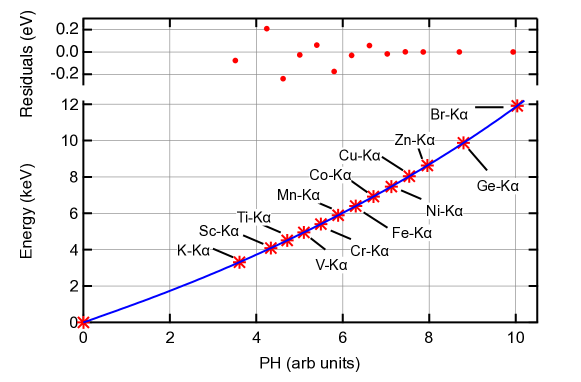
The energy scale is a function that relates the output of the event processor, (the optimally filtered pulse height in engineering units), to calibrated energy units, . TESs are inherently non-linear detectors and the superconducting-to-normal transition is very difficult to model accurately, thus an empirical approach to gain calibration is required. Fig. (14) shows an example of an energy scale function for a prototype TES detector for X-IFU. The gain function is found by fitting some function (such as a polynominal) to the known positions of the X-ray calibration points as function of optimally filtered pulse height. Gain errors can arise due to uncertainties in the line shapes and position of the calibration lines themselves as well as due to interpolation errors between the known calibration points.
Besides determining the gain function at the nominal detector operating points, it is important to understand how the gain evolves with the varying environmental conditions of the instrument. Variations in the detectors environment such as the heat-sink temperature, magnetic field, stray optical/IR power loading and temperature of bias/readout electronics may result in drifts in the detector gain over time. If uncorrected this can result in resolution broadening and error in the absolute energy knowledge. Fluctuations in the TES voltage bias, , (due to a thermal drift in the electronics for example), will directly affect the bias point of the TES and therefore affect its gain. Fluctuations in the heat-sink temperature, will have a similar impact since it directly changes the operating point of the TES. But it can also slightly affect other properties such as the transition shape (due to the current dependence of the transition). Magnetic field, , affects via the temperature and field dependent critical current . Changes in and directly affect the pulse shape and thus the gain of the detector. The sensitivity of a TES to depends on numerous factors including the details of the geometry, whether DC or AC biased, and the magnitude of any self-magnetic field Smith et al. (2014); Vaccaro et al. (2022); de Wit et al. (2022). For a device that shows weak-link behaviour (Fraunhoffer-like ) the pulse-shape may oscillate with with the same periodicity seen in the Smith et al. (2016, 2013). The effective area of the TES that threads magnetic flux () determines the periodicity in and thus . Thus a smaller TES has the potential to achieve less sensitivity to B-field.
One of the most important properties of a TES that affects its gain sensitivity is the electrothermal feedback (ETF). The ETF that arises due to the voltage biased operation of the TES act as a restoring force, countering changes in external environment. Devices with high ETF, often parameterized by the ’loop gain’ (see Section 3.3), will generally have more immunity than devices operated in a low ETF regime. For a device with fixed transition properties, the only way to practically maximize the ETF is by ensuring the voltage bias shunt resistor is very much less than the TES operating resistance ( ) and/or the heat sink temperature is much less than the operating temperature of the TES ( ). As an example, Fig. (15) shows the simulated as a function of and for an Athena/X-IFU-like pixel. This illustrates how minimizing these ratios can be effective in reducing the sensitivity to bath temperature drifts. For a flight instrument, minimizing has to be traded against other practical considerations such as the TES bias source range (lower requires a larger current source to operate the TES at the same ), the power dissipation at the 50 mK stage (power dissipated in the shunt resistor scales as ), and physical space constraints on the 50 mK stage (smaller generally requires larger physical area). The lower the , the shorter the hold-time of the cooling chain adiabatic demagnetization refrigerator (ADR) becomes, unless the cooling capacity of the ADR is increased.

From the multiplexed read-out perspective, it is ideal to critically damp the pulses to minimize the requirements on the readout. The effect of adding inductance changes the pulse shape (increases the rise-time, reduces the fall-time and increases the pulse-height). However, this is non-linear with increasing inductance, with larger changes in responsivity occurring (for a given change in ) as approaches unity. Consequently, the pulse shape also becomes more sensitive to changes in its environmental bias conditions. Thus, a side effect of larger inductance is an increased gain sensitivity (Fig. (15) c).
6.3 Drift Correction Algorithms
On the final instrument, any drifts in gain will be monitored using fiducial line(s) generated by a calibration source de Vries et al. (2017). The measured drifts can then be corrected during post-processing. The simplest method to correct the gain is to apply a linear stretch factor. This can work well when the detector gain is fairly linear and the scale of the drifts are relatively small ( eV). However in the presence of larger drifts, and particularly for non-linear detectors such as TESs, large residual errors may arise at energies away from the fiducial energy. Porter et al. Porter et al. (2016) demonstrated a gain drift correction approach for microcalorimeter detectors (originally developed for the SXS instrument on Astro-H) that takes into account the non-linear shape of the energy gain scale to reduce gain errors over the full bandpass. In this method, reference gain scales are measured (during ground calibration) at three different heat sink temperatures, chosen to envelope the expected variation in operating conditions over the mission lifetime. Drifts are tracked at a single energy using the onboard calibration source and a new interpolated gain scale is derived (as a function of time) using the three reference calibration curves. Although the non-linear correction accounts for the shape of the gain scale, its evolution with variations in the environment may not be uniquely characterized using a single fiducial line. Using simulated TES data, Cucchetti et al. Cucchetti et al. (2018a) developed a multi-line, non-linear drift correction approach, which used two fiducial calibration lines (Cr-K and Cu-K for example) to track the gain instead of one which demonstrated reduced gain residuals across the bandpass. These multi-line approach is being developed for Athena/X-IFU. Cucchetti et al. Cucchetti et al. (2018) also investigated a multi-parameter, non-linear drift correction approach that aims to incorporate additional information from the detector baseline-level (the pre-trigger mean of the measured pulse) in the correction algorithm.
7 Multi-Pixel TESs
Several practical constraints can limit the number of pixels in the array, both at the focal-plane assembly (FPA) and for the instrument as a whole. These include: the high density of wiring needed to route wires from the interior of the array to the bias circuit and readout components; the physical space required on the FPA for shunt resistors, Nyquist inductors and readout chips; the associated power dissipation of those additional components; the larger number of readout electronics boxes (which drives instrument mass and power), and the number of interconnects between temperature stages. Position-sensitive microcalorimeters are an alternative approach to arrays of individual TES pixels that enable a larger number of effective pixels in an array, without significantly increasing the complexity of the instrument. This comes with some trade in performance. Position-sensitive microcalorimeters have been proposed in various slightly different forms Iyomoto et al. (2006); Stern et al. (2008); Mori et al. (2008); Smith et al. (2004, 2009), but the basic principle is to use a single extended absorber, or series of absorbers, connected to one or more TES. Due to the finite thermal conductance between the position of the absorption event and the TES(s), a different characteristic pulse-shape is measured depending upon where the photon has been absorbed. It is this pulse-shape variation that enables position discrimination. This concept is often referred to as ’thermal multiplexing’ which, when combined with an electrical multiplexed readout, is a very powerful tool for increasing the effective number of pixels in an array.
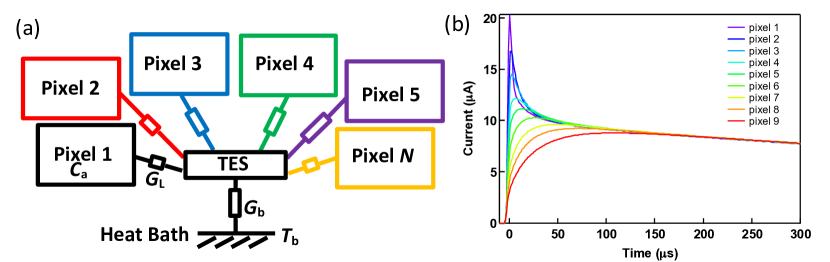
Position-sensitive TESs for X-ray astrophysics were first developed at NASA/GSFC Figueroa-Feliciano (2004); Iyomoto et al. (2006). The currently favoured design is referred to as a ’hydra’. The hydra consists of a single TES connected to series of discrete X-ray absorbers Smith et al. (2008). Figure 16 shows a thermal block diagram of the hydra concept consisting of N X-ray absorbers each with a different thermal ’link’ to a TES. This configuration is referred to as a ’star’ geometry. The links act as thermal low pass filters. By varying the thermal conductance of these thin metal links (by varying the length and width) the bandwidth of each thermal filter can be tuned to give a characteristic pulse shape for the signals from each of the X-ray absorbers. Decoupling pixels in this way enables position discrimination, but at some expense in energy resolution. The low-pass filtering of the pulse shape attenuates the signal relative to the detector noise and slightly degrades the energy resolution. The more thermally decoupled a pixel, the more degraded is expected to be from the single-pixel limit. The decoupling of the absorbers also adds a small amount of internal thermal fluctuation noise (ITFN) between the absorber and the TES (as described in Section 3.4). If becomes too degraded the ability to distinguish pulses will also be compromised. Thus the link conductances must be optimized to maximize the signal-to-noise while maintaining just enough separation between pulse shapes to determine position. The maximum count-rate capability of a hydra is also an important design consideration. The count-rate of a TES is typically limited by pulse pile-up measured in the TES data stream. Thus an N-pixel hydra will have the same maximum count-rate ability as a single pixel TES detector of the same physical size. However, the count-rate per imaging element will be N times lower. The larger the number of pixels in the hydra (the ’hydra factor’), the larger the performance degradation and the more technically complex the design is to implement. Hydras can be used for applications where it is desirable to achieve a much larger field-of-view, or improved angular resolution for the same field-of-view, when compared to an array of individual TES pixels (with some trade in performance). See Section 8.2 for proposed missions that include the use of hydras.
Figure 16 also shows the measured average pulse shapes for a 9-pixel star-hydra developed at NASA/GSFC Smith et al. (2019). The largest, fastest rising pulse shape corresponds to the pixel directly coupled to the TES. The pulse amplitude becomes smaller, and the rise-time slower, as each absorber is further decoupled from the sensor. After the initial, position-dependent equilibration signal, the hydra thermal networks comes in to equilibrium and the pulses from all pixels decay at the same exponential rate (determined by the electrothermal time constant of the hydra). These Mo/Au bilayer TESs had a transition temperature of 46 mK. Each Au X-ray absorber was 65 m on the side and 5.2 m thick. The achieved resolution was eV at Al-K, 2.44 eV at Mn-K, and 3.39 eV at Cu-K. Position discrimination was achieved from the rise-time of the pulses.
To achieve a larger numbers of pixels / TES, it becomes increasingly more challenging to physically layout the internal links, whilst achieving the desired thermal conductances. As a solution, NASA/GSFC proposed a hierarchical ’tree’ geometry. In the tree-hydra, instead of connecting every pixel directly to the TES, groups of pixels are connected together by link ‘branches’, and then 1 pixel from each group connects to the TES via link ‘trunks’. The more complex thermal network of the tree-hydras means that more sophisticated position-discrimination algorithms may be required to determine the event position. Prototype tree-hydras have been developed with up to 25 pixels per TES (5 trunks each with 5 branches) for NASA’s Lynx mission concept Smith et al. (2020). The authors were able to demonstrate position discrimination using a simple approach to parameterize the rising-edges with two metrics that extracts a fast and slow component to the rise-time. This allowed unique identification of every branch and trunk pixel. These tree-hydras demonstrated eV and eV for hydras with a 25 m and 50 m absorber pitch, respectively, for Al-K X-rays Smith et al. (2020).
8 Applications and Future Technology Needs
8.1 Ground Based Instrumentation
X-ray spectroscopy contains diagnostic transitions from ions of every abundant cosmic metal and provides information on plasma temperature, density, elemental and ionic composition. The utility of these diagnostics requires knowledge of large sets of atomic data that describe the physics of the emission process. Ground based, laboratory astrophysics measurements are critical to provide the experimental knowledge needed to bench-mark the atomic models used to interpret high-resolution spectra from celestial observations. There are various facilities worldwide, which can generate laboratory plasmas in controlled conditions: this includes electron beam ion traps (EBIT) and tokamaks (used in fusion energy sciences). By varying the composition and ionization state of a hot gas generated under controlled conditions, one can relate observed X-ray spectra to the conditions of the gas, and then translate that knowledge to real astrophysical observations. The first EBIT to be developed was at Lawrence Livermore National Laboratory (LLNL) in 1985 Levine et al. (1988). EBITs have been extensively used to produce high quality atomic data including accurate wavelengths measurements, line intensity ratios, linear polarizations, and cross-sections to test and benchmark various models theories Brown et al. (2006); O’Neil et al. (2020a); Gall et al. (2020). Several low temperature detectors systems have been deployed at the LLNL EBIT using silicon thermistor detectors developed from the Astro-E and Astro-H flight programs Porter et al. (2000, 2008). A TES based detector system using prototype Athena X-IFU detector and readout technology will be deployed in the near future Smith et al. (2021). A similar TES based spectrometer has been fielded at the NIST Gaithersburg EBIT Szypryt et al. (2019).
In addition to the laboratory astrophysics measurements, X-ray TES microcalorimeters are now commonly employed at a variety of light sources, accelerator facilities, and laboratory-scale experiments carrying out measurements related to synchrotron-based absorption and emission spectroscopy and energy-resolved scattering; accelerator-based spectroscopy of hadronic atoms and particle-induced-emission spectroscopy; laboratory-based time-resolved absorption and emission spectroscopy; X-ray metrology. Further details of these instruments can be found in Ullom and Bennett (2015); Doriese et al. (2017) and will not be discussed further here.
8.2 Next Generation Space Mission Concepts
In this section we briefly describe the TES detector concepts that are under development for the next generation of X-ray observatories as listed in Table 1.
|
Mission |
F.o.V. | Angular Resolution | Number of Pixels | Energy | dE |
Eff. Area
@ 1 keV |
| (arc min) | (arc sec) | (keV) | (eV) | () | ||
| Athena | 5 | 5 | 2,400 | 0.2–12 | 2–2.5 | 1.4 |
| LEM | 15 | 16,000 | 0.2–2 | 1–2 | 0.26 | |
| Lynx | 1–5 | 0.5–1 | 100,000 | 0.2–7 | 0.3–3 | 0.2–2 |
| Super DIOS | 30 | 0–15 | 30,000 | 0.2–2 | 0.1 | |
| CWE | 1 M | 0.1–3 | 0.3 | 10 |
Mature cryogenic X-ray microcalorimeter instruments using Si thermistor detectors have flown the XQC sounding rocket experiment and in orbit through the Japanese mission HITOMI, and will fly again in 2023 on XRISM. However, the higher performance/lower maturity TES based instruments are unlikely to be realized on a satellite mission until the 2030’s. TES detectors have however been flown on the sub-orbital sounding rocket experiment Micro-X (Northwestern University, USA) in 2018 Adams et al. (2020). Micro-X uses TES devices developed at NASA/GSFC with intrinsic energy resolution of 4.5 eV over the energy range of interest (0.1- 2.5 keV). The array consists of 128 pixels on a 600 m pitch. The launch was intended to observe the supernova remnant Cassiopeia A. A failure in the attitude control system prevented the rocket from pointing and led to no time on target. However in-flight calibration data still provided important information about the performance of these detectors in a flight environment. The mission has recently (August 2022) had a successful re-flight, observing Cassiopeia A, with results and analysis pending.
The Advanced Telescope for High-Energy Astrophysics (Athena) was selected as an L-class mission in ESA’s 2015-2025 Cosmic Vision plan and has an anticipated launch date in the late 2030’s. Athena was chosen to address the science theme: ‘The Hot and Energetic Universe’, and as such will answer important questions related to the growth of black holes and large scale structure in the Universe. Athena is the most mature mission concept currently under development. As currently envisioned, Athena will have two main instruments, a wide-field imager (WFI) and an X-ray Integral Field Unit (X-IFU). The X-IFU Barret et al. (2018) will comprise of a 2.4k TES pixel array (provided by NASA/GSFC) and will be read out with TDM (NIST/Boulder). The X-IFU will have a field-of-view of 5 arc-minutes and will provide imaging-spectroscopy over the energy range 0.2-12 keV, with an energy resolution of 2.5 eV at energies up to 7 keV. Fig. (17) shows a prototype full scale X-IFU array with 3k pixels in a hexagonal configuration. The TESs are Mo/Au bilayers with a transition temperature of 90 mK fabricated on a 317 m pitch. The X-ray stopping power is provided by Bi/Au absorbers 6 m thick. Also shown in Fig. (17) is an energy histogram showing the combined spectral performance at an energy of 7 keV and includes over 200 pixels from a prototype 1k array that was read out using TDM Smith et al. (2021).
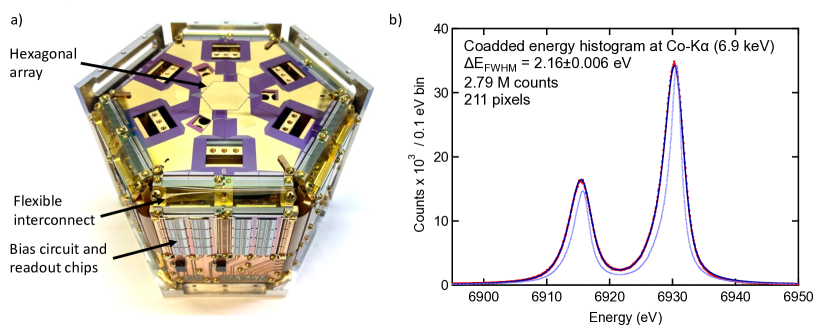
There are many design issues to consider when developing a complex instrument like X-IFU within the engineering limitations of a satellite. The packaging of the main sensor array chip, the cold read-out electronics stages, the long harness and the warm electronics for a space-born instrument Jackson et al. (2016); Geoffray et al. (2020); van Weers et al. (2020) have several challenges related to the interaction between the different components and the thermal, mechanical, and electromagnetic environment. The focal plane assembly (FPA) has to be made robust against cosmic ray radiation Lotti et al. (2018); Miniussi et al. (2020); Peille et al. (2020); Hummatov et al. (2020), infra-red and optical loading Barbera et al. (2018), thermal fluctuation, magnetic field gradients, micro-vibration from the mechanical coolers Gottardi et al. (2019b); van Weers et al. (2020) and EMI from the satellite. The core of the FPA under development for X-IFU Jackson et al. (2016); Geoffray et al. (2020); van Weers et al. (2020) consists of the large TES microcalorimeters array and its SQUID-based multiplexing cold readout electronics, plus a second TES array detector located at a close distance underneath the main array to be used as a cryogenic anti-coincidence detector Lotti et al. (2021); D’Andrea et al. (2018). The latter shall reduce the particles background, induced by primary protons of both solar and cosmic rays origin, and secondary electrons, to a total level of 5 in the 2–10 keV energy band. The other key building blocks of the FPA consist of the detector assembly, the thermal suspension, the electromagnetic shielding, the FPA-internal wiring harness, the electronics assembly, and the thermal strapping. Critical to achieving high resolution with a TES X-ray spectrometer will be the shielding of the absolute static magnetic flux density component normal to the detector array surface, which needs to be less than , including any gradients across the whole array. Additionally, the maximum normal magnetic field noise over the detector surface should be less than within the signal bandwidth. These stringent requirements call for a careful design of magnetic shields that should provide a shielding factor of or more Bergen et al. (2016).
Orders of magnitude larger format pixel arrays are envisaged for the future proposed X-ray missions beyond Athena. To implement arrays greater than the k-pixel scale to 10’s, 100’s k-pixels or even mega pixel arrays will require further maturation of both focal plane array and readout technologies. In addition to hydras, other advanced focal plane technologies are being developed that could enable and expand the capabilities of next generation X-ray microcalorimeter instruments. This includes the development of advanced fabrication techniques that enable detectors of different designs to be fabricated in a single focal plane array, as well as high-yield, high density wiring. Hybrid arrays may include pixels of different pitch, absorber composition and TES transition temperature (or shape) and thus enable the flexibility to design different parts of the focal plane to achieve different performance requirements Wassell et al. (2017); Yoon et al. (2017). This could enable more efficient instruments with enhanced performance capabilities. For example a point-source array optimized for high angular resolution, high count-rate observations could be accompanied by an array to expand the field-of-view for diffuse observations. The use of hydras can alleviate some of the issues associated with routing of high-density array wiring within the focal-plane array. However, extremely fine ( 1 m), high yield wiring is particularly important where small pixel pitches are desired or when single pixel TESs are preferred over hydras Datesman et al. (2017). Multi-stack wiring layers buried directly within a Si wafer has been demonstrated by several commercial foundries such as Massachusetts Institute of Technology Lincoln Laboratory (MIT/LL) Tolpygo et al. (2015); Yohannes et al. (2015). Multilayer technology may eventually enable other components like the bias (shunt resistors and inductors) and SQUID readout circuitry to be fabricated withing the same wafer as the detector. This may enable more compact focal-plane designs reducing the instrument mass (smaller focal-plane assemblies and magnetic shielding) or enable even larger arrays.
Readout technologies (see Chapter ”Signal readout for Transition-Edge Sensor X-ray imaging spectrometers”) are also rapidly advancing. Looking beyond current state of the art readouts such as time-domain-multiplexing (TDM) and low frequency-division-multiplexing (FDM), microwave (GHz) multiplexing (-mux) is a rapidly maturing technology and is already fielded in ground based instruments Mates et al. (2017). In -mux each TES is coupled to an rf-SQUID and microwave resonator circuit. Each resonator is tuned to a different frequency and capacitively coupled to a single microwave feed-line. All pixels on the feed-line are then readout by a cryogenic amplifier such as a high-electron mobility transistor (HEMT). By moving the carrier signals to the GHz regime, -mux dramatically increases the available bandwidth and allows many pixels to be read-out on a single microwave feed-line. HEMT amplifiers dissipate a significant amount of power and thus limit the number that can be implemented in a space instrument with finite available cooling power. Travelling-wave parametric amplifiers (TWPA) are promising alternatives to semiconductor amplifiers like HEMTs, with the potential to provide low noise amplification at 4K with significantly lower power dissipation Malnou et al. (2021). Thus TWPA’s have the potential to yet further increase the number of pixels that can be readout for future instruments.
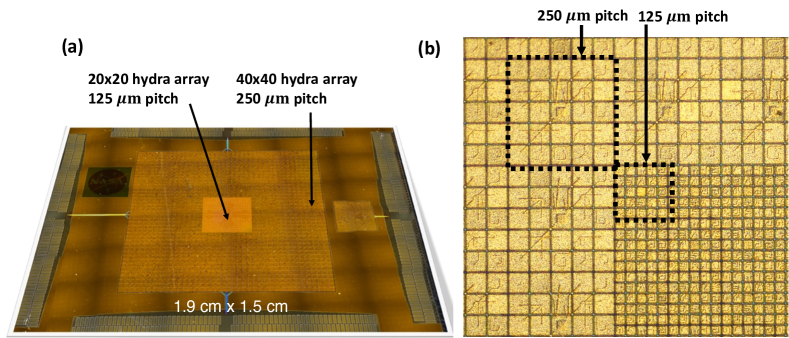
The Lynx X-ray telescope was a Flagship mission concept studied by NASA as part of the 2020 Astrophysics Decadal survey Gaskin et al. (2019). Although not selected to be the next Flagship, a Lynx-like mission was endorsed for further technology maturation and could launch sometime after 2040. The Lynx X-ray Microcalorimeter (LXM) is one of the main instruments that would combine a sub arc-second X-ray optic with a 100k-pixel array Bandler et al. (2019). LXM is an example of a instrument that combines of many of the advance detector and readout concepts described above. LXM consist of a hybrid array of three different detectors on the same substrate. The LXM main array consists of 3456, 25-pixel hydras on a 50 m pitch (86k total pixels) with eV at 0.2–7 keV. The main array provides a field-of-view of 5 arc-minutes and an angular resolution of 1 arc-second. The central 1 arc-minute region of the array consists 512, 25-pixel hydras with each pixel on a 25 m pitch (13k total pixels) Smith et al. (2020). This, enhanced main array will provide 0.5 arc-second imaging with eV up to 7 kev. Finally, there is an ultra-high resolution subarray of 25 m single pixel TESs, optimized to achieve eV up to 1 keV Sakai et al. (2020). NASA/GSFC has developed a process to incorporate planarized, multi-stack buried wiring layers from Massachusetts Institute of Technology Lincoln Laboratory (MIT/LL) with their TES array design. The LXM detector will be read-out with -mux and HEMT amplifiers Bennett et al. (2019). By combining 25-pixel hydras that incorporate buried wiring, with state-of-the-art -mux, it becomes practical to realize a 100k-pixel instrument within the engineering constraints of a satellite. Figure 18 shows a prototype LXM array that includes all three array types.
The Line Emission Mapper (LEM) is a probe-class mission concept under study by NASA for a possible launch in the 2030’s Ogorzalek et al. (2022). LEM will combine a Si-shell mirror with an extremely large format microcalorimeter array to provide a 30 arc-minute field-of-view (FOV), 15 arc-second angular resolution, and 2 eV energy resolution. In contrast to ESA’s Athena and NASA’s Lynx concept, LEM will focus on large FOV science below 2 keV, such as the chemistry of the circumgalactic medium (CGM) and intergalactic medium (IGM). LEM’s extremely large ”grasp” (FOV x effective array) — enables the mapping of faint extended sources such as IGM, GCM, 12 times more efficiently than Athena. The LEM microcalorimter will consist of 4k, 4-pixel hydras (16k total imaging elements) and will be readout using TDM. A hybrid array configuration that includes the addition of a small sub-array of 1 eV resolution pixels is also under consideration.
The Super Diffuse Intergalactic Oxygen Surveyor (Super-DIOS) is mission concept under study in Japan (ISAS/JAXA) Sato et al. (2020) with a possible launch after 2030. The satellite would perform wide field X-ray spectroscopy with a comparable FoV of about 0.5–1 deg, and with a angular resolution of 15 arc-seconds. The focal plane array will have 30k TESs read-out with -mux, with resolution similar to X-IFU. The Cosmic Web Explorer (CWE) is a concept being proposed in Europe as part of ESA’s Voyage-2050 program to survey the very faint warm-hot diffuse baryons in the local Universe Simionescu et al. (2019). CWE will have a mega-pixel array with resolving power of 3000 at 1 keV, comparable to the LXM ultra high resolution array, but with larger collecting area and angular resolution.
References
- Adams et al. (2020) Adams JS, Baker R, Bandler SR, Bastidon N, Danowski ME, Doriese WB, Eckart ME, Figueroa-Feliciano E, Goldfinger DC, Heine SNT, Hilton GC, Hubbard AJF, Kelley RL, Kilbourne CA, Manzagol-Harwood RE, McCammon D, Okajima T, Porter FS, Reintsema CD, Serlemitsos P, Smith SJ, Ullom JN, Wikus P (2020) First Operation of TES Microcalorimeters in Space with the Micro-X Sounding Rocket. Journal of Low Temperature Physics 199(3-4):1062–1071, DOI 10.1007/s10909-019-02293-5, 1908.09689
- Ahmad et al. (2019) Ahmad K, Liu J, Liu Q, Li G, Liu J, Chen W (2019) Fabrication and Characterization of Superconducting Bilayer (Al/Ti) Transition-Edge Sensor Bolometer Array. Journal of Electronic Materials 48(2):925–929, DOI 10.1007/s11664-018-6806-4
- Akamatsu et al. (2021) Akamatsu H, Vaccaro D, Gottardi L, van der Kuur J, de Vries CP, Kiviranta M, Ravensberg K, D’Andrea M, Taralli E, de Wit M, Bruijn MP, van der Hulst P, den Hartog RH, van Leeuwen BJ, van der Linden AJ, McCalden AJ, Nagayoshi K, Nieuwenhuizen ACT, Ridder ML, Visser S, van Winden P, Gao JR, Hoogeveen RWM, Jackson BD, den Herder JWA (2021) Demonstration of MHz frequency domain multiplexing readout of 37 transition edge sensors for high-resolution x-ray imaging spectrometers. Applied Physics Letters 119(18):182601, DOI 10.1063/5.0066240, 2111.01797
- Anderson and Rowell (1963) Anderson PW, Rowell JM (1963) Probable observation of the josephson superconducting tunneling effect. Phys Rev Lett 10:230–232, DOI 10.1103/PhysRevLett.10.230, URL https://link.aps.org/doi/10.1103/PhysRevLett.10.230
- Aslamazov and Larkin (1969) Aslamazov LG, Larkin AI (1969) Josephson effect in superconducting point contacts. JETP Lett (USSR) 9
- Bandler et al. (2008) Bandler SR, Brekosky RP, Brown AD, Chervenak JA, Figueroa-Feliciano E, Finkbeiner FM, Iyomoto N, Kelley RL, Kilbourne CA, Porter FS, Sadleir J, Smith SJ (2008) Performance of TES X-ray Microcalorimeters with a Novel Absorber Design. Journal of Low Temperature Physics 151(1-2):400–405, DOI 10.1007/s10909-007-9673-6
- Bandler et al. (2019) Bandler SR, Chervenak JA, Datesman AM, Devasia AM, DiPirro M, Sakai K, Smith SJ, Stevenson TR, Yoon W, Bennett D, Mates B, Swetz D, Ullom JN, Irwin KD, Eckart ME, Figueroa-Feliciano E, McCammon D, Ryu K, Olson J, Zeiger B (2019) Lynx x-ray microcalorimeter. Journal of Astronomical Telescopes, Instruments, and Systems 5:021017, DOI 10.1117/1.JATIS.5.2.021017
- Barbera et al. (2018) Barbera M, Cicero UL, Sciortino L, D’Anca F, Cicero GL, Parodi G, Sciortino S, Rauw G, Branduardi-Raymont G, Varisco S, Bonura SF, Collura A, Candia R, Cicca GD, Giglio P, Buttacavoli A, Cuttaia F, Villa F, Cappi M, Trong TL, Mesnager JM, Peille P, den Hartog R, den Herder JW, Jackson B, Barret D, Piro L (2018) ATHENA X-IFU thermal filters development status toward the end of the instrument phase-A. In: den Herder JWA, Nikzad S, Nakazawa K (eds) Space Telescopes and Instrumentation 2018: Ultraviolet to Gamma Ray, International Society for Optics and Photonics, SPIE, vol 10699, pp 406 – 420, DOI 10.1117/12.2314450, URL https://doi.org/10.1117/12.2314450
- Bardeen et al. (1957) Bardeen J, Cooper LN, Schrieffer JR (1957) Microscopic Theory of Superconductivity. Physical Review 106(1):162–164, DOI 10.1103/PhysRev.106.162
- Barone and Paterno´Gianfranco (1982) Barone A, Paterno´Gianfranco VL (1982) John Wiley & Sons, Ltd. DOI https://doi.org/10.1002/, URL https://onlinelibrary.wiley.com/doi/abs/10.1002/, %****␣TESastrobook_main_finalsubmitted.bbl␣Line␣100␣****https://onlinelibrary.wiley.com/doi/pdf/10.1002/
- Barret et al. (2018) Barret D, Trong TL, den Herder JW, Piro L, Cappi M, Houvelin J, Kelley R, et al. (2018) The ATHENA X-ray Integral Field Unit (X-IFU). In: den Herder JWA, Nikzad S, Nakazawa K (eds) Space Telescopes and Instrumentation 2018: Ultraviolet to Gamma Ray, International Society for Optics and Photonics, SPIE, vol 10699, pp 324 – 338, DOI 10.1117/12.2312409, URL https://doi.org/10.1117/12.2312409
- Bennett et al. (2010) Bennett DA, Horansky RD, Hoover AS, Hoteling NJ, Rabin MW, Schmidt DR, Swetz DS, Vale LR, Ullom JN (2010) An analytical model for pulse shape and electrothermal stability in two-body transition-edge sensor microcalorimeters. Applied Physics Letters 97(10):102504, DOI 10.1063/1.3486477
- Bennett et al. (2012) Bennett DA, Swetz DS, Horansky RD, Schmidt DR, Ullom JN (2012) A Two-Fluid Model for the Transition Shape in Transition-Edge Sensors. Journal of Low Temperature Physics 167(3-4):102–107, DOI 10.1007/s10909-011-0431-4
- Bennett et al. (2013) Bennett DA, Swetz DS, Schmidt DR, Ullom JN (2013) Resistance in transition-edge sensors: A comparison of the resistively shunted junction and two-fluid models. Phys Rev B 87:020508, DOI 10.1103/PhysRevB.87.020508
- Bennett et al. (2014) Bennett DA, Schmidt DR, Swetz DS, Ullom JN (2014) Phase-slip lines as a resistance mechanism in transition-edge sensors. Applied Physics Letters 104(4):042602, DOI 10.1063/1.4863664
- Bennett et al. (2019) Bennett DA, Mates JAB, Bandler SR, Becker DT, Fowler JW, Gard JD, Hilton GC, Irwin KD, Morgan KM, Reintsema CD, Sakai K, Schmidt DR, Smith SJ, Swetz DS, Ullom JN, Vale LR, Wessels AL (2019) Microwave SQUID multiplexing for the Lynx x-ray microcalorimeter. Journal of Astronomical Telescopes, Instruments, and Systems 5:021007, DOI 10.1117/1.JATIS.5.2.021007
- Bergen et al. (2016) Bergen A, van Weers HJ, Bruineman C, Dhallé MMJ, Krooshoop HJG, ter Brake HJM, Ravensberg K, Jackson BD, Wafelbakker CK (2016) Design and validation of a large-format transition edge sensor array magnetic shielding system for space application. Review of Scientific Instruments 87(10):105109, DOI 10.1063/1.4962157, URL https://doi.org/10.1063/1.4962157, https://doi.org/10.1063/1.4962157
- Boyce et al. (1999) Boyce KR, Audley MD, Baker RG, Dumonthier JJ, Fujimoto R, Gendreau KC, Ishisaki Y, Kelley RL, Stahle CK, Szymkowiak AE, Winkert GE (1999) Design and performance of the ASTRO-E/XRS signal processing system. In: Siegmund OH, Flanagan KA (eds) EUV, X-Ray, and Gamma-Ray Instrumentation for Astronomy X, Society of Photo-Optical Instrumentation Engineers (SPIE) Conference Series, vol 3765, pp 741–750, DOI 10.1117/12.366557
- Boyle and Rodgers (1959) Boyle WS, Rodgers KF (1959) Performance characteristics of a new low-temperature bolometer. J Opt Soc Am 49(1):66–69, DOI 10.1364/JOSA.49.000066, URL http://opg.optica.org/abstract.cfm?URI=josa-49-1-66
- Brown et al. (2008) Brown AD, Bandler SR, Brekosky R, Chervenak JA, Figueroa-Feliciano E, Finkbeiner F, Iyomoto N, Kelley RL, Kilbourne CA, Porter FS, Smith S, Saab T, Sadleir J (2008) Absorber Materials for Transition-Edge Sensor X-ray Microcalorimeters. J Low Temp Phys 151(1-2):413–417, DOI 10.1007/s10909-007-9669-2
- Brown et al. (2006) Brown GV, Beiersdorfer P, Chen H, Scofield JH, Boyce KR, Kelley RL, Kilbourne CA, Porter FS, Gu MF, Kahn SM, Szymkowiak AE (2006) Energy-dependent excitation cross section measurements of the diagnostic lines of fe xvii. Phys Rev Lett 96:253201, DOI 10.1103/PhysRevLett.96.253201, URL https://link.aps.org/doi/10.1103/PhysRevLett.96.253201
- Bruijn et al. (2018) Bruijn M, van der Linden A, Ferrari L, Gottardi L, van der Kuur J, den Hartog R, Akamatsu H, Jackson B (2018) Lc filters for fdm readout of the x-ifu tes calorimeter instrument on athena. J Low Temp Phys 193:661–667
- Bruijn et al. (2014) Bruijn MP, Gottardi L, den Hartog RH, van der Kuur J, van der Linden AJ, Jackson BD (2014) Tailoring the high-q lc filter arrays for readout of kilo-pixel tes arrays in the spica-safari instrument. J Low Temp Phys 176:421–425
- Busch et al. (2016) Busch SE, Adams JS, Bandler SR, Chervenak JA, Eckart ME, Finkbeiner FM, Fixsen DJ, Kelley RL, Kilbourne CA, Lee SJ, Moseley SH, Porst JP, Porter FS, Sadleir JE, Smith SJ (2016) Progress Towards Improved Analysis of TES X-ray Data Using Principal Component Analysis. Journal of Low Temperature Physics 184(1-2):382–388, DOI 10.1007/s10909-015-1357-z
- Chervenak et al. (2008) Chervenak JA, Finkbeiner FM, Bandler SR, Brekosky R, Brown AD, Iyomoto N, Kelley RL, Kilbourne CA, Porter FS, Sadleir J, Smith S (2008) Materials Development for Auxiliary Components for Large Compact Mo/Au TES Arrays. Journal of Low Temperature Physics 151(1-2):255–260, DOI 10.1007/s10909-007-9636-y
- Coffey et al. (2008) Coffey WT, Kalmykov YP, Titov SV, Cleary L (2008) Smoluchowski equation approach for quantum brownian motion in a tilted periodic potential. Phys Rev E 78:031114, DOI 10.1103/PhysRevE.78.031114, URL https://link.aps.org/doi/10.1103/PhysRevE.78.031114
- Cucchetti et al. (2018) Cucchetti E, Eckart ME, Peille P, Porter FS, Pajot F, Pointecouteau E (2018) Multi-parameter Nonlinear Gain Correction of X-ray Transition Edge Sensors for the X-ray Integral Field Unit. Journal of Low Temperature Physics 193(5-6):931–939, DOI 10.1007/s10909-018-1912-5
- Cucchetti et al. (2018a) Cucchetti E, Eckart ME, Peille P, de Vries C, Pajot F, Pointecouteau E, Leutenegger M, Kilbourne CA, Porter FS (2018a) Energy scale calibration and drift correction of the X-IFU. In: den Herder JWA, Nikzad S, Nakazawa K (eds) Space Telescopes and Instrumentation 2018: Ultraviolet to Gamma Ray, International Society for Optics and Photonics, SPIE, vol 10699, pp 1130 – 1140, DOI 10.1117/12.2312170, URL https://doi.org/10.1117/12.2312170
- Cucchetti et al. (2018b) Cucchetti E, Pajot F, Pointecouteau E, Peille P, Betancourt-Martinez G, Smith SJ, Barbera M, Eckart ME, Bandler SR, Kilbourne CA, Cappi M, Barret D (2018b) Testing the X-IFU calibration requirements: an example for quantum efficiency and energy resolution. In: den Herder JWA, Nikzad S, Nakazawa K (eds) Space Telescopes and Instrumentation 2018: Ultraviolet to Gamma Ray, International Society for Optics and Photonics, SPIE, vol 10699, pp 1152 – 1160, DOI 10.1117/12.2312188, URL https://doi.org/10.1117/12.2312188
- D’Andrea et al. (2018) D’Andrea M, Macculi C, Argan A, Lotti S, Minervini G, Piro L, Biasotti M, Ceriale V, Gallucci G, Gatti F, Torrioli G, Volpe A (2018) The cryogenic anticoincidence detector for ATHENA X-IFU: preliminary test of AC-S9 towards the demonstration model. In: den Herder JWA, Nikzad S, Nakazawa K (eds) Space Telescopes and Instrumentation 2018: Ultraviolet to Gamma Ray, Society of Photo-Optical Instrumentation Engineers (SPIE) Conference Series, vol 10699, p 106994T, DOI 10.1117/12.2313280, 1807.02344
- Datesman et al. (2017) Datesman AM, Adams JS, Bandler SR, Betancourt-Martinez GL, Chang MP, Chervenak JA, Eckart ME, Ewin AE, Finkbeiner FM, Ha JY, Kelley RL, Kilbourne CA, Miniussi AR, Porter FS, Sadleir JE, Sakai K, Smith SJ, Wakeham NA, Williams EH, Wassell EJ, Yoon W (2017) Reduced-Scale Transition-Edge Sensor Detectors for Solar and X-Ray Astrophysics. IEEE Transactions on Applied Superconductivity 27(4):2649839, DOI 10.1109/TASC.2017.2649839
- Davis and Packard (2002) Davis JC, Packard RE (2002) Superfluid josephson weak links. Rev Mod Phys 74:741–773, DOI 10.1103/RevModPhys.74.741, URL https://link.aps.org/doi/10.1103/RevModPhys.74.741
- de Vries et al. (2016) de Vries CP, Schouten RM, van der Kuur J, Gottardi L, Akamatsu H (2016) Microcalorimeter pulse analysis by means of principle component decomposition. In: den Herder JWA, Takahashi T, Bautz M (eds) Space Telescopes and Instrumentation 2016: Ultraviolet to Gamma Ray, Society of Photo-Optical Instrumentation Engineers (SPIE) Conference Series, vol 9905, p 99055V, DOI 10.1117/12.2231627, 1607.00834
- de Wit et al. (2021) de Wit M, Gottardi L, Taralli E, Nagayoshi K, Ridder ML, Akamatsu H, Bruijn MP, Hoogeveen RWM, van der Kuur J, Ravensberg K, Vaccaro D, Gao JR, den Herder JWA (2021) Impact of the Absorber-Coupling Design for Transition-Edge-Sensor X-Ray Calorimeters. Physical Review Applied 16(4):044059, DOI 10.1103/PhysRevApplied.16.044059, 2107.09552
- de Wit et al. (2022) de Wit M, Gottardi L, Ridder ML, Nagayoshi K, Taralli E, Akamatsu H, Vaccaro D, den Herder JWA, Bruijn MP, Gao JR (2022) Mitigation of the Magnetic Field Susceptibility of Transition-Edge Sensors Using a Superconducting Groundplane. Physical Review Applied 18(2):024066, DOI 10.1103/PhysRevApplied.18.024066, 2208.10775
- Doriese et al. (2009) Doriese WB, Adams JS, Hilton GC, Irwin KD, Kilbourne CA, Schima FJ, Ullom JN (2009) Optimal filtering, record length, and count rate in transition‐edge‐sensor microcalorimeters. AIP Conference Proceedings 1185(1):450–453, DOI 10.1063/1.3292375, URL https://aip.scitation.org/doi/abs/10.1063/1.3292375, https://aip.scitation.org/doi/pdf/10.1063/1.3292375
- Doriese et al. (2017) Doriese WB, Abbamonte P, Alpert BK, Bennett DA, Denison EV, Fang Y, Fischer DA, Fitzgerald CP, Fowler JW, Gard JD, Hays-Wehle JP, Hilton GC, Jaye C, McChesney JL, Miaja-Avila L, Morgan KM, Joe YI, O’Neil GC, Reintsema CD, Rodolakis F, Schmidt DR, Tatsuno H, Uhlig J, Vale LR, Ullom JN, Swetz DS (2017) A practical superconducting-microcalorimeter X-ray spectrometer for beamline and laboratory science. Review of Scientific Instruments 88(5):053108, DOI 10.1063/1.4983316
- Eckart et al. (2018) Eckart ME, Adams JS, Boyce KR, Brown GV, Chiao MP, Fujimoto R, Haas DA, den Herder JWA, Hoshino A, Ishisaki Y, Kilbourne CA, Kitamoto S, Leutenegger MA, McCammon D, Mitsuda K, Porter FS, Sato K, Sawada M, Seta H, Sneiderman GA, Szymkowiak AE, Takei Y, Tashiro MS, Tsujimoto M, de Vries CP, Watanabe T, Yamada S, Yamasaki NY (2018) Ground calibration of the Astro-H (Hitomi) soft x-ray spectrometer. Journal of Astronomical Telescopes, Instruments, and Systems 4(2):1 – 22, DOI 10.1117/1.JATIS.4.2.021406, URL https://doi.org/10.1117/1.JATIS.4.2.021406
- Eckart et al. (2019) Eckart ME, Adams JS, Bandler SR, Beaumont S, Chervenak JA, Datesman AM, Finkbeiner FM, Hummatov R, Kelley RL, Kilbourne CA, Leutenegger MA, Miniussi AR, Moseley SJ, Porter FS, Sadleir JE, Sakai K, Smith SJ, Wakeham NA, Wassell EJ (2019) Extended Line Spread Function of TES Microcalorimeters With Au/Bi Absorbers. IEEE Transactions on Applied Superconductivity 29(5):2903420, DOI 10.1109/TASC.2019.2903420
- Fabrega et al. (2009) Fabrega L, Fernandez-Martinez I, Gil O, Parra-Borderias M, Camon A, Costa-Kramer J, Gonzalez-Arrabal R, Sese J, Briones F, Santiso J, Peiro F (2009) Mo-based proximity bilayers for tes: Microstructure and properties. IEEE Transactions on Applied Superconductivity 19(3):460–464, DOI 10.1109/TASC.2009.2019052
- Feynman (1957) Feynman RP (1957) Superfluidity and superconductivity. Rev Mod Phys 29(2):205–212, DOI https://doi.org/10.1103/RevModPhys.29.205
- Figueroa-Feliciano (2004) Figueroa-Feliciano E (2004) Position-sensitive low-temperature detectors. Nuclear Instruments and Methods in Physics Research Section A: Accelerators, Spectrometers, Detectors and Associated Equipment 520(1):496–501, DOI https://doi.org/10.1016/j.nima.2003.11.297, URL https://www.sciencedirect.com/science/article/pii/S0168900203032194, proceedings of the 10th International Workshop on Low Temperature Detectors
- Finkbeiner et al. (2017) Finkbeiner FM, Adams JS, Bandler SR, Betancourt-Martinez GL, Brown AD, Chang MP, Chervenak JA, Chiao MP, Datesman AM, Eckart ME, Kelley RL, Kilbourne CA, Miniussi AR, Moseley SJ, Porter FS, Sadleir JE, Sakai K, Smith SJ, Wakeham NA, Wassell EJ, Yoon W (2017) Electron-Beam Deposition of Superconducting Molybdenum Thin Films for the Development of Mo/Au TES X-ray Microcalorimeter. IEEE Transactions on Applied Superconductivity 27(4):2633785, DOI 10.1109/TASC.2016.2633785
- Fixsen et al. (2004) Fixsen DJ, Moseley SH, Cabrera B, Figueroa-Feliciano E (2004) Pulse estimation in nonlinear detectors with nonstationary noise. Nuclear Instruments and Methods in Physics Research A 520(1-3):555–558, DOI 10.1016/j.nima.2003.11.313
- Fowler et al. (2015) Fowler JW, Alpert BK, Doriese WB, Fischer DA, Jaye C, Joe YI, O’Neil GC, Swetz DS, Ullom JN (2015) MICROCALORIMETER SPECTROSCOPY AT HIGH PULSE RATES: A MULTI-PULSE FITTING TECHNIQUE. The Astrophysical Journal Supplement Series 219(2):35, DOI 10.1088/0067-0049/219/2/35, URL https://doi.org/10.1088/0067-0049/219/2/35
- Fowler et al. (2016) Fowler JW, Alpert BK, Doriese WB, Joe YI, O’Neil GC, Ullom JN, Swetz DS (2016) The Practice of Pulse Processing. Journal of Low Temperature Physics 184(1-2):374–381, DOI 10.1007/s10909-015-1380-0, 1511.03950
- Fowler et al. (2017) Fowler JW, Alpert BK, Doriese WB, Hays-Wehle J, Joe YI, Morgan KM, O’Neil GC, Reintsema CD, Schmidt DR, Ullom JN, Swetz DS (2017) When “Optimal Filtering” Isn’t. IEEE Transactions on Applied Superconductivity 27(4):2637359, DOI 10.1109/TASC.2016.2637359
- Fowler et al. (2018) Fowler JW, Pappas CG, Alpert BK, Doriese WB, O’Neil GC, Ullom JN, Swetz DS (2018) Approaches to the Optimal Nonlinear Analysis of Microcalorimeter Pulses. Journal of Low Temperature Physics 193(3-4):539–546, DOI 10.1007/s10909-018-1892-5, 1803.02827
- Fowler et al. (2020) Fowler JW, Alpert BK, Joe YI, O’Neil GC, Swetz DS, Ullom JN (2020) A Robust Principal Component Analysis for Outlier Identification in Messy Microcalorimeter Data. Journal of Low Temperature Physics 199(3-4):745–753, DOI 10.1007/s10909-019-02248-w, 1911.00423
- Gall et al. (2020) Gall AC, Dipti, Buechele SW, Sanders S, Szabo CI, Silwal R, Ralchenko Y, Brickhouse N, Takacs E (2020) Measurements of linear polarization of satellite transitions from Li- and Be-like Ar ions. J Phys B Atom Molec Phys 53(14):145004, DOI 10.1088/1361-6455/ab8eff
- Gaskin et al. (2019) Gaskin JA, Swartz DA, Vikhlinin A, Özel F, Gelmis KE, Arenberg JW, Bandler SR, Bautz MW, Civitani MM, Dominguez A, Eckart ME, Falcone AD, Figueroa-Feliciano E, Freeman MD, Günther HM, Havey KA, Heilmann RK, Kilaru K, Kraft RP, McCarley KS, McEntaffer RL, Pareschi G, Purcell W, Reid PB, Schattenburg ML, Schwartz DA, Schwartz ED, Tananbaum HD, Tremblay GR, Zhang WW, Zuhone JA (2019) Lynx X-Ray Observatory: an overview. Journal of Astronomical Telescopes 5:021001, DOI 10.1117/1.JATIS.5.2.021001
- Geoffray et al. (2020) Geoffray H, Jackson B, Bandler S, Doriese WB, Kirivanta M, Prêle D, Ravera L, Argan A, Barbera M, van der Kuur J, van Leeuwen BJ, van Weers H, Hoogeveen R, den herder JW, Smith S, Adams J, Chervenak J, Durkin M, Reintsema C, Ullom J, Parot Y, Barret D, Macculi C, Piro L, Brachet F, Ledot A (2020) Conceptual design of the detection chain for the X-IFU on Athena. In: den Herder JWA, Nikzad S, Nakazawa K (eds) Space Telescopes and Instrumentation 2020: Ultraviolet to Gamma Ray, International Society for Optics and Photonics, SPIE, vol 11444, DOI 10.1117/12.2563628, URL https://doi.org/10.1117/12.2563628
- Goldie et al. (2009) Goldie DJ, Audley MD, Glowacka DM, Tsaneva VN, Withington S (2009) Thermal models and noise in transition edge sensors. Journal of Applied Physics 105(7):074512, DOI 10.1063/1.3097396, https://doi.org/10.1063/1.3097396
- Golubov et al. (2004) Golubov AA, Kupriyanov MY, Il’ichev E (2004) The current-phase relation in josephson junctions. Rev Mod Phys 76:411–469, DOI 10.1103/RevModPhys.76.411, URL https://link.aps.org/doi/10.1103/RevModPhys.76.411
- Gottardi and Nagayashi (2021) Gottardi L, Nagayashi K (2021) A review of x-ray microcalorimeters based on superconducting transition edge sensors for astrophysics and particle physics. Applied Sciences 11:3793
- Gottardi et al. (2014) Gottardi L, Kozorezov A, Akamatsu H, van der Kuur J, Bruijn MP, den Hartog RH, Hijmering R, Khosropanah P, Lambert C, van der Linden AJ, Ridder ML, Suzuki T, Gao JR (2014) Josephson effects in an alternating current biased transition edge sensor. Appl Phys Lett 105(16):162605
- Gottardi et al. (2017) Gottardi L, Akamatsu H, van der Kuur J, Smith SJ, Kozorezov A, Chervenak J (2017) Study of tes-based microcalorimeters of different size and geometry under ac bias. IEEE Transactions on Applied Superconductivity 27(4):1–4, DOI 10.1109/TASC.2017.2655500
- Gottardi et al. (2018) Gottardi L, Smith S, Kozorezov A, et al. (2018) Josephson effects in frequency-domain multiplexed tes microcalorimeters and bolometers. J Low Temp Phys 193:209–216
- Gottardi et al. (2019a) Gottardi L, van der Kuur J, Bruijn M, van der Linden A, Kiviranta M, Akamatsu H, den Hartog R, Ravensberg K (2019a) Intrinsic losses and noise of high-q lithographic mhz lc resonators for frequency division multiplexing. J Low Temp Phys 194:370–376
- Gottardi et al. (2019b) Gottardi L, van Weers H, Dercksen J, Akamatsu H, Bruijn MP, Gao JR, Jackson B, Khosropanah P, van der Kuur J, Ravensberg K, Ridder ML (2019b) A six-degree-of-freedom micro-vibration acoustic isolator for low-temperature radiation detectors based on superconducting transition-edge sensors. Review of Scientific Instruments 90(5):055107, DOI 10.1063/1.5088364
- Gottardi et al. (2021) Gottardi L, de Wit M, Taralli E, Nagayashi K, Kozorezov A (2021) Voltage Fluctuations in ac Biased Superconducting Transition-Edge Sensors. Phys Rev Lett 126(21):217001, DOI 10.1103/PhysRevLett.126.217001
- Hays-Wehle et al. (2016) Hays-Wehle JP, Schmidt DR, Ullom JN, Swetz DS (2016) Thermal Conductance Engineering for High-Speed TES Microcalorimeters. Journal of Low Temperature Physics 184(1-2):492–497, DOI 10.1007/s10909-015-1416-5
- Hitomi Collaboration et al. (2016) Hitomi Collaboration, Aharonian F, Akamatsu H, Akimoto F, Allen SW, Anabuki N, Angelini L, Arnaud K, Audard M, Awaki H, Axelsson M, Bamba A, Bautz M, Blandford R, Brenneman L, Brown GV, Bulbul E, Cackett E, Chernyakova M, Chiao M, Coppi P, Costantini E, de Plaa J, den Herder JW, Done C, Dotani T, Ebisawa K, Eckart M, Enoto T, Ezoe Y, Fabian AC, Ferrigno C, Foster A, Fujimoto R, Fukazawa Y, Furuzawa A, Galeazzi M, Gallo L, Gandhi P, Giustini M, Goldwurm A, Gu L, Guainazzi M, Haba Y, Hagino K, Hamaguchi K, Harrus I, Hatsukade I, Hayashi K, Hayashi T, Hayashida K, Hiraga J, Hornschemeier A, Hoshino A, Hughes J, Iizuka R, Inoue H, Inoue Y, Ishibashi K, Ishida M, Ishikawa K, Ishisaki Y, Itoh M, Iyomoto N, Kaastra J, Kallman T, Kamae T, Kara E, Kataoka J, Katsuda S, Katsuta J, Kawaharada M, Kawai N, Kelley R, Khangulyan D, Kilbourne C, King A, Kitaguchi T, Kitamoto S, Kitayama T, Kohmura T, Kokubun M, Koyama S, Koyama K, Kretschmar P, Krimm H, Kubota A, Kunieda H, Laurent P, Lebrun F, Lee SH, Leutenegger M, Limousin O, Loewenstein M, Long KS, Lumb D, Madejski G, Maeda Y, Maier D, Makishima K, Markevitch M, Matsumoto H, Matsushita K, McCammon D, McNamara B, Mehdipour M, Miller E, Miller J, Mineshige S, Mitsuda K, Mitsuishi I, Miyazawa T, Mizuno T, Mori H, Mori K, Moseley H, Mukai K, Murakami H, Murakami T, Mushotzky R, Nagino R, Nakagawa T, Nakajima H, Nakamori T, Nakano T, Nakashima S, Nakazawa K, Nobukawa M, Noda H, Nomachi M, O’Dell S, Odaka H, Ohashi T, Ohno M, Okajima T, Ota N, Ozaki M, Paerels F, Paltani S, Parmar A, Petre R, Pinto C, Pohl M, Porter FS, Pottschmidt K, Ramsey B, Reynolds C, Russell H, Safi-Harb S, Saito S, Sakai K, Sameshima H, Sato G, Sato K, Sato R, Sawada M, Schartel N, Serlemitsos P, Seta H, Shidatsu M, Simionescu A, Smith R, Soong Y, Stawarz L, Sugawara Y, Sugita S, Szymkowiak A, Tajima H, Takahashi H, Takahashi T, Takeda S, Takei Y, Tamagawa T, Tamura K, Tamura T, Tanaka T, Tanaka Y, Tanaka Y, Tashiro M, Tawara Y, Terada Y, Terashima Y, Tombesi F, Tomida H, Tsuboi Y, Tsujimoto M, Tsunemi H, Tsuru T, Uchida H, Uchiyama H, Uchiyama Y, Ueda S, Ueda Y, Ueno S, Uno S, Urry M, Ursino E, de Vries C, Watanabe S, Werner N, Wik D, Wilkins D, Williams B, Yamada S, Yamaguchi H, Yamaoka K, Yamasaki NY, Yamauchi M, Yamauchi S, Yaqoob T, Yatsu Y, Yonetoku D, Yoshida A, Yuasa T, Zhuravleva I, Zoghbi A (2016) The quiescent intracluster medium in the core of the Perseus cluster. Nature 535(7610):117–121, DOI 10.1038/nature18627, 1607.04487
- Hoevers et al. (2000) Hoevers HFC, Bento AC, Bruijn MP, Gottardi L, Korevaar MAN, Mels WA, de Korte PAJ (2000) Thermal fluctuation noise in a voltage biased superconducting transition edge thermometer. Appl Phys Lett 77(26):4422–4424
- Hoevers et al. (2005) Hoevers HFC, Ridder ML, Germeau A, Bruijn MP, de Korte PAJ, Wiegerink RJ (2005) Radiative ballistic phonon transport in silicon-nitride membranes at low temperatures. Applied Physics Letters 86(25):251903, DOI 10.1063/1.1949269, URL https://doi.org/10.1063/1.1949269, https://doi.org/10.1063/1.1949269
- Hollerith et al. (2006) Hollerith C, Simmnacher B, Weiland R, Feilitzsch Fv, Isaila C, Jochum J, Potzel W, Höhne J, Phelan K, Wernicke D, May T (2006) Energy calibration of superconducting transition edge sensors for x-ray detection using pulse analysis. Review of Scientific Instruments 77(5):053105-053105-6, DOI 10.1063/1.2202911
- Hubmayr et al. (2011) Hubmayr J, Austermann JE, Beall JA, Becker D, Bennett DA, Benson BA, Bleem LE, Chang CL, Carlstrom JE, Cho H, Crites AT, Dobbs M, Everett W, George EM, Holzapfel WL, Halverson NW, Henning JW, Hilton GC, Irwin KD, Li D, Lowell P, Lueker M, McMahon J, Mehl J, Meyer SS, Nibarger JP, Niemack MD, Schmidt DR, Shirokoff E, Simon SM, Yoon KW, Young EY (2011) Stability of al-mn transition edge sensors for frequency domain multiplexing. IEEE Transactions on Applied Superconductivity 21(3):203–206, DOI 10.1109/TASC.2010.2090630
- Hummatov et al. (2020) Hummatov R, Adams JS, Bandler SR, Barlis A, Beaumont S, Chang MP, Chervenak JA, Datesman AM, Eckart ME, Finkbeiner FM, Ha JY, Kelley RL, Kilbourne CA, Miniussi AR, Porter FS, Sadleir JE, Sakai K, Smith SJ, Wakeham N, Wassell EJ, Wollack EJ (2020) Quantum Efficiency Study and Reflectivity Enhancement of Au/Bi Absorbers. Journal of Low Temperature Physics 199(1-2):393–400, DOI 10.1007/s10909-020-02424-3
- Irwin (2006) Irwin K (2006) Thermodynamics of nonlinear bolometers near equilibrium. Nucl Instrum and Methods Phys Res Sect A 559(2):718 – 720
- Irwin and Hilton (2005) Irwin K, Hilton G (2005) Transition-Edge Sensors, Springer Berlin Heidelberg, Berlin, Heidelberg, pp 63–150. DOI 10.1007/10933596˙3, URL https://doi.org/10.1007/10933596_3
- Irwin (1995) Irwin KD (1995) An application of electrothermal feedback for high resolution cryogenic particle detection. Appl Phys Lett 66(15):1998–2000
- Irwin et al. (2018) Irwin KD, Chaudhuri S, Cho HM, Dawson C, Kuenstner S, Li D, Titus CJ, Young BA (2018) A Spread-Spectrum SQUID Multiplexer. Journal of Low Temperature Physics 193(3-4):476–484, DOI 10.1007/s10909-018-1987-z, 1806.02805
- Iyomoto et al. (2006) Iyomoto N, Bandler S, Brekosky R, Chervenak J, Figueroa-Feliciano E, Finkbeiner F, Kelley R, Kilbourne C, Lindeman M, Murphy K, Porter F, Saab T, Sadleir J, Talley D (2006) Position-sensitive transition-edge sensors. Nuclear Instruments and Methods in Physics Research Section A: Accelerators, Spectrometers, Detectors and Associated Equipment 559(2):491–493, DOI https://doi.org/10.1016/j.nima.2005.12.082, URL https://www.sciencedirect.com/science/article/pii/S0168900205025106, proceedings of the 11th International Workshop on Low Temperature Detectors
- Jackson et al. (2016) Jackson BD, van Weers H, van der Kuur J, den Hartog R, Akamatsu H, Argan A, Bandler SR, Barbera M, Barret D, Bruijn MP, Chervenak JA, Dercksen J, Gatti F, Gottardi L, Haas D, den Herder JW, Kilbourne CA, Kiviranta M, Lam-Trong T, van Leeuwen BJ, Macculi C, Piro L, Smith SJ (2016) The focal plane assembly for the Athena X-ray Integral Field Unit instrument. In: den Herder JWA, Takahashi T, Bautz M (eds) Space Telescopes and Instrumentation 2016: Ultraviolet to Gamma Ray, Society of Photo-Optical Instrumentation Engineers (SPIE) Conference Series, vol 9905, p 99052I, DOI 10.1117/12.2232544
- Jethava et al. (2009) Jethava N, Ullom JN, Irwin KD, Doriese WB, Beall JA, Hilton GC, Vale LR, Zink B (2009) Dependence of excess noise on the partial derivatives of resistance in superconducting transition edge sensors. AIP Conference Proceedings 1185(1):31–33, DOI 10.1063/1.3292343
- Josephson (1962) Josephson BD (1962) Possible new effects in superconductive tunnelling. Physics Letters 1(7):251–253, DOI 10.1016/0031-9163(62)91369-0
- Kammoun et al. (2022) Kammoun ES, Barret D, Peille P, Willingale R, Dauser T, Wilms J, Guainazzi M, Miller JM (2022) The defocused observations of bright sources with Athena/X-IFU. arXiv e-prints arXiv:2205.01126, 2205.01126
- Kinnunen et al. (2012) Kinnunen KM, Palosaari MRJ, Maasilta IJ (2012) Normal metal-superconductor decoupling as a source of thermal fluctuation noise in transition-edge sensors. J Appl Phys 112(3):034515
- Kirsch et al. (2020) Kirsch C, Gottardi L, Lorenz M, Dauser T, den Hartog R, Jackson B, Peille P, Smith S, Wilms J (2020) Time-domain modeling of tes microcalorimeters under ac bias. J Low Temp Phys 199:569–576
- Kiviranta et al. (2002) Kiviranta M, Seppä H, van der Kuur J, de Korte P (2002) Squid-based readout schemes for microcalorimeter arrays. AIP Conference Proceedings 605(1):295–300, DOI 10.1063/1.1457649
- Koch et al. (1980) Koch RH, Van Harlingen DJ, Clarke J (1980) Quantum-noise theory for the resistively shunted josephson junction. Phys Rev Lett 45:2132–2135, DOI 10.1103/PhysRevLett.45.2132, URL https://link.aps.org/doi/10.1103/PhysRevLett.45.2132
- Kogan and Nagaev (1988) Kogan SM, Nagaev K (1988) Zh Eksp Teor Fiz 94:262
- Kozorezov et al. (2011) Kozorezov A, Golubov AA, Martin D, de Korte P, Lindeman M, Hijmering R, van der Kuur J, Hoevers H, Gottardi L, Kupriyanov M, Wigmore J (2011) Appl Phys Lett 99:063503
- Kozorezov et al. (2012) Kozorezov A, Golubov A, Martin D, de Korte P, Lindeman M, Hijmering R, van der Kuur J, Hoevers H, Gottardi L, Kupriyanov M, JK W (2012) Electrical noise in a tes as a resistively shunted conducting junction. J Low Temp Phys 167:108–113, DOI 10.1007/s10909-012-0489-7
- Kunieda et al. (2006) Kunieda Y, Takahashi H, Zen N, Damayanthi R, Mori F, Fujita K, Nakazawa M, Fukuda D, Ohkubo M (2006) Characterization of ir/au pixel tes. Nuclear Instruments and Methods in Physics Research Section A: Accelerators, Spectrometers, Detectors and Associated Equipment 559(2):429–431, DOI https://doi.org/10.1016/j.nima.2005.12.029, URL https://www.sciencedirect.com/science/article/pii/S0168900205024204, proceedings of the 11th International Workshop on Low Temperature Detectors
- van der Kuur et al. (2011) van der Kuur J, Gottardi L, Borderias M, Dirks B, de Korte P, Lindeman M, Khosropanah P, den Hartog R, Hoevers H (2011) Small-signal behavior of a TES under ac bias. IEEE Trans Appl Supercond 21(3):281–284
- Landau and Ginzburg (1950) Landau LD, Ginzburg VL (1950) On the theory of superconductivity. Zh Eksp Teor Fiz 20:1064, URL http://cds.cern.ch/record/486430
- Lee et al. (2015) Lee SJ, Adams JS, Bandler SR, Chervenak JA, Eckart ME, Finkbeiner FM, Kelley RL, Kilbourne CA, Porter FS, Sadleir JE, Smith SJ, Wassell EJ (2015) Fine pitch transition-edge sensor X-ray microcalorimeters with sub-eV energy resolution at 1.5 keV. Applied Physics Letters 107(22):223503, DOI 10.1063/1.4936793
- Leutenegger et al. (2020) Leutenegger MA, Eckart ME, Moseley SJ, Rohrbach SO, Black JK, Chiao MP, Kelley RL, Kilbourne CA, Porter FS (2020) Simple, compact, high-resolution monochromatic x-ray source for characterization of x-ray calorimeter arrays. Review of Scientific Instruments 91(8):083110, DOI 10.1063/5.0005206, URL https://doi.org/10.1063/5.0005206, https://doi.org/10.1063/5.0005206
- Levine et al. (1988) Levine MA, Marrs RE, Henderson JR, Knapp DA, Schneider MB (1988) The electron beam ion trap: A new instrument for atomic physics measurements. Physica Scripta T22:157–163, DOI 10.1088/0031-8949/1988/t22/024, URL https://doi.org/10.1088
- Levy et al. (2007) Levy S, Lahoud E, Shomroni I, Steinhauer J (2007) The a.c. and d.c. Josephson effects in a Bose-Einstein condensate. Nature 449(7162):579–583, DOI 10.1038/nature06186
- Likharev (1979) Likharev K (1979) Rev Mod Phys 51:101
- Likharev and Semenow (1972) Likharev K, Semenow V (1972) SovPhys JEPT Lett 15:442
- Lindeman et al. (2004a) Lindeman MA, Bandler S, Brekosky RP, Chervenak JA, Figueroa-Feliciano E, Finkbeiner FM, Li MJ, Kilbourne CA (2004a) Impedance measurements and modeling of a transition-edge-sensor calorimeter. Rev Sci Instrum 75(5):1283–1289
- Lindeman et al. (2004b) Lindeman MA, Bandler S, Brekosky RP, Chervenak JA, Figueroa-Feliciano E, Finkbeiner FM, Saab T, Stahle CK (2004b) Characterization and reduction of noise in mo/au transition edge sensors. Nuclear Instruments and Methods in Physics Research Section A: Accelerators, Spectrometers, Detectors and Associated Equipment 520(1):348 – 350, DOI https://doi.org/10.1016/j.nima.2003.11.264, URL http://www.sciencedirect.com/science/article/pii/S0168900203031632, proceedings of the 10th International Workshop on Low Temperature Detectors
- Lindeman et al. (2011) Lindeman MA, Dirks B, van der Kuur J, de Korte PAJ, den Hartog RH, Gottardi L, Hijmering RA, Hoevers HFC, Khosropanah P (2011) Relationships between complex impedance, thermal response, and noise in tes calorimeters and bolometers. IEEE Transactions on Applied Superconductivity 21(3):254–257, DOI 10.1109/TASC.2010.2096173
- Lita et al. (2005) Lita AE, Rosenberg D, Nam S, Miller AJ, Balzar D, Kaatz LM, Schwall RE (2005) Tuning of tungsten thin film superconducting transition temperature for fabrication of photon number resolving detectors. IEEE Transactions on Applied Superconductivity 15(2):3528–3531, DOI 10.1109/TASC.2005.849033
- Lolli et al. (2016) Lolli L, Taralli E, Portesi C, Rajteri M, Monticone E (2016) Aluminum–titanium bilayer for near-infrared transition edge sensors. Sensors 16(7), DOI 10.3390/s16070953, URL https://www.mdpi.com/1424-8220/16/7/953
- Lorenz et al. (2020) Lorenz M, Kirsch C, Merino-Alonso PE, Peille P, Dauser T, Cucchetti E, Smith SJ, Wilms J (2020) GPU Supported Simulation of Transition-Edge Sensor Arrays. Journal of Low Temperature Physics 200(5-6):277–285, DOI 10.1007/s10909-020-02450-1
- Lotti et al. (2018) Lotti S, Macculi C, D’Andrea M, Fioretti V, Dondero P, Mantero A, Minervini G, Argan A, Piro L (2018) Estimates for the background of the ATHENA X-IFU instrument: the cosmic rays contribution. In: den Herder JWA, Nikzad S, Nakazawa K (eds) Space Telescopes and Instrumentation 2018: Ultraviolet to Gamma Ray, International Society for Optics and Photonics, SPIE, vol 10699, pp 397 – 405, DOI 10.1117/12.2313236
- Lotti et al. (2021) Lotti S, D’Andrea M, Molendi S, Macculi C, Minervini G, Fioretti V, Laurenza M, Jacquey C, Piro L (2021) Review of the particle background of the Athena X-IFU instrument. arXiv e-prints arXiv:2101.02526, 2101.02526
- Maasilta (2012) Maasilta IJ (2012) Complex impedance, responsivity and noise of transition-edge sensors: Analytical solutions for two- and three-block thermal models. AIP Advances 2(4):042110
- Malnou et al. (2021) Malnou M, Aumentado J, Vissers MR, Wheeler JD, Hubmayr J, Ullom JN, Gao J (2021) Performance of a Kinetic-Inductance Traveling-Wave Parametric Amplifier at 4 Kelvin: Toward an Alternative to Semiconductor Amplifiers. arXiv e-prints arXiv:2110.08142, 2110.08142
- Mates et al. (2017) Mates JAB, Becker DT, Bennett DA, Dober BJ, Gard JD, Hays-Wehle JP, Fowler JW, Hilton GC, Reintsema CD, Schmidt DR, Swetz DS, Vale LR, Ullom JN (2017) Simultaneous readout of 128 x-ray and gamma-ray transition-edge microcalorimeters using microwave squid multiplexing. Applied Physics Letters 111(6):062601, DOI 10.1063/1.4986222
- McCammon (2005) McCammon D (2005) Thermal Equilibrium Calorimeters – An Introduction, Springer Berlin Heidelberg, Berlin, Heidelberg, pp 1–34. DOI 10.1007/10933596˙1, URL https://doi.org/10.1007/10933596_1
- Miniussi et al. (2018) Miniussi AR, Adams JS, Bandler SR, Chervenak JA, Datesman AM, Eckart ME, Ewin AJ, Finkbeiner FM, Kelley RL, Kilbourne CA, Porter FS, Sadleir JE, Sakai K, Smith SJ, Wakeham NA, Wassell EJ, Yoon W (2018) Performance of an x-ray microcalorimeter with a 240 m absorber and a 50 m tes bilayer. J Low Temp Phys 193(3):337–343
- Miniussi et al. (2020) Miniussi AR, Adams JS, Bandler SR, Beaumont S, Chang MP, Chervenak JA, Finkbeiner FM, Ha JY, Hummatov R, Kelley RL, Kilbourne CA, Porter FS, Sadleir JE, Sakai K, Smith SJ, Wakeham NA, Wassell EJ (2020) Thermal impact of cosmic ray interaction with an x-ray microcalorimeter array. J Low Temp Phys 199:45–55
- Morgan et al. (2017) Morgan KM, Pappas CG, Bennett DA, Gard JD, Hays-Wehle JP, Hilton GC, Reintsema CD, Schmidt DR, Ullom JN, Swetz DS (2017) Dependence of transition width on current and critical current in transition-edge sensors. Applied Physics Letters 110(21):212602, DOI 10.1063/1.4984065
- Morgan et al. (2019) Morgan KM, Becker DT, Bennett DA, Doriese WB, Gard JD, Irwin KD, Lee SJ, Li D, Mates JAB, Pappas CG, Schmidt DR, Titus CJ, Van Winkle DD, Ullom JN, Wessels A, Swetz DS (2019) Use of transition models to design high performance tess for the lcls-ii soft x-ray spectrometer. IEEE Transactions on Applied Superconductivity 29(5):1–5, DOI 10.1109/TASC.2019.2903032
- Mori et al. (2008) Mori F, Minamikawa Y, Damayanthi RMT, Leman S, Zen N, Ohno M, Takahashi H, Toyokawa H, Tanida H, Uruga T (2008) Synchrotron beam test of a position-sensitive small-pixel ir-tes array. Journal of Low Temperature Physics 151(1-2):150–154, DOI –10.1007/s10909-007-9625-1˝, 12th International Workshop on Low Temperature Detectors, Paris, FRANCE, JUL 22-27, 2007
- Nagayoshi et al. (2020) Nagayoshi K, Ridder ML, Bruijn MP, Gottardi L, Taralli E, Khosropanah P, Akamatsu H, Visser S, Gao JR (2020) Development of a Ti/Au TES Microcalorimeter Array as a Backup Sensor for the Athena/X-IFU Instrument. Journal of Low Temperature Physics 199:943–948
- Ogorzalek et al. (2022) Ogorzalek A, Bandler S, Cumbee R, Hodges-Kluck E, Kilbourne C, Leutenegger M, Markevitch M, McCammon D, Porter FS, Ptak A, Sakai K, Smith S, Williams B, Yoon W, Zhang W (2022) Probing physics of galaxy formation with a wide-field X-ray microcalorimeter. In: AAS/High Energy Astrophysics Division, AAS/High Energy Astrophysics Division, vol 54, p 108.41
- O’Neil et al. (2020a) O’Neil G, Sanders S, Szypryt P, Dipti A Gall, Yang Y, Brewer SM, Doriese R, Fowler J, Naing A, Swetz D, Tan J, Ullom J, Volotka AV, Takacs E, Ralchenko Y (2020a) Measurement of the 1/22P-3/22P fine-structure splitting in fluorinelike Kr, W, Re, Os, and Ir. Phys Rev A 102(3):032803, DOI 10.1103/PhysRevA.102.032803
- O’Neil et al. (2020b) O’Neil GC, Szypryt P, Takacs E, Tan JN, Buechele SW, Naing AS, Joe YI, Swetz D, Schmidt DR, Doriese WB, Gard JD, Reintsema CD, Ullom JN, Villarrubia JS, Ralchenko Y (2020b) On Low-Energy Tail Distortions in the Detector Response Function of X-Ray Microcalorimeter Spectrometers. Journal of Low Temperature Physics 199(3-4):1046–1054, DOI 10.1007/s10909-019-02270-y, 2005.05395
- Orlando et al. (2018) Orlando A, Ceriale V, Ceruti G, De Gerone M, Faverzani M, Ferri E, Gallucci G, Giachero A, Nucciotti A, Puiu A, Schmidt D, Swetz D, Ullom J (2018) Microfabrication of transition-edge sensor arrays of microcalorimeters with 163ho for direct neutrino mass measurements with holmes. Journal of Low Temperature Physics 193, DOI 10.1007/s10909-018-1968-2
- Parra-Borderias et al. (2013) Parra-Borderias M, Fernandez-Martinez I, Fabrega L, Camon A, Gil O, Costa-Kramer JL, Gonzalez-Arrabal R, Sese J, Bueno J, Briones F (2013) Characterization of a Mo/Au Thermometer for ATHENA. IEEE Transactions on Applied Superconductivity 23(3):2300405–2300405, DOI 10.1109/TASC.2012.2236140
- Peille et al. (2018) Peille P, Dauser T, Kirsch C, den Hartog R, Cucchetti E, Wilms J, Barret D, den Herder JW, Piro L (2018) The Performance of the Athena X-ray Integral Field Unit at Very High Count Rates. Journal of Low Temperature Physics 193(5-6):940–948, DOI 10.1007/s10909-018-1964-6
- Peille et al. (2020) Peille P, den Hartog R, Miniussi A, Stever S, Bandler S, Kirsch C, Lorenz M, Dauser T, Wilms J, Lotti S, Gatti F, Macculi C, Jackson B, Pajot F (2020) J Low Temp Phys 199:240–249
- Porter et al. (2000) Porter FS, Audley MD, Beiersdorfer P, Boyce KR, Brekosky RP, Brown GV, Gendreau KC, Gygax JD, Kahn SM, Kelley RL, Stahle CK, Szymkowiak AE (2000) Laboratory astrophysics using a spare XRS microcalorimeter. In: Flanagan KA, Siegmund OHW (eds) X-Ray and Gamma-Ray Instrumentation for Astronomy XI, International Society for Optics and Photonics, SPIE, vol 4140, pp 407 – 418, DOI 10.1117/12.409137, URL https://doi.org/10.1117/12.409137
- Porter et al. (2008) Porter FS, Gygax J, Kelley RL, Kilbourne CA, King JM, Beiersdorfer P, Brown GV, Thorn DB, Kahn SM (2008) Performance of the ebit calorimeter spectrometer. Review of Scientific Instruments 79(10):10E307, DOI 10.1063/1.2957925, URL https://doi.org/10.1063/1.2957925, https://doi.org/10.1063/1.2957925
- Porter et al. (2016) Porter FS, Chiao MP, Eckart ME, Fujimoto R, Ishisaki Y, Kelley RL, Kilbourne CA, Leutenegger MA, McCammon D, Mitsuda K, Sawada M, Szymkowiak AE, Takei Y, Tashiro M, Tsujimoto M, Watanabe T, Yamada S (2016) Temporal Gain Correction for X-ray Calorimeter Spectrometers. Journal of Low Temperature Physics 184(1-2):498–504, DOI 10.1007/s10909-016-1503-2
- Rothe et al. (2018) Rothe J, Angloher G, Bauer P, Bento A, Bucci C, Canonica L, D’Addabbo A, Defay X, Erb A, Feilitzsch Fv, Ferreiro Iachellini N, Gorla P, Gütlein A, Hauff D, Jochum J, Kiefer M, Kluck H, Kraus H, Lanfranchi JC, Langenkämper A, Loebell J, Mancuso M, Mondragon E, Münster A, Pagliarone C, Petricca F, Potzel W, Pröbst F, Puig R, Reindl F, Schäffner K, Schieck J, Schipperges V, Schönert S, Seidel W, Stahlberg M, Stodolsky L, Strandhagen C, Strauss R, Tanzke A, Trinh Thi HH, Türkoğlu C, Ulrich A, Usherov I, Wawoczny S, Willers M, Wüstrich M (2018) TES-Based Light Detectors for the CRESST Direct Dark Matter Search. Journal of Low Temperature Physics 193(5-6):1160–1166, DOI 10.1007/s10909-018-1944-x
- Sadleir et al. (2010) Sadleir J, Smith S, Bandler S, Chervenak J, Clem J (2010) Phys Rev Lett 104:047003
- Sadleir et al. (2011) Sadleir JE, Smith SJ, Robinson IK, Finkbeiner FM, Chervenak JA, Bandler SR, Eckart ME, Kilbourne CA (2011) Proximity effects and nonequilibrium superconductivity in transition-edge sensors. Phys Rev B 84:184502, DOI 10.1103/PhysRevB.84.184502, URL https://link.aps.org/doi/10.1103/PhysRevB.84.184502
- Sadleir et al. (2014) Sadleir JE, Lee SJ, Smith SJ, Busch SE, Bandler SR, Adams JS, Eckart ME, Chervenak JA, Kelley RL, Kilbourne CA, Porter FS, Porst JP (2014) The Magnetically-Tuned Transition-Edge Sensor. Journal of Low Temperature Physics 176(3-4):392–399, DOI 10.1007/s10909-014-1194-5
- Sakai et al. (2018) Sakai K, Adams JS, Bandler SR, Chervenak JA, Datesman AM, Eckart ME, Finkbeiner FM, Kelley RL, Kilbourne CA, Miniussi AR, Porter FS, Sadleir JS, Smith SJ, Wakeham NA, Wassell EJ, Yoon W, Akamatsu H, Bruijn MP, Gottardi L, Jackson BD, van der Kuur J, van Leeuwen BJ, van der Linden AJ, van Weers HJ, Kiviranta M (2018) Study of Dissipative Losses in AC-Biased Mo/Au Bilayer Transition-Edge Sensors. Journal of Low Temperature Physics 193(3-4):356–364, DOI 10.1007/s10909-018-2002-4
- Sakai et al. (2019) Sakai K, Adams J, Bandler SR, Beaumont S, Chervenak J, Datesman A, Finkbeiner F, Kelley R, Kilbourne C, Miniussi A, Porter F, Sadleir J, Smith S, Wakeham N, Wassell E, Eckart M, Ryu K (2019) Demonstration of fine-pitch high resolution x-ray transition-edge sensor microcalorimeters optimized for energies below 1 kev. Presented at the 18th International Workshop on Low Temperature Detectors (LTD 18), Milano, Italy, July 22-26
- Sakai et al. (2020) Sakai K, Adams JS, Bandler SR, Beaumont S, Chervenak JA, Datesman AM, Finkbeiner FM, Kelley RL, Kilbourne CA, Miniussi AR, Porter FS, Sadleir JE, Smith SJ, Wakeham NA, Wassell EJ, Jaeckel FT, McCammon D, Eckart ME, Ryu K (2020) Demonstration of fine-pitch high-resolution x-ray transition-edge sensor microcalorimeters optimized for energies below 1 kev. J Low Temp Phys 199:949–954
- Sato et al. (2020) Sato K, Ohashi T, Ishisaki Y, Ezoe Y, Yamada S, et al. (2020) Super DIOS mission for exploring ”dark baryon”. In: den Herder JWA, Nikzad S, Nakazawa K (eds) Space Telescopes and Instrumentation 2020: Ultraviolet to Gamma Ray, International Society for Optics and Photonics, SPIE, vol 11444, pp 960 – 969, DOI 10.1117/12.2561681
- Seta et al. (2012) Seta H, Tashiro MS, Ishisaki Y, Tsujimoto M, Shimoda Y, Takeda S, Yamaguchi S, Mitsuda K, Fujimoto R, Takei Y, Kelley RL, Boyce KR, Kilbourne CA, Porter FS, Miko JJ, Masukawa K, Matsuda K (2012) Development of the onboard digital processing system for the soft x-ray spectrometer of ASTRO-H: performance in the engineering model tests. In: Takahashi T, Murray SS, den Herder JWA (eds) Space Telescopes and Instrumentation 2012: Ultraviolet to Gamma Ray, International Society for Optics and Photonics, SPIE, vol 8443, pp 1542 – 1551, DOI 10.1117/12.924638, URL https://doi.org/10.1117/12.924638
- Shank et al. (2014) Shank B, Yen JJ, Cabrera B, Kreikebaum JM, Moffatt R, Redl P, Young BA, Brink PL, Cherry M, Tomada A (2014) Nonlinear optimal filter technique for analyzing energy depositions in TES sensors driven into saturation. AIP Advances 4(11):117106, DOI 10.1063/1.4901291, 1406.7030
- Simionescu et al. (2019) Simionescu A, Ettori S, Werner N, Nagai D, Vazza F, Akamatsu H, Pinto C, de Plaa J, Wijers N, Nelson D, Pointecouteau E, Pratt GW, Spiga D, Lau E, Rossetti M, Gastaldello F, Biffi V, Bulbul E, den Herder JW, Eckert D, Fraternali F, Mingo B, Pareschi G, Pezzulli G, Reiprich TH, Schaye J, Walker SA, Werk J (2019) Voyage through the Hidden Physics of the Cosmic Web. arXiv e-prints arXiv:1908.01778, 1908.01778
- Smith et al. (2013) Smith S, Adams J, Bailey C, Bandler S, Chervenak J, Eckart M, Finkbeiner F, Kelley R, Kilbourne C, Porter F, Sadleir J (2013) J Appl Phys 114:074513
- Smith et al. (2004) Smith SJ, Whitford C, Fraser GW, Holland AD, Goldie D, R Ashton TJ, Limpenny RJ, Stevenson T (2004) First results from a 1-d imaging spectrometer using ir tess. Nuclear Instruments and Methods in Physics Research Section A: Accelerators, Spectrometers, Detectors and Associated Equipment 520(1):449–451, DOI https://doi.org/10.1016/j.nima.2003.11.369, URL https://www.sciencedirect.com/science/article/pii/S0168900203032893, proceedings of the 10th International Workshop on Low Temperature Detectors
- Smith et al. (2006) Smith SJ, Whitford CH, Fraser GW (2006) Optimised filtering for improved energy and position resolution in position-sensitive TES based X-ray detectors. Nuclear Instruments and Methods in Physics Research A 556(1):237–245, DOI 10.1016/j.nima.2005.10.021
- Smith et al. (2008) Smith SJ, Bandler SR, Brekosky RP, Brown AD, Chervenak JA, Eckart ME, Figueroa-Feliciano E, Finkbeiner FM, Kelley RL, Kilbourne CA, Porter FS, Sadleir JE (2008) Development of arrays of position-sensitive microcalorimeters for Constellation-X. In: Turner MJL, Flanagan KA (eds) Space Telescopes and Instrumentation 2008: Ultraviolet to Gamma Ray, International Society for Optics and Photonics, SPIE, vol 7011, pp 645 – 652, DOI 10.1117/12.790100, URL https://doi.org/10.1117/12.790100
- Smith et al. (2009) Smith SJ, Bandler SR, Brekosky RP, Brown AD, Chervenak JA, Eckart ME, Figueroa-Feliciano E, Finkbeiner FM, Kelley RL, Kilbourne CA, Porter FS, Sadleir JE (2009) Development of position-sensitive transition-edge sensor x-ray detectors. IEEE Transactions on Applied Superconductivity 19(3):451–455, DOI 10.1109/TASC.2009.2019557
- Smith et al. (2012) Smith SJ, Adams JS, Bailey CN, Bandler SR, Chervenak JA, Eckart ME, Finkbeiner FM, Kelley RL, Kilbourne CA, Porter FS, Sadleir JE (2012) Small Pitch Transition-Edge Sensors with Broadband High Spectral Resolution for Solar Physics. Journal of Low Temperature Physics 167(3-4):168–175, DOI 10.1007/s10909-012-0574-y
- Smith et al. (2014) Smith SJ, Adams JS, Bandler SR, Busch SE, Chervenak JA, Eckart ME, Finkbeiner FM, Kelley RL, Kilbourne CA, Lee SJ, Porst JP, Porter FS, Sadleir JE (2014) Characterization of Mo/Au Transition-Edge Sensors with Different Geometric Configurations. Journal of Low Temperature Physics 176(3-4):356–362, DOI 10.1007/s10909-013-1031-2
- Smith et al. (2016) Smith SJ, Adams JS, Bandler SR, Betancourt-Martinez GL, Chervenak JA, Chiao MP, Eckart ME, Finkbeiner FM, Kelley RL, Kilbourne CA, Miniussi AR, Porter FS, Sadleir JE, Sakai K, Wakeham NA, Wassell EJ, Yoon W, Bennett DA, Doriese WB, Fowler JW, Hilton GC, Morgan KM, Pappas CG, Reintsema CN, Swetz DS, Ullom JN, Irwin KD, Akamatsu H, Gottardi L, den Hartog R, Jackson BD, van der Kuur J, Barret D, Peille P (2016) Transition-edge sensor pixel parameter design of the microcalorimeter array for the x-ray integral field unit on Athena. In: den Herder JWA, Takahashi T, Bautz M (eds) Space Telescopes and Instrumentation 2016: Ultraviolet to Gamma Ray, International Society for Optics and Photonics, SPIE, vol 9905, pp 772 – 790, DOI 10.1117/12.2231749, URL https://doi.org/10.1117/12.2231749
- Smith et al. (2019) Smith SJ, Adams JS, Bandler SR, Chervenak JA, Datesman AM, Eckart ME, Finkbeiner FM, Hummatov R, Kelley RL, Kilbourne CA, Miniussi AR, Porter FS, Sadleir JE, Sakai K, Wakeham NA, Wassell EJ (2019) Multiabsorber transition-edge sensors for x-ray astronomy. Journal of Astronomical Telescopes, Instruments, and Systems 5(2):1 – 11, DOI 10.1117/1.JATIS.5.2.021008, URL https://doi.org/10.1117/1.JATIS.5.2.021008
- Smith et al. (2020) Smith SJ, Adams JS, Bandler SR, Beaumont S, Chervenak JA, Datesman AM, Finkbeiner FM, Hummatov R, Kelly RL, Kilbourne CA, Miniussi AR, Porter FS, Sadleir JE, Sakai K, Wakeham NA, Wassell EJ, Witthoeft MC, Ryu K (2020) Toward 100,000-pixel microcalorimeter arrays using multi-absorber transition-edge sensors. J Low Temp Phys 199:330–338
- Smith et al. (2021) Smith SJ, Adams JS, Bandler SR, Beaumont S, Chervenak JA, Denison EV, Doriese WB, Durkin M, Finkbeiner FM, Fowler JW, Hilton GC, Hummatov R, Irwin KD, Kelley RL, Kilbourne CA, Leutenegger MA, Miniussi AR, Porter FS, Reintsema CD, Sadleir JE, Sakai K, Swetz DS, Ullom JN, Vale LR, Wakeham NA, Wassell EJ, Witthoeft MC (2021) Performance of a Broad-Band, High-Resolution, Transition-Edge Sensor Spectrometer for X-ray Astrophysics. IEEE Transactions on Applied Superconductivity 31(5):3061918, DOI 10.1109/TASC.2021.3061918
- Stahle et al. (2002) Stahle CK, Lindeman MA, Figueroa-Feliciano E, Li MJ, Tralshawala N, Finkbeiner FM, Brekosky RP, Chervenak JA (2002) Arraying compact pixels of transition-edge microcalorimeters for imaging x-ray spectroscopy. In: Porter FS, McCammon D, Galeazzi M, Stahle CK (eds) Low Temperature Detectors, American Institute of Physics Conference Series, vol 605, pp 223–226, DOI 10.1063/1.1457633
- Stern et al. (2008) Stern RA, Rausch A, Deiker S, Martínez-Galarce D, Shing L, Irwin KD, Ullom JN, O’Neil G, Hilton G, Vale L (2008) X-ray Microcalorimeter Research for Solar Physics at LMSAL and NIST: An Update. Journal of Low Temperature Physics 151(3-4):721–726, DOI 10.1007/s10909-008-9735-4
- Szymkowiak et al. (1993) Szymkowiak AE, Kelley RL, Moseley SH, Stahle CK (1993) Signal processing for microcalorimeters. Journal of Low Temperature Physics 93(3-4):281–285, DOI 10.1007/BF00693433
- Szypryt et al. (2019) Szypryt P, O’Neil GC, Takacs E, Tan JN, Buechele SW, Naing AS, Bennett DA, Doriese WB, Durkin M, Fowler JW, Gard JD, Hilton GC, Morgan KM, Reintsema CD, Schmidt DR, Swetz DS, Ullom JN, Ralchenko Y (2019) A transition-edge sensor-based x-ray spectrometer for the study of highly charged ions at the national institute of standards and technology electron beam ion trap. Review of Scientific Instruments 90(12):123107, DOI 10.1063/1.5116717, URL https://doi.org/10.1063/1.5116717, https://doi.org/10.1063/1.5116717
- Takahashi et al. (2018) Takahashi T, Kokubun M, Mitsuda K, Kelley RL, Ohashi T, Aharonian F, Akamatsu H, Akimoto F, Allen SW, Anabuki N, Angelini L, Arnaud K, Asai M, Audard M, Awaki H, Axelsson M, Azzarello P, Baluta C, Bamba A, Bando N, Bautz MW, Bialas T, Blandford R, Boyce K, Brenneman LW, Brown GV, Bulbul E, Cackett EM, Canavan E, Chernyakova M, Chiao MP, Coppi PS, Costantini E, O’Dell S, DiPirro M, Done C, Dotani T, Doty J, Ebisawa K, Eckart ME, Enoto T, Ezoe Y, Fabian AC, Ferrigno C, Foster AR, Fujimoto R, Fukazawa Y, Funk S, Furuzawa A, Galeazzi M, Gallo LC, Gandhi P, Gilmore K, Giustini M, Goldwurm A, Gu L, Guainazzi M, Haas D, Haba Y, Hagino K, Hamaguchi K, Harrus IM, Hatsukade I, Hayashi T, Hayashi K, Hayashida K, den Herder JW, Hiraga JS, Hirose K, Hornschemeier A, Hoshino A, Hughes JP, Ichinohe Y, Iizuka R, Inoue H, Inoue Y, Ishibashi K, Ishida M, Ishikawa K, Ishimura K, Ishisaki Y, Itoh M, Iwai M, Iwata N, Iyomoto N, Jewell C, Kaastra J, Kallman T, Kamae T, Kara E, Kataoka J, Katsuda S, Katsuta J, Kawaharada M, Kawai N, Kawano T, Kawasaki S, Khangulyan D, Kilbourne CA, Kimball M, King A, Kitaguchi T, Kitamoto S, Kitayama T, Kohmura T, Konami S, Kosaka T, Koujelev A, Koyama K, Koyama S, Kretschmar P, Krimm HA, Kubota A, Kunieda H, Laurent P, Lee SH, Leutenegger MA, Limousin O, Loewenstein M, Long KS, Lumb D, Madejski G, Maeda Y, Maier D, Makishima K, Markevitch M, Masters C, Matsumoto H, Matsushita K, McCammon D, Mcguinness D, McNamara BR, Mehdipour M, Miko J, Miller ED, Miller JM, Mineshige S, Minesugi K, Mitsuishi I, Miyazawa T, Mizuno T, Mori H, Mori K, Moroso F, Moseley H, Muench T, Mukai K, Murakami H, Murakami T, Mushotzky RF, Nagano H, Nagino R, Nakagawa T, Nakajima H, Nakamori T, Nakano T, Nakashima S, Nakazawa K, Namba Y, Natsukari C, Nishioka Y, Nobukawa KK, Nobukawa M, Noda H, Nomachi M, Odaka H, Ogawa H, Ogawa M, Ogi K, Ohno M, Ohta M, Okajima T, Okamoto A, Okazaki T, Ota N, Ozaki M, Paerels F, Paltani S, Parmar A, Petre R, Pinto C, de Plaa J, Pohl M, Pontius J, Porter FS, Pottschmidt K, Ramsey B, Reynolds C, Russell H, Safi-Harb S, Saito S, Sakai K, Sakai Si, Sameshima H, Sasaki T, Sato G, Sato K, Sato R, Sato Y, Sawada M, Schartel N, Serlemitsos PJ, Seta H, Shibano Y, Shida M, Shidatsu M, Shimada T, Shinozaki K, Shirron P, Simionescu A, Simmons C, Smith RK, Sneiderman G, Soong Y, Stawarz Ł, Sugawara Y, Sugita S, Sugita H, Szymkowiak A, Tajima H, Takahashi H, Takeda S, Takei Y, Tamagawa T, Tamura T, Tamura K, Tanaka T, Tanaka Y, Tanaka YT, Tashiro MS, Tawara Y, Terada Y, Terashima Y, Tombesi F, Tomida H, Tsuboi Y, Tsujimoto M, Tsunemi H, Tsuru TG, Uchida H, Uchiyama H, Uchiyama Y, Ueda S, Ueda Y, Ueno S, Uno S, Urry CM, Ursino E, de Vries CP, Wada A, Watanabe S, Watanabe T, Werner N, Wik DR, Wilkins DR, Williams BJ, Yamada S, Yamada T, Yamaguchi H, Yamaoka K, Yamasaki NY, Yamauchi M, Yamauchi S, Yaqoob T, Yatsu Y, Yonetoku D, Yoshida A, Yuasa T, Zhuravleva I, Zoghbi A (2018) Hitomi (ASTRO-H) X-ray Astronomy Satellite. Journal of Astronomical Telescopes, Instruments, and Systems 4:021402, DOI 10.1117/1.JATIS.4.2.021402
- Takeda et al. (2014) Takeda S, Tashiro MS, Ishisaki Y, Tsujimoto M, Seta H, Shimoda Y, Yamaguchi S, Uehara S, Terada Y, Fujimoto R, Mitsuda K (2014) Performance verification and system integration tests of the pulse shape processor for the soft x-ray spectrometer onboard ASTRO-H. In: Takahashi T, den Herder JWA, Bautz M (eds) Space Telescopes and Instrumentation 2014: Ultraviolet to Gamma Ray, Society of Photo-Optical Instrumentation Engineers (SPIE) Conference Series, vol 9144, p 91445B, DOI 10.1117/12.2055899
- Takei et al. (2008) Takei Y, Gottardi L, Hoevers H, de Korte AJ, van der Kuur J, Ridder ML, Bruijn MP (2008) Characterization of a high-performance ti/au tes microcalorimeter with a central cu absorber. J Low Temp Phys 151:161–166
- Taralli et al. (2019) Taralli E, Khosropanah P, Gottardi L, Nagayoshi K, Ridder ML, Bruijn MP, Gao JR (2019) Complex impedance of tess under ac bias using fdm readout system. AIP Advances 9(4):045324
- Tolpygo et al. (2015) Tolpygo SK, Bolkhovsky V, Weir TJ, Johnson LM, Gouker MA, Oliver WD (2015) Fabrication Process and Properties of Fully-Planarized Deep-Submicron Nb/Al- {AlO}_x{/Nb} Josephson Junctions for VLSI Circuits. IEEE Transactions on Applied Superconductivity 25(3):2374836, DOI 10.1109/TASC.2014.2374836, 1408.5829
- Tsujimoto et al. (2018) Tsujimoto M, Tashiro MS, Ishisaki Y, Yamada S, Seta H, Mitsuda K, Boyce KR, Eckart ME, Kilbourne CA, Leutenegger MA, Porter FS, Kelley RL (2018) In-Orbit Performance of the Digital Electronics for the X-Ray Microcalorimeter Onboard the Hitomi Satellite. Journal of Low Temperature Physics 193(3-4):505–511, DOI 10.1007/s10909-018-1861-z
- Ullom et al. (2004) Ullom J, Doriese W, Hilton G, Beall J, Deiker S, Irwin K, Reintsema C, Vale L, Xu Y (2004) Suppression of excess noise in transition-edge sensors using magnetic field and geometry. Nucl Instrum Methods A 520(1):333 – 335
- Ullom and Bennett (2015) Ullom JN, Bennett DA (2015) Review of superconducting transition-edge sensors for x-ray and gamma-ray spectroscopy. Superconductor Science and Technology 28(8):084003, DOI 10.1088/0953-2048/28/8/084003
- Vaccaro et al. (2022) Vaccaro D, Akamatsu H, Gottardi L, van der Kuur J, Taralli E, de Wit M, Bruijn MP, den Hartog R, Kiviranta M, van der Linden AJ, Nagayoshi K, Ravensberg K, Ridder ML, Visser S, Jackson BD, Gao JR, Hoogeveen RWM, den Herder JWA (2022) Susceptibility study of TES micro-calorimeters for X-ray spectroscopy under FDM readout. arXiv e-prints arXiv:2208.10875, 2208.10875
- de Vries et al. (2017) de Vries CP, Haas D, Yamasaki NY, den Herder JW, Paltani S, Kilbourne C, Tsujimoto M, Eckart ME, Leutenegger MA, Costantini E, Dercksen JPC, Dubbeldam L, Frericks M, Laubert PP, van Loon S, Lowes P, McCalden AJ, Porter FS, Ruijter J, Wolfs R (2017) Calibration sources and filters of the soft x-ray spectrometer instrument on the Hitomi spacecraft. Journal of Astronomical Telescopes, Instruments, and Systems 4(1):1 – 9, DOI 10.1117/1.JATIS.4.1.011204, URL https://doi.org/10.1117/1.JATIS.4.1.011204
- Vystavkin et al. (1974) Vystavkin A, Gubankov V, Kuzmin L, Likharev K, Migulin V, Semenov V (1974) S-c-s junctions as nonlinear elements of microwave receiving devices. Rev Phys Appl 9(1):79–109
- Wakeham et al. (2018) Wakeham NA, Adams JS, Bandler SR, Chervenak JA, Datesman AM, Eckart ME, Finkbeiner FM, Kelley RL, Kilbourne CA, Miniussi AR, Porter FS, Sadleir JE, Sakai K, Smith SJ, Wassell EJ, Yoon W (2018) Effects of normal metal features on superconducting transition-edge sensors. J Low Temp Phys 193:231–240
- Wakeham et al. (2019) Wakeham NA, Adams JS, Bandler SR, Beaumont S, Chervenak JA, Datesman AM, Eckart ME, Finkbeiner FM, Hummatov R, Kelley RL, Kilbourne CA, Miniussi AR, Porter FS, Sadleir JE, Sakai K, Smith SJ, Wassell EJ (2019) Thermal fluctuation noise in mo/au superconducting transition-edge sensor microcalorimeters. J Appl Phys 125(16):164503
- Wakeham et al. (2020) Wakeham NA, Adams JS, Bandler SR, Beaumont S, Chervenak JA, Datesman AM, Eckart ME, Finkbeiner FM, Hummatov R, Kelley RL, Kilbourne CA, Miniussi AR, Porter FS, Sadleir JE, Sakai K, Smith SJ, Wassell EJ (2020) High-frequency noise peaks in moau superconducting tes microcalorimeters. J Low Temp Phys 200:192–196
- Wassell et al. (2017) Wassell EJ, Adams JS, Bandler SR, Betancourt-Martinez GL, Chiao MP, Chang MP, Chervenak JA, Datesman AM, Eckart ME, Ewin AJ, Finkbeiner FM, Ha JY, Kelley R, Kilbourne CA, Miniussi AR, Sakai K, Porter FS, Sadleir JE, Smith SJ, Wakeham NA, Yoon W (2017) Fabrication of X-Ray Microcalorimeter Focal Planes Composed of Two Distinct Pixel Types. IEEE Transactions on Applied Superconductivity 27(4):2633783, DOI 10.1109/TASC.2016.2633783
- van Weers et al. (2020) van Weers H, et al. (2020) The X-IFU focal plane assembly development model integration and first test results. In: den Herder JWA, Nikzad S, Nakazawa K (eds) Space Telescopes and Instrumentation 2020: Ultraviolet to Gamma Ray, International Society for Optics and Photonics, SPIE, vol 11444, DOI 10.1117/12.2563464, URL https://doi.org/10.1117/12.2563464
- Wellstood et al. (1994) Wellstood FC, Urbina C, Clarke J (1994) Hot-electron effects in metals. Phys Rev B 49(9):5942–5955, DOI 10.1103/PhysRevB.49.5942
- Wessel et al. (????) Wessel A, Morgan K, Becker D, Gard J, Hilton G, Mates J, Reintsema C, Schmidt D DR Swetz, Ullom J, et al. (????) arXiv:190711343
- Wessels et al. (2021) Wessels A, Morgan K, Gard JD, Hilton GC, Mates JAB, Reintsema CD, Schmidt DR, Swetz DS, Ullom JN, Vale LR, Bennett DA (2021) A model for excess Johnson noise in superconducting transition-edge sensors. Applied Physics Letters 118(20):202601, DOI 10.1063/5.0043369
- Whitford (2005) Whitford CH (2005) Implementation of optimal filters for pulse height measurement from non-linear detectors with non-stationary noise. Nuclear Instruments and Methods in Physics Research Section A: Accelerators, Spectrometers, Detectors and Associated Equipment 555(1):255–259, DOI https://doi.org/10.1016/j.nima.2005.09.001, URL https://www.sciencedirect.com/science/article/pii/S0168900205018048
- Wilms et al. (2016) Wilms J, Smith SJ, Peille P, Ceballos MT, Cobo B, Dauser T, Brand T, den Hartog RH, Bandler SR, de Plaa J, den Herder JWA (2016) TESSIM: a simulator for the Athena-X-IFU. In: den Herder JWA, Takahashi T, Bautz M (eds) Space Telescopes and Instrumentation 2016: Ultraviolet to Gamma Ray, International Society for Optics and Photonics, SPIE, vol 9905, pp 1795 – 1801, DOI 10.1117/12.2234435, URL https://doi.org/10.1117/12.2234435
- de Wit et al. (2020) de Wit M, Gottardi L, Taralli E, Nagayoshi K, Ridder ML, Akamatsu H, Bruijn MP, D’Andrea M, van der Kuur J, Ravensberg K, Vaccaro D, Visser S, Gao JR, den Herder JWA (2020) High aspect ratio transition edge sensors for x-ray spectrometry. J Appl Phys 128(22):224501
- Yan et al. (2017) Yan D, Divan R, Gades LM, Kenesei P, Madden TJ, Miceli A, Park JS, Patel UM, Quaranta O, Sharma H, Bennett DA, Doriese WB, Fowler JW, Gard JD, Hays-Wehle JP, Morgan KM, Schmidt DR, Swetz DS, Ullom JN (2017) Eliminating the non-Gaussian spectral response of X-ray absorbers for transition-edge sensors. Applied Physics Letters 111(1):192602, DOI 10.1063/1.5001198
- Yohannes et al. (2015) Yohannes DT, Hunt RT, Vivalda JA, Amparo D, Cohen A, Vernik IV, Kirichenko AF (2015) Planarized, Extendible, Multilayer Fabrication Process for Superconducting Electronics. IEEE Transactions on Applied Superconductivity 25(3):2365562, DOI 10.1109/TASC.2014.2365562
- Yoon et al. (2017) Yoon W, Adams JS, Bandler SR, Betancourt-Martinez GL, Chiao MP, Chang MP, Chervenak JA, Datesman A, Eckart ME, Ewin AJ, Finkbeiner FM, Ha JY, Kelley R, Kilbourne CA, Miniussi AR, Porter FS, Sadleir JE, Sakai K, Smith SJ, Wakeham NA, Wassell E (2017) Design and Performance of Hybrid Arrays of Mo/Au Bilayer Transition-Edge Sensors. IEEE Transactions on Applied Superconductivity 27(4):2655718, DOI 10.1109/TASC.2017.2655718
- Zhang et al. (2017) Zhang S, Eckart ME, Jaeckel FT, Kripps KL, McCammon D, Morgan KM, Zhou Y (2017) Mapping of the resistance of a superconducting transition edge sensor as a function of temperature, current, and applied magnetic field. Journal of Applied Physics 121(7):074503, DOI 10.1063/1.4976562
- Zhang et al. (2019) Zhang X, Duff SM, Hilton GC, Lowell PJ, Morgan KM, Schmidt DR, Ullom JN (2019) Controlling the thermal conductance of silicon nitride membranes at 100 mK temperatures with patterned metal features. Applied Physics Letters 115(5):052601, DOI 10.1063/1.5097173