New Gd-based magnetic compound GdPt2B with a chiral crystal structure
Abstract
Herein, we report the discovery of a novel Gd-based magnetic compound GdPt2B with a chiral crystal structure. X-ray diffraction and chemical composition analyses reveal a CePt2B-type crystal structure (space group: 6422) for GdPt2B. Moreover, we successfully grew single crystals of GdPt2B using the Czochralski method. Magnetization measurements and the Curie–Weiss analysis demonstrate that the ferromagnetic interaction is dominant in GdPt2B. A clear transition is observed in the temperature dependence of electrical resistivity, magnetic susceptibility, and specific heat at = 87 K. The magnetic phase diagram of GdPt2B, which consists of a field-polarized ferromagnetic region and a magnetically ordered region, resembles those of known chiral helimagnets. Furthermore, magnetic susceptibility measurements reveal a possible spin reorientation within the magnetically ordered phase in magnetic fields perpendicular to the screw axis. The results demonstrate that GdPt2B is a suitable platform for investigating the competing effects of ferromagnetic and antisymmetric exchange interactions in rare-earth-based chiral compounds.
I INTRODUCTION
Novel spin textures in inorganic chiral materials, such as magnetic skyrmion Mühlbauer et al. (2009); Yu et al. (2010) and chiral soliton lattice Togawa et al. (2012); Ohara et al. (2014); Matsumura et al. (2017), have received considerable attention because of their applicability to novel electronic devices. Generally, these characteristic spin textures are closely related to the symmetry of the crystal structure. In noncentrosymmetric crystal structures, an antisymmetric exchange interaction–the Dzyaloshinskii–Moriya (DM) interaction Dzyaloshinsky (1958); Moriya (1960)–affects the magnetic ground state. Moreover, competition between the exchange and DM interactions occasionally induces characteristic spin textures in chiral crystals.
In this paper, we report the discovery of a novel Gd-based compound GdPt2B with a chiral crystal structure. For the 4 configuration of trivalent Gd ion with a half-filled 4 shell, Hund’s rule yields = 7/2 and = 0. The quenched orbital momentum results in relatively weak spin-orbit coupling in trivalent Gd (and divalent Eu) compounds and may lead to interesting spin textures, as observed in 3 magnets. For instance, the anomalous Hall effect induced by topological spin textures has been reported in Gd/Eu-based frustrated magnets Kurumaji et al. (2019); Hirschberger et al. (2019); Shang et al. (2021) and Eu-based chiral helimagnets Kakihana et al. (2018); Ōnuki et al. (2020). However, Gd-based intermetallic compounds with chiral crystal structures are rarely reported. Therefore, GdPt2B can provide a useful platform for exploring interesting spin textures induced by the antisymmetric exchange interaction.
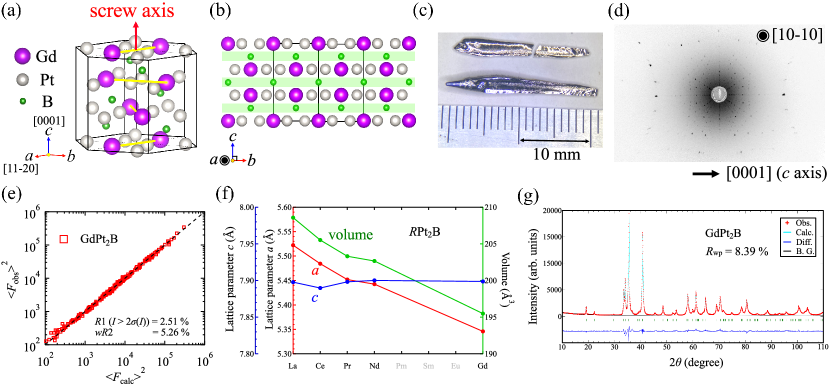
As discussed in Section III, X-ray diffraction revealed that GdPt2B crystallizes in a CePt2B-type hexagonal structure [space group: 6222 or 6422, see Figs. 1(a) and 1(b)]. To date, a series of Pt2B compounds with the CePt2B-type structure has been reported for Y Dias et al. (2007), La Sologub et al. (2003a), Ce Sologub et al. (2000), Pr Sologub et al. (2003a), Nd Sologub et al. (2003a); Sato et al. (2021), Tm Khan et al. (2010), Yb Khan et al. (2015), and Lu Khan et al. (2015). The Pt2B compounds have the same point group as the typical monoaxial chiral helimagnets CsCuCl3 Wells (1947); Adachi et al. (1980) and Cr1/3NbS2 Moriya and Miyadai (1982); Miyadai et al. (1983). As shown in Fig. 1(a), Gd ions form a helical arrangement along the axis, which can be regarded as a screw axis. The Gd–Pt and boron layers are stacked alternately along the axis, as shown in Fig. 1(b). Previously, we succeeded in growing single crystals of NdPt2B using the Czochralski method Sato et al. (2021). Therefore, in addition to the synthesis of the polycrystal, we grew single crystals of GdPt2B using the Czochralski method.
Additionally, this study investigates the electrical transport, magnetic, and thermodynamic properties of GdPt2B single crystals. GdPt2B exhibits a phase transition at = 87 K. The temperature dependence of magnetization indicates that the magnetic transition is neither a simple ferromagnetic nor an antiferromagnetic transition, whereas the Curie–Weiss analysis suggests that the ferromagnetic interaction is dominant in GdPt2B. A magnetic phase diagram is constructed from magnetic and thermodynamic measurements, and the magnetic ordering state of GdPt2B is examined.
II EXPERIMENTAL DETAILS
GdPt2B polycrystals were synthesized via arc-melting using a tetra arc furnace under an argon atmosphere (99.9999 % purity). The starting materials include stoichiometric amounts of Gd (99.9 % purity), Pt (99.95 % purity), and B (99.9 % purity). The ingot was flipped and remelted five times to ensure homogeneity. A part of the synthesized polycrystals was used in single crystal growth. Single crystals of GdPt2B were grown using the Czochralski method. The single crystal was pulled from the melting ingot using a tungsten seed at a speed of 12 mm h-1. The Czochralski process was performed in a tetra arc furnace under an argon atmosphere (99.9999 % purity). The obtained single crystals are shown in Fig. 1(c). Single crystals of GdPt2B are stable in air. The single crystals were oriented using a Laue camera (Photonic Science Laue X-ray CCD camera) and cut using a spark cutter for subsequent measurements. The Laue photograph of the GdPt2B single crystal is shown in Fig. 1(d).
The crystal structure of GdPt2B was determined using a single-crystal X-ray diffractometer (Rigaku XtaLAB mini II) with Mo radiation ( = 0.71073 ). The measured GdPt2B single crystals were mounted on a plastic fiber. The data were collected at 296 K using a scan. After the single-crystal x-ray diffraction (XRD), the homogeneity and single-phase nature of the grown single crystal were confirmed via powder XRD (Rigaku RINT2500V) with Cu radiation ( = 1.5418 ). The chemical composition and homogeneity of the obtained single crystals were investigated through the inductively coupled plasma atomic emission spectroscopy (ICP-AES). Two samples (labeled as sample 1 and sample 2) were obtained from different parts of the grown single crystal and analyzed.
The electrical resistivity was measured using a four-probe DC method in a Gifford–McMahon refrigerator. Magnetization measurements were performed using a commercial SQUID magnetometer (QD MPMS) at temperatures down to 2 K and in magnetic fields up to 2 T. The specific heat was measured using a relaxation method in magnetic fields using a quantum design DynaCool physical properties measurement system (QD PPMS).
III RESULTS and DISCUSSION
First, we discuss the crystal structure analysis of GdPt2B using powder and single-crystal XRD. The crystal structure of GdPt2B was determined through single-crystal XRD. The crystal structure was solved using SHELXTSheldrick (2015a) and refined using SHELXL software Sheldrick (2015b). The crystal data, structural refinement, and atomic parameters of the GdPt2B single crystals are summarized in Tables 1 and 2.
| Empirical formula | \ceGdPt2B |
|---|---|
| Formula weight | 558.24 |
| Crystal system | hexagonal |
| Space group | (#181) |
| () | 5.3459(3) |
| () | 7.8987(6) |
| Volume () | 195.49(2) |
| Formula units per cell (Z) | 3 |
| Number of measured reflections (total) | 1766 |
| Number of measured reflections (unique) | 257 |
| Cut off angle (2) | 66.1∘ |
| ( 2.00()) | 0.0240 |
| (All reflections) | 0.0251 |
| (All reflections) | 0.0526 |
| Goodness of fit | 1.096 |
| Flack parameter | -0.038(18) |
| Max Shift/Error in Final Cycle | 0.000 |
| GdPt2B | |||||
|---|---|---|---|---|---|
| Atom | Site | x | y | z | |
| Gd | 3 | 1/2 | 0 | 0 | 0.268(19) |
| Pt | 6 | 0.15166(9) | 0.30332(9) | 0 | 0.356(17) |
| B | 3 | 1/2 | 0 | 1/2 | 0.7(4) |
GdPt2B crystallizes in the CePt2B-type crystal structure (hexagonal 6422 space group), which was determined using a direct method. To determine the unit cell, 831 reflections were acquired. The 2 range for determining the unit cell ranged from 8.7∘ to 66.3∘. An empirical absorption correction and correction for secondary extinction were applied. The data were corrected for the Lorentz and polarization effects. The crystal structure was successfully refined using anisotropic displacement parameters, and the -factors were sufficiently small: = 2.4% for 2.00 and = 5.26%. The equivalent isotropic atomic displacement parameter is defined as = , where is summarized in Table 3.
| GdPt2B | ||||||
|---|---|---|---|---|---|---|
| Atom | ||||||
| Gd | 0.0020(4) | 0.0021(3) | 0.0060(4) | 0.0010(2) | 0 | 0 |
| Pt | 0.0029(3) | 0.0029(3) | 0.0076(3) | 0.0013(2) | -0.00103(15) | -0.00103(15) |
| B | 0.013(9) | 0.004(10) | 0.007(10) | 0.002(5) | 0 | 0 |
, , and are the real-space cell lengths. , , and denote the reciprocal-space cell lengths. The Flack parameter is used to determine the absolute structure of the noncentrosymmetric crystal structure. The obtained Flack parameter was nearly zero, indicating that the present absolute structure (6422) is correct. Figure 1(e) shows the observed squared structure factors as a function of calculated structure factors using space group 6422.
Figure 1(f) shows a comparison of the lattice parameters ( and ) and volume of the Pt2B ( = La, Ce, Pr, Nd, and Gd) compounds. The lattice parameters of LaPt2B have been reported in Ref. Sologub et al. (2003a), and other data were obtained through single-crystal XRD. The lattice parameter () and the volume () monotonically decrease. Comparing GdPt2B with LaPt2B, and decreased by 3.2% and 6%, respectively. The decrease in the unit cell volume is known as lanthanoid contraction. In contrast to the cases of and , the lattice parameter did not change significantly, and the degree of the change was less than 0.1%. Anisotropic changes in the lattice parameters of Pt2B were unusual. The anisotropic change in the lattice parameters of Pt2B has also been reported by powder XRD measurements of polycrystalline samples Khan et al. (2015). In another example of rare-earth platinum boride Pt3B, the changes in and were isotropic in the tetragonal structure Sologub et al. (2003b). The anisotropic change in the lattice parameters of Pt2B indicates a characteristic metallic bonding in this system.
The powder XRD patterns of crushed single crystals of GdPt2B are shown in Fig. 1(g). The observed peaks are well indexed to the CePt2B-type structure, which is consistent with the crystal structure determined through the single-crystal XRD. Rietveld analysis was performed using the RIETAN-FPIzumi and Momma (2007). The weighted profile and the unweighted profile -factors were obtained to be = 8.39% and = 6.21%, respectively. The lattice parameters obtained by the Rietveld analysis were consistent with those determined by the single-crystal XRD. Note that we also performed powder XRD measurements on the as-cast polycrystalline samples and obtained a single-phase XRD pattern. This indicates that GdPt2B is a congruently melting compound.
In addition to powder and single-crystal XRD, we examined the chemical composition of the obtained single crystal through ICP-AES. The chemical compositions of sample1 and sample 2 are listed in Table 4. The chemical composition ratio was approximately Gd:Pt:B = 1:2:1, and no sample dependence of the chemical composition was observed. The results of the chemical composition analysis demonstrated the stoichiometric composition and the uniformity of the composition of GdPt2B single crystals, even considering the errors associated with the spectroscopy and the preparation of sample solutions.
| GdPt2B single crystal | |||
|---|---|---|---|
| Sample No. (meas.) | Gd (at. %) | Pt (at. %) | B (at. %) |
| Sample1 (1st) | 25.4 | 49.4 | 25.2 |
| Sample1 (2nd) | 25.5 | 49.5 | 25.0 |
| Sample2 (1st) | 25.4 | 49.4 | 25.2 |
| Sample2 (2nd) | 25.5 | 49.4 | 25.1 |
As we have shown, we succeeded in obtaining single-crystalline samples of GdPt2B. Then, the basic physical properties of the GdPt2B single crystals are presented. Figure 2(a) shows the temperature dependence of the electrical resistivity of GdPt2B for (in-plane).
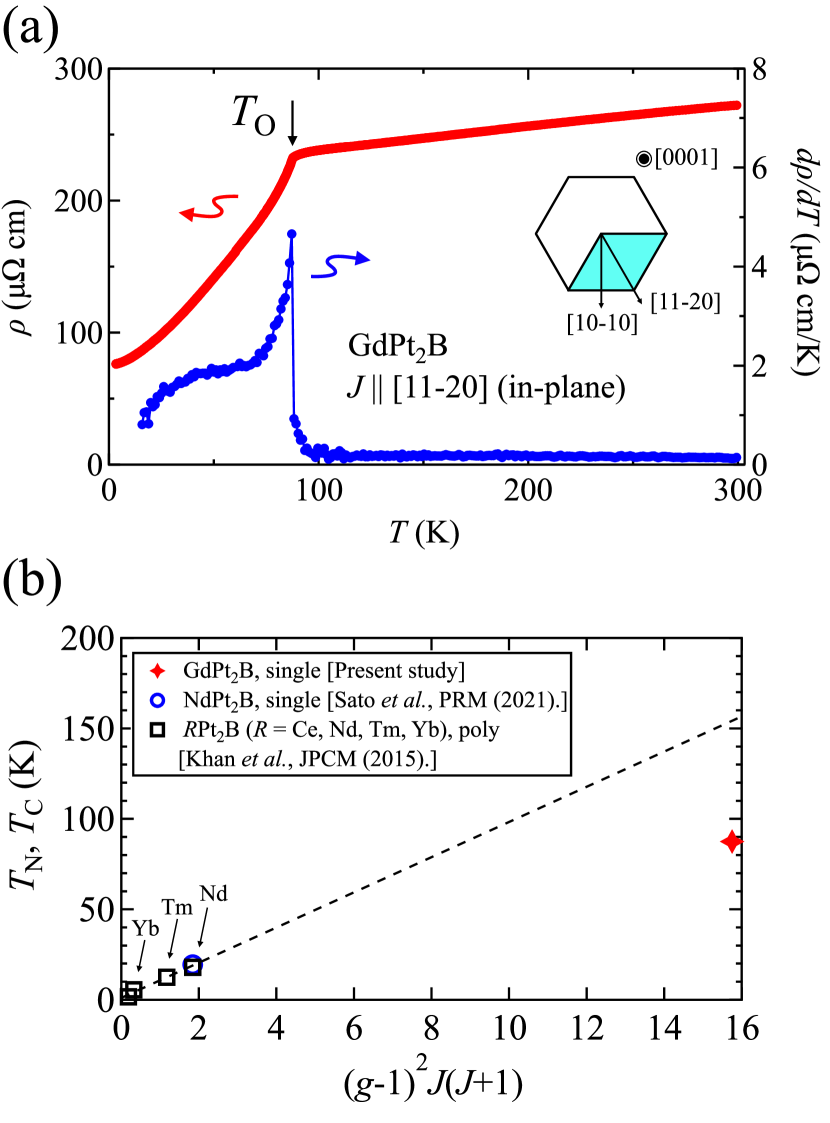
In this study, we selected four-axis notation to indicate the crystallographic axes, as shown in the inset of Fig. 2(a). GdPt2B exhibited metallic behavior similar to that of other Pt2B systems. The ratio of the electrical resistivity at 300 K to that at the lowest temperature, namely the residual resistivity ratio, is approximately 3.5. shows a clear anomaly at approximately = 87 K. / also shows a clear jump at .
The magnetism in metallic rare-earth compounds is expected to be based on the Ruderman–Kittel–Kasuya–Yosida (RKKY) interaction, and the ordering temperature could be proportional to the de Gennes factor , where is the Landé -factor. Khan et al. examined the relationship between the transition temperature of Pt2B (: Ce, Nd, Tm, Yb) and the de Gennes factor Khan et al. (2015). Here, we added the GdPt2B data to the plot of the ordering temperatures of Pt2B as a function of the de Gennes factor, as shown in Fig. 2(b). The transition temperature of GdPt2B deviates from the reported scaling behavior. A similar deviation from the de Gennes scaling has been reported for AuIn and NiAl compounds, and the effect of the -electrons of transition metal elements on the valence band spectra has also been reported in these systems Gondek et al. (2008). The energy band structure may affect the magnetism of the Pt2B series. Furthermore, the de Gennes scaling is often affected by the crystalline electric field (CEF). As observed in PtGe compounds Penc et al. (2000), the CEF effect may affect the transition temperatures of Pt2B compounds other than GdPt2B.
To investigate the magnetic properties and transition at of GdPt2B, we measured the temperature dependence of the magnetization for (in-plane) and (out-of-plane). Figure 3(a) shows the temperature dependence of magnetization for (in-plane).
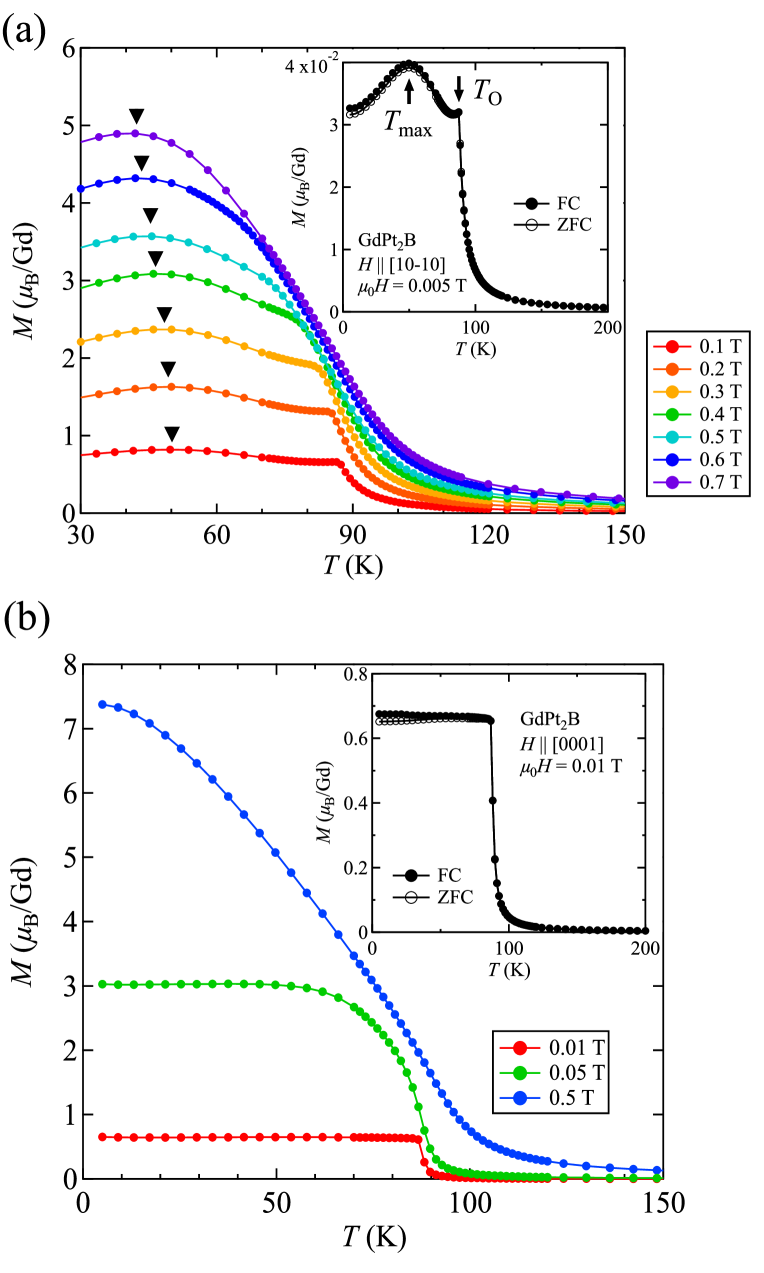
As shown in the inset of Fig. 3(a), exhibits a rapid increase below approximately 100 K, followed by a peak structure at in lower magnetic fields. This behavior indicates that the ground state of GdPt2B is close to a ferromagnetic state but not a simple ferromagnetic ground state. A small bifurcation was observed between the field-cooled (FC) and zero-field-cooled (ZFC) curves below . Furthermore, exhibits a broad maximum at 50 K in both the FC and ZFC curves. The peak at and the broad maximum at shift to lower temperatures with increasing field.
In contrast to the temperature dependence of magnetization for (in-plane), the out-of-plane exhibits the nearly ferromagnetic behavior. The peak structure was not observed in the magnetization of . As shown in the inset of Fig. 3(b), increases abruptly below . Broad maximum of magnetization was absent for in the ordered phase. The bifurcation between the FC and ZFC curves was also observed in out-of-plane below , although the difference was smaller compared to that of the Gd-based ferromagnetStein et al. (2017). The sharp increase in the magnetization at becomes broad in higher magnetic fields, similar to the case with ferromagnets, as shown in Fig. 3(b). The characteristic anisotropic behavior of indicates that the magnetic ground state of GdPt2B is neither simple ferromagnetic nor antiferromagnetic.
Figure 4 shows the temperature dependence of the inverse susceptibility 1/ for and .
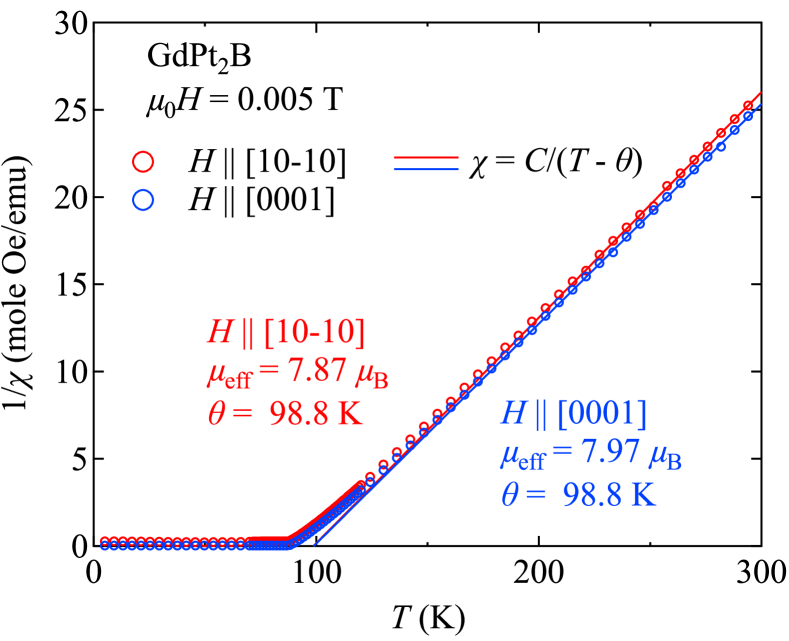
The anisotropy in the magnetic susceptibility is quite small in the paramagnetic region of GdPt2B because of the configuration of the Gd3+ ion ( = 7/2, = 0). The small magnetocrystalline anisotropy in the paramagnetic state has been reported for other = 7/2 systemsNakamura et al. (2018); Maurya et al. (2015). GdPt2B exhibits the Curie–Weiss behavior above 200 K. As shown in Fig. 4, the magnetic susceptibility data are fitted to the expression of , where and are the Curie constant and the Weiss temperature, respectively. We estimate the effective moment from the Curie–Weiss analysis as = 7.87 per Gd for and = 7.97 per Gd for . The obtained is in reasonable agreement with the theoretical value of 7.94 for free-ion Gd3+ Jensen and Mackintosh (1991). We obtained the Weiss temperature = 98.8 K for both principal axes, indicating that the interaction between the Gd-ions is ferromagnetic in GdPt2B.
As mentioned previously, and data demonstrate that the ferromagnetic interaction is dominant in GdPt2B. Therefore, we measured the isothermal () curves to investigate the hysteresis loop behavior, as shown in Figs. 5(a)–(c).
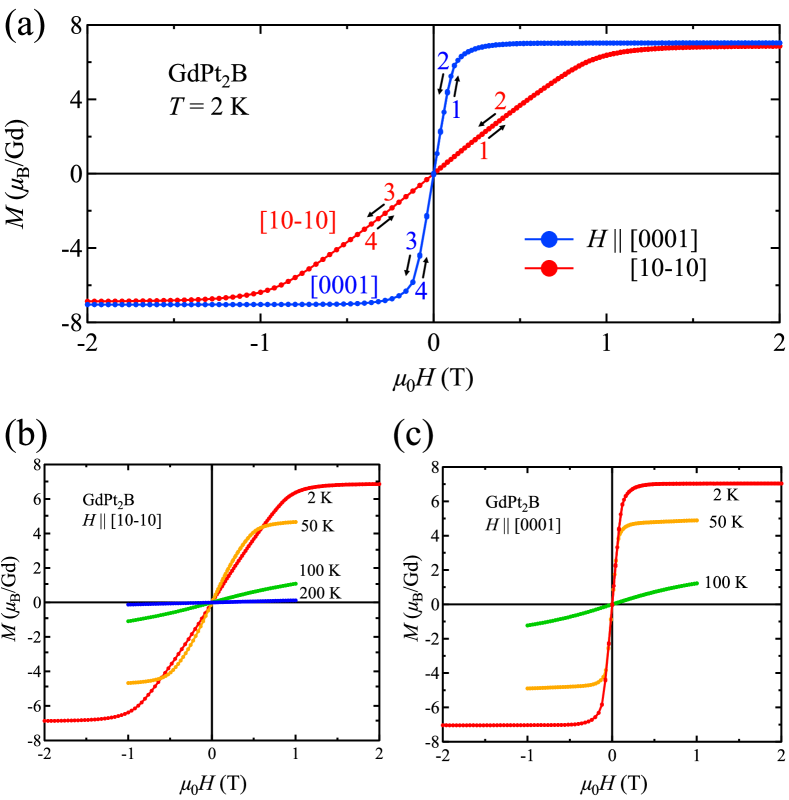
The measurement was performed by sweeping the magnetic field from T to 2 T after zero-field cooling of the sample. The arrows in Fig 5(a) indicate the measurement sequences. Despite the dominant ferromagnetic interaction, no signs of spontaneous magnetization were observed. The curves change linearly with the sweeping magnetic field in the lower field region, regardless of the field direction. In contrast to the small magnetic anisotropy in the paramagnetic state, significant magnetic anisotropy was observed at temperatures below . The saturated magnetic moment was approximately 7 /Gd for both and axes. The magnetization saturates at approximately 0.5 T for , whereas reaches 7 /Gd at 2 T for . As shown in Fig. 5 (b), the isothermal curve measured at 50 K exceeded the curve measured at the lowest temperature in the magnetic field range below 0.7 T for . This is consistent with the temperature-dependent measurements. Meanwhile, the isothermal magnetization curves measured at various constant temperatures exhibit a nearly ferromagnetic behavior for , as shown in Fig. 5 (c). Hysteresis loop behavior in was absent for both principal crystallographic axes over the entire temperature range below the ordering temperature.
To clearly detect the phase transitions, we investigated the thermodynamic properties. Figure 6(a) shows the temperature dependence of the specific heat of GdPt2B.
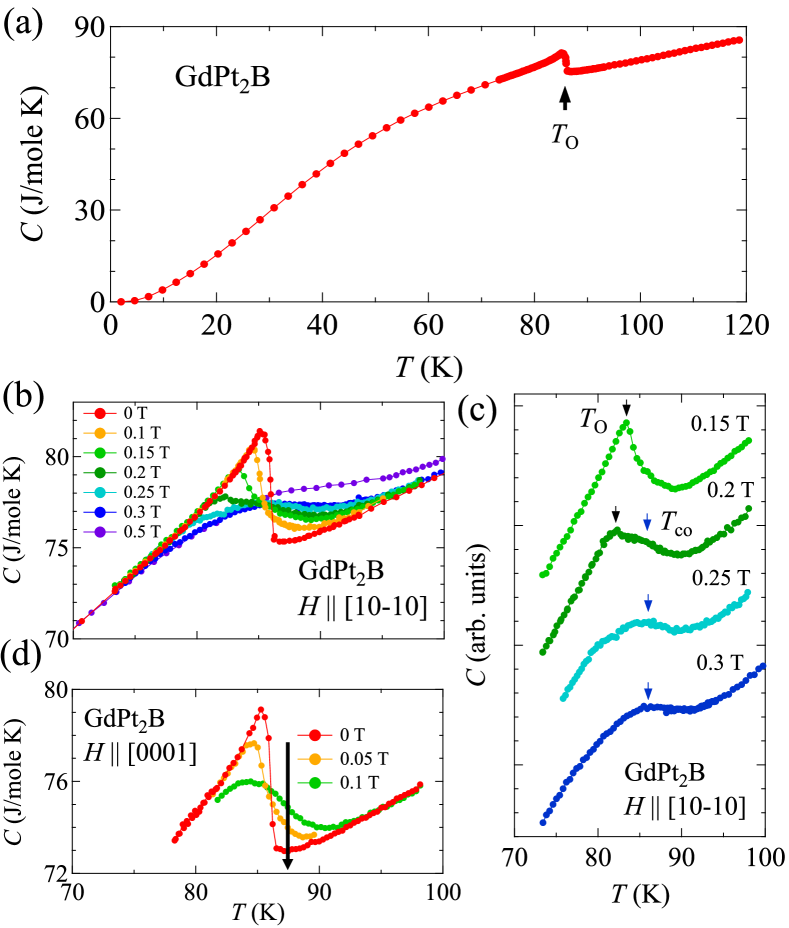
exhibits a clear jump at K. Applying the magnetic field along the axis, the anomaly shifts to lower temperatures in magnetic fields of up to 0.2 T, as shown in Figs. 6(b) and 6(c). The field dependence of the anomaly in at is consistent with that of the peak structure in . In higher magnetic fields above 0.25 T, a broad maximum corresponding to the crossover between the paramagnetic and field-polarized ferromagnetic states was observed at . Notably, the anomaly at coexists with the broad maximum at in a magnetic field of 0.2 T, as shown in Fig. 6(c). This behavior also indicates that the magnetically ordered phase is neither simple ferromagnetic nor antiferromagnetic phases.
shows no apparent anomaly at 50 K, where the magnetic susceptibility exhibits a broad maximum for . Note that the electrical resistivity also exhibited no clear anomalies at . The absence of an anomaly in the specific heat indicates that the broad maximum in the magnetic susceptibility at is not due to a phase transition. The broad maximum at suggests the occurrence of spin reorientation in the magnetically ordered phase. A similar anomaly in derived from spin reorientation has been reported in several systems, such as Tb5Si2Ge2 Araújo et al. (2005); Marcano et al. (2019) and YBaCo4O8 Bera et al. (2013); Dhanasekhar et al. (2019). Further studies using microscopic probes are required to confirm the origin of the broad anomaly in .
We constructed magnetic field–temperature (–) phase diagrams from the magnetization and thermodynamic measurements of and , as shown in Figs. 7(a) and (b).
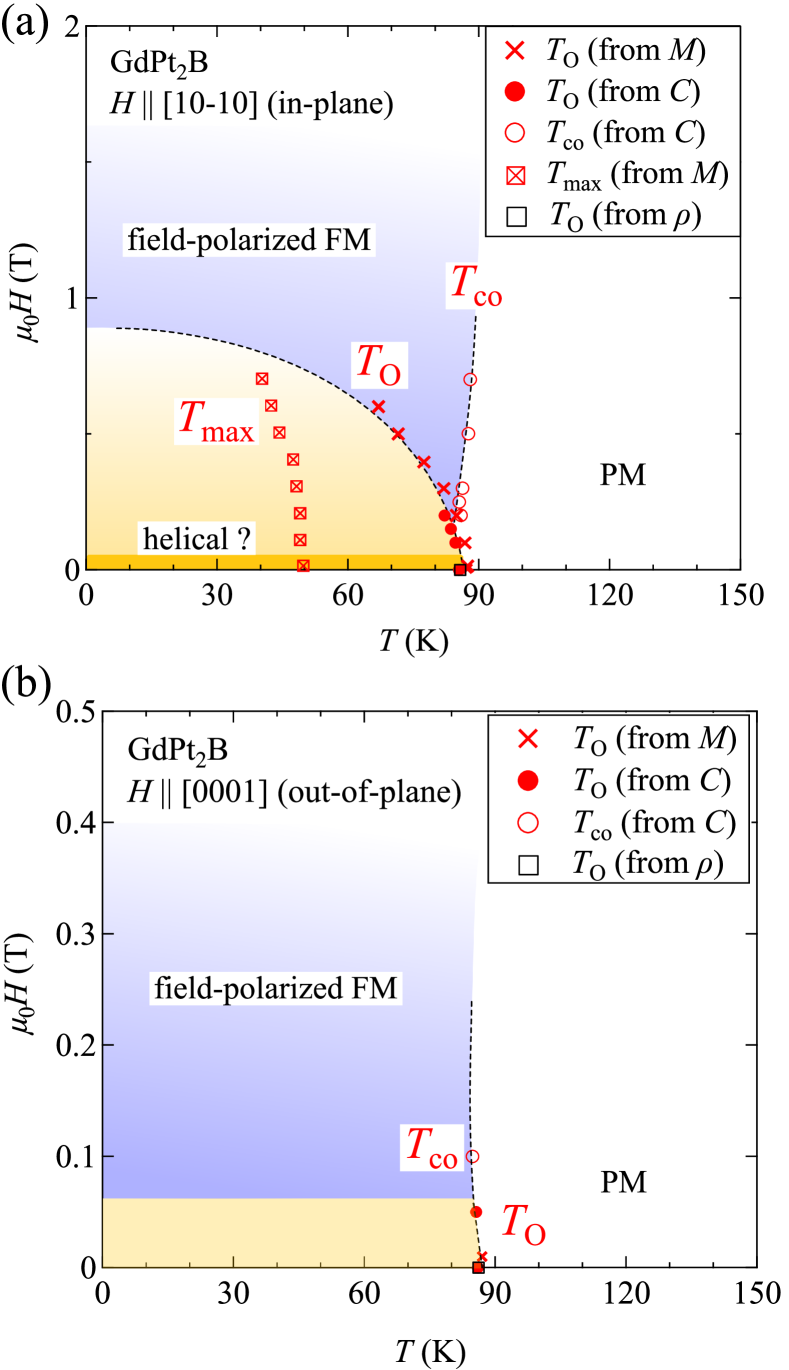
The – phase diagram comprises field-polarized ferromagnetic and magnetically ordered regions below under a magnetic field applied perpendicular to the screw axis (i.e., in-plane). The transition temperature determined by magnetization measurements and that determined by specific heat measurements were consistent with each other. shifts to lower temperatures under higher external magnetic fields. However, the crossover between the paramagnetic and field-polarized ferromagnetic states at moves to higher temperatures with increasing magnetic fields. The in-plane – phase diagram of GdPt2B is reminiscent of known chiral helimagnets such as Cr1/3NbS2 Ghimire et al. (2013); Mayoh et al. (2022), B20-type helimagnets Turgut et al. (2017), and rare-earth based chiral helimagnet YbNi3Al9 Miyazaki et al. (2012); Ninomiya et al. (2018).
In contrast to the case of ( screw axis), the – phase diagram for ( screw axis) is simple and resembles a ferromagnetic – phase diagram. Fig. 6(d) shows the temperature dependence of the specific heat of GdPt2B for . Similar to the behavior observed in the magnetization, the phase transition at becomes crossover at magnetic fields as small as 0.1 T. In our magnetization and specific heat measurements, it was difficult to define the magnetically ordered region for . Electrical transport measurements in magnetic fields may be suitable for detecting phase boundaries, as reported for the monoaxial chiral helimagnet Cr1/3NbS2 Togawa et al. (2013, 2015).
Herein, we discuss the magnetically ordered state of GdPt2B below . The temperature dependence of the magnetization exhibits a peak only for a magnetic field perpendicular to the screw axis. The peak structure in and its anisotropy of GdPt2B are similar to the magnetic behavior in the monoaxial chiral helimagnet Cr1/3NbS2 Moriya and Miyadai (1982); Miyadai et al. (1983) and molecule-based chiral magnet [Cr(CN)6][Mn()-pnH(H2O)](H2O)] Kishine et al. (2005). The formation of the peak structure in of the Dzyaloshinskii–Moriya helimagnets is attributed to the commensurate-incommensurate (C-IC) transition Zheludev et al. (1997, 1998). Kishine et al. provided a theoretical interpretation of the peak formation in by averaging the projection of the spin onto the field direction over the period of the chiral soliton lattice Kishine et al. (2005). The peak structure of appears to occur due to the C-IC phase transition in GdPt2B.
Note that no metamagnetic transition-like anomaly, which is often observed in helical magnets, was observed in the magnetization curve of GdPt2B. In monoaxial chiral helimagnets, a steep increase in the magnetization associated with the formation of the chiral soliton lattice was observed under magnetic fields perpendicular to the screw axis Moriya and Miyadai (1982); Miyadai et al. (1983); Ohara et al. (2014). The magnetization process of GdPt2B and its anisotropy are rather similar to those of a molecule-based chiral magnet K0.4[Cr(CN)6][Mn()-pn]()-pnH0.6, which does not show a steep upturn in magnetization under magnetic fields perpendicular to the screw axis Kishine et al. (2005). The strength ratio between the DM and exchange interactions, namely , plays a crucial role in forming the chiral soliton lattice under external fields. The ratio varies with the system, and whether clear formation of the chiral soliton lattice is observed could depend on the material. The absence of anomalies in the curves of GdPt2B could be related to the ratio of the strength of the exchange interaction to the strength of the DM interaction. Notably, the formation of chiral soliton lattice differs depending on the strength of the exchange interaction in the doped-YbNi3Al9 system Matsumura et al. (2017). Moreover, the spin reorientation for contributes to the magnetization process at temperatures below 50 K. Further experiments, such as neutron scattering and/or resonant X-ray diffraction, are needed to reveal the detailed properties of the magnetically ordered state in GdPt2B.
IV Conclusions
This paper reported the discovery of a new Gd-based magnetic compound GdPt2B with the CePt2B-type chiral crystal structure (space group: 6422, point group: ). The crystal structure and single-phase nature were analyzed by combining X-ray diffraction and chemical composition analysis. Additionally, we reported the growth of single crystals of GdPt2B using the Czochralski method. The physical properties of GdPt2B single crystals were examined by means of electrical resistivity, magnetization, and specific heat measurements. A clear phase transition was observed in , , and at = 87 K. Interestingly, exhibited the characteristic peak structure at for screw axis, whereas the peak structure was absent for screw axis. We constructed – phase diagrams from the magnetization and thermodynamic measurements. Based on the magnetization behavior and – phase diagrams, GdPt2B could be a chiral helimagnet. Our results demonstrate that GdPt2B is a suitable platform for investigating the competing effects of ferromagnetic and antisymmetric exchange interactions in Gd-based chiral compounds.
Acknowledgements.
We would like to thank Y. Haga, S. Ohara, F. Honda, Y. Shimizu, A. Nakamura for discussions. We also thank F. Sakamoto (Analytical Research Core for Advanced Materials, Institute for materials Research, Tohoku University) for ICP-AES analysis. We acknowledge all the support from the International Research Center for Nuclear Materials Science at Oarai (IMR, Tohoku University). This work was supported by JSPS KAKENHI (JP22K20360, JP19H00646, JP20K20889), Grant-in-Aid for JSPS Research Fellow (JP19J20539), GIMRT Program (202205-IRKAC-0049), and DIARE research grant.References
- Mühlbauer et al. (2009) S. Mühlbauer, B. Binz, F. Jonietz, C. Pfleiderer, A. Rosch, A. Neubauer, R. Georgii, and P. Böni, Science 323, 915 (2009).
- Yu et al. (2010) X. Z. Yu, Y. Onose, N. Kanazawa, J. H. Park, J. H. Han, Y. Matsui, N. Nagaosa, and Y. Tokura, Nature 465, 901 (2010).
- Togawa et al. (2012) Y. Togawa, T. Koyama, K. Takayanagi, S. Mori, Y. Kousaka, J. Akimitsu, S. Nishihara, K. Inoue, A. S. Ovchinnikov, and J. Kishine, Phys. Rev. Lett. 108, 107202 (2012).
- Ohara et al. (2014) S. Ohara, S. Fukuta, K. Ohta, H. Kono, T. Yamashita, Y. Matsumoto, and J. Yamaura, JPS. Conf. Proc. 3, 017016 (2014).
- Matsumura et al. (2017) T. Matsumura, Y. Kita, K. Kubo, Y. Yoshikawa, S. Michimura, T. Inami, Y. Kousaka, K. Inoue, and S. Ohara, J. Phys. Soc. Jpn. 86, 124702 (2017).
- Dzyaloshinsky (1958) I. Dzyaloshinsky, J. Phys. Chem. Solids 4, 241 (1958).
- Moriya (1960) T. Moriya, Phys. Rev. 120, 91 (1960).
- Kurumaji et al. (2019) T. Kurumaji, T. Nakajima, M. Hirschberger, A. Kikkawa, Y. Yamasaki, H. Sagayama, H. Nakao, Y. Taguchi, T. Arima, and Y. Tokura, Science 365, 914 (2019).
- Hirschberger et al. (2019) M. Hirschberger, T. Nakajima, S. Gao, L. Peng, A. Kikkawa, T. Kurumaji, M. Kriener, Y. Yamasaki, H. Sagayama, H. Nakao, K. Ohishi, K. Kakurai, Y. Taguchi, X. Yu, T. Arima, and Y. Tokura, Nat. Commun. 10, 5831 (2019).
- Shang et al. (2021) T. Shang, Y. Xu, D. J. Gawryluk, J. Z. Ma, T. Shiroka, M. Shi, and E. Pomjakushina, Phys. Rev. B 103, L020405 (2021).
- Kakihana et al. (2018) M. Kakihana, D. Aoki, A. Nakamura, F. Honda, M. Nakashima, Y. Amako, S. Nakamura, T. Sakakibara, M. Hedo, T. Nakama, and Y. Ōnuki, J. Phys. Soc. Jpn. 87, 023701 (2018).
- Ōnuki et al. (2020) Y. Ōnuki, M. Kakihana, W. Iha, K. Nakaima, D. Aoki, A. Nakamura, F. Honda, M. Nakashima, Y. Amako, J. Gouchi, Y. Uwatoko, S. Nakamura, T. Sakakibara, T. Takeuchi, Y. Haga, H. Ikeda, H. Harima, M. Hedo, and T. Nakama, JPS Conf. Proc. 30, 011008 (2020).
- Dias et al. (2007) M. Dias, O. L. Sologub, L. C. J. Pereira, and A. P. Gonçalves, J. Alloys. Compd. 438, 62 (2007).
- Sologub et al. (2003a) O. L. Sologub, K. Hiebl, and P. S. Salamakha, Solid State Commun. 127, 379 (2003a).
- Sologub et al. (2000) O. Sologub, P. Salamakha, H. Noël, M. Potel, M. Almeida, and C. Godart, J. Alloys. Compd. 307, 40 (2000).
- Sato et al. (2021) Y. J. Sato, F. Honda, A. Maurya, Y. Shimizu, A. Nakamura, Y. Homma, D. X. Li, Y. Haga, and D. Aoki, Phys. Rev. Mater. 5, 034411 (2021).
- Khan et al. (2010) R. T. Khan, G. Hilscher, H. Michor, E. Bauer, O. Sologub, P. Rogl, and G. Giester, J. Phys. Conf. Series 200, 032034 (2010).
- Khan et al. (2015) R. T. Khan, F. Kneidinger, G. Hilscher, A. Sidorenko, O. Sologub, H. Michor, E. Bauer, P. Rogl, and G. Giester, J. Phys.: Condens. Matter 27, 146001 (2015).
- Wells (1947) A. F. Wells, J. Chem. Soc. 0, 1662 (1947).
- Adachi et al. (1980) K. Adachi, N. Achiwa, and M. Mekata, J. Phys. Soc. Jpn. 49, 545 (1980).
- Moriya and Miyadai (1982) T. Moriya and T. Miyadai, Solid. State. Commun. 82, 209 (1982).
- Miyadai et al. (1983) T. Miyadai, K. Kikuchi, H. Kondo, S. Sakka, M. Arai, and Y. Ishikawa, J. Phys. Soc. Jpn. 52, 1394 (1983).
- Momma and Izumi (2011) K. Momma and F. Izumi, J. Appl. Cryst. 44, 1272 (2011).
- Sheldrick (2015a) G. M. Sheldrick, Acta Cryst. A71, 3 (2015a).
- Sheldrick (2015b) G. M. Sheldrick, Acta Cryst. C71, 3 (2015b).
- Sologub et al. (2003b) O. L. Sologub, K. Hiebl, P. S. Salamkha, and H. Ipser, J. Alloys and Compd. 360, 54 (2003b).
- Izumi and Momma (2007) F. Izumi and K. Momma, Solid. State. Phenom. 130, 15 (2007).
- Gondek et al. (2008) L. Gondek, Żukrowski, M. Bałanda, D. kaczorowski, and A. Szytuła, Mater. Sci. -Pol. 72, 815 (2008).
- Penc et al. (2000) B. Penc, S. Baran, M. Hofmann, J. Leciefewicz, M. Ślaski, and A. Szytuła, J. Alloys. Compd. 299, 79 (2000).
- Stein et al. (2017) S. Stein, L. Heletta, and R. Pöttgen, Z. Naturforsch. B 26, 511 (2017).
- Nakamura et al. (2018) S. Nakamura, N. Kabeya, M. Kobayashi, K. Araki, K. Katoh, and A. Ochiai, Phys. Rev. B 98, 054410 (2018).
- Maurya et al. (2015) A. Maurya, A. Thamizhavel, S. K. Dhar, and P. Bonville, Sci. Rep. 5, 12021 (2015).
- Jensen and Mackintosh (1991) J. Jensen and A. R. Mackintosh, Rare Earth Magnetism: Structures and Excitations (Clarendon Press, Oxford, 1991) p. 57.
- Araújo et al. (2005) J. P. Araújo, A. M. Pereira, M. E. Braga, R. P. Pinto, J. M. Teixeira, F. C. Correia, J. B. Sousa, L. Morellon, P. A. Algarabel, C. Magen, and M. R. Ibarra, J. Phys.: Condens. Matter. 17, 4941 (2005).
- Marcano et al. (2019) N. Marcano, P. A. Algarabel, L. F. Barquín, J. P. Araujo, A. M. Pereira, J. H. Belo, C. Magén, L. Morellón, and M. R. Ibarra, Phys. Rev. B 99, 054419 (2019).
- Bera et al. (2013) A. K. Bera, S. M. Yusuf, and S. Banerjee, Solid State Sci. 16, 57 (2013).
- Dhanasekhar et al. (2019) C. Dhanasekhar, A. K. Das, A. Das, S. K. Mishra, R. Rawat, and A. Venimadhav, Euro Phys. Lett. 127, 67001 (2019).
- Ghimire et al. (2013) N. J. Ghimire, M. A. McGuire, D. S. Parker, B. Sipos, S. Tang, J.-Q. Yan, B. C. Sales, and D. Mandrus, Phys. Rev. B 87, 104403 (2013).
- Mayoh et al. (2022) D. A. Mayoh, J. Bouaziz, A. E. Hall, J. B. Staunton, M. R. Lees, and G. Balakrishnan, Phys. Rev. Research 4, 013134 (2022).
- Turgut et al. (2017) E. Turgut, M. J. Stolt, S. Jin, and G. D. Fuchs, J. Appl. Phys. 122, 183902 (2017).
- Miyazaki et al. (2012) R. Miyazaki, Y. Aoki, R. Higashinaka, H. Sato, T. Yamashita, and S. Ohara, Phys. Rev. B 86, 155106 (2012).
- Ninomiya et al. (2018) H. Ninomiya, T. Sato, K. Inoue, and S. Ohara, Physica B 536, 654 (2018).
- Togawa et al. (2013) Y. Togawa, Y. Kousaka, S. Nishihara, K. Inoue, J. Akimitsu, A. S. Ovchinnikov, and J. Kishine, Phys. Rev. Lett. 111, 197204 (2013).
- Togawa et al. (2015) Y. Togawa, T. Koyama, Y. Nishimori, Y. Matsumoto, S. McVitie, D. McGrouther, R. L. Stamps, Y. Kousaka, J. Akimitsu, S. Nishihara, K. Inoue, I. G. Bostrem, V. E. Sinitsyn, A. S. Ovchinnikov, and J. Kishine, Phys. Rev. B 92, 220412(R) (2015).
- Kishine et al. (2005) J. Kishine, K. Inoue, and Y. Yoshida, Prog. Theor. Phys. Suppl. 159, 82 (2005).
- Zheludev et al. (1997) A. Zheludev, S. Maslov, G. Shirane, Y. Sasago, N. Koide, and K. Uchinokura, Phys. Rev. Lett. 78, 4857 (1997).
- Zheludev et al. (1998) A. Zheludev, S. Maslov, G. Shirane, Y. Sasago, N. Koide, and K. Uchinokura, Phys. Rev. B 57, 2968 (1998).