Charge Transport in Ba1-xRbxFe2As2 Single Crystals
Abstract
Recent studies in heavily hole-doped iron-based superconductor RbFe2As2 have suggested the emergence of novel electronic nematicity directed along the Fe-As direction, 45∘ rotated from the usual nematicity ubiquitously found in BaFe2As2 and related materials. This motivates us to study the physical properties of Ba1-xRbxFe2As2, details of which remain largely unexplored. Here we report on the normal-state charge transport in Ba1-xRbxFe2As2 superconductors by using high-quality single crystals in the range of Rb concentration . From the systematic measurements of the temperature dependence of electrical resistivity , we find a signature of a deviation from the Fermi liquid behavior around the optimal composition, which does not seem related to the antiferromagnetic quantum criticality but has a potential link to hidden nematic quantum criticality. In addition, electron correlations derived from the coefficient of resistivity show a marked increase with Rb content near the heavily hole-doped end, consistent with the putative Mott physics near the electron configuration in iron-based superconductors.
1 INTRODUCTION
BaFe2As2-based superconductors are the prototypical family of iron-based superconductors. Starting from the antiferromagnetic parent compound BaFe2As2, superconductivity can be induced by electron or hole doping [1, 2], isovalent substitution [3], and by applying pressure [4]. In the hole-doped Ba1-xKxFe2As2, the maximum of the superconducting transition temperature reaches 38 K, which is the highest value among those in BaFe2As2-based superconductors.
These materials also exhibit the tetragonal-orthorhombic structural transition at or above the antiferromagnetic transition temperature. Strong in-plane anisotropy has been observed inside the orthorhombic phase, implying that the structural transition is driven by the lattice coupling to electronic nematicity, which spontaneously breaks the four-fold rotational symmetry of the underlying lattice [5]. becomes maximum near the putative quantum critical point (QCP) of antiferromagnetic and/or electronic nematic order, suggesting that quantum fluctuations associated with the QCP may promote the high- superconductivity and lead to the normal state properties deviated from the standard Fermi liquid theory.
High-temperature superconductivity in cuprate superconductors also appears in the vicinity of the antiferromagnetic ordered phase, but there is a crucial difference from iron-based superconductors in the electronic structures of parent compounds. While undoped cuprates are characterized by a half-filled band and strong Coulomb repulsion drives the system into a Mott insulator, BaFe2As2 with 3 electronic configuration exhibits a metallic ground state. However, one can approach a half-filled band state in BaFe2As2-based superconductors by hole doping. In the case of Ba1-xKxFe2As2, quasiparticle mass enhancement toward KFe2As2 with 3 is found from electronic specific heat measurements [6], and an increase of Fe magnetic moment with hole doping is reported by x-ray spectroscopy [7]. These results are considered to be connected to the theoretically proposed Mott insulating phase at 3 configuration [8, 9]. It is also found that the isovalent substitution for K with larger alkali metal ions, Rb or Cs, further enhances electronic correlations, resulting in a very large effective mass, comparable to that of -electron heavy fermion materials [10, 11, 12, 13].
Hole-doped cuprates exhibit a complicated phase diagram, which involves several competing orders [14]. In the underdoped regime, charge density wave has been ubiquitously observed [15], and there is growing evidence for the electronic nematic order [16, 17, 18]. From the analogy to the liquid crystals, these electronic phases with broken symmetries have been discussed in terms of quantum liquid crystals arising from the doped Mott insulator [19]. Similarly, in heavily hole-doped iron pnictides, possible charge order has been recently suggested from nuclear quadrupole resonance experiments for RbFe2As2 [20]. Furthermore, scanning tunneling spectroscopy [21], nuclear magnetic resonance [22, 23] and elastoresistance measurements [24] reveal a novel form of nematicity in this regime, whose nematic director is aligned along the tetragonal [100] or [010] directions, rotated from the usual nematicity along [110] or [10] directions found in other iron-based materials. Although the alternative interpretation for the elastoresistance data has been suggested [25], the recent field-angle resolved specific heat measurements have provided the thermodynamic evidence for this diagonal nematicity [26].
Detailed studies of the physical properties of materials require sizable and high-quality single crystals. Although single crystals of Ba1-xKxFe2As2 grown by the flux method [27, 28, 29] have been commonly used to survey the electronic properties of the hole-doped iron pnictides, recently reported novel electronic orders in RbFe2As2 and their enhanced electron correlations motivate us the investigation of the physical properties of Ba1-xRbxFe2As2. However, single crystal growth of Ba1-xRbxFe2As2 has not been reported except for the Sn-flux method showing a significant Sn contamination in the Ba site [30, 31], which can affect their intrinsic properties. In this article, we report on the synthesis of Ba1-xRbxFe2As2 single crystals for a wide doping range () by the FeAs self-flux method, free from the Sn contamination. Systematic electrical resistivity measurements reveal that non-Fermi liquid behavior near optimal doping and the mass enhancement toward Rb end ().
2 METHODS
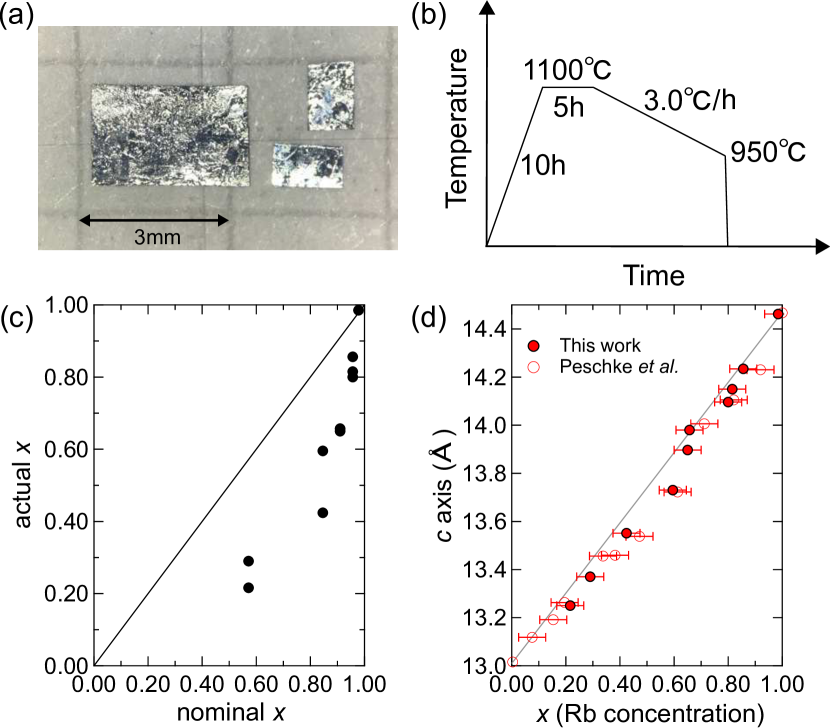
In this study, single crystals of Ba1-xRbxFe2As2 were synthesized by the FeAs self-flux method. BaAs, FeAs, and RbAs precursors were prepared in a similar manner as described in Refs. \citenkihou2010single,kihou2016singlecrystal. Starting materials were mixed at appropriate molar ratios, and the mixtures were sealed in evacuated quartz tubes (for preparing BaAs and FeAs) and a stainless steel tube with an alumina crucible (RbAs) and heated up to 700 (BaAs), 900 (FeAs), and 600 (RbAs) for 20 h. These precursors were weighed in a glove box filled with dried N2 gas at the ratios listed in Table 1 and then put into an alumina crucible. The crucible was sealed in a Ta tube or a stainless steel tube using arc welding and loaded into a quartz tube. Then, the quartz tube was welded while evacuating with a rotary pump. It was heated up to 1100, kept for 5 h, and then slowly cooled down to 950 at the rate of /h, as shown in Fig. 1(b). After the crystal growth, the remaining RbAs precursors were rinsed out of the samples and plate-like single crystals were extracted [Fig. 1(a)].
The Rb compositions of the crystals were determined by energy-dispersive X-ray spectroscopy (EDX) with scanning electron microscopy. The crystal structure was evaluated by X-ray diffraction using MoK radiation (RIGAKU R-AXIS RAPID II). The dc resistivity measurements were performed by the conventional four-probe method using a a nanovoltmeter (Model 2182A/6221, Keithley) with Delta mode or Physical Property Measurement System (Quantum Design). Magnetic susceptibility was measured using a commercial magnetometer (Magnetic Property Measurement System, Quantum Design).
3 RESULTS AND DISCUSSION
The ratio of precursors and the resultant Rb concentration are shown in TABLE 1, and the relationship between nominal and actual composition is depicted in Fig. 1(c). Although a positive correlation between nominal and actual can be seen, we find pieces of crystals with different Rb contents in the same batch, especially for the low Rb concentration regime. Figure 1(d) shows the relationship between the -axis lattice constant determined by X-ray diffraction and the -value obtained from the EDX analysis. The error bars represent uncertainties in EDX measurement (). The -axis lattice constant varies almost linearly with Rb concentration, following Vegard’s law.
| BaAs | RbAs | FeAs | (Rb concentration) |
|---|---|---|---|
| 0.025 | 1.1 | 4 | 0.99 |
| 0.05 | 1.1 | 4 | 0.80, 0.82 |
| 0.10 | 1.1 | 4 | 0.65, 0.66 |
| 0.20 | 1.1 | 4 | 0.42, 0.60 |
| 0.60 | 0.8 | 4 | 0.14, 0.22, 0.29 |
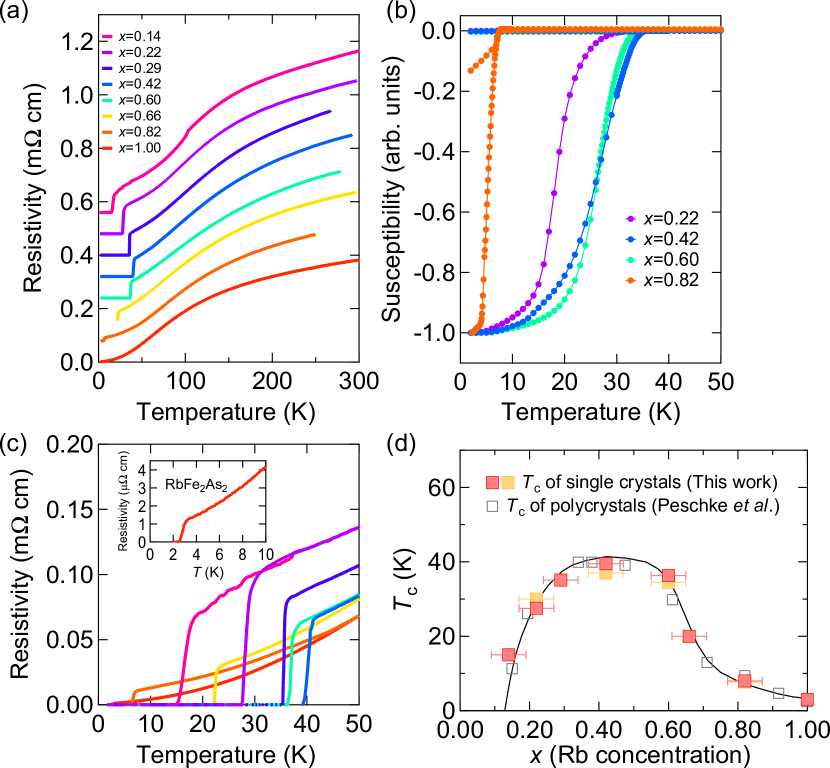
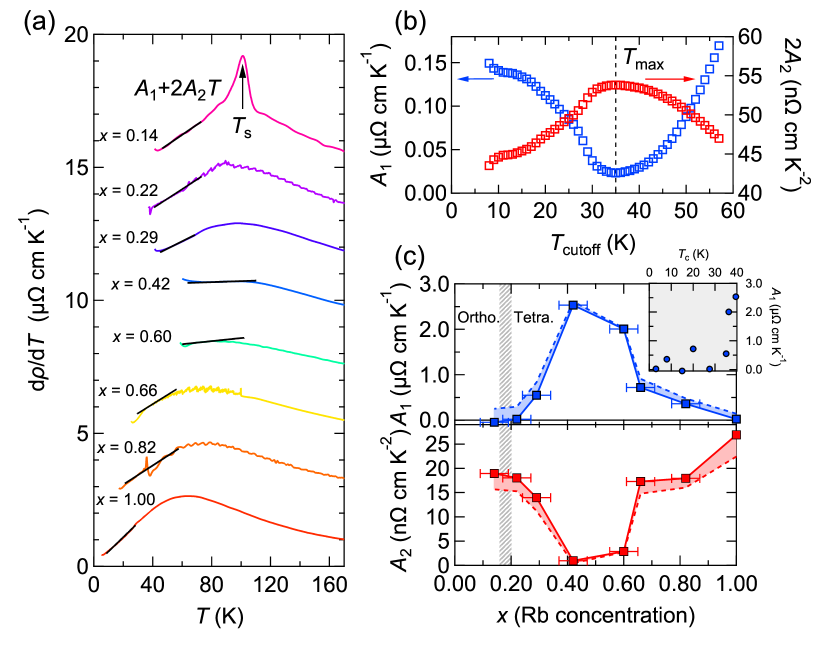
The temperature dependence of in-plane resistivity is shown in Fig. 2(a). A clear superconducting transition is detected in all the samples [Fig. 2(c)]. In RbFe2As2, the residual resistivity ratio , where is the residual resistivity extrapolated to by the power-law fitting (see below), is about 250, indicating the high quality of our crystals. The onset temperatures of the diamagnetic signals measured by dc magnetic susceptibility [Fig. 2(b)] are in line with determined by the zero resistivity [Fig. 2(d)]. Moreover, the recent specific heat study [26] confirmed the bulk superconductivity in the grown crystals. The superconducting phase diagram is shown in Fig. 2(d). The doping dependence of the superconducting transition temperature in single crystals obtained in the present study coincides well with that of polycrystals reported previously [34]. The corresponding temperature derivatives of the resistivity curves depicted in Fig. 3(a) exhibit a discernable anomaly associated with a structural/magnetic transition only in , implying that the boundary of the orthorhombic phase locates between and .
To study the nature of the quasiparticle scattering in Ba1-xRbxFe2As2, we analyze the temperature dependence of the electrical resistivity. First, we show the results of polynomial fitting for the resistivity curves (). Since the overall curves show saturating behaviors at high temperatures (see Fig. 2(a)), the sufficiently low-temperature region should be used for the fitting analysis. However, due to the strong doping dependence of , the fitting range has to be set depending on the doping level. To obtain and values through the reasonable analysis, here we focus on the data shown in Fig. 3(a). We perform a linear fitting to the temperature derivative of resistivity as from above to the upper bound , varied up to the temperature at which the curves show a hump feature. Figure 3(b) shows the parameters and versus in RbFe2As2. As becomes higher, first increases and then turns to decrease at , above which starts to deviate from a linear form. Qualitatively similar dependence of and are seen in all the compositions. In the upper (lower) panel of Fig. 3(c), the dependence of () values at are plotted as closed squares together with their possible maximum (minimum) values found in the dependence of and as a dashed line. Although there are uncertainties in their precise values, their doping evolutions and exhibit a clear trend, which does not depend on . Non-Fermi liquid -linear contribution is enhanced at the optimal compositions and , and as moving away from this regime, decreases and the Fermi-liquid component becomes larger. Indeed, this trend itself is already visible in the data without the above fitting procedures: traces of and are flatter than those of other compositions.
Similar second-order polynomial fits as used here have successfully described the temperature dependence of resistivity in organic superconductors and electron-doped iron pnictides Ba(Fe1-xCox)2As2 [35]. In these materials, the -linear behavior of resistivity becomes most pronounced near the antiferromagnetic QCP, and away from the QCP, it recovers the standard dependence expected in conventional metals. In the crossover region, the temperature dependence of resistivity can be expressed as a sum of these components, and the coefficient of the -linear component has been found to scale with . In our results, however, the -linear coefficient shows a broad maximum around the optimal doping, while the endpoint of the antiferromagnetic phase locates in the underdoped regime , where the antiferromagnetic transition temperature goes to zero [34]. Furthermore, as shown in the inset of Fig. 3(c), the -linear term does not seem to scale perfectly linearly with . These results are not compatible with the description that non-Fermi liquid behavior near antiferromagnetic QCP correlates with [36], but this situation is similar to the case of Ba1-xKxFe2As2 [37], in which the enhanced -linear term can be found at , away from the endpoint of the antiferromagnetic phase.
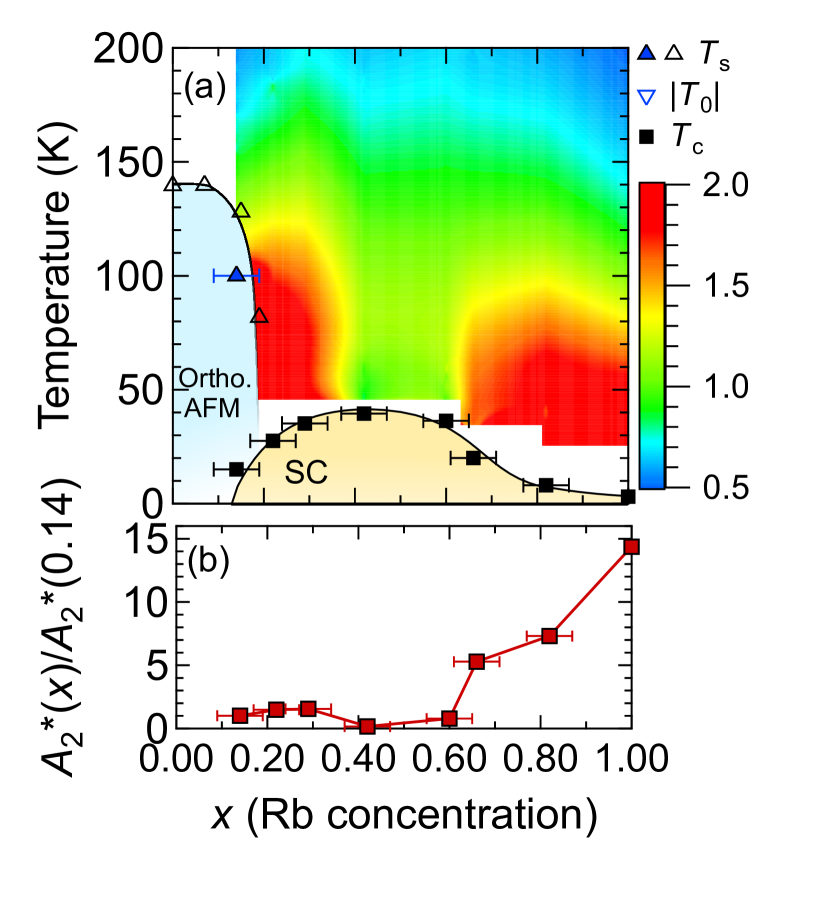
Alternatively, the data can also be analyzed by the power-law fitting, . In Fig. 4(a), we map the temperature evolution of the exponent obtained by such an analysis. We use extracted by the power fitting between above to , and was calculated by a linear fit to . The fitting width was set to 5 K and the fitting range was slid by 1 K. The results of this power-law analysis also show that the sublinear temperature dependence with emerges around . With decreasing or increasing composition from this region, the low-temperature resistivity shows a crossover behavior from the sublinear to quadratic -dependence. This trend is consistent with the results of the polynomial fitting.
The color plot of the exponent in Fig. 4(a) constructs a fan shape centered around the optimal composition, where the sublinear temperature dependent resistivity appears. This reminds us of the phase diagram with an antiferromagnetic quantum critical point, as found in the isovalently substituted iron pnictide BaFe2(As1-xPx)2 [38] and heavy-fermion compound YbRh2Si2 [39]. However, as we have already mentioned, in our case of Ba1-xRbxFe2As2, the antiferromagnetic phase fades away around , far from the center of the fan, and thus the observed fan shape is unlikely related to the antiferromagnetic quantum criticality.
At present, the origin of the non-Fermi liquid sub--linear behavior observed far away from the antiferromagnetic endpoint is not clear. However, we point out that this may be related to electronic nematic instability. There is growing experimental evidence that quantum fluctuations of nematic order can give rise to non-Fermi liquid properties [40, 41, 42], especially near the nematic quantum critical point found in FeSe1-xSx [43, 44]. Recent elastoresistivity measurements in the Ba1-xRbxFe2As2 system have revealed that the nematic susceptibility in the underdoped side shows the Curie-Weiss temperature dependence with a positive Curie-Weiss temperature even in the doping range outside the orthorhombic phase [24]. The Landau free-energy analysis indicates that the Curie-Weiss temperature corresponds to the bare nematic transition temperature with no coupling between the electronic system and the lattice [45]. In real materials, the presence of nemato-elastic coupling leads to the increase of actual nematic (structural) transition temperature from , i.e. [46]. Therefore the positive observed in the tetragonal phase with no implies that there is some mechanism that suppresses the structural transition although the electronic system has a tendency toward nematic instability. Indeed, recently, it is theoretically pointed out that nematic susceptibility close to the nematic QCP can show a deviation from the a Curie-Weiss law at low temperatures when it is well separated from magnetic QCP [47]. On the other hand, a similar situation can also be found in the hole-doped Ba1-xKxFe2As2 system, in which positive values have been reported near the optimal composition with no structural transition [48, 49]. In Ba1-xKxFe2As2, it has been reported that near the endpoint of the magnetic phase, there exists a phase transition from the stripe-type antiferromagnetic phase to a magnetic phase [50], implying the existence of competing magnetic instabilities. Such a – competition would prevent the nematic order even in the region of the phase diagram where the bare nematic transition temperature is finite. In Ba1-xRbxFe2As2, the reported systematic trends of in Ref. \citenishida2020novel reveal a sign change between and , as depicted in Fig. 4(a). Taking into account this situation, it is tempting to relate the observed strange metal component to the hidden quantum critical fluctuations of nematic instability fingerprinted by , but their high superconducting transition temperature prevents us from seeing the precise form of their elastoresistivity down to zero temperature. Measurements under high magnetic fields would be helpful to verify this point.
Next, we discuss the doping dependence of the effective mass of quasiparticles, which is related to the dependence of resistivity, a hallmark of Landau’s Fermi liquid theory. The resistivity comes from the constraints on the phase space where two electrons near the Fermi surface take part in the electron-electron scattering event. The coefficient is proportional to , where is Fermi energy, and thus this coefficient gives a measure of the electron correlations. It has also been widely discussed in terms of the Kadowaki-Woods relation [51] that is proportional to the square of the electronic specific heat coefficient , which is a measure of quasiparticle effective mass.
In a multiband quasi-2D metal with cylindrical Fermi surfaces, the coefficient is given as [52, 40]:
| (1) |
where () is the -axis (-axis) lattice parameter, is the Fermi wave vector, and is the effective mass for each Fermi pocket . The Fermi wave vector for a cylindrical Fermi surface is expressed as ( is the carrier density), and thus depends on and as . From the carrier density and the quasiparticle effective mass of RbFe2As2 summarized in Ref. \citenhardy2016strong, we can estimate nΩ cm , which is in a reasonable agreement with the measured value nΩ cm [Fig. 3(b)]. This implies that the resistivity in RbFe2As2 can be attributed to the electron-electron scattering. With the value of electronic specific heat coefficient mJ of RbFe2As2, recently measured in the single crystals obtained in the present work [26], this leads to the large Kadowaki-Woods ratio µΩ cm , demonstrating its strong correlation. To discuss the general doping trend of effective mass, in the following we use the coefficients in the second-order polynomial fits, which are close to the results of the simple fits except for and , where the -linear behavior is overwhelming.
As we see above, coefficient depends not only on the effective mass but also on the carrier density, which should be taken into account to discuss the evolution of with hole doping. As indicated in Eq. 1, if were independent of Rb concentration, would decrease as carrier density increases. However, as shown in Fig.3(b), is found to increase slightly with increasing in the high doping region. To examine the doping evolution of from , we define a new parameter as . Here, we discuss the doping dependence of carrier density as represented by the carrier density in the outer hole sheet ( band), which is reported to show a significant mass enhancement by hole doping and become more than twice as large as other sheets in RbFe2As2 [53]. To estimate , we simply assume that the dependence of carrier density in Ba1-xRbxFe2As2 is the same as Ba1-xKxFe2As2, and linearly changes with . By using the data of and for Ba1-xKxFe2As2 summarized in Ref. \citenhardy2016strong, the doping evolution of normalized by the value is obtained as shown in Fig. 4(b). Although the above assumptions have some quantitative uncertainties, it is unmistakable that grows rapidly as the Rb concentration approaches the high doping end, which suggests that the effective mass of quasiparticles is largely enhanced toward .
The increasing trend of with is compatible with the scenario that the system approaches the half-filled Mott insulating state. In contrast to high- cuprates, the driving force of electron correlations in iron pnictides is not on-site Coulomb repulsion but the Hund’s coupling effect, which makes the different orbitals decoupled [9]. This leads to the coexistence of the localized and iterant orbitals, and a crossover from the incoherent state to coherent heavy Fermi liquid with lowering temperature [54]. This incoherent-coherent crossover behavior can be seen in the temperature dependence of resistivity in Ba1-xRbxFe2As2 [Fig. 2(a)], where the curvature of changes from convex upward () at high temperatures to convex downward () at low temperatures. We can define at which this curvature change occurs (), and plot in Fig. 4. We find that decreases with Rb concentration , indicating the suppression of crossover temperature, which is consistent with the enhanced correlations with hole doping, as discussed in the -electron Kondo systems [55].
4 CONCLUSIONS
To sum up, we have synthesized a series of single crystals of Ba1-xRbxFe2As2 with by the FeAs self-flux method. The lattice constant follows Vegard’s law, and magneto-structural transition disappears between and , although the positive bare nematic transition temperature from the elastoresistivity measurements is reported even for , implying that there is some mechanism to prevent nematic ordering. By analyzing in-plane electrical resistivity via polynomial and power-law fits, the non-Fermi liquid -linear contribution is found to become pronounced around the optimal composition, away from the antiferromagnetic endpoint. The analysis of the Fermi-liquid coefficient of the resistivity curve indicates that the effective mass rapidly grows near the high doping end, consistent with the putative Mott-insulating phase near the half-filled state.
Acknowledgements
We thank fruitful discussion with M. Nakajima and M. Tanatar. This work was supported by Grants-in-Aid for Scientific Research (KAKENHI) (No. JP18H05227, No. JP19H00649, No. JP20K21139, No. JP20H02600), Grants-in-Aid for Scientific Research on innovative areas “Quantum Liquid Crystals” (No. JP19H05823, No. JP19H05824) from Japan Society for the Promotion of Science (JSPS).
References
- [1] A. S. Sefat, R. Jin, M. A. McGuire, B. C. Sales, D. J. Singh, and D. Mandrus: Phys. Rev. Lett. 101 (2008) 117004.
- [2] M. Rotter, M. Pangerl, M. Tegel, and D. Johrendt: Angew. Chem. Int. Ed. 47 (2008) 7949.
- [3] S. Jiang, H. Xing, G. Xuan, C. Wang, Z. Ren, C. Feng, J. Dai, Z. Xu, and G. Cao: J. Phys.: Condens. Matter 21 (2009) 382203.
- [4] E. Colombier, S. Bud’Ko, N. Ni, and P. Canfield: Phys. Rev. B 79 (2009) 224518.
- [5] J.-H. Chu, J. G. Analytis, K. De Greve, P. L. McMahon, Z. Islam, Y. Yamamoto, and I. R. Fisher: Science 329 (2010) 824.
- [6] J. G. Storey, J. W. Loram, J. R. Cooper, Z. Bukowski, and J. Karpinski: Phys. Rev. B 88 (2013) 144502.
- [7] S. Lafuerza, H. Gretarsson, F. Hardy, T. Wolf, C. Meingast, G. Giovannetti, M. Capone, A. S. Sefat, Y.-J. Kim, P. Glatzel, and L. de’ Medici: Phys. Rev. B 96 (2017) 045133.
- [8] T. Misawa, K. Nakamura, and M. Imada: Phys. Rev. Lett. 108 (2012) 177007.
- [9] L. de’ Medici, G. Giovannetti, and M. Capone: Phys. Rev. Lett. 112 (2014) 177001.
- [10] A. F. Wang, B. Y. Pan, X. G. Luo, F. Chen, Y. J. Yan, J. J. Ying, G. J. Ye, P. Cheng, X. C. Hong, S. Y. Li, and X. H. Chen: Phys. Rev. B 87 (2013) 214509.
- [11] Y. Mizukami, Y. Kawamoto, Y. Shimoyama, S. Kurata, H. Ikeda, T. Wolf, D. A. Zocco, K. Grube, H. v. Löhneysen, Y. Matsuda, and T. Shibauchi: Phys. Rev. B 94 (2016) 024508.
- [12] F. Eilers, K. Grube, D. A. Zocco, T. Wolf, M. Merz, P. Schweiss, R. Heid, R. Eder, R. Yu, J.-X. Zhu, Q. Si, T. Shibauchi, and H. v. Löhneysen: Phys. Rev. Lett. 116 (2016) 237003.
- [13] S. Khim, S. Aswartham, V. Grinenko, D. Efremov, C. G. Blum, F. Steckel, D. Gruner, A. U. Wolter, S. Drechsler, C. Heß, S. Wurmehl, and B. Büchner: Phys. Status Solidi B 254 (2017) 1600208.
- [14] B. Keimer, S. A. Kivelson, M. R. Norman, S. Uchida, and J. Zaanen: Nature 518 (2015) 179.
- [15] R. Comin and A. Damascelli: Annu. Rev. Condens. Matter Phys. 7 (2016) 369.
- [16] V. Hinkov, D. Haug, B. Fauqué, P. Bourges, Y. Sidis, A. Ivanov, C. Bernhard, C. T. Lin, and B. Keimer: Science 319 (2008) 597.
- [17] Y. Sato, S. Kasahara, H. Murayama, Y. Kasahara, E.-G. Moon, T. Nishizaki, T. Loew, J. Porras, B. Keimer, T. Shibauchi, and Y. Matsuda: Nat. Phys. 13 (2017) 1074.
- [18] K. Ishida, S. Hosoi, Y. Teramoto, T. Usui, Y. Mizukami, K. Itaka, Y. Matsuda, T. Watanabe, and T. Shibauchi: J. Phys. Soc. Jpn 89 (2020) 064707.
- [19] S. A. Kivelson, E. Fradkin, and V. J. Emery: Nature 393 (1998) 550.
- [20] E. Civardi, M. Moroni, M. Babij, Z. Bukowski, and P. Carretta: Phys. Rev. Lett. 117 (2016) 217001.
- [21] X. Liu, R. Tao, M. Ren, W. Chen, Q. Yao, T. Wolf, Y. Yan, T. Zhang, and D. Feng: Nat. Commun. 10 (2019) 1.
- [22] J. Li, D. Zhao, Y. P. Wu, S. J. Li, D. W. Song, L. X. Zheng, N. Z. Wang, X. G. Luo, Z. Sun, T. Wu, and X. H. Chen: arXiv:1611.04694 (2016).
- [23] M. Moroni, G. Prando, S. Aswartham, I. Morozov, Z. Bukowski, B. Büchner, H. J. Grafe, and P. Carretta: Phys. Rev. B 99 (2019) 235147.
- [24] K. Ishida, M. Tsujii, S. Hosoi, Y. Mizukami, S. Ishida, A. Iyo, H. Eisaki, T. Wolf, K. Grube, H. v. Löhneysen, and T. Shibauchi: Proc. Nat. Acad. Sci. USA 117 (2020) 6424.
- [25] P. Wiecki, M. Frachet, A. A. Haghighirad, T. Wolf, C. Meingast, R. Heid, and A. E. Böhmer: Nat. Commun. 12 (2021) 4824.
- [26] Y. Mizukami, O. Tanaka, K. Ishida, M. Tsujii, T. Mitsui, S. Kitao, M. Kurokuzu, M. Seto, S. Ishida, A. Iyo, H. Eisaki, K. Hashimoto, and T. Shibauchi: arXiv:2108.13081 (2021).
- [27] H. Luo, Z. Wang, H. Yang, P. Cheng, X. Zhu, and H.-H. Wen: Supercond. Sci. Technol. 21 (2008) 125014.
- [28] K. Kihou, T. Saito, S. Ishida, M. Nakajima, Y. Tomioka, H. Fukazawa, Y. Kohori, T. Ito, S. Uchida, A. Iyo, C.-H. Lee, and H. Eisaki: J. Phys. Soc. Jpn 79 (2010) 124713.
- [29] K. Kihou, T. Saito, K. Fujita, S. Ishida, M. Nakajima, K. Horigane, H. Fukazawa, Y. Kohori, S.-i. Uchida, J. Akimitsu, A. Iyo, C.-H. Lee, and H. Eisaki: J. Phys. Soc. Jpn 85 (2016) 034718.
- [30] Z. Bukowski, S. Weyeneth, R. Puzniak, P. Moll, S. Katrych, N. D. Zhigadlo, J. Karpinski, H. Keller, and B. Batlogg: Phys. Rev. B 79 (2009) 104521.
- [31] J. Karpinski, N. D. Zhigadlo, S. Katrych, Z. Bukowski, P. Moll, S. Weyeneth, H. Keller, R. Puzniak, M. Tortello, D. Daghero, R. Gonnelli, I. Maggio-Aprile, Y. Fasano, Ø. Fischer, K. Rogacki, and B. Batlogg: Physica C Superconductivity 469 (2009) 370.
- [32] M. Rotter, M. Tegel, D. Johrendt, I. Schellenberg, W. Hermes, and R. Pöttgen: Phys. Rev. B 78 (2008) 020503.
- [33] Z. Bukowski, S. Weyeneth, R. Puzniak, J. Karpinski, and B. Batlogg: Physica C Supercond. 470 (2010) S328.
- [34] S. Peschke, T. Stürzer, and D. Johrendt: J. Inorg. Gen. Chem. 640 (2014) 830.
- [35] N. Doiron-Leyraud, P. Auban-Senzier, S. René de Cotret, C. Bourbonnais, D. Jérome, K. Bechgaard, and L. Taillefer: Phys. Rev. B 80 (2009) 214531.
- [36] L. Taillefer: Annu. Rev. Condens. Matter Phys. 1 (2010) 51.
- [37] Y. Liu, M. A. Tanatar, W. E. Straszheim, B. Jensen, K. W. Dennis, R. W. McCallum, V. G. Kogan, R. Prozorov, and T. A. Lograsso: Phys. Rev. B 89 (2014) 134504.
- [38] S. Kasahara, T. Shibauchi, K. Hashimoto, K. Ikada, S. Tonegawa, R. Okazaki, H. Shishido, H. Ikeda, H. Takeya, K. Hirata, T. Terashima, and Y. Matsuda: Phys. Rev. B 81 (2010) 184519.
- [39] J. Custers, P. Gegenwart, H. Wilhelm, K. Neumaier, Y. Tokiwa, O. Trovarelli, C. Geibel, F. Steglich, C. Pépin, and P. Coleman: Nature 424 (2003) 524.
- [40] S. Licciardello, J. Buhot, J. Lu, J. Ayres, S. Kasahara, Y. Matsuda, T. Shibauchi, and N. E. Hussey: Nature 567 (2019) 213.
- [41] S. Licciardello, N. Maksimovic, J. Ayres, J. Buhot, M. Čulo, B. Bryant, S. Kasahara, Y. Matsuda, T. Shibauchi, V. Nagarajan, J. G. Analytis, and N. E. Hussey: Phys. Rev. Research 1 (2019) 023011.
- [42] W. K. Huang, S. Hosoi, M. Čulo, S. Kasahara, Y. Sato, K. Matsuura, Y. Mizukami, M. Berben, N. E. Hussey, H. Kontani, T. Shibauchi, and Y. Matsuda: Phys. Rev. Research 2 (2020) 033367.
- [43] S. Hosoi, K. Matsuura, K. Ishida, H. Wang, Y. Mizukami, T. Watashige, S. Kasahara, Y. Matsuda, and T. Shibauchi: Proc. Natl. Acad. Sci. USA 113 (2016) 8139.
- [44] K. Ishida, Y. Onishi, M. Tsujii, K. Mukasa, M. Qiu, M. Saito, Y. Sugimura, K. Matsuura, Y. Mizukami, K. Hashimoto, and T. Shibauchi: Proc. Nat. Acad. Sci. USA 119 (2022) e2110501119.
- [45] J.-H. Chu, H.-H. Kuo, J. G. Analytis, and I. R. Fisher: Science 337 (2012) 710.
- [46] I. Paul and M. Garst: Phys. Rev. Lett. 118 (2017) 227601.
- [47] R. Tazai, S. Matsubara, Y. Yamakawa, S. Onari, and H. Kontani: arXiv:2205.02280 (2022).
- [48] H.-H. Kuo, J.-H. Chu, J. C. Palmstrom, S. A. Kivelson, and I. R. Fisher: Science 352 (2016) 958.
- [49] T. Terashima, Y. Matsushita, H. Yamase, N. Kikugawa, H. Abe, M. Imai, S. Uji, S. Ishida, H. Eisaki, A. Iyo, K. Kihou, C.-H. Lee, T. Wang, and G. Mu: Phys. Rev. B 102 (2020) 054511.
- [50] A. E. Böhmer, F. Hardy, L. Wang, T. Wolf, P. Schweiss, and C. Meingast: Nat. Commun. 6 (2015) 7911.
- [51] K. Kadowaki and S. Woods: Solid State Commun. 58 (1986) 507.
- [52] N. E. Hussey: J. Phys. Soc. Jpn 74 (2005) 1107.
- [53] F. Hardy, A. E. Böhmer, L. d. Medici, M. Capone, G. Giovannetti, R. Eder, L. Wang, M. He, T. Wolf, P. Schweiss, R. Heid, A. Herbig, P. Adelmann, R. A. Fisher, and C. Meingast: Phys. Rev. B 94 (2016).
- [54] F. Hardy, A. E. Böhmer, D. Aoki, P. Burger, T. Wolf, P. Schweiss, R. Heid, P. Adelmann, Y. X. Yao, G. Kotliar, J. Schmalian, and C. Meingast: Phys. Rev. Lett. 111 (2013) 027002.
- [55] Y.-f. Yang and D. Pines: Proc. Nat. Acad. Sci. USA 109 (2012) E3060.