Rethinking Round-Trip Translation for Machine Translation Evaluation
Abstract
Automatic evaluation on low-resource language translation suffers from a deficiency of parallel corpora. Round-trip translation could be served as a clever and straightforward technique to alleviate the requirement of the parallel evaluation corpus. However, there was an observation of obscure correlations between the evaluation scores by forward and round-trip translations in the era of statistical machine translation (SMT). In this paper, we report the surprising finding that round-trip translation can be used for automatic evaluation without the references. Firstly, our revisit on the round-trip translation in SMT evaluation unveils that its long-standing misunderstanding is essentially caused by copying mechanism. After removing copying mechanism in SMT, round-trip translation scores can appropriately reflect the forward translation performance. Then, we demonstrate the rectification is overdue as round-trip translation could benefit multiple machine translation evaluation tasks. To be more specific, round-trip translation could be used i) to predict corresponding forward translation scores; ii) to improve the performance of the recently advanced quality estimation model; and iii) to identify adversarial competitors in shared tasks via cross-system verification.
1 Introduction
Thanks to the recent progress of neural machine translation (NMT) and large-scale multilingual corpora, machine translation (MT) systems have achieved remarkable performances on high- to medium-resource languages Fan et al. (2021); Pan et al. (2021); Goyal et al. (2022a). However, the development of MT technology on low-resource language pairs still suffers from insufficient data for training and evaluation Aji et al. (2022); Siddhant et al. (2022). Recent advances in multilingual pre-trained language model explore the methods trained on monolingual data, using data augmentation and denoising auto-encoding method Xia et al. (2019); Liu et al. (2020). However, high-quality parallel corpora are still required for evaluating translation quality. Such requirement is especially resource-consuming when working on i) hundreds of underrepresented low-resource languages (Bird and Chiang, 2012; Joshi et al., 2019; Aji et al., 2022) and ii) translations for specific domains (Li et al., 2020; Müller et al., 2020).
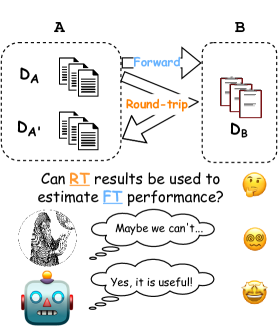
In order to mitigate the deficiency of parallel corpora, conducting Round-trip Translation (RTT) could be a promising method for training data augmentation and evaluation solely on the monolingual corpus. As illustrated in Figure 1, RTT entails two components, one forward translation (FT), and the other backward translation (BT). FT translates a given sentence in source language to a sentence in target language , then the output sentence from FT is translated back to language via a back translation system. However, the existing literature demonstrates that the automatic evaluation score on RTT (RT-Score) unfortunately fails to reflect the score of FT quality (FT-Score) on statistical machine translation (SMT) and rule-based machine translation (RMT) systems Huang (1990); Koehn (2005); Somers (2005); Zaanen and Zwarts (2006). This understanding impedes the usage of RTT for MT evaluation on monolingual data, until some recent empirical discovery of RTT could be helpful for quality estimation (QE) using sentence embeddings Moon et al. (2020); Crone et al. (2021). More recently, a study Agrawal et al. (2022) has shown that RTT-based QE without sentence embeddings can also complement state-of-the-art QE systems. In this work, we revisit the dispute on the usefulness of RT-Score in the era of SMT versus NMT. The main reason is due to the fact that SMT (and RMT) usually incorporate implicitly reversible rules in their translation. For example, copying unrecognized tokens forward to target languages is sometimes penalized by FT evaluation while it is usually awarded by RTT evaluation. Extensive experiments are conducted to demonstrate the effect of copying mechanism on SMT. Later, we illustrate strong correlations between FT-Scores and RT-Scores on various MT systems, including NMT and SMT without the copying mechanism.
The finding sets the basis of using RT-Score for MT evaluation. Three application scenarios in MT evaluation have been investigated to show the effectiveness of RT-Score. Firstly, RT-Scores can be used to predict FT-Scores via training a simple but effective linear regression model on several hundred language pairs. The prediction performance is robust in evaluating transferred MT systems and unseen language pairs including low-resource languages. Then, a cross-system check (X-Check) mechanism is introduced to RTT evaluation for real-world MT shared tasks. By leveraging the estimation from multiple translation systems, X-Check manages to identify those adversarial competitors, which relies heavily on the copy strategy. Finally, RT-Scores are proved effective in improving the performance of a recently advanced quality estimation model.
2 Related Work
Reference-based Machine Translation Evaluation Metric.
Designing high-quality automatic evaluation metrics for evaluating translation quality is one of the fundamental challenges in MT research. Most of the existing metrics largely rely on parallel corpora to provide aligned texts as references Papineni et al. (2002); Lin (2004). The performance of the translation is estimated by comparing the system outputs against ground-truth references. A classic school of reference-based evaluation is based on string match method, which calculates matched ratio of strings or lexicon, such as BLEU Papineni et al. (2002); Post (2018), ChrF Popović (2015) and TER Snover et al. (2006). In addition, recent metrics utilize the semantic representations of texts to estimate their relevance, given pre-trained language models, such as BERTScore Zhang et al. (2020) and BLEURT Sellam et al. (2020). These methods are demonstrated to be more correlated to human evaluation Kocmi et al. (2021) than string-based metrics. Some other reference-based evaluation metrics require supervised training to work well Mathur et al. (2019); Rei et al. (2020) on contextual word embeddings. While these automatic evaluation metrics are widely applied in MT evaluation, they are generally not applicable to low-resource language translation or new translation domains Mathur et al. (2020). Our work demonstrates that reference-free MT metrics (RT-Score) could be used to estimate traditional reference-based automatic metrics.
Reference-free Quality Estimation.
In recent years, there has been a surge of interest in the task of directly predicting the human judgment, namely quality estimation (QE), without the access to parallel reference translations in the run-time Specia et al. (2010, 2013); Bojar et al. (2014); Zhao et al. (2020). Recent focus on QE is mainly based on human evaluation approaches, direct assessment (DA) and post-editing (PE), where researchers intend to train models on data via human judgement features to estimate MT quality. Among these recent QE metrics, learning based models, YiSi-2 Lo (2019), COMET-QE-MQM Rei et al. (2021), to name a few, demonstrate their effectiveness on WMT shared tasks. Our work shows RT-Score promote a recently advanced QE model.
3 Revisiting Round-trip Translation
3.1 Evaluation on Round-trip Translation
Given machine translation systems, and , between two languages ( and ), and a monolingual corpus , FT transforms to and BT translates it back to , . FT and BT constitute a round-trip translation (RTT).
The evaluation scores on round-trip translation (RT-Score) with regard to an automatic evaluation metric is
| (1) |
where BLEU, spBLEU, chrF and BERTScore are target metrics in our discussion.
On the other hand, traditional MT evaluation on parallel corpus is
| (2) |
given a (virtual) parallel corpus . The main research question is whether FT-Scores are correlated to therefore could be predicted by RT-Scores.
3.2 RTT Evaluation on Statistical Machine Translation
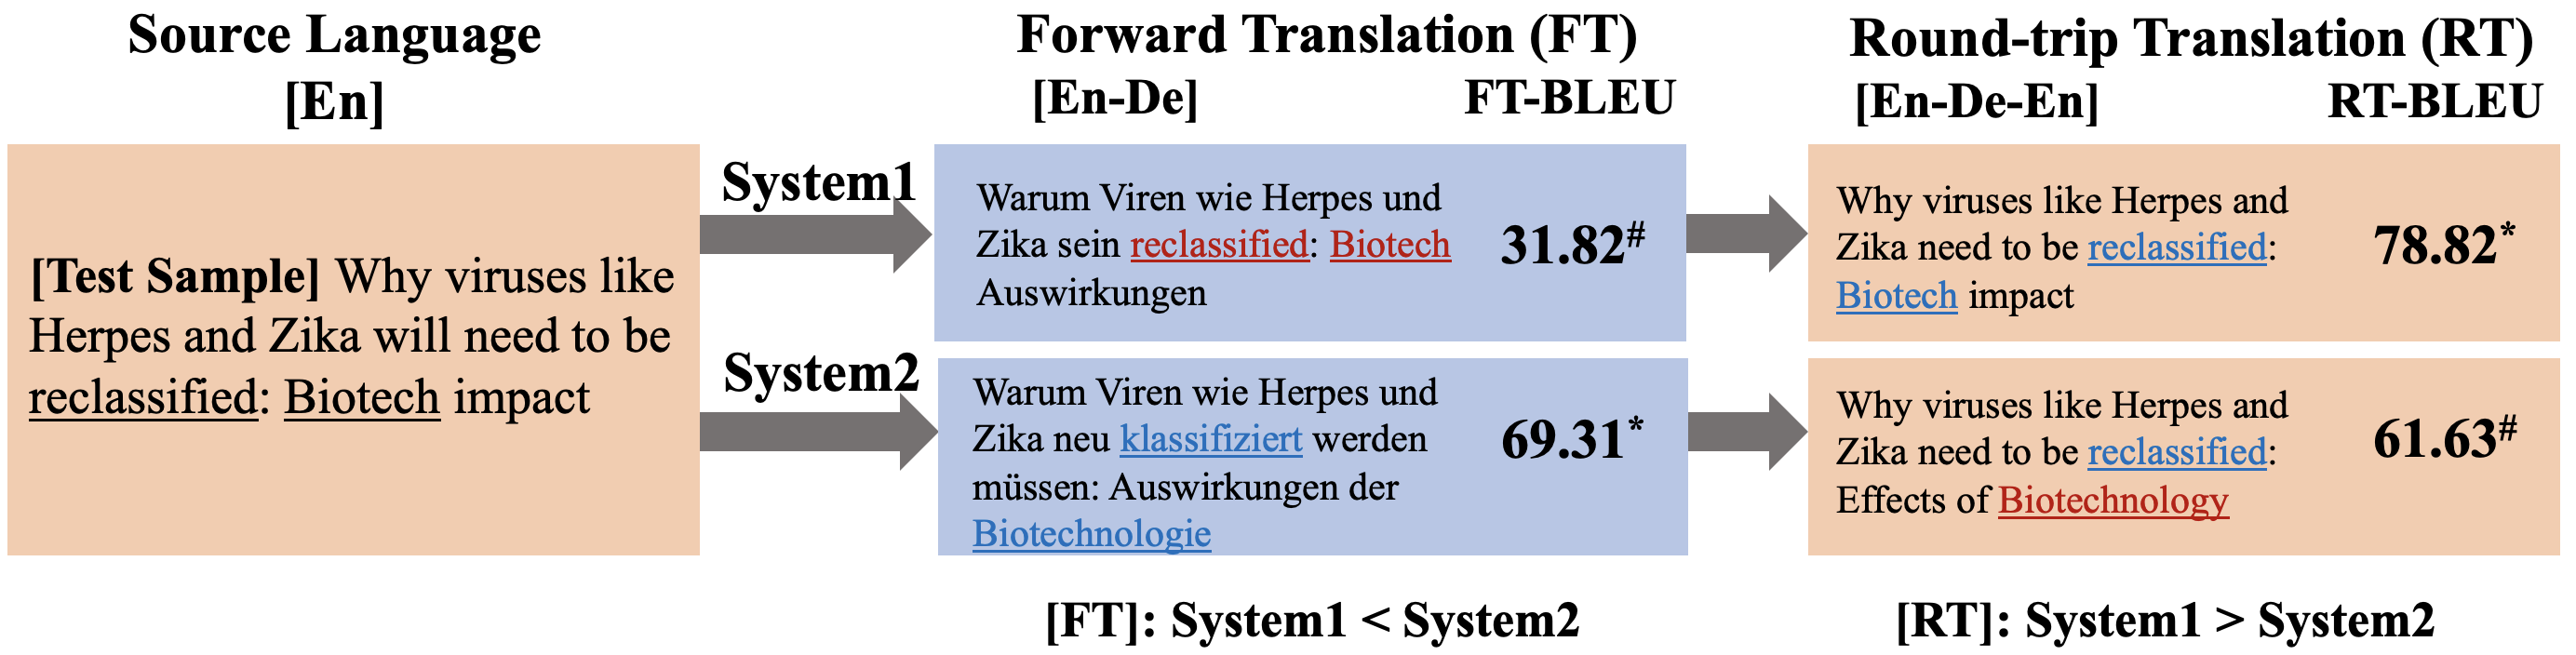
The previous analysis on the automatic evaluation scores from RTT and FT shows that they are negatively correlated. Such a long-established understanding started from the era of RMT (Huang, 1990) and lasted through SMT Koehn (2005); Somers (2005) and prevented the usage of RTT to MT evaluation. We argue that the negative observations are probably due to the selected SMT models involving some reversible transformation rules, e.g., copying unrecognized tokens in translation. As an example illustrated in Figure 2, the MT System 1 works worse than its competing System 2, as System 1 fails to translate ‘reclassified’ and ‘Biotech’. Instead, it decides to copy the words in source language (En) directly to the target outputs. During BT, System 1 manages to perfectly translate them back without any difficulty. For System 2, although translating ‘Biotechnologie’ (De) to ‘Biotechnology’ (En) is adequate, it is not appreciated by the original reference in this case. Consequently, the rankings of these two MT systems are flipped according to their FT and RTT scores. Previous error analysis study on SMT Vilar et al. (2006) also mentioned that the unknown word copy strategy is one of the major causes resulting in the translation errors. We therefore argue that the reversible transformation like word copy could have introduced significant bias to the previous experiments on SMT (and RMT). Then, we conduct experiments to replicate the negative conclusion. Interestingly, removing the copying mechanism can almost perfectly resolve the negation in our experiments.
3.3 Experiments and Analysis
We compare RTT and FT on SMT following the protocol by Somers (2005); Koehn (2005). Moses Koehn and Hoang (2009) is utilized to train phrase-based MT systems Koehn et al. (2003), which were popular in the SMT era.111We follow the baseline setup in the Moses’ tutorial in http://www2.statmt.org/moses/?n=Moses.Baseline. We train SMT systems on News-Commentary v8 Tiedemann (2012), as suggested by WMT organizers Koehn and Monz (2006). We test our systems on six language pairs (de-en, en-de, cs-en, en-cs, fr-en and en-fr) in the competition track of WMT Shared Tasks Barrault et al. (2020). RT-Scores and FT-Scores are calculated based on BLEU in this section. Then, we use Kendall’s and Pearson’s to verify the correlation of RT-Scores and FT-Scores Kendall (1938); Benesty et al. (2009). We provide more detailed settings in Appendix C.
During translation inference, we consider two settings for comparison, one drops the unknown words and the other one copies these tokens to the outputs. Hence, we end up having two groups of six outputs from various SMT systems.
| Lang. Pair | K. | P. | ||
| w/ cp | w/o cp | w/ cp | w/o cp | |
| de-en | -0.11 | 0.20 | -0.90 | 1.00 |
| en-de | -0.40 | 0.60 | -1.00 | 1.00 |
| cs-en | -0.20 | 0.30 | -0.99 | 0.99 |
| en-cs | -0.40 | 0.60 | -0.90 | 0.99 |
| fr-en | 0.20 | 0.60 | -1.00 | 1.00 |
| en-fr | -0.40 | 1.00 | -0.90 | 0.99 |
In Table 1, we examine the relevance between RT-Scores and FT-Scores on six SMT systems. The performance is measured by Kendall’s and Pearson’s . The correlation is essentially decided by the copying mechanism. Specifically, their correlation turns to be much stronger for those systems not allowed copying, compared to the systems with default word copy.
Now, we discuss the rationality of using RTT evaluation for NMT systems, by comparing the reliance of copying mechanism in NMT and SMT. For NMT, we choose mBART50-m2m Tang et al. (2020), which covers 50 languages of cross-lingual translation. Exactly matched words in outputs from the input words are considered copying, although the system may not intrinsically intend to copy them. In Table 2, we observe that copying frequency is about two times in SMT than in NMT. Although NMT systems may copy some words during translation, most of them are unavoidable, e.g., we observe that most of these copies are proper nouns whose translation are actually the same words in target language. In contrast, the copied words in SMT are more diverse and many of them could be common nouns.
| Lang. Pair | Avg. Copy (%) | |
| SMT | NMT | |
| de-en | 17.39 | 9.28 |
| en-de | 21.47 | 9.54 |
4 Predicting FT-Score using RT-Score
In this section, we validate whether FT-Scores could be predicted by RT-Scores. Then, we examine the robustness of the predictor on unseen language pairs and transferred MT models.
4.1 Regression on RT-Score
Here, we construct a linear regressor to predict FT-Scores of a target translation metric by corresponding RT-Scores,
| (3) |
indicates that multiple metrics could be used to construct the input features. We utilize RT-Score from both sides of a language pair as our primary setting, as using more features usually provides better prediction performance Xia et al. (2020). We introduce a linear regressor for predicting FT-Score,
| (4) |
where and are RT-Score features used as inputs of the regressor222We use as our primary setting, as it is the most straightforward and effective method to construct features. In addition, we discuss the possibility to improve the regressor by involving more features, in Appendix G.2.. , and are the parameters of the prediction model optimized by supervised training. 333Implementation details can be found in Appendix E.
In addition, when organizing a new shared task, say WMT, collecting a parallel corpus in low-resource language could be challenging and resource-intensive. Hence, we investigate another setting that utilizes merely the monolingual corpora in language or to predict FT-Score,
| (5) |
We will compare and discuss this setting in our experiments on WMT.
4.2 Experimental Setup
4.2.1 Datasets
We conduct experiments on the large-scale multilingual benchmark, FLORES-101, and WMT machine translation shared tasks. FLORES-AE33 is for training and testing on languages and transferred MT systems. WMT is for testing on real-world shared tasks in new domains.
 ) includes the languages used in both training and testing, and Unseen (
 ) is composed of the languages only used in testing.
  contains 7 High-resource (H.), 7 Medium-resource (M.) and 6 Low-resource (L.) languages, while
  involves 9 Medium-resource (M.) and 4 Low-resource (L.) languages. These two sets are used to construct three types of language pairs for test. Type I and Type III target on translation among
  and
and  language pairs, respectively. Type II targets on translation between
  and
and  . The test setting with more
  is usually more challenging, i.e., Type I Type II Type III.
FLORES-AE33.
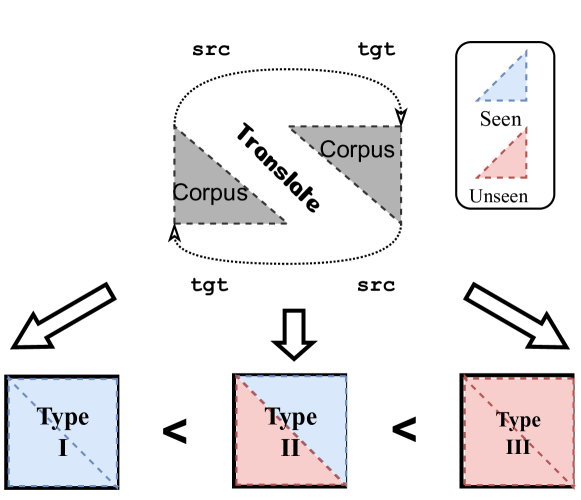
We extract FLORES-AE33, which contains parallel data among 33 languages, covering 1,056 () language pairs, from a curated subset of FLORES-101 (Goyal et al., 2022a). We select these languages based on two criteria: i) We rank languages given the scale of their bi-text corpora; ii) We prioritize the languages covered by WMT2020-News and WMT2020-Bio. As a result, FLORES-AE33 includes 7 high-resource languages, 16 medium-resource languages and 10 low-resource languages. We show the construction pipeline in Figure 3, with more details in Appendix A.
WMT.
We collect corpora from the translation track to evaluate multiple MT systems on the same test sets. We consider their ranking based on FT-Score with metric as the ground truth. We choose the competition tracks in WMT 2020 Translation Shared Tasks Barrault et al. (2020), namely news track WMT2020-News and biomedical track WMT2020-Bio. We consider news and bio as new domains, compared to our training data FLORES-101 whose contents are mostly from Wikipedia.
4.2.2 Neural Machine Translation Systems
We experiment with five MT systems which support most of the languages appearing in FLORES-AE33 and WMT. Except mBART50-m2m, we adopt M2M-100-base and M2M-100-large Fan et al. (2021), which are proposed to conduct many-to-many MT without explicit pivot languages, supporting 100 languages. Google-Trans Wu et al. (2016); Bapna et al. (2022)444We queried Google-Trans API in August, 2022. is a commercial translation API, which was considered as a baseline translation systems in many previous competitions Barrault et al. (2020). Meanwhile, we also include a family of bilingual MT models, Opus-MT Tiedemann and Thottingal (2020), sharing the same model architecture Marian-NMT Junczys-Dowmunt et al. (2018). We provide more details about these MT systems in Appendix C.
4.2.3 Automatic MT Evaluation Metrics
We consider BLEU, spBLEU Goyal et al. (2022b), chrF Popović (2015) and BERTScore Zhang et al. (2020) as the primary automatic evaluation metrics Freitag et al. (2020). All these metrics will be used and tested for both input features and target FT-Score. The first two metrics are differentiated by their tokenizers, where BLEU uses Moses Koehn and Hoang (2010) and spBLEU uses SentencePiece Kudo and Richardson (2018). Both evaluation metrics were officially used in WMT21 Large-Scale Multilingual Machine Translation Shared Task Wenzek et al. (2021). While BLEU works for most language tokenizations, spBLEU shows superior effectiveness on various language tokenizations, especially the performance on low-resource languages Goyal et al. (2022a). More details of these metrics are described in Appendix B
4.3 Experiments and Analysis
Following our discussion in the last section on SMT, we conduct similar experiments using our new multilingual NMT systems on Type I test set of FLORES-AE33. We observe highly positives correlation between FT-Scores and RT-Scores, measured by Pearson’s Benesty et al. (2009). Please refer to Appendix G.1 for more details. Then, we train regressors on RT-Scores and conduct experiments to examine their performance on various challenging settings.
| MT System | Trans. Metric | Type I | ||
| MAE | RMSE | P. | ||
| mBART50-m2m | BLEU | 1.80 | 2.70 | 0.94 |
| spBLEU | 2.13 | 2.99 | 0.94 | |
| chrF | 3.51 | 4.53 | 0.96 | |
| BERTScore | 4.98 | 7.07 | 0.88 | |
| M2M-100-base | BLEU | 3.86 | 5.82 | 0.95 |
| spBLEU | 3.97 | 5.72 | 0.96 | |
| chrF | 6.06 | 7.53 | 0.96 | |
| BERTScore | 4.35 | 6.32 | 0.91 | |
| Google-Trans | BLEU | 4.09 | 5.60 | 0.93 |
| spBLEU | 4.22 | 5.62 | 0.87 | |
| chrF | 5.70 | 6.90 | 0.93 | |
| BERTScore | 2.87 | 3.66 | 0.80 | |
| MT System | Trans. Metric | Type II | Type III | ||||
| MAE | RMSE | P. | MAE | RMSE | P. | ||
| mBART50-m2m | BLEU | 1.36 | 1.97 | 0.93 | 0.81 | 0.95 | 0.96 |
| spBLEU | 1.61 | 2.19 | 0.93 | 1.20 | 1.38 | 0.94 | |
| chrF | 3.80 | 4.89 | 0.95 | 3.04 | 3.89 | 0.95 | |
| BERTScore | 4.67 | 6.38 | 0.88 | 5.08 | 6.88 | 0.87 | |
| M2M-100-base | BLEU | 3.10 | 4.16 | 0.95 | 2.99 | 3.76 | 0.94 |
| spBLEU | 3.24 | 4.18 | 0.96 | 3.18 | 3.88 | 0.95 | |
| chrF | 5.53 | 6.70 | 0.95 | 5.42 | 6.54 | 0.93 | |
| BERTScore | 4.38 | 6.51 | 0.83 | 4.29 | 6.65 | 0.80 | |
| MAE | RMSE | P. | ||||||||
| H. | M. | L. | H. | M. | L. | H. | M. | L. | ||
| mBART50-m2m | H. | 3.17 | 2.90 | 2.70 | 4.02 | 3.74 | 4.07 | 0.94 | 0.94 | 0.77 |
| M. | 1.51 | 1.37 | 1.77 | 1.95 | 1.78 | 2.29 | 0.97 | 0.85 | 0.22 | |
| L | 1.22 | 1.27 | 1.16 | 1.39 | 1.43 | 1.36 | 0.97 | 0.87 | 0.78 | |
| M2M-100-base | H. | 8.72 | 5.41 | 3.50 | 10.82 | 6.45 | 4.52 | 0.51 | 0.80 | 0.67 |
| M. | 4.86 | 4.01 | 2.93 | 4.71 | 1.78 | 4.09 | 0.86 | 0.90 | 0.69 | |
| L | 1.70 | 1.67 | 1.24 | 1.39 | 1.86 | 1.51 | 0.98 | 0.97 | 0.80 | |
4.3.1 Transferability of Regressors
We firstly investigate the transferability of our regressors from two different aspects, transferred MT systems and unseen language pairs. We also evaluate the regressor on different scales of language resources.
Settings.
We train our regressors on Type I train set based on the translation scores from mBART50-m2m. In order to assess system transferability, we test three models on Type I test set. In terms of the language transferability, we consider FT-Scores of mBART50-m2m (a seen MT system in training) and M2M-100-base (an unseen MT system in training) on Type II and Type III in FLORES-AE33. We further evaluate the transferability of our regressor on language resources in Type I test set, with two MT systems, mBART50-m2m and M2M-100-base.
| Lang. Pair | & | |||||||||||
| MAE | RMSE | K. | P. | MAE | RMSE | K. | P. | MAE | RMSE | K. | P. | |
| cs-en | 4.01 | 4.34 | 0.20 | 0.45 | 8.92 | 9.08 | 0.60 | 0.91 | 8.53 | 8.71 | 0.60 | 0.88 |
| de-en | 13.23 | 13.26 | 0.80 | 0.95 | 1.69 | 1.77 | 0.80 | 0.95 | 1.26 | 1.38 | 0.80 | 0.96 |
| de-fr | 10.45 | 10.53 | 1.00 | 0.99 | 1.72 | 2.05 | 0.80 | 0.97 | 1.59 | 1.93 | 1.00 | 0.97 |
| en-cs | 6.96 | 7.49 | 0.20 | 0.25 | 1.39 | 1.79 | 0.60 | 0.94 | 1.25 | 1.80 | 0.60 | 0.95 |
| en-de | 2.96 | 4.00 | 0.40 | 0.59 | 2.29 | 2.70 | 1.00 | 0.92 | 2.75 | 3.12 | 1.00 | 0.93 |
| en-ru | 1.98 | 2.40 | 0.20 | 0.40 | 7.41 | 7.53 | 0.40 | 0.85 | 7.48 | 7.60 | 0.60 | 0.86 |
| en-zh | 2.96 | 3.93 | 0.20 | 0.19 | 1.36 | 1.60 | 0.80 | 0.80 | 1.23 | 1.50 | 0.80 | 0.82 |
| fr-de | 2.89 | 3.70 | 0.80 | 0.90 | 2.99 | 3.56 | 1.00 | 0.94 | 2.59 | 3.17 | 1.00 | 0.93 |
| ru-en | 9.83 | 9.97 | 1.00 | 0.78 | 1.16 | 1.72 | 0.80 | 0.85 | 1.44 | 1.78 | 0.80 | 0.88 |
| zh-en | 12.44 | 12.77 | 0.00 | 0.26 | 3.04 | 3.55 | 0.20 | 0.50 | 2.62 | 3.56 | 0.20 | 0.50 |
| Average | 6.77 | 7.24 | 0.48 | 0.58 | 3.20 | 3.54 | 0.70 | 0.86 | 3.07 | 3.41 | 0.74 | 0.87 |
Discussion.
In Table 3, we present the performance of the regressor across various translation systems and evaluation metrics. We first analyze the results on mBART50-m2m, which is seen in training. The absolute errors between predicted scores and ground-truth FT-Scores are relatively small with regard to MAE and RMSE. Meanwhile, the correlation between prediction and ground truth is strong, with all Pearson’s above or equal to 0.88. This indicates that the rankings of predicted scores are rational. The results of M2M-100-base and Google-Trans demonstrate the performance of predictors on unseen systems. Although the overall errors are higher than those of mBART50-m2m without system transfer, Pearson’s scores are at the competitive level, indicating a similar ranking capability on unseen systems. Meanwhile, our model obtains adequate language transferability results, as demonstrated in Table 4.
In Table 5, we provide detailed performance of our regressor on language pairs of different resources categories on FLORES-AE33, with RT-Scores of mBART50-m2m and M2M-100-base respectively. Specifically, we split the three categories based on Table 9, which are high, medium and low. The evaluated regressor is the same as the one tested in Sections 4.3.1 and 4.3.2. The results of two tables show that our regressor is able to predict FT-Scores with small errors, and reflect the relative orders among FT-Scores, with high transferability across language pairs and MT systems.
4.3.2 Predicting FT-Scores on WMT
With the basis of high transferabilities of the regressors, we conduct experiments on WMT shared tasks, namely WMT2020-News, which includes 10 language pairs. In this experiment, we study on spBLEU metric scores.
Settings.
We have involved five MT systems 555We have contacted the competitors to WMT2020-News. However, we have not received enough valid MT systems to increase the number of competitors. We will show the robustness of our method to a larger number of pseudo-competitors in Appendix G.3. We are aware of the cases that collecting corpora in target languages for competitions might be significantly complex, which means only a monolingual corpus is available for evaluation. Thus, we train predictors using single RT-Scores in Equation 5. Note that this experiment covers several challenging settings, such as transferred MT systems, language transferability, single source features, and transferred application domains. Another set of results on WMT2020-Bio can be found in Appendix G.4.
Discussion.
In Table 6, we display the results on WMT2020-News. Although MAE and RMSE vary among experiments for different language pairs, the overall correlation scores are favorable. Pearson’s values on all language pairs are above 0.5, showing strong ranking correlations. While prediction performances on have some variances among different language pairs, the results of the experiments using are competitive to those using both and features, showing the feasibility of predicting FT-Score using monolingual data. We conclude that our regression-based predictors can be practical in ranking MT systems in WMT-style shared tasks.
| QE model | zh-en | en-de | ||
| K. | P. | K. | P. | |
| RTT-BLEU | 15.17 | 21.76 | 11.83 | 19.71 |
| RTT-spBLEU | 13.55 | 18.30 | 11.49 | 19.00 |
| RTT-chrF | 15.52 | 21.74 | 13.57 | 22.93 |
| RTT-BERTScore | 15.70 | 21.96 | 25.89 | 44.10 |
| RTT-ALL | 15.90 | 22.36 | 26.02 | 44.33 |
| COMET-QE-DA | 32.83 | 46.91 | 42.71 | 64.36 |
| + RTT-ALL | 33.52 | 47.88 | 44.23 | 66.74 |
| # Sys. | Method | No Adversary | One adversarial SMT | Two adversarial SMTs | |||||||
| K. | P. | Hit@1 | Avg. Rank | K. | P. | Hit@2 | Avg. Rank | K. | P. | ||
| 3 | Sing-Check | 0.07 | 0.17 | 0.50 | 2.00 | 0.33 | 0.51 | 0.00 | 4.75 | -0.15 | -0.30 |
| X-Check | 0.47 | 0.43 | 1.00 | 1.00 | 0.33 | 0.98 | 1.00 | 1.50 | 0.55 | 0.98 | |
| \hdashline4 | Sing-Check | 0.33 | 0.37 | 0.25 | 2.75 | 0.40 | 0.39 | 0.00 | 5.75 | -0.03 | -0.33 |
| X-Check | 0.57 | 0.81 | 1.00 | 1.00 | 0.60 | 0.97 | 1.00 | 1.50 | 0.70 | 0.98 | |
| \hdashline5 | Sing-Check | 0.48 | 0.58 | 0.25 | 3.25 | 0.30 | 0.25 | 0.00 | 6.75 | -0.05 | -0.40 |
| X-Check | 0.42 | 0.52 | 1.00 | 1.00 | 0.50 | 0.93 | 1.00 | 1.50 | 0.62 | 0.92 | |
4.3.3 RT-Scores for Quality Estimation
In this section, we demonstrate that the features acquired by round-trip translation benefit quality estimation (QE) models.
Dataset.
QE was firstly introduced in WMT11 Callison-Burch et al. (2011), focusing on automatic methods for estimating the quality of neural machine translation output at run-time. The estimated quality should align with the human judgment on the word and sentence level, without accessing to the reference in the target language. In this experiment, we perform sentence-level QE, which aims to predict human direction assessment (DA) scores. We use DA dataset collected from 2015 to 2021 by MT News Translation shared task coordinators. More details are provided in Appendix D.
Settings.
Firstly, we extract RTT features RTT-BLEU, RTT-spBLEU, RTT-chrF and RTT-BERTScore. Then, we examine whether QE scores could be predicted by these RTT features using linear regression models. We train the regressors using Equation 5 with only features. Finally, a combination of COMET-QE-DA scores and RT-Scores are investigated to acquire a more competitive QE scorer.
Discussion.
Both Kendall’s and Pearson’s provide consistent results in Table 7. The models merely using RT-Scores could be used to predict DA scores. We also observe that RT-Scores can further boost the performance of COMET-QE-DA. We believe RT-Scores advances QE research and urge more investigation in this direction.
5 Towards Robust Evaluation
On the basis of our findings in Section 3.2, RTT evaluation could become potentially vulnerable when MT systems with word copy are involved in. Specifically, the adversarial system may achieve unexpectedly high RT-Scores due to the large portion of preserved words inside original context via RTT, while its FT-Scores remain low.
In order to mitigate the vulnerability, we first validate RTT evaluation on WMT2020-News with direction. One of the advantages of RTT is that multiple MT systems could be used to verify the performance of other systems via checking the combinational RTT results from these systems, coined X-Check. Finally, we demonstrate that the predicted automatic evaluation scores could be further improved via X-Check when adversaries are included.
5.1 Cross-system Validation for Competitions
Given FT MT systems , BT MT systems , and a regression model on predicting the target metric, we can estimate the translation quality of -th FT system on -th BT system:
where . The estimated translation quality of is the average score of the -th column,
Note that the same number of FT and BT systems are considered for simplicity, i.e. .
5.2 Experiments and Analysis
Settings.
We conduct experiments on WMT2020-News similar to Section 4.3.2. We rank the system-level translation quality via the regressor trained on . We challenge the evaluation paradigm by introducing some adversarial MT systems, e.g., SMT with copying mechanism. Specifically, we introduce basic competition scenarios with 3-5 competitors to the shared task, and we consider different numbers of adversarial systems, namely i) no adversary; ii) one adversarial SMT with word copy; iii) two adversarial SMT systems with word copy. We provide details of two SMT systems in Appendix G.5. The experiments with adversarial systems are conducted on four language pairs, cs-en, de-en, en-cs and en-de, as the corresponding adversarial systems were trained in Section 3.3.
Discussion.
From Table 8, we observe that the overall system ranking could be severely affected by the adversarial systems, according to Pearson’s and Kendall’s . The adversarial systems are stealthy among normal competitors, according to Hit@K and Avg. Rank. X-Check evidently successfully identifies these adversarial systems in all our experiments and manages to improve the correlation scores significantly. With the empirical study, we find that X-Check is able to make RTT evaluation more robust.
6 Conclusion
This paper revisits the problem of estimating FT quality using RTT scores. The negative results from previous literature are basically caused by the heavy reliance of copy mechanism in traditional statistical machine translation systems. Then, we conduct comprehensive experiments to show the corrected understanding on RTT benefits several relevant MT evaluation tasks, such as predicting FT metrics using RTT scores, enhancing state-of-the-art QE systems, and filtering out unreliable MT competitors for WMT shared tasks. We believe our work will inspire research on reference-free evaluation on low-resource machine translation.
Limitations
Although we have observed positive correlation between FT-Scores and RT-Scores and conducted experiments to predict FT-Scores using RT-Scores, their relations could be complicated and non-linear. We encourage future research to investigate various RT-Score features and more complex machine learning models for better prediction models. Although we have examined the prediction models on low-resource languages in FLORES-101, we have not tested those very low-resource languages out of these 101 languages. We suggest auditing FT-Score prediction models on a small validation dataset for any new low-resource languages in future applications.
References
- Agrawal et al. (2022) Sweta Agrawal, Nikita Mehandru, Niloufar Salehi, and Marine Carpuat. 2022. Quality estimation via backtranslation at the wmt 2022 quality estimation task. In Proceedings of the Seventh Conference on Machine Translation (WMT), pages 593–596.
- Aji et al. (2022) Alham Aji, Genta Indra Winata, Fajri Koto, Samuel Cahyawijaya, Ade Romadhony, Rahmad Mahendra, Kemal Kurniawan, David Moeljadi, Radityo Eko Prasojo, Timothy Baldwin, et al. 2022. One country, 700+ languages: Nlp challenges for underrepresented languages and dialects in indonesia. In Proceedings of the 60th Annual Meeting of the Association for Computational Linguistics (Volume 1: Long Papers), pages 7226–7249.
- Bapna et al. (2022) Ankur Bapna, Isaac Caswell, Julia Kreutzer, Orhan Firat, Daan van Esch, Aditya Siddhant, Mengmeng Niu, Pallavi Baljekar, Xavier Garcia, Wolfgang Macherey, et al. 2022. Building machine translation systems for the next thousand languages. arXiv preprint arXiv:2205.03983.
- Barrault et al. (2020) Loïc Barrault, Magdalena Biesialska, Ondřej Bojar, Marta R. Costa-jussà, Christian Federmann, Yvette Graham, Roman Grundkiewicz, Barry Haddow, Matthias Huck, Eric Joanis, Tom Kocmi, Philipp Koehn, Chi-kiu Lo, Nikola Ljubešić, Christof Monz, Makoto Morishita, Masaaki Nagata, Toshiaki Nakazawa, Santanu Pal, Matt Post, and Marcos Zampieri. 2020. Findings of the 2020 conference on machine translation (WMT20). In Proceedings of the Fifth Conference on Machine Translation, pages 1–55, Online. Association for Computational Linguistics.
- Benesty et al. (2009) Jacob Benesty, Jingdong Chen, Yiteng Huang, and Israel Cohen. 2009. Pearson correlation coefficient. In Noise reduction in speech processing, pages 1–4. Springer.
- Bird and Chiang (2012) Steven Bird and David Chiang. 2012. Machine translation for language preservation. In Proceedings of COLING 2012: Posters, pages 125–134.
- Bojar et al. (2014) Ondřej Bojar, Christian Buck, Christian Federmann, Barry Haddow, Philipp Koehn, Johannes Leveling, Christof Monz, Pavel Pecina, Matt Post, Herve Saint-Amand, et al. 2014. Findings of the 2014 workshop on statistical machine translation. In Proceedings of the ninth workshop on statistical machine translation, pages 12–58.
- Callison-Burch et al. (2011) Chris Callison-Burch, Philipp Koehn, Christof Monz, and Omar Zaidan. 2011. Findings of the 2011 workshop on statistical machine translation. In Proceedings of the sixth workshop on statistical machine translation, pages 22–64.
- Crone et al. (2021) Nathan Crone, Adam Power, and John Weldon. 2021. Quality estimation using round-trip translation with sentence embeddings. arXiv preprint arXiv:2111.00554.
- Fan et al. (2021) Angela Fan, Shruti Bhosale, Holger Schwenk, Zhiyi Ma, Ahmed El-Kishky, Siddharth Goyal, Mandeep Baines, Onur Celebi, Guillaume Wenzek, Vishrav Chaudhary, et al. 2021. Beyond english-centric multilingual machine translation. J. Mach. Learn. Res., 22(107):1–48.
- Freitag et al. (2020) Markus Freitag, David Grangier, and Isaac Caswell. 2020. Bleu might be guilty but references are not innocent. In Proceedings of the 2020 Conference on Empirical Methods in Natural Language Processing, pages 61–71.
- Goyal et al. (2022a) Naman Goyal, Cynthia Gao, Vishrav Chaudhary, Peng-Jen Chen, Guillaume Wenzek, Da Ju, Sanjana Krishnan, Marc’Aurelio Ranzato, Francisco Guzman, and Angela Fan. 2022a. The flores-101 evaluation benchmark for low-resource and multilingual machine translation. Transactions of the Association for Computational Linguistics, 10:522–538.
- Goyal et al. (2022b) Naman Goyal, Cynthia Gao, Vishrav Chaudhary, Peng-Jen Chen, Guillaume Wenzek, Da Ju, Sanjana Krishnan, Marc’Aurelio Ranzato, Francisco Guzman, and Angela Fan. 2022b. The flores-101 evaluation benchmark for low-resource and multilingual machine translation. Transactions of the Association for Computational Linguistics, 10:522–538.
- He et al. (2021) Pengcheng He, Xiaodong Liu, Jianfeng Gao, and Weizhu Chen. 2021. Deberta: Decoding-enhanced bert with disentangled attention. In International Conference on Learning Representations.
- Huang (1990) Xiuming Huang. 1990. A machine translation system for the target language inexpert. In COLING 1990 Volume 3: Papers presented to the 13th International Conference on Computational Linguistics.
- Joshi et al. (2019) Pratik Joshi, Christain Barnes, Sebastin Santy, Simran Khanuja, Sanket Shah, Anirudh Srinivasan, Satwik Bhattamishra, Sunayana Sitaram, Monojit Choudhury, and Kalika Bali. 2019. Unsung challenges of building and deploying language technologies for low resource language communities. In Proceedings of the 16th International Conference on Natural Language Processing, pages 211–219, International Institute of Information Technology, Hyderabad, India. NLP Association of India.
- Junczys-Dowmunt et al. (2018) Marcin Junczys-Dowmunt, Roman Grundkiewicz, Tomasz Dwojak, Hieu Hoang, Kenneth Heafield, Tom Neckermann, Frank Seide, Ulrich Germann, Alham Fikri Aji, Nikolay Bogoychev, André F. T. Martins, and Alexandra Birch. 2018. Marian: Fast neural machine translation in C++. In Proceedings of ACL 2018, System Demonstrations, pages 116–121, Melbourne, Australia. Association for Computational Linguistics.
- Kendall (1938) Maurice G Kendall. 1938. A new measure of rank correlation. Biometrika, 30(1/2):81–93.
- Kocmi et al. (2021) Tom Kocmi, Christian Federmann, Roman Grundkiewicz, Marcin Junczys-Dowmunt, Hitokazu Matsushita, and Arul Menezes. 2021. To ship or not to ship: An extensive evaluation of automatic metrics for machine translation. In Proceedings of the Sixth Conference on Machine Translation, pages 478–494.
- Koehn (2005) Philipp Koehn. 2005. Europarl: A parallel corpus for statistical machine translation. In Proceedings of machine translation summit x: papers, pages 79–86.
- Koehn and Hoang (2009) Philipp Koehn and Hieu Hoang. 2009. Moses-statistical machine translation system.
- Koehn and Hoang (2010) Philipp Koehn and Hieu Hoang. 2010. Moses. Statistical Machine Translation System, User Manual and Code Guide, page 245.
- Koehn and Monz (2006) Philipp Koehn and Christof Monz. 2006. Proceedings on the workshop on statistical machine translation. In Proceedings on the Workshop on Statistical Machine Translation.
- Koehn et al. (2003) Philipp Koehn, Franz J Och, and Daniel Marcu. 2003. Statistical phrase-based translation. Technical report, University of Southern California Marina Del Rey Information Sciences Inst.
- Kudo and Richardson (2018) Taku Kudo and John Richardson. 2018. SentencePiece: A simple and language independent subword tokenizer and detokenizer for neural text processing. In Proceedings of the 2018 Conference on Empirical Methods in Natural Language Processing: System Demonstrations, pages 66–71, Brussels, Belgium. Association for Computational Linguistics.
- Li et al. (2020) Rumeng Li, Xun Wang, and Hong Yu. 2020. Metamt, a meta learning method leveraging multiple domain data for low resource machine translation. In Proceedings of the AAAI Conference on Artificial Intelligence, volume 34, pages 8245–8252.
- Lin (2004) Chin-Yew Lin. 2004. Rouge: A package for automatic evaluation of summaries. In Text summarization branches out, pages 74–81.
- Liu et al. (2020) Yinhan Liu, Jiatao Gu, Naman Goyal, Xian Li, Sergey Edunov, Marjan Ghazvininejad, Mike Lewis, and Luke Zettlemoyer. 2020. Multilingual denoising pre-training for neural machine translation. Transactions of the Association for Computational Linguistics, 8:726–742.
- Lo (2019) Chi-kiu Lo. 2019. Yisi-a unified semantic mt quality evaluation and estimation metric for languages with different levels of available resources. In Proceedings of the Fourth Conference on Machine Translation (Volume 2: Shared Task Papers, Day 1), pages 507–513.
- Mathur et al. (2019) Nitika Mathur, Timothy Baldwin, and Trevor Cohn. 2019. Putting evaluation in context: Contextual embeddings improve machine translation evaluation. In Proceedings of the 57th Annual Meeting of the Association for Computational Linguistics, pages 2799–2808.
- Mathur et al. (2020) Nitika Mathur, Timothy Baldwin, and Trevor Cohn. 2020. Tangled up in BLEU: Reevaluating the evaluation of automatic machine translation evaluation metrics. In Proceedings of the 58th Annual Meeting of the Association for Computational Linguistics, pages 4984–4997, Online. Association for Computational Linguistics.
- Moon et al. (2020) Jihyung Moon, Hyunchang Cho, and Eunjeong L. Park. 2020. Revisiting round-trip translation for quality estimation. In Proceedings of the 22nd Annual Conference of the European Association for Machine Translation, pages 91–104, Lisboa, Portugal. European Association for Machine Translation.
- Müller et al. (2020) Mathias Müller, Annette Rios, and Rico Sennrich. 2020. Domain robustness in neural machine translation. In Proceedings of the 14th Conference of the Association for Machine Translation in the Americas (Volume 1: Research Track), pages 151–164, Virtual. Association for Machine Translation in the Americas.
- Pan et al. (2021) Xiao Pan, Mingxuan Wang, Liwei Wu, and Lei Li. 2021. Contrastive learning for many-to-many multilingual neural machine translation. In Proceedings of the 59th Annual Meeting of the Association for Computational Linguistics and the 11th International Joint Conference on Natural Language Processing (Volume 1: Long Papers), pages 244–258, Online. Association for Computational Linguistics.
- Papineni et al. (2002) Kishore Papineni, Salim Roukos, Todd Ward, and Wei-Jing Zhu. 2002. Bleu: a method for automatic evaluation of machine translation. In Proceedings of the 40th annual meeting of the Association for Computational Linguistics, pages 311–318.
- Popović (2015) Maja Popović. 2015. chrf: character n-gram f-score for automatic mt evaluation. In Proceedings of the Tenth Workshop on Statistical Machine Translation, pages 392–395.
- Post (2018) Matt Post. 2018. A call for clarity in reporting BLEU scores. In Proceedings of the Third Conference on Machine Translation: Research Papers, pages 186–191, Belgium, Brussels. Association for Computational Linguistics.
- Rei et al. (2021) Ricardo Rei, Ana C Farinha, Chrysoula Zerva, Daan van Stigt, Craig Stewart, Pedro Ramos, Taisiya Glushkova, André FT Martins, and Alon Lavie. 2021. Are references really needed? unbabel-ist 2021 submission for the metrics shared task. In Proceedings of the Sixth Conference on Machine Translation, pages 1030–1040.
- Rei et al. (2020) Ricardo Rei, Craig Stewart, Ana C Farinha, and Alon Lavie. 2020. Comet: A neural framework for mt evaluation. In Proceedings of the 2020 Conference on Empirical Methods in Natural Language Processing, pages 2685–2702.
- Sellam et al. (2020) Thibault Sellam, Dipanjan Das, and Ankur Parikh. 2020. Bleurt: Learning robust metrics for text generation. In Proceedings of the 58th Annual Meeting of the Association for Computational Linguistics, pages 7881–7892.
- Siddhant et al. (2022) Aditya Siddhant, Ankur Bapna, Orhan Firat, Yuan Cao, Mia Xu Chen, Isaac Caswell, and Xavier Garcia. 2022. Towards the next 1000 languages in multilingual machine translation: Exploring the synergy between supervised and self-supervised learning. arXiv preprint arXiv:2201.03110.
- Snover et al. (2006) Matthew Snover, Bonnie Dorr, Richard Schwartz, Linnea Micciulla, and John Makhoul. 2006. A study of translation edit rate with targeted human annotation. In Proceedings of the 7th Conference of the Association for Machine Translation in the Americas: Technical Papers, pages 223–231.
- Somers (2005) Harold Somers. 2005. Round-trip translation: What is it good for? In Proceedings of the Australasian Language Technology Workshop 2005, pages 127–133.
- Specia et al. (2010) Lucia Specia, Dhwaj Raj, and Marco Turchi. 2010. Machine translation evaluation versus quality estimation. Machine translation, 24(1):39–50.
- Specia et al. (2013) Lucia Specia, Kashif Shah, José GC De Souza, and Trevor Cohn. 2013. Quest-a translation quality estimation framework. In Proceedings of the 51st Annual Meeting of the Association for Computational Linguistics: System Demonstrations, pages 79–84.
- Tang et al. (2020) Yuqing Tang, Chau Tran, Xian Li, Peng-Jen Chen, Naman Goyal, Vishrav Chaudhary, Jiatao Gu, and Angela Fan. 2020. Multilingual translation with extensible multilingual pretraining and finetuning. arXiv preprint arXiv:2008.00401.
- Tiedemann and Thottingal (2020) Jörg Tiedemann and Santhosh Thottingal. 2020. Opus-mt–building open translation services for the world. In 22nd Annual Conference of the European Association for Machine Translation, page 479.
- Tiedemann (2012) Jörg Tiedemann. 2012. Parallel data, tools and interfaces in opus. In Proceedings of the Eight International Conference on Language Resources and Evaluation (LREC’12), Istanbul, Turkey. European Language Resources Association (ELRA).
- Vilar et al. (2006) David Vilar, Jia Xu, Luis Fernando d’Haro, and Hermann Ney. 2006. Error analysis of statistical machine translation output. In Proceedings of the fifth international conference on language resources and evaluation (LREC’06).
- Wenzek et al. (2021) Guillaume Wenzek, Vishrav Chaudhary, Angela Fan, Sahir Gomez, Naman Goyal, Somya Jain, Douwe Kiela, Tristan Thrush, and Francisco Guzmán. 2021. Findings of the wmt 2021 shared task on large-scale multilingual machine translation. In Proceedings of the Sixth Conference on Machine Translation, pages 89–99.
- Wu et al. (2016) Yonghui Wu, Mike Schuster, Zhifeng Chen, Quoc V Le, Mohammad Norouzi, Wolfgang Macherey, Maxim Krikun, Yuan Cao, Qin Gao, Klaus Macherey, et al. 2016. Google’s neural machine translation system: Bridging the gap between human and machine translation. arXiv preprint arXiv:1609.08144.
- Xia et al. (2020) Mengzhou Xia, Antonios Anastasopoulos, Ruochen Xu, Yiming Yang, and Graham Neubig. 2020. Predicting performance for natural language processing tasks. In Proceedings of the 58th Annual Meeting of the Association for Computational Linguistics, pages 8625–8646.
- Xia et al. (2019) Mengzhou Xia, Xiang Kong, Antonios Anastasopoulos, and Graham Neubig. 2019. Generalized data augmentation for low-resource translation. arXiv preprint arXiv:1906.03785.
- Zaanen and Zwarts (2006) Menno van Zaanen and Simon Zwarts. 2006. Unsupervised measurement of translation quality using multi-engine, bi-directional translation. In Australasian Joint Conference on Artificial Intelligence, pages 1208–1214. Springer.
- Zhang et al. (2020) Tianyi Zhang, Varsha Kishore, Felix Wu, Kilian Q Weinberger, and Yoav Artzi. 2020. Bertscore: Evaluating text generation with bert. In Proceedings of the Eighth International Conference on Learning Representations.
- Zhao et al. (2020) Wei Zhao, Goran Glavaš, Maxime Peyrard, Yang Gao, Robert West, and Steffen Eger. 2020. On the limitations of cross-lingual encoders as exposed by reference-free machine translation evaluation. In Proceedings of the 58th Annual Meeting of the Association for Computational Linguistics, pages 1656–1671.
Appendix A Dataset Construction
| Resource | Language | Scale | Usage |
| High | English | - | |
| Spanish | 315M | ||
| French | 289M | ||
| German | 216M | ||
| Portuguese | 137M | ||
| Russian | 127M | ||
| Italian | 116M | ||
| Medium | Dutch | 82.4M | |
| Turkish | 41.2M | ||
| Polish | 40.9M | ||
| Chinese | 37.9M | ||
| Romanian | 31.9M | ||
| Greek | 23.7M | ||
| Japanese | 23.2M | ||
| Czech | 23.2M | ||
| Finnish | 15.2M | ||
| Bulgarian | 10.3M | ||
| Lithuanian | 6.69M | ||
| Estonian | 4.82M | ||
| Latvian | 4.8M | ||
| Hindi | 3.3M | ||
| Javanese | 1.49M | ||
| Icelandic | 1.17M | ||
| Low | Tamil | 992K | |
| Armenian | 977K | ||
| Azerbaijani | 867K | ||
| Kazakh | 701K | ||
| Urdu | 630K | ||
| Khmer | 398K | ||
| Hausa | 335K | ||
| Pashto | 293K | ||
| Burmese | 283K | ||
| Gujarati | 160K |
We provide the statistics of all languages covered by FLORES-AE33, categorised by different scale of the resource (high, medium and low) and usage purpose (![]() and
and ![]() ) in Table 9. Scale is counted by the amount of bi-text data to English in FLORES-101 (Goyal et al., 2022a).
) in Table 9. Scale is counted by the amount of bi-text data to English in FLORES-101 (Goyal et al., 2022a).
To construct FLORES-AE33, we partition these 33 languages into two sets, i) the languages that are utilized in training our models (![]() 666Both train and test sets of our corpus will have these languages.) and ii) the others are employed used for training the predictors but considered for test purpose only (
666Both train and test sets of our corpus will have these languages.) and ii) the others are employed used for training the predictors but considered for test purpose only (![]() ).
We include 20 languages to
).
We include 20 languages to ![]() , with 7 high-resource, 7 medium-resource and 6 low-resource. The rest 13 languages fall into
, with 7 high-resource, 7 medium-resource and 6 low-resource. The rest 13 languages fall into ![]() , with 9 medium-resource and 4 low-resource. Combining these two categories of languages, we obtain three types of language pairs in FLORES-AE33.
, with 9 medium-resource and 4 low-resource. Combining these two categories of languages, we obtain three types of language pairs in FLORES-AE33.
Type I contains pairs of languages in ![]() , where a train set and a test set are collected and utilized independently. For each language pairs, we collect 997 training samples and 1,012 test samples.
The test set of Type II is more challenging than that of Type I set, where the language pairs in this set are composed of one language from
, where a train set and a test set are collected and utilized independently. For each language pairs, we collect 997 training samples and 1,012 test samples.
The test set of Type II is more challenging than that of Type I set, where the language pairs in this set are composed of one language from ![]() set and the other language from
set and the other language from ![]() set. Type III’s test set is the most challenging one, as all its language pairs are derived from
set. Type III’s test set is the most challenging one, as all its language pairs are derived from ![]() languages. Type II and Type III sets are designed for test purpose, and they will not be used for training predictors. Overall, Type I, Type II and Type III sets contain 380, 520, and 156 language pairs, respectively.
languages. Type II and Type III sets are designed for test purpose, and they will not be used for training predictors. Overall, Type I, Type II and Type III sets contain 380, 520, and 156 language pairs, respectively.
Appendix B Automatic Evaluation Metrics for Translation
For BERTScore, Deberta-xlarge-mnli He et al. (2021) is used as the backbone pre-trained language model, as it is reported to have a satisfactory correlation with human evaluation in WMT16. While BLEU, spBLEU and chrF are string-based metrics, BERTScore is model-based. The selection of these metrics is on the basis that they should directly reflect the translation quality. We calculate those scores via open-source toolboxes, EasyNMT 777https://github.com/UKPLab/EasyNMT., sacreBLEU-Toolkit 888https://github.com/mjpost/sacrebleu. and BERTScore 999https://github.com/Tiiiger/bert_score.. We use word-level 4-gram for BLEU and spBLEU, character-level 6-gram for chrF, and score for BERTScore by default.
Appendix C Machine Translation Systems
Moses SMT.
We train five Moses’ Koehn and Hoang (2009) statistical machine translation systems using different phrase dictionary by varying phrase probability threshold from 0.00005, to 0.5. The higher threshold indicates the smaller phrase table and hence a better chance of processing unknown words by the corresponding MT systems. In Table 2, we use Moses with the phrase probability threshold of 0.4 for SMT.
mBART50-m2m.
mBART50-m2m Tang et al. (2020) is a multilingual translation model with many-to-many encoders and decoders. The model is trained on 50 publicly available language corpora with English as a pivot language.
M2M-100-base & M2M-100-large.
These two models are one of the first non-English-centric multilingual machine translation systems, which are trained on 100 languages covering high-resource to low-resource languages. Different from mBART50-m2m, M2M-100-base and M2M-100-large Fan et al. (2021) are trained on parallel multilingual corpora without an explicit centering language.
Opus-MT.
Google-Trans.
Appendix D Quality Estimation Dataset
The direct-assessment (DA) train set contains 33 diverse language pairs and a total of 574,186 tuples with source, hypothesis, reference and direct assessment z-score. We construct the test set by collecting DA scores on zh-en (82,692 segments) and en-de (65,045 segments), as two unseen language pairs.
Appendix E Implementation Details
Regressor.
We use the linear regression model tool by Scikit-Learn 101010https://scikit-learn.org/stable/modules/generated/sklearn.linear_model.LinearRegression.html with the default setting for the API.
MT Systems.
We adopt EasyNMT 111111https://github.com/UKPLab/EasyNMT for loading mBART50-m2m, M2M-100-base, M2M-100-large and Opus-MT for translation.
Computational Resource and Time.
In our experiment, we collect the translation results and compute their FT-Score and RT-Score on multiple single-GPU servers with Nvidia A40. Overall, it cost us about three GPU months for collecting translation results by all the aforementioned MT systems.


Appendix F Measurement
We evaluate the performance of our predictive model via the following measurements:
Mean Absolute Error (MAE)
is used for measuring the average magnitude of the errors in a set of predictions, indicating the accuracy for continuous variables.
Root Mean Square Error (RMSE)
measures the average magnitude of the error. Compared to MAE, RMSE gives relatively higher weights to larger error.
Pearson’s correlation
Benesty et al. (2009) is officially used in WMT to evaluate the agreement between the automatic evaluation metrics and human judgement, emphasizing on the translation consistency. In our paper, the metric evaluates the agreement between the predicted automatic evaluation scores and the ground truth.
Kendall’s correlation
Kendall (1938) is another metric to evaluate the ordinal association between two measured quantities.
Appendix G Supplementary Experiments
G.1 Correlation between FT-Scores and RT-Scores on FLORES-AE33
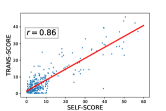
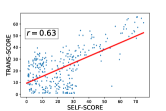
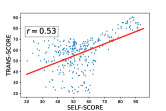
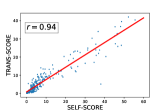
| MT System | Comparison | BLEU | spBLEU | chrF | BERTScore |
| mBART50-m2m | vs. | 0.78 | 0.86 | 0.63 | 0.53 |
| vs. | 0.94 | 0.94 | 0.96 | 0.88 | |
| M2M-100-base | vs. | 0.83 | 0.93 | 0.87 | 0.53 |
| vs. | 0.95 | 0.96 | 0.96 | 0.90 |
Settings.
We experiment with mBART50-m2m and M2M-100-base on Type I test set of FLORES-AE33 by comparing their , and using multiple translation metrics , BLEU, spBLEU, chrF and BERTScore. We measure their correlations by computing Pearson’s Benesty et al. (2009) of and . Note that our experiment is beyond English-centric, as all languages are permuted and equally considered.
| MT System | Self-Trans Feature | Type I | Type II | Type III | ||||||
| MAE | RMSE | MAE | RMSE | MAE | RMSE | |||||
| mBART50-m2m | spBLEU (basic model) | 2.13 | 2.99 | 0.94 | 1.61 | 2.19 | 0.93 | 1.20 | 1.38 | 0.94 |
| + Max-4 Count | 2.01 | 2.92 | 0.94 | 1.54 | 2.15 | 0.94 | 1.12 | 1.34 | 0.94 | |
| + Ref Length | 2.07 | 2.96 | 0.94 | 1.61 | 2.21 | 0.93 | 1.17 | 1.45 | 0.94 | |
| + Max-4 Count & Ref Length | 2.00 | 2.92 | 0.94 | 1.53 | 2.16 | 0.94 | 1.08 | 1.33 | 0.95 | |
| M2M-100-base | spBLEU (basic model) | 3.97 | 5.72 | 0.96 | 3.24 | 4.18 | 0.96 | 3.18 | 3.88 | 0.95 |
| + Max-4 Count | 2.95 | 4.00 | 0.96 | 2.74 | 3.67 | 0.95 | 2.82 | 3.62 | 0.93 | |
| + Ref Length | 3.61 | 5.32 | 0.96 | 2.93 | 3.92 | 0.96 | 2.90 | 3.67 | 0.94 | |
| + Max-4 Count & Ref Length | 2.95 | 4.10 | 0.96 | 2.71 | 3.65 | 0.95 | 2.79 | 3.59 | 0.93 | |
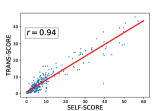
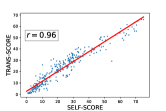
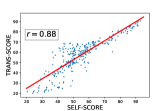
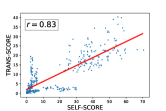
Discussion.
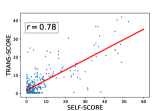
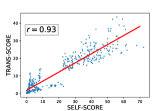
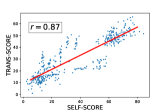
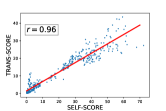
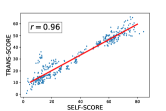
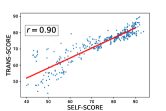
The overall correlation scores are reported in Table 10. Our results indicate at least moderately positive correlations between all pairs of RT-Scores and FT-Scores. Moreover, we observe that is generally more correlated to FT-Score than , leading to strongly positive correlation scores. We attribute the advantage to the fact that serves as the last translation step in . We visualize more detailed results of correlation between FT-Scores and RT-Scores on Type I language pairs in FLORES-101, in Figure 4 (mBART50-m2m) and Figure 5 (M2M-100-base).
G.2 Improve Prediction Performance Using More Features
Settings.
We introduce two extra features, Max-4 Count and Ref Length,121212Max-4 Count and Ref Length are “counts” and “ref_len” in https://github.com/mjpost/sacrebleu/blob/master/sacrebleu/metrics/bleu.py. to enhance the prediction of spBLEU. Max-4 Count is the counts of correct 4 grams, and Ref Length is the cumulative reference length. We follow the similar procedure in RQ2, using the same measurements to evaluate the predictor performance on mBART50-m2m and M2M-100-base across three types of test sets in FLORES-AE33.
Results.
Table 11 shows the results of those models with additional features. Both features consistently improve our basic models, and the performance can be further boosted by incorporating both features. We believe that more carefully designed features and regression models could potentially boost the performance of our predictors.
G.3 WMT2020-News with Synthetic Competitors
We increase the scale of competitors to WMT2020-News by introducing pseudo competitors. To mimic the number of a conventional WMT task, we vary 17 forward translation systems by randomly dropping to (with a step of ) tokens from the outputs of Google-Trans. Then, we utilize the vanilla Google-Trans to translate these synthetic forward translation results back to the source language. We conduct experiments on de-fr, en-ta and zh-en, representing those non-En to non-En, En to non-En and non-En to En language pairs.
The results in Table 12 demonstrate the predictors’ performances on ranking the pseudo competitors on WMT2020-News based on spBLEU features. The overall ranking errors on 17 MT systems are small on all three selected language pairs.
| Langauge Pair | MAE | RMSE | K. | P. |
| de-fr | 2.21 | 2.67 | 1.00 | 0.98 |
| en-ta | 0.88 | 0.98 | 1.00 | 0.99 |
| zh-en | 1.69 | 2.37 | 1.00 | 0.99 |
| Average | 1.59 | 2.01 | 1.00 | 0.99 |
G.4 Ranking Experiments on WMT2020-Bio
We display the experimental results on WMT2020-Bio in the Table 13. The overall performance is positive, while it is relatively worse than the results of WMT2020-News reported in Table 6. We attribute this to the fact that the used on WMT2020-Bio are calculated on document, while our regression models rely on sentence-level translation metrics in training. The large granularity difference of text may result in a distribution shift.
| Langauge Pair | & | |||||||
| MAE | RMSE | K. | P. | MAE | RMSE | P. | ||
| de-en | 10.96 | 11.06 | 0.80 | 0.75 | 10.15 | 10.21 | 0.80 | 0.76 |
| en-de | 5.41 | 5.69 | 0.80 | 0.63 | 5.94 | 6.06 | 0.80 | 0.63 |
| en-es | 6.42 | 7.95 | 0.80 | 0.82 | 6.31 | 7.42 | 0.80 | 0.83 |
| en-fr | 4.03 | 6.27 | 0.40 | 0.19 | 3.68 | 5.86 | 0.40 | 0.20 |
| en-it | 6.13 | 6.92 | 0.40 | 0.56 | 5.94 | 6.58 | 0.40 | 0.57 |
| en-ru | 4.16 | 5.62 | 0.20 | 0.46 | 4.20 | 5.18 | 0.20 | 0.49 |
| en-zh | 2.17 | 2.73 | 0.20 | -0.04 | 2.21 | 2.59 | 0.00 | 0.02 |
| es-en | 6.58 | 8.17 | 0.60 | 0.75 | 6.23 | 7.48 | 0.80 | 0.79 |
| fr-en | 6.12 | 8.02 | 0.60 | 0.66 | 5.77 | 7.13 | 0.60 | 0.67 |
| it-en | 6.33 | 7.94 | 0.60 | 0.50 | 5.90 | 7.13 | 0.60 | 0.56 |
| ru-en | 5.94 | 8.51 | 0.40 | 0.18 | 5.51 | 7.81 | 0.20 | 0.23 |
| zh-en | 5.67 | 8.15 | 0.20 | 0.22 | 5.18 | 7.48 | 0.20 | 0.23 |
| Average | 5.83 | 7.25 | 0.50 | 0.47 | 5.59 | 6.74 | 0.48 | 0.50 |
G.5 Benign MT systems and Adversarial MT Systems for X-Check
The selection of the benign systems is:
-
•
3 Systems: Opus-MT, M2M-100-large and mBART50-m2m;
-
•
4 Systems: Opus-MT, M2M-100-large,M2M-100-base and mBART50-m2m;
-
•
5 Systems: Google-Trans, Opus-MT, M2M-100-large,M2M-100-base and mBART50-m2m.
SMT ().
We train the SMT system on News-Commentary v8 with the max phrase length 4 and the phrase table probability threshold of 0.1.
SMT ().
We train the SMT system on News-Commentary v8 with the max phrase length 4 and the phrase table probability threshold of 0.5.
SMT() tends to copy fewer words than SMT(), due to the larger phrase table size filtered by lower prebability threshold.