Highly-twisted states of light from a high quality factor photonic crystal ring
Abstract
Twisted light with orbital angular momentum (OAM) has been extensively studied for applications in quantum and classical communications, microscopy, and optical micromanipulation. Ejecting the naturally high angular momentum whispering gallery modes (WGMs) of an optical microresonator through a grating-assisted mechanism, where the generated OAM number () is the difference of the angular momentum of the WGM and that of the grating, provides a scalable, chip-integrated solution for OAM generation. However, demonstrated OAM microresonators have exhibited a much lower quality factor () than conventional WGM resonators (by ), and an understanding of the ultimate limits on has been lacking. This is crucial given the importance of in enhancing light-matter interactions, such as single emitter coupling and parametric nonlinear processes, that underpin many important microresonator applications. Moreover, though high-OAM states are often desirable, the limits on what is achievable in a microresonator configuration are not well understood. Here, we provide new physical insight on these two longstanding questions, through understanding OAM from the perspective of mode coupling in a photonic crystal ring, and linking it to the commonly studied case of coherent backscattering between counter-propagating WGMs. In addition to demonstrating high- ( to ), high estimated OAM ejection efficiency (up to ), and high-OAM number (up to = 60), our empirical model is supported by experiments and provides a quantitative explanation for the behavior of and OAM ejection efficiency with for the first time. The state-of-the-art performance and new understanding of the physics of microresonator OAM generation will open new opportunities for realizing OAM applications using chip-integrated technologies.
Light with orbital angular momentum (OAM) shen2019optical ; Erhard_NatRevPhys_2020 , previously known as helically phased light allen1992orbital ; coullet1989optical , has been of long-standing interest. As an intrinsic property of photons, OAM with quantum number provides an additional dimension to encode information winzer2014making . This extra information capacity has been harnessed in holography ren2019metasurface ; ren2020complex ; jack2009holographic , multiplexed communications Wang_NatPhoton_2012 ; hui2015multiplexed ; xie2018integrated ; Willner_APLPhoton_2021 , quantum entanglement Nagali_PRL_2009 ; romero2012increasing ; fickler2012quantum and cryptography mirhosseini2015high ; Sit_Optica_2017 . After Allen et al. pointed out that OAM is a natural property of all helically phased beams allen1992orbital , it has been routinely generated in free-space based on traditional helical beam generation methods allen1992orbital ; sueda2004laguerre ; bauer2015observation . Recently, thin film metasurfaces have been used as a single layer alternative to more traditional multi-level phase plates Karimi_LSA_2014 ; bai2020high ; ji2019dual , and OAM light with up to 276 has been shown bahari2021photonic . In addition, spiral phase mirrors have been used to generate photons carrying OAM with 10,000, with its OAM ( ) entangled with another photon’s horizontal/vertical (H/V) polarization fickler_PNAS_2016 .
On-chip OAM generation using integrated photonics Yang_APLPhoton_2021 can advance more widespread use of OAM functionalities, and one major approach in this regard is through whispering gallery mode (WGM) microresonators matsko_whispering_2005 . The WGMs in such resonators are bound modes that naturally support high angular momentum, and OAM-carrying states can be realized if a suitable means to eject such WGMs into free-space is incorporated, e.g., through a grating inscribed on the resonator cai2012integrated . For a WGM with azimuthal order , a grating with periods around the resonator circumference will eject light carrying OAM with .
The WGM approach is distinguished by the ability to simultaneously enhance light-matter interactions through the microresonator’s high quality factor () and small mode volume () vahala_optical_2003 . This has been used, for example, in OAM semiconductor microlasers miao_orbital_2016 ; Zhang_Science_2020 and in OAM single-photon sources based on the Purcell-enhanced emission of a single quantum emitter by the WGM chen2021bright . To maximize the microresonator’s ability to enhance interactions while ejecting light into an OAM state, its high should be retained even in the presence of the ejection grating, with the degradation in relative to a conventional resonator (no grating) being exclusively due to the new coupling channel into the free-space OAM mode. This behavior should hold for a wide range of , to fully enable the spatial multiplexing at the heart of OAM’s potential in quantum and classical communications. However, existing demonstrations of OAM-generating microresonators have been limited to so far cai2012integrated ; strain_fast_2014 ; chen2021bright , and have focused on relatively low- OAM states. Moreover, quantitative understanding of the relationship between and OAM ejection efficiency and has been lacking, and the full potential of such devices has remained unexplored.
Improving in OAM-generating resonators has numerous implications. For example, in single quantum emitter systems, higher s would produce stronger Purcell enhancement to improve the indistinguishability and spontaneous emission coupling fraction of OAM single photons, with the further possibility of entering the non-perturbative strong coupling regime of cavity QED lodahl_interfacing_2015 . A second example is spatiotemporal shaping of light forbes_structured_2021 , where the ability to control both the spatial and temporal degrees of freedom of light is of both fundamental interest and can lead to new abilities for optical manipulation dholakia_shaping_2011 . Recently, dynamic spatiotemporal control has been explored in the context of coherent addition of optical frequency comb components that carry different amounts of OAM Zhao_NatCommun_2020 . Recent advances in frequency comb generation through nonlinear wave mixing in microresonators kippenberg_dissipative_2018 suggest its potential in such research, but the limited s of OAM microresonators and the lack of understanding of these limits has prevented any serious investigation of such opportunities.
Here, we demonstrate chip-integrated, high- ( to ) microresonators that generate high- OAM states (up to ) with high estimated ejection efficiency (up to ). We also provide a model that predicts the OAM ejection efficiency and microresonator’s total dissipation rate and scaling with . We do so by considering how OAM generation is one manifestation of grating-assisted coupling in a microresonator. In particular, we establish a connection between OAM ejection and mode-selective backscattering, known as selective mode splitting (SMS) lu2014selective , and show how measurements of SMS devices enable quantitative predictions of OAM behavior that are well-matched by experiments. Along with performance that dramatically exceeds previous studies in terms of and accessible OAM states, our work provides a foundation for further development of OAM generation, particularly in the context of nonlinear and quantum light sources.
Results
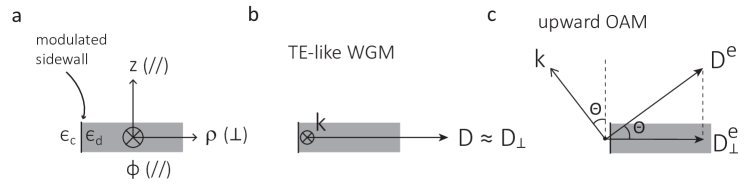
Principle Idea. OAM ejection from a WGM is well-understood at a qualitative level, based on the basic angular momentum conservation criterion between the initial WGM with angular momentum , the imprinted grating with periods along the ring circumference, and the resulting ejected OAM state with = cai2012integrated , as illustrated in Fig. 1(a, d). However, the key missing point is an understanding of the strength of the coupling from the WGM to the free-space OAM mode, which we quantify by a rate . This coupling leads to additional broadening of the total cavity linewidth, given by , where includes the WGM intrinsic loss rate and waveguide coupling rate , which is well-understood in conventional microrings. Such broadening is illustrated in Fig. 1(b).
On the other hand, the interaction rate between two counter-propagating WGMs mediated by an imprinted grating, termed as selective mode splitting (SMS), is well-understood at a quantitative level lu2014selective . Here, we use a photonic crystal ring (PhCR) as an example, as shown in Fig. 1(c). The inside radius of the PhCR is modulated as , where is the average inside radius, is the modulation amplitude, is the number of periods of the grating, and is the azimuthal angle. Each WGM in the PhCR is characterized by an azimuthal mode number , representing its angular momentum, that is, the number of electric field oscillations around the device perimeter within one round trip. When , the clockwise and counterclockwise WGMs are coupled by the photonic crystal grating. This coupling renormalizes two propagating modes into two standing-wave modes that see a narrower and a wider ring on average, and therefore have a smaller and larger resonance wavelength, or equivalently, a higher and lower center resonance frequency (), respectively, as illustrated in Fig. 1(f), where is the uncoupled (clockwise or counter-clockwise propagating) mode frequency. The coupling rate is simply given by , where is the modulation amplitude of the inside radius and at , with the angular frequency of the WGM. We note that can be intuitively understood as the geometric dispersion with respect to the inside radius of an unmodulated ring. It is also equivalent to the per photon force (divided by ) on the inside boundary of an unmodulated ring. Importantly, SMS WGMs remain high- lu2014selective ; lu2020universal ; lu2022high (), with remaining the same as a conventional microring, that is, , as illustrated in Fig. 1(b).
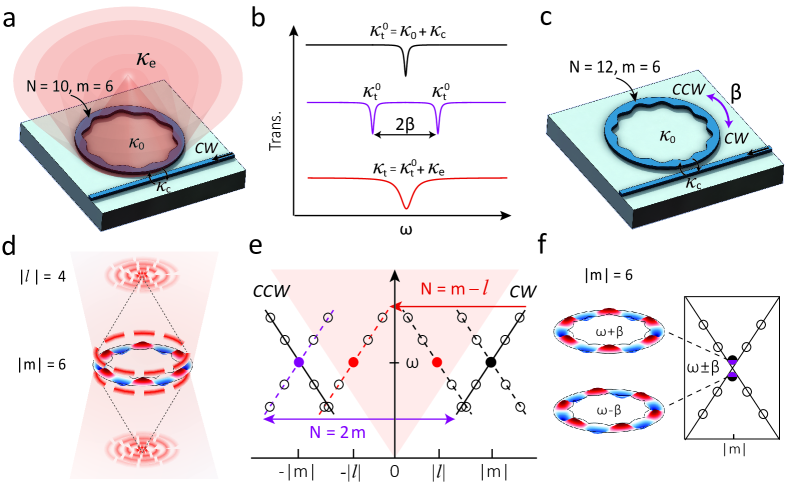
The contrast of the poor understanding of in OAM with the clear understanding of in SMS is striking when we consider the similarity of these two systems, namely, that the number of periods in the grating () is the only difference in device geometry, with for the OAM light carrying momentum, and for SMS. The geometries of the OAM and SMS devices are illustrated in Fig. 1(a,c), with their momentum-frequency diagrams shown in Fig. 1(e). The OAM mode is ejected from the device and cannot interact with the WGM mode after emission, as shown in Fig. 1(a), while clockwise and counter-clockwise WGMs can scatter back and forth, as shown in Fig. 1(c). In the band diagram shown in Fig. 1(e), the OAM emission is illustrated by a red arrow and the SMS coupling is illustrated by a purple double-ended arrow, assuming the waveguide initially couples light into the WGM in the clockwise direction. Figure 1(b) shows the expected transmission spectra of the control device (without modulation), the SMS case, and the OAM case. Compared to the control device, the SMS device shows a frequency splitting but no linewidth broadening, while the OAM device shows a linewidth broadening but no frequency splitting.
From coupled-mode equations for OAM and SMS (see the Supplementary Information for details), we propose a link between OAM and SMS given by:
| (1) |
and have the same units (both are rates), while all other parameters here are unitless. is a constant, and is the cavity mode finesse given by , where , , and are the total optical quality factor, cavity resonance angular frequency, and total cavity linewidth, respectively, of the corresponding WGM mode with an angular momentum of in the microring and an angular momentum of in the OAM emission. represents the nominal twisted angle of the ejected OAM modes with respect to the vertical direction. Writing in terms of its original value with no OAM emission () and OAM emission rate (), we get:
| (2) |
includes the cavity intrinsic loss rate and waveguide-ring coupling rate, so that . is related to and by , with (see Eq. (1)). Equation (2) is a quadratic function of , and its solution is given by:
| (3) |
where the other solution is negative and discarded.
From these simple equations, we can make a few initial observations. In the SMS case, where (), the cosine term vanishes, so that and are zero. This is consistent with previous observations lu2014selective ; lu2022high where is barely affected by the grating modulation as long as . When , i.e., , corresponding topologically to the mode in the Laguerre-Gaussian basis of modes (, where represents the angular momentum number and represents the radial momentum number), the cosine term is equal to one. In this case, when and are small, the cavity linewidth asymptotically approaches that of the unmodulated microring (). When is large compared to , the OAM ejection channel is the dominant cavity loss channel (). Finally, we posit that , i.e, that the OAM ejection rate is linearly proportional to the momentum projected in the vertical direction after the grating’s momentum is exerted on the WGM. This assumption requires experimental verification.
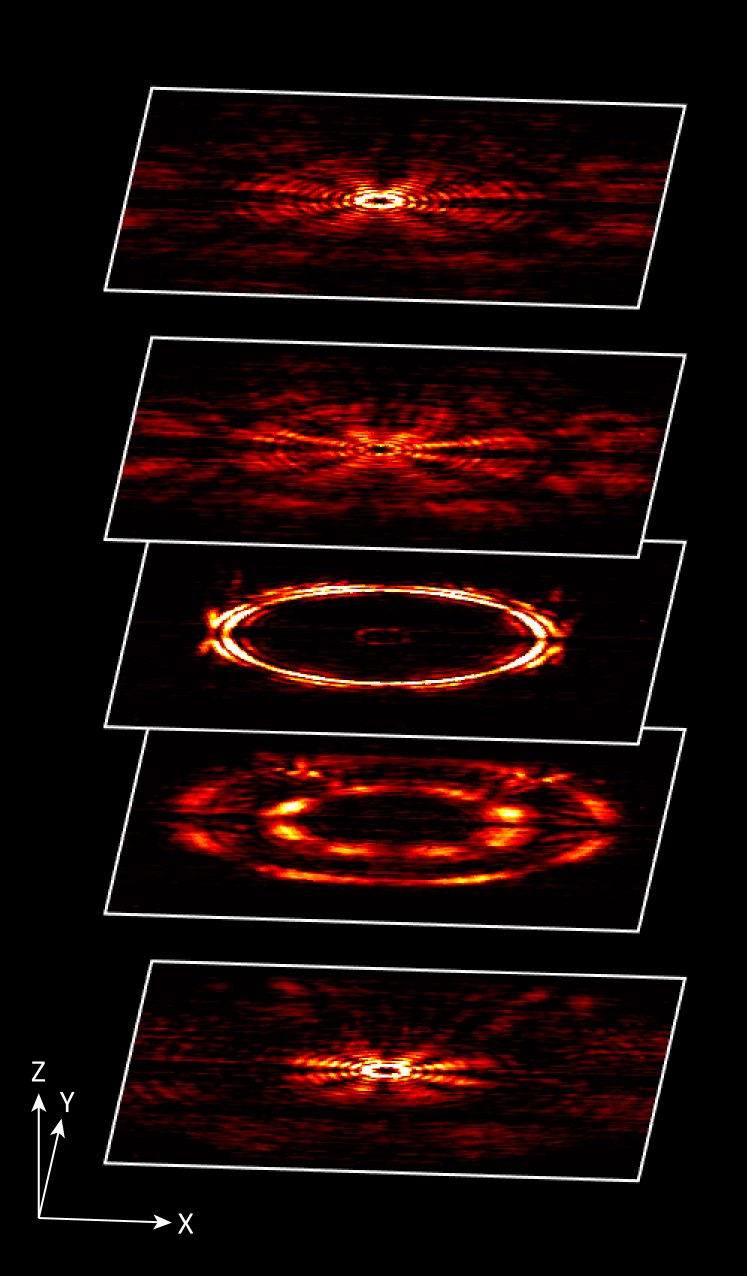
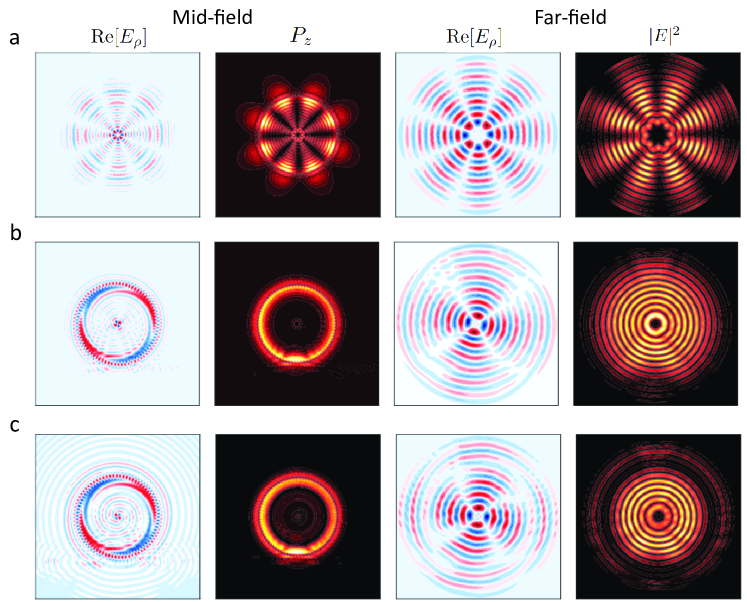
Experimental examination from SMS to OAM. We design and fabricate SMS and OAM devices in stoichiometric silicon nitride following the prescription of the previous section, with details provided in the Methods. Representative experimentally measured infrared images of the light ejected from one OAM device at various (vertical) planes are shown in Fig. 2. This device has = 165 and = 169, and the infrared images show OAM light with = 4. The interference patterns with 42 nodes in both the mid-field and far-field are from the interference of OAM light with = -4 and = 4 (the potential origin of this interference is discussed later). Going forward, we use such images to identify the number for each OAM state, while also considering through transmission spectroscopy.
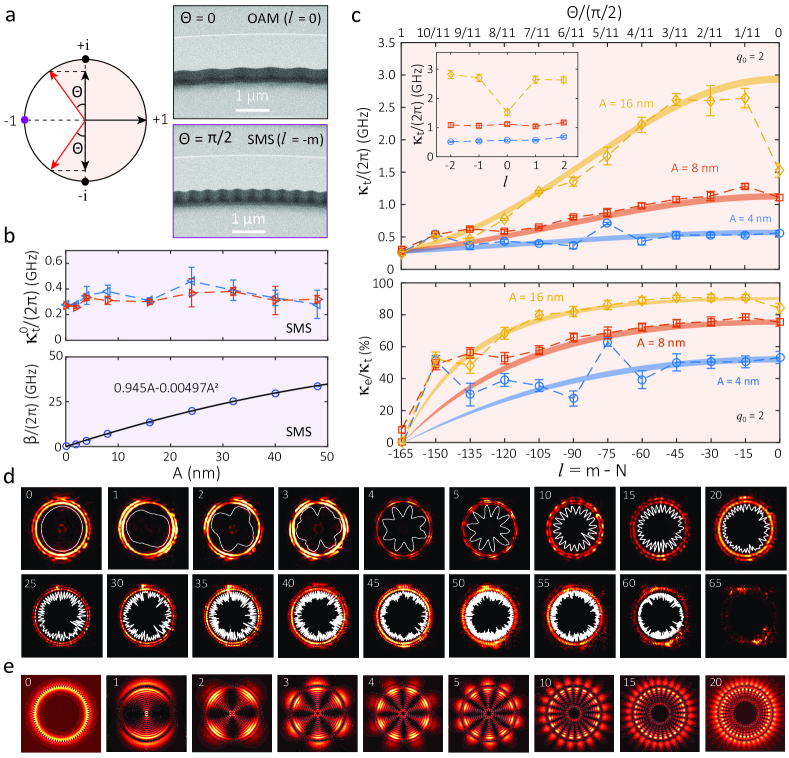
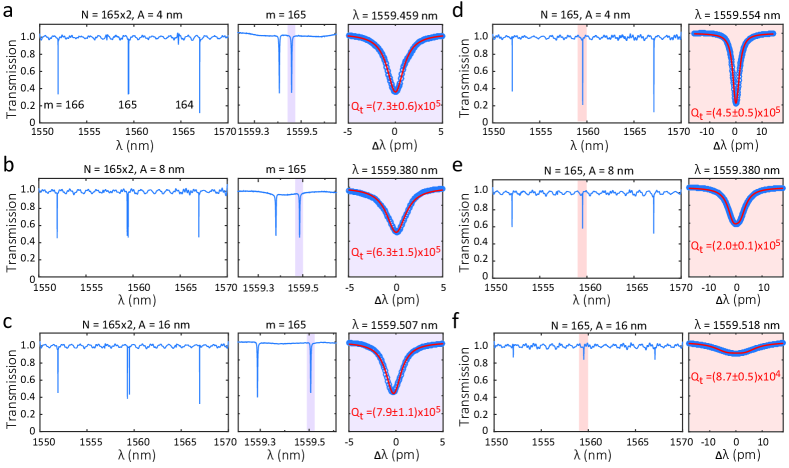
We next consider the close connection between SMS and OAM devices, with representative devices shown in Fig. 3(a). The length of a modulation period, given by , is twice as long in this OAM device (, i.e., ) as in the SMS device (), but all other parameters are kept the same. We fabricate a series of devices for SMS and OAM, varying while keeping the device geometry otherwise fixed. By studying modes of the same azimuthal order and similar resonance frequency , we endeavor to limit the impact of any systematic variation in intrinsic and coupling (e.g., with frequency, ring width, thickness, refractive index, etc), enabling us to focus on how and vary with .
The SMS results are summarized in Fig. 3(b), and are consistent with previous reports lu2014selective ; lu2020universal ; lu2022high : the total cavity linewidths () see no change to within measurement uncertainty when increases, and the mode splitting (2) is essentially linearly dependent on , when the splitting is 10 smaller than the free spectral range (approximately 1 THz in these devices). The error bars represent 95 confidence intervals from nonlinear least squares fits to the SMS transmission data (see Supplementary). The measured GHz corresponds to a 105 at 1560 nm. Using and from SMS, we can predict the total OAM cavity linewidth () and OAM ejection efficiency () through Eqs. (2)-(3), with only one free parameter .
In the top panel of Fig. 3(c) we plot the measured for a series of OAM devices, where has been varied so that ranges between -165 and 0, and for three different values of . We find that this experimental behavior agrees well with our model using the measured SMS values and , as shown by the different color solid curves in Fig. 3(c). The width of the curves represents the uncertainty in the predictions due to the uncertainties of that come from nonlinear least squares fits to the SMS transmission data (see Methods). We note that the predictions deviate from experiments near for large , with the inset zooming in on this behavior with adjacent from -2 to +2. This low-radiation-loss mode only happens at , which has been used in integrated microrings for single-mode lasing arbabi_grating_2015 , and its physics is related to a bound state in the continuum phenomenon hsu2016bound ; yulaev2021exceptional induced by the photonic crystal structure.
The bottom panel of Fig. 3(c) shows the estimated extraction efficiency as a function of , where is experimentally determined from the measured (from the OAM devices) and the measured from the SMS devices. The experimental data is again matched well by the model, particularly for larger values of , where the model results are shown as solid curves whose widths are determined by the aforementioned uncertainties in the experimental SMS data. Importantly, the model contains no free parameter other than measured from experiments, except = 2, which represents the upward and downward OAM emission paths. Between the two panels of Fig. 3(c), we see the basic trend that the estimated OAM ejection efficiency and total cavity linewidth both increase in moving from to . The OAM ejection efficiency and total cavity linewidth also scale with modulation amplitude as expected, with the level of agreement between theory and experiments improving with increasing . The estimated ejection efficiency reaches (803) at and 16 nm, with of (1.190.02) GHz and thus of (1.620.02)105. This efficiency is further increased to (901) at , with a broadening of to (2.60.2) GHz governed by Equation (3).
We also perform imaging of the OAM microring modes to confirm their spatial behavior as a function of . As noted earlier, Fig. 2 shows the results for a microring with =165 and =169. Rather than a pure state, the images are consistent with the emission containing both and contributions, resulting in 42 antinodes in the measured distribution. Similar behavior has been observed in other OAM microcavity works chen2021bright , where it was attributed to ejection of light from a standing wave cavity mode. In our case, the ejection of both CW and CCW light could be due to surface roughness or waveguide facet reflection at the edge of the chip. The back-coupling rate of this reflection seems to be smaller than the total linewidth (unlike the SMS case), so a clear splitting of resonance is not observed in general. Next, Fig. 3(d) displays the imaged OAM microrings fields near the surface of the cavities for a variety of OAM states with increasing , as determined by analyzing the images and counting the number of anti-nodes. OAM states from to are clearly observed; the observation of even higher-order OAM is likely limited by the numerical aperture of our imaging system. We note that in these measurements, devices with 1 to 3 had an additional SMS modulation imprinted on the device pattern to ensure standing wave modes for better interference visibility; this method is discussed further in the next section. A comparison of devices with and without SMS is analyzed in Supplementary.
We compare our results against finite-difference time-domain simulations, with the simulation methods outlined in the Supplementary Information. Dipole excitation is used to excite standing-wave WGMs to have a beating pattern in the intensity for OAM. Figure 3(e) shows that the simulation results qualitatively agree with the observed patterns. Plotted here is the Poynting vector projected on the vertical direction, that is, , in the mid-field above the surface of the microring. The Supplementary Information provides further simulations of emitted OAM for both standing-wave and traveling-wave WGMs.
Finally, we emphasize that the observed s, in addition to following the predicted trends based on the SMS devices and Eqs. (1)-(3), are more than two orders of magnitude higher than those demonstrated in previous OAM generators based on microring resonators cai2012integrated ; chen2021bright , while simultaneously exhibiting a high estimated ejection efficiency. For example, the = 60 mode has and an estimated ejection efficiency of 40 for = 4 nm and and an estimated ejection efficiency of 65 for = 8 nm. Such high-s are particularly promising for enhancing light-matter interactions, for example, to create Purcell-enhanced quantum light with OAM from a quantum emitter chen2021bright , to realize coherent spin-photon interfaces duan2021avertical , or to mediate nonlinear wave mixing interactions such as Kerr comb generation and entangled-photon pair generation with the output fields encoded in OAM states strekalov_nonlinear_2016 .
Combining SMS and OAM coherently. So far we have been using a single-period grating for either SMS or OAM. Since both scattering processes are coherent, it is possible to combine them. For example, previous work has shown that combining multiple SMS periods through a multi-period grating (i.e. by simply adding up modulation with different s) is practical and retains high cavity quality factors lu2020universal . Here we use a dual-period grating to implement SMS and OAM together. For comparison, we study three cases with a fixed number of modulation periods for OAM at and a varying number of modulation periods for SMS at . In the band diagram displayed in the top panel in Fig. 4(a), we illustrate the case in which the mode is ejected to an OAM state and the modes are coupled via SMS. The resulting cavity transmission is illustrated in the bottom panel, where SMS splits the mode (in purple) without affecting linewidths and OAM broadens all the cavity linewidths (in red). Having both SMS and OAM should result in a coherent summation of both effects.
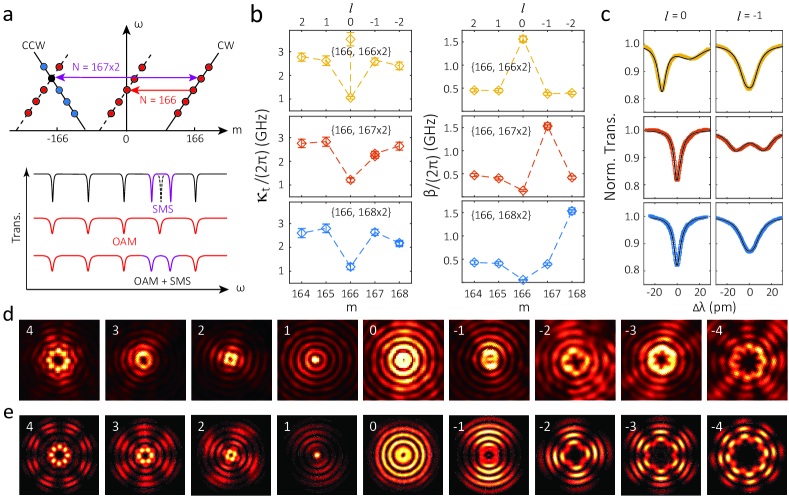
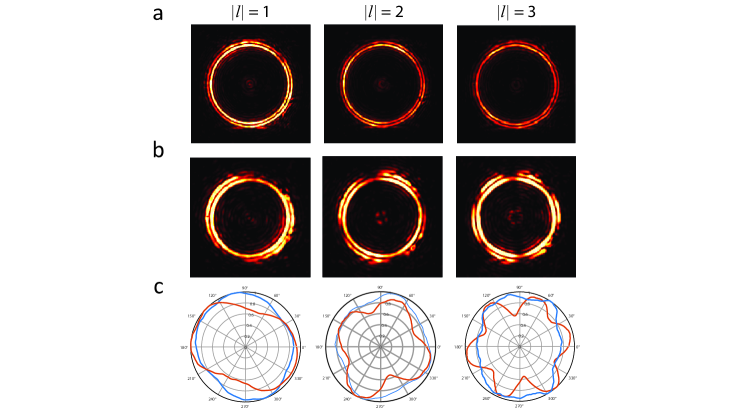
We examine the implementation of coherent OAM and SMS in three fabricated devices, as shown in Fig. 4(b, c), where in contrast to the previous section, here we do not focus on a single azimuthal order mode, but instead examine a series of adjacent azimuthal order modes. Figure 4(c) shows representative transmission spectra (for = 0 and = -1, or equivalently = 166 and = 167). Figure 4(b) shows the extracted loaded cavity linewidths () created by OAM in the left column, and the right column shows the mode splitting () created by SMS. The overall behavior we observe is consistent with expectation for coherent superposition of the OAM and SMS effects. The mode splittings is largest for the azimuthal mode targeted by the SMS modulation, while the OAM modulation is set to eject the l=0 mode, and consistently shows a reduction in dissipation as observed in the previous section.
With or without SMS, our OAM devices always show standing-wave patterns in images taken both at the top surface of the microring, as shown in the previous section by Fig. 3(d), and in the far-field, as we show in Fig. 4(d). These standing-wave images resemble previous reports chen2021bright ; duan2021avertical , and is not an issue in many quantum systems, as the emitted light is intrinsically in both clockwise and counter-clockwise directions chen2021bright . As noted earlier, their precise origin in our system requires further investigation. That being said, we find that the measured far-field images are in good agreement with the results of finite-difference time-domain simulations that incorporate a standing wave mode pattern, as shown in Fig. 4(e).
Importantly, our results indicate that OAM emission does not have to lead to a mode splitting or a considerably broadened linewidth cai2012integrated ; strain_fast_2014 , while the purity of OAM emission and its impact on the OAM efficiency (our estimate given by is an upper bound) require further investigation. For example, the popular square grating is effectively a composition of multiple frequency components, while only the fundamental frequency grating (as we employ with a sinusoidal modulation) is essential for OAM. The potential role that such multi-frequency components play on excess loss and backscattering is still an open question, and to this end, our approach from SMS to OAM can be extended to these structures to perform a quantitative evaluation.
Discussion
We have demonstrated high- optical microcavities with controllable and efficient OAM ejection. By linking OAM ejection to the closely related effect of selective mode splitting (SMS) due to backscattering in a microresonator, we present a predictive model for the OAM cavity linewidth and ejection efficiency. We showcase twisted light with from 0 to 60 and (i.e., fundamental in the transverse direction), and it should be straightforward to extend to larger and . Our results are of use to many photonics applications, including OAM multiplexing and entanglement for classical or quantum photonics applications. Future scientific understanding includes the origin of the coefficient that relates the OAM ejection rate to the cavity finesse, azimuthal mode number, OAM state, and backscattering rate for the analogous SMS device. Additional studies to undertake include the effects of the light cone(s) defined by the cladding and substrate layers on and the origin of the apparent and superposition in the ejected light. Further important engineering tasks include using metamaterial structures with high numerical aperture to collect highly-twisted OAM light, collecting/multiplexing OAM light into the optical fibers, and using OAM states to control/manipulate atomic states on top of the photonic chip.
Data availability
The data that supports the plots within this paper and other findings of this study are available from the corresponding authors upon reasonable request.
References
- (1) Shen, Y. et al. Optical vortices 30 years on: OAM manipulation from topological charge to multiple singularities. Light Sci. Appl. 8, 90 (2019).
- (2) Erhard, M., Krenn, M. & Zeilinger, A. Advances in high-dimensional quantum entanglement. Nat. Rev. Phys. 2, 365–381 (2020).
- (3) Allen, L., Beijersbergen, M. W., Spreeuw, R. & Woerdman, J. Orbital angular momentum of light and the transformation of laguerre-gaussian laser modes. Phys. Rev. A 45, 8185 (1992).
- (4) Coullet, P., Gil, L. & Rocca, F. Optical vortices. Opt. Commun. 73, 403–408 (1989).
- (5) Winzer, P. J. Making spatial multiplexing a reality. Nat. Photon. 8, 345–348 (2014).
- (6) Ren, H. et al. Metasurface orbital angular momentum holography. Nat. Commun. 10, 1–8 (2019).
- (7) Ren, H. et al. Complex-amplitude metasurface-based orbital angular momentum holography in momentum space. Nat. Nanotech. 15, 948–955 (2020).
- (8) Jack, B. et al. Holographic ghost imaging and the violation of a bell inequality. Phys. Rev. Lett. 103, 083602 (2009).
- (9) Wang, J. et al. Terabit free-space data transmission employing orbital angular momentum multiplexing. Nat. Photon. 6, 488–496 (2012).
- (10) Hui, X. et al. Multiplexed millimeter wave communication with dual orbital angular momentum (OAM) mode antennas. Sci. Rep. 5, 1–9 (2015).
- (11) Xie, Z. et al. Integrated (de) multiplexer for orbital angular momentum fiber communication. Photon. Res. 6, 743–749 (2018).
- (12) Willner, A. E. et al. Perspectives on advances in high-capacity, free-space communications using multiplexing of orbital-angular-momentum beams. APL Photon. 6, 030901 (2021).
- (13) Nagali, E. et al. Quantum information transfer from spin to orbital angular momentum of photons. Phys. Rev. Lett. 103, 013601 (2009).
- (14) Romero, J., Giovannini, D., Franke-Arnold, S., Barnett, S. & Padgett, M. Increasing the dimension in high-dimensional two-photon orbital angular momentum entanglement. Phys. Rev. A 86, 012334 (2012).
- (15) Fickler, R. et al. Quantum entanglement of high angular momenta. Science 338, 640–643 (2012).
- (16) Mirhosseini, M. et al. High-dimensional quantum cryptography with twisted light. New J. Phys. 17, 033033 (2015).
- (17) Sit, A. et al. High-dimensional intracity quantum cryptography with structured photons. Optica 4, 1006–1010 (2017).
- (18) Sueda, K., Miyaji, G., Miyanaga, N. & Nakatsuka, M. Laguerre-gaussian beam generated with a multilevel spiral phase plate for high intensity laser pulses. Opt. Express 12, 3548–3553 (2004).
- (19) Bauer, T. et al. Observation of optical polarization möbius strips. Science 347, 964–966 (2015).
- (20) Karimi, E. et al. Generating optical orbital angular momentum at visible wavelengths using a plasmonic metasurface. Light Sci. Appl. 3, e167 (2014).
- (21) Bai, X. et al. High-efficiency transmissive programmable metasurface for multimode oam generation. Adv. Opt. Mater. 8, 2000570 (2020).
- (22) Ji, C., Song, J., Huang, C., Wu, X. & Luo, X. Dual-band vortex beam generation with different oam modes using single-layer metasurface. Opt. Express 27, 34–44 (2019).
- (23) Bahari, B. et al. Photonic quantum hall effect and multiplexed light sources of large orbital angular momenta. Nat. Phys. 17, 700–703 (2021).
- (24) Fickler, R., Campbell, G., Buchler, B., Lam, P. K. & Zeilinger, A. Quantum entanglement of angular momentum states with quantum numbers up to 10,010. Proc. Natl. Acad. Sci. 113, 13642–13647 (2016).
- (25) Yang, H., Xie, Z., He, H., Zhang, Q. & Yuan, X. A perspective on twisted light from on-chip devices. APL Photon. 6, 110901 (2021).
- (26) Matsko, A. B., Savchenkov, A. A., Strekalov, D. & Maleki, L. Whispering gallery resonators for studying orbital angular momentum of a photon. Phys. Rev. Lett. 95, 143904 (2005).
- (27) Cai, X. et al. Integrated compact optical vortex beam emitters. Science 338, 363–366 (2012).
- (28) Vahala, K. J. Optical microcavities. Nature 424, 839–846 (2003).
- (29) Miao, P. et al. Orbital angular momentum microlaser. Science 353, 464–467 (2016).
- (30) Zhang, Z. et al. Tunable topological charge vortex microlaser with ultrafast controllability. Science 763, 760–763 (2020).
- (31) Chen, B. et al. Bright solid-state sources for single photons with orbital angular momentum. Nat. Nanotech. 16, 302–307 (2021).
- (32) Strain, M. J. et al. Fast electrical switching of orbital angular momentum modes using ultra-compact integrated vortex emitters. Nat. Commun. 5, 4856 (2014).
- (33) Lodahl, P., Mahmoodian, S. & Stobbe, S. Interfacing single photons and single quantum dots with photonic nanostructures. Rev. Mod. Phys. 87, 347–400 (2015).
- (34) Forbes, A., de Oliveira, M. & Dennis, M. R. Structured light. Nature Photonics 15, 253–262 (2021).
- (35) Dholakia, K. & Čižmár, T. Shaping the future of manipulation. Nature Photonics 5, 335–342 (2011).
- (36) Zhao, Z. et al. Dynamic spatiotemporal beams that combine two independent and controllable orbital-angular-momenta using multiple optical-frequency-comb lines. Nat. Commun. 11, 1–10 (2020).
- (37) Kippenberg, T. J., Gaeta, A. L., Lipson, M. & Gorodetsky, M. L. Dissipative Kerr solitons in optical microresonators. Science 361, eaan8083 (2018).
- (38) Lu, X., Rogers, S., Jiang, W. C. & Lin, Q. Selective engineering of cavity resonance for frequency matching in optical parametric processes. Appl. Phys. Lett. 105, 151104 (2014).
- (39) Lu, X., Rao, A., Moille, G., Westly, D. A. & Srinivasan, K. Universal frequency engineering for microcavity nonlinear optics: multiple selective mode splitting of whispering-gallery resonances. Photon. Res. 8, 1676–1686 (2020).
- (40) Lu, X., McClung, A. & Srinivasan, K. High-Q slow light and its localization in a photonic crystal microring. Nat. Photon. 16, 66–71 (2022).
- (41) Arbabi, A., Kamali, S. M., Arbabi, E., Griffin, B. G. & Goddard, L. L. Grating integrated single mode microring laser. Opt. Express 23, 5335–5347 (2015).
- (42) Hsu, C. W., Zhen, B., Stone, A. D., Joannopoulos, J. D. & Soljačić, M. Bound states in the continuum. Nat. Rev. Mater. 1, 1–13 (2016).
- (43) Yulaev, A. et al. Exceptional points in lossy media enable decay-free wave propagation. Nat. Nanotech. 17, 583–589 (2022).
- (44) Duan, Y., Chen, K. C., Englund, D. R. & Trusheim, M. E. A vertically-loaded diamond microdisk resonator spin-photon interface. Opt. Express 29, 43082–43090 (2021).
- (45) Strekalov, D. V., Marquardt, C., Matsko, A. B., Schwefel, H. G. L. & Leuchs, G. Nonlinear and quantum optics with whispering gallery resonators. J. Opt, 18, 123002 (2016).
- (46) Balram, K. C. et al. The nanolithography toolbox. J. Res. NIST 121, 464–475 (2016).
Methods
Fabrication method. The stoichiometric layer is grown by low-pressure chemical vapor deposition with a nominal thickness of 500 nm on a layer approximately 3 m thick and grown via thermal wet oxidation of a 100 mm diameter Si wafer. The layer thicknesses, as well as its wavelength-dependent refractive index, was confirmed using spectroscopic ellipsometry, with the index fitted to an extended Sellmeier model. A layer of positive-tone resist (approximately 650 nm in thickness) is spun on top of the layer and exposed by a 100 keV electron-beam lithography system. The device layout is prepared using the Nanolithography Toolbox Balram_JResNIST_2016 , a free software package developed by the Center for Nanoscale Science and Technology at the National Institute of Standards and Technology. The pattern in use has a resolution of 1/8 nm for the in-plane grids, and has an angular resolution of for the inside modulation, where corresponds to the largest number of cell numbers (i.e., smallest period lengths) in use. During the lithography, the minimal grids are further increased to 2 nm due to the shot pitch limitation of the electron beam system in use for a 500 pA electron current. We can observe selective mode splitting down to a nominal modulation amplitude =1/8 nm using this method while maintaining a nearly linear dependence of mode splitting on amplitude. This observation is quite surprising considering the fracturing of the 2 nm shot pitch of the electron beam and its proximity effects, and it requires further study to clarify the underlying mechanism in terms of the actual pattern geometry relative to the designed one. Once the exposed pattern was developed, it was transferred to the using a chemistry by reactive ion etching, with a rate of approximately 30 nm per minute. The remnant resist and deposited polymer during the etching process are chemically cleaned. An SiO2 lift-off process is performed so that the microrings have a top air cladding while the input/output edge-coupler waveguides have a top cladding. Such top and bottom claddings create more symmetric modes for coupling to optical fibers, reducing the fiber-chip facet coupling loss to 2 dB to 3 dB per facet. The oxide lift-off process is based on photolithography, plasma-enhanced chemical vapor deposition of SiO2 with an inductively-coupled plasma source, and the chemical removal of the photoresist. After the lift-off process, the chips are diced and polished, and annealed at 1000 in a environment for 4 hours.
Acknowledgements
The authors acknowledge Jin Liu, Haitan Xu, Zhimin Shi, and Amit Agrawal for helpful discussions. This work is supported by DARPA SAVaNT the NIST-on-a-chip programs, and partly sponsored by the Army Research Office under Cooperative Agreement Number W911NF-21-2-0106. M.W. is supported under the cooperative research agreement award 70NANB10H193, through the University of Maryland, College Park. M. H. acknowledges support from the Villum Foundation (QNET-NODES grant no. 37417).
Supplementary Information
I Coupled-mode Equations
In this section, we give coupled-mode equations linking OAM and SMS, leading to Equation (1) of the main text. First, the coupled mode equations for the clockwise () and counter-clockwise () waves in the resonator can be given by the following:
| (4) | |||||
| (5) |
The field amplitudes are normalized so that and represent the intracavity optical energy. The cavity detuning is given by , where is the angular frequency and is the central frequency of the cavity resonance. Only linear interaction and coupling terms are considered, and all nonlinear interaction terms are not included. We assume these two propagating waves have identical intrinsic loss rate () and microring-waveguide coupling rate (). In the selective mode splitting (SMS) case, the backscattering induced by the photonic crystal structures () can always be set to a real parameter, which is equivalent to defining the relevant phases of two travelling waves by the imprinted modulation pattern. The last terms are source terms, and and represent the clockwise and counter-clockwise input powers in the waveguide. This interaction ends up renormalizing two propagating waves into two standing waves, , given by:
| (6) |
Here have the same cavity linewidth of , with the central resonance frequencies at , respectively. The source term follows a similar definition of .
From previous SMS works lu2014selective ; lu2020universal , can be calculated for an optical mode with shifting boundaries Johnson_PRE_2002 ,
| (7) |
where () and () are the electric field components (displacement field components) of the unperturbed optical mode that are parallel () and perpendicular () to the modulation boundary , respectively. represents the dielectric function of the material, including the dielectric core () and the substrate () or cladding material (). Considering a photonic crystal microring with a fixed outer radius but modulated ring width of , the standing-wave mode with a larger frequency has a dominant displacement field . Equation (7) can be written as:
| (8) |
This integral does not contain polar angle (), assuming the dominant electric field is in the radial direction and the sidewall of the modulation is straight. The azimuthal part can be integrated separately, so that:
| (9) |
where when and vanishes otherwise. is defined as:
| (10) |
While we derive the Eqs. (7-10) considering the shifting boundary for two standing-wave modes, this same parameter () is also the interaction term for two propagating waves described in Eqs. (4-5). In particular, Eq. (9) can be viewed as the interaction of clockwise () and counter-clockwise () modes with the grating of () cells. The phase in the terms are set to zero here, which yields the maximal interaction/coupling rates, as the modes typically tend to maximize or minimize their energy. However, in specific cases the phase can be shifted, with one example being the phase shift for the bound standing-wave state at OAM, as discussed in the main text.
In the OAM cases, for the travelling wave modes, the coupled mode equations are given by:
| (11) | |||||
| (12) |
There are no coupling of the clockwise and counter-clockwise modes induced by the grating. Instead, the grating introduces couplings from the WGM of azimuthal order to an ejected free-space OAM mode for (and to ), and is the scattering rate. For the standing-wave modes, either by accidental mode splitting created by the random sidewall roughness Weiss_OL_1995 , or another added grating for SMS, as demonstrated in the last section in the main text, the equation is given by:
| (13) |
Here the term represents the scattering rate from a standing wave mode with to OAM modes with (consisting of equally).
From Johnson et al.’s theory Johnson_PRE_2002 , the calculation of the coupling of two modes is identical to the energy shift to one mode itself. The SMS is a perfect example in that can be considered as either the interaction of two travelling-wave modes, or the energy shift of a standing-wave mode from the modulated boundary. The OAM case is similar but more subtle: one can consider the OAM and WGM as being two modes, as the OAM is a radiating mode and the WGM is a confined mode. Yet, it is also not wrong to consider OAM and WGM to be two parts of the same mode in a broader definition, for the reason that the OAM mode is directly ejected out of the WGM mode, and they have the same mode profile before ejection (identical in polarization, linewidth, coupling, etc.). In both cases, if we follow Johnson et al.’s theory in a similar fashion, we have in the following:
| (14) |
The only difference between Eq. 14 and Eq. 7 is instead of (in both cases we assume that is much smaller than the perpendicular field components). This term can be estimated from by considering three factors: (1) considering the ejected field has the same cross-sectional mode profile in the microring but without a cavity enhancement, we have since is defined in terms of energy (hence the square root) and phase (hence the ); (2) since we are considering transverse-electric-like WGMs whose dominant field components are in the radial direction, we have , as illustrated in SI Fig. 1(a,b); and (3) the perpendicular projection can be estimated by the nominal ejection angle of the OAM beam from angular momentum conservation, as discussed in the main text, that is, and , as illustrated in SI Fig. 1(c). Considering these three factors, Eq. 14 can thus be written as
| (15) |
Here an additional term of is added in, considering that the emitted OAM light can be either upwards or downwards, which carries an additional factor of 2 compared to backward scattering in the SMS case. The value of this is validated in the experiments in the main text as a general trend, but its relationship to the light cone (and asymmetric cladding) requires further investigation. The azimuthal integral can be separated and yields similar results when , so that Eq. 15 can be reduced to:
| (16) |
Considering the role of in Eqs. (11-13), we have Eq. (1) in the main text,
| (17) |
Though we are considering standing-wave fields here as examples, the ejection rate () is the same for travelling waves, similar to the coupling rate () that is used both in standing-wave and traveling-wave cases for SMS. Also, while our derivation is for transverse-electric-like fields, transverse-magnetic-like fields have the same results of Eq. 17, though the major contribution of and is contributed from the parallel field components.
II Simulation Method
In this section, we discuss the method to simulate the mid-field and far-field images used in the main text. We employ finite-difference-time-domain (FDTD) simulations using the commercially available software Lumerical NIST_disclaimer . To reduce the required simulation resources, we consider smaller ring radii of 5 m and 12m as well as a modulation amplitude of nm. We consider devices in three geometries. The first device, shown in SI Fig. 2(a), consists of an isolated ring with air cladding on the top and bottom. The second device in SI Fig. 2(b) has an additional bus waveguide below the ring and a 3 m thick SiO2 bottom cladding. The third device in SI Fig. 2(c) has a bus waveguide below the ring, SiO2 bottom cladding, and a Si substrate. The bus waveguide is 750 nm wide and separated from the ring by a gap of 350 nm. We use the refractive indices of , , and . The grid-spacing used is 30 nm in all three directions (note that we use Lumerical’s ability to automatically set a coarser grid away from the ring).
SI Figure 2(a) shows an example of the isolated ring with , which results in a resonant mode at nm with , corresponding to . The modes are excited using 10 dipole sources evenly distributed over one period of the waveguide modulation inside the ring. Several dipoles are used to ensure that all longitudinal modes are excited. The mid-field profile plotted in SI Fig. 2(a) is calculated as a running Fourier transform of the time-dependent field amplitude, , in the plane at . Note that Lumerical offers a setting to multiply the field amplitude by a ramping-function that eliminates any contribution from the sources. The dipole sources excite both clockwise and counterclockwise modes and the resulting mode shows an interference pattern between the two. The number of anti-nodes in is therefore . In the mid-field images, and are plotted in a plane 1m above the waveguide surface, and in the far-field images, and of the far field are calculated using Lumerical’s built-in far field transformation routine. It is the field recorded 1 m above the waveguide surface that is used in the transformation. Besides dipole excitation, standing-wave WGMs can be created by SMS (as described in the main text), random sidewall backscattering from the microring, and the chip facet reflection. The latter two typically lead to partial reflection instead of an equal contribution of clockwise and counter-clockwise modes, and will lead to more blurry (i.e., less visible) interference patterns.
SI Figure 2(b, c) shows mode profiles of structures including a bus waveguide with symmetric air cladding and with SiO2 bottom cladding. SI Figure 2(c) also has a Si substrate underneath the SiO2 bottom cladding. For both structures, the source of the FDTD simulation is an eigenmode of the bus waveguide propagating from left to right and exciting only the counterclockwise ring mode. The mode profiles are again only monitored at times after the source has died out and the fact that only the counterclockwise mode is excited is verified by light only leaking out to the right in the bus waveguide. We can clearly see that, with such travelling-wave excitation, the field does not show beating patterns in either mid-field or far-field . In other words, the phase is varied by , but in intensity it is uniform.
In particular, SI Fig. 2(c) suggests that the substrate reflection, that is, at the SiO2/Si interface, cannot be used to explain the observed 2 beating pattern, in contrast to the facet reflection as shown in SI Fig. 2(a). Because of the symmetry, the device in simulation has for the upward OAM (into air) and for the downward OAM (into SiO2). The light is reflected at the SiO2/Si interface to . Such reflected light with can shift the phase of the original light, but cannot create a beating pattern in intensity.
III Extracting and from transmission spectra.
We show here examples of extracting and from representative transmission spectra for selective mode splitting (SMS) and orbital angular momentum (OAM) devices, more specifically, six devices with = -165, -60 and = 4, 8, 16 nm in Fig. 3(c) in the main text. In SI Fig. 3(a-c), SMS devices show increased mode splitting in the targeted mode when increases, but the overall optical quality factor () is not strongly affected (i.e., remains within a common range of values determined by the uncertainties in the nonlinear least squares fits to the transmission data). In SI Fig. 3(d-f), OAM devices have decreased and broader linewidths (, which is used throughout the main text) when increases. The cavity transmission becomes under-coupled (shallow in dip) from the perspective of waveguide coupling, as the microring waveguide coupling rate () stays the same while the OAM ejection rate () increases.
IV Comparing OAM devices with and without SMS.
We compare OAM devices with and without SMS for = 1 to 3 in SI Fig. 4 . The OAM device without SMS has worse visibility in intensity beating, as the counter-clockwise WGM is likely from the back reflection of the pump laser, either from the chip facet or from the microring, and is thus much smaller in amplitude than the clockwise WGM. The method of implementing SMS and OAM has been discussed in the main text. The OAM device with SMS has standing-wave WGMs (equal clockwise and counter-clockwise WGMs) and hence nearly equal and OAM, resulting in more pronounced interference patterns.
References
- (1) Lu, X., Rogers, S., Jiang, W. C. & Lin, Q. Selective engineering of cavity resonance for frequency matching in optical parametric processes. Appl. Phys. Lett. 105, 151104 (2014).
- (2) Lu, X., Rao, A., Moille, G., Westly, D. A. & Srinivasan, K. Universal frequency engineering for microcavity nonlinear optics: multiple selective mode splitting of whispering-gallery resonances. Photon. Res. 8, 1676–1686 (2020).
- (3) Johnson, S. G. et al. Perturbation theory for Maxwell’s equations with shifting material boundaries. Phys. Rev. E 65, 066611 (2002).
- (4) Weiss, D. S. et al. Splitting of high-Q Mie modes induced by light backscattering in silica microspheres. Opt. Lett. 20, 1835–1837 (1995).
- (5) Certain commercial products or names are identified to foster understanding. Such identification does not constitute recommendation or endorsement by the National Institute of Standards and Technology, nor is it intended to imply that the products or names identified are necessarily the best available for the purpose.