Imputation Strategies Under Clinical Presence: Impact on Algorithmic Fairness
Abstract
Machine learning risks reinforcing biases present in data, and, as we argue in this work, in what is absent from data. In healthcare, biases have marked medical history, leading to unequal care affecting marginalised groups. Patterns in missing data often reflect these group discrepancies, but the algorithmic fairness implications of group-specific missingness are not well understood. Despite its potential impact, imputation is often an overlooked preprocessing step, with attention placed on the reduction of reconstruction error and overall performance, ignoring how imputation can affect groups differently. Our work studies how imputation choices affect reconstruction errors across groups and algorithmic fairness properties of downstream predictions. First, we provide a structured view of the relationship between clinical presence mechanisms and group-specific missingness patterns. Then, we theoretically demonstrate that the optimal choice between two common imputation strategies is under-determined, both in terms of group-specific imputation quality and of the gap in quality across groups. Particularly, the use of group-specific imputation strategies may counter-intuitively reduce data quality for marginalised group. We complement these theoretical results with simulations and real-world empirical evidence showing that imputation choices influence group-specific data quality and downstream algorithmic fairness, and that no imputation strategy consistently reduces group disparities in reconstruction error or predictions. Importantly, our results show that current practices may be detrimental to health equity as similarly performing imputation strategies at the population level can affect marginalised groups differently. Finally, we propose recommendations for mitigating inequities that may stem from an overlooked step of the machine learning pipeline.
1 Introduction
Healthcare is increasingly leveraging machine learning to improve patient care. This often occurs through machine learning models for risk prediction, prioritisation, or even treatment response modelling. These machine learning models typically rely on observational data. The data generation process that shapes this data involves a complex interaction between patients and the healthcare system, which is referred to as clinical presence [1]. Each observation, from orders of laboratory tests to treatment decisions, depends on access to medical care, patients’ medical states, and practitioners’ expert decisions. As a result, the collected medical records suffer from missing observations [2]. We refer to the missingness that stems from these clinical interactions as clinical missingness.
Clinical missingness is widespread in medical observational data [3, 4, 5]. Medical records reflect and inform treatment, and are not primarily gathered for scientific discovery and analysis. The prevalence of missing data is an issue because statistical analysis and machine learning often require complete data. Practitioners, therefore, routinely rely on preprocessing strategies, such as imputation, to address missingness in their medical datasets. However, the importance of this step is often overlooked. In their literature review, [6] note that 65% of machine learning papers on clinical applications mention the problem of missingness, but less than 10% report their assumptions on missing data, and only 24% analyse how their choice of handling missing data impacts their conclusions.
Overlooking clinical missingness may have consequential repercussions on algorithmic fairness — a novel point that we raise and investigate in this paper. This algorithmic fairness connection arises because clinical missingness patterns are often group-specific. In other words, the patterns and causes of missing data can vary between different population subgroups. Group-specific patterns of missingness are particularly notable in medical datasets. They can occur due to historical healthcare biases or disparities, which subsequently influence healthcare access, treatment, and outcomes [7, 8, 9, 10, 11]. For instance, limited access to healthcare resources can translate into group disparities in available testing procedures. Additionally, medical guidelines and practice can also reinforce existing group inequalities by focusing primarily on populations considered high-risk. Consequently, these differences in medical interactions translate into group-specific missingness in testing and examination data. For instance, this is evidenced by [12], who show increased missingness in Black patients’ family history records.
In making the connection between clinical missingness and algorithmic fairness, we raise a novel concern: in the presence of these group-specific missingness patterns, data imputation strategies can have different effects across groups, potentially resulting in significant algorithmic fairness impacts in machine learning pipelines. For example, an imputation technique may harm the downstream prediction performance for one group more than another.
The impact of the imputation step on algorithmic fairness has received limited attention in the literature. Our work is the first to investigate the link between clinical missingness and algorithmic fairness through three key contributions:
-
1.
We mathematically characterise three different mechanisms through which disparities in the healthcare system may result in different types of clinical missingness. We justify their relevance through medical evidence. Using their causal representations, we show how these mechanisms can translate into group-specific missingness patterns.
-
2.
We show that group-specific imputation — a common imputation practice — can be counter-intuitively detrimental to group fairness and harmful to a marginalised group (relative to non-group-specific imputation). This holds when considering either imputation reconstruction error or downstream predictive performance. We empirically show that this can occur under a variety of missingness patterns via simulation studies, and provide real-world evidence of this phenomenon in the widely used medical dataset MIMIC III.
-
3.
We prove mathematically that, given an observed dataset, the appropriate choice of imputation between two frequently used approaches is under-determined. The superiority of an imputation strategy in data quality and group fairness gap depends upon the unobserved missingness process. A priori identification of the imputation strategy that would reduce the gap in reconstruction errors depends on the knowledge of this missingness process, i.e., no imputation strategy can be deemed superior for reducing downstream group fairness gaps.
This work contributes a critical managerial conclusion: while current imputation practices focus on improving the overall quality of the data available for modelling, they can also affect algorithmic fairness. Current recommendations for imputation often focus on reducing reconstruction errors under assumed simple missingness mechanisms; these simple missingness assumptions, however, are not adapted to the reality of clinical missingness. The absence of a theoretical understanding of fairness risks associated with imputation strategies has led practitioners to rely on intuition when handling missing data. As a result, current recommendations may have detrimental effects on algorithmic fairness. For example, studies often use a single strategy with all likely confounders included to ensure the plausibility of the missingness assumptions [13, 14]. Because group missingness differences are a concern, imputation strategies frequently control for or stratify by group membership, as in [15], using group-specific mean imputation. The rationale is to improve subgroups’ reconstruction errors. However, in our second major contribution noted above, our research demonstrates that such group-specific imputation can actually have harmful effects on downstream algorithmic fairness. Additionally, we show that reliance on a single strategy without further consideration of alternative imputation strategies can be misleading. A sensitivity comparison between imputation strategies can reveal meaningfully different group fairness outcomes.
Our results call for careful consideration of missingness assumptions and imputation. Exploring the upstream missingness process should guide the selection of appropriate assumptions and, accordingly, imputation strategies. When missingness processes are unobserved (a frequent occurrence), practitioners should report and justify the assumptions made on the missingness process, and acknowledge the associated consequences on their analysis’ conclusions. In particular, when dealing with covariates with missing data, reconstruction error cannot typically be measured because the missing data is unknown, but prediction performance can be evaluated. Evaluating different imputation strategies on downstream fairness prediction outcomes is paramount because different imputation strategies can result in distinct performance gaps between groups. In some cases, the choice of imputation can even reverse fairness outcomes: where one imputation strategy results in a favourable performance gap for a marginalised group relative to the majority, another imputation strategy that yields similar overall predictive performance results in a harmful performance gap for that same marginalised group.
To reach these conclusions, we first present in Section 2 the literature associated with missingness, fairness, and their intersection. Then, we introduce and formalise clinical missingness scenarios, their origins, and resulting group-specific patterns in Section 3. Section 4 theoretically proves how imputation strategies present different reconstruction fairness gaps under different patterns of clinical missingness. Through simulations, Section 5 empirically ascertains these results both at the level of reconstruction error and downstream performance. Finally, Section 6 demonstrates how real-world study conclusions could be impacted under different imputation strategies in the widely used MIMIC III dataset.
2 Related work
This work explores the link between missingness and algorithmic fairness in machine learning for healthcare. In this section, we review related literature across domains.
2.1 Clinical missingness
Missingness naturally occurs in medical studies in which information is recorded for clinical decision-making [13]. Missing data may therefore present informative patterns. Current clinical understanding of missingness relies on the three well-studied patterns [16]: Missing Completely At Random (MCAR) — random subsets of patients and/or covariates are missing; Missing At Random (MAR) — missing data patterns are a function of observed variables; and Missing Not At Random (MNAR) — missing patterns depend on unobserved variables or on the missing values themselves. However, current missingness formalisations often ignore group-specific patterns of observation. Our work provides a finer formalisation of missingness in the medical context by taking into account membership to marginalised groups, and characterising how clinical presence may result in group-specific missingness patterns.
Missing data prohibits the use of traditional statistical models that require complete data. Ignoring patients with missing data, also known as complete case analysis, lowers statistical power [17]. Thus, practitioners often replace missing data, selecting from a wide range of available imputation strategies. These include single imputation strategies, which replace missing data with a single value such as mean, median, or nearest neighbour value [18, 19], or multiple imputation strategies, which propose multiple possible values for each missing one [20, 21, 22] as a way to quantify the uncertainty associated with the missingness process. Typically, both types of imputation strategies assume MCAR and/or MAR patterns, and all associated theoretical guarantees depend on these assumptions.
Common imputation strategies may be ill-adapted to handle clinical missingness reflective of more complex patterns. Especially, MNAR and MAR are non-identifiable from observational data alone and require knowledge of the missingness process and domain expertise for adequate modelling [23]. The recommended strategy to tackle this non-identifiability issue is to control the imputation strategy on additional covariates to render these simplifying assumptions more plausible [13]. Our work shows potential shortcomings of this covariate-adjusted imputation strategy under clinical missingness patterns, providing theoretical and empirical evidence showing that this strategy may backfire when controlling or stratifying on group membership.
Previous literature has studied the consequences of making incorrect assumptions about the missingness process, with a focus on inference and how this may bias estimates of the parameters of interest, e.g. treatment effect or odds ratios [24]. Current recommendations to mitigate this risk call for exploring the estimates’ robustness under different assumptions by performing sensitivity analysis [25, 26]. Our work demonstrates that missingness patterns and their handling do not only statistically bias estimates. We show that this may have a differential impact across groups’ data quality and predictive performance, and may affect algorithmic fairness. Further, we show that sensitivity analysis should also be performed to assess the robustness of fairness conclusions to the choice of imputation.
2.2 Algorithmic fairness in medicine
Historically, medical research and practice have been marked by biases against marginalised groups [27, 28]. For instance, risk score development on populations with low ethnic diversity detrimentally impacts risk management for minority groups, as demonstrated by the risk miscalibration for Black patients potentially explained by their under-representation in risk score development [27]. Our work is grounded on a detailed characterisation of the different ways in which such disparities may shape missing data and models trained on it.
Machine learning pipelines have the risk of reinforcing biases present in the data [29], and, as we argue in this paper, in what is absent from the data. Measuring and mitigating the risk of inequitable real-world deployment is the aim of algorithmic fairness. Given that reinforcing biases is of critical concern in medicine, where data marked by inequalities can influence life-threatening decisions, algorithmic fairness has become a central concern in machine learning for healthcare [30].
When quantifying algorithmic fairness, three families of definitions emerge from the multiple definitions proposed in the literature [31, 32]. Individual fairness [33] deems an algorithm fair if similar individuals (according to a relevant metric) are treated similarly. Causal fairness deems an algorithm fair if the prediction would remain unchanged if an individual’s group membership changed [34], or if group membership does not affect the prediction through inadmissible pathways [35]. Group fairness defines fairness in terms of equal performance across groups, where the performance metric of interest may vary [36, 37]. Individual fairness requires access to a relevant, task-specific, distance metric to assess who is “similar”, and notions of causal fairness require knowledge of the causal graph between all covariates and target labels. In practice, it is rare to have access to such distance metrics or causal graphs. As a result, group fairness definitions are the most widely used in practice.
In healthcare, [38] proposes to quantify group fairness as the difference in (i) observed outcomes, (ii) model performance or (iii) care allocation. In this paper, we focus on model performance, and in particular the “equal performance” definition of algorithmic fairness [38]. This definition evaluates if the model performs comparably across groups [39, 40, 41] by comparing group-level metrics, for relevant metrics of interest. This definition has been used to quantify if marginalised groups would be impacted differently by medical models’ deployment [42, 43, 44, 45, 46]. For instance, [45] demonstrates X-ray classifiers’ performance gap between groups, and highlights the detrimental misdiagnosis for marginalised groups if the models were deployed.
2.3 Algorithmic fairness and missingness
A central thrust of research on algorithmic fairness has focused on developing methods to mitigate disparities, such as resampling [47], loss regularisation [48] or post-processing adjustment [36]. Such approaches, however, largely assume that data is complete. Furthermore, characterisations of sources of algorithmic bias [31, 29, 49] rarely focus on the potential impact of missing data.
An emerging body of research has begun to study the interplay between algorithmic fairness and missing data. On the statistical side, [50, 51] show that mean imputation presents better group fairness properties compared to complete case analysis. [52] explore how perturbing medical events’ frequency from observational data negatively impacts group-specific predictive performance. [53] propose a group-specific weighting adjusting each observation’s weight as a function of the group’s observation rate to improve the ratio of positive outcomes between groups. On the medical side, [54] encourages the use of clinical decision support systems to improve data collection as unfair medical decisions can emerge from missing standardised testing in marginalised groups.
Closer to our work, [55, 56] show that the choice of imputation may lead to distinct gaps in performance through simulations. However, these works do not discuss how the different missingness patterns may arise in medicine nor how a specific group may be impacted differently by different imputation strategies. In the portion of our work that focuses on simulations, we study different missingness patterns that may arise as a result of the data-generating process in healthcare. Furthermore, we study the impact of different imputation strategies through a theoretical lens, and empirically show the effects that imputation strategies may have using real-world data.
Recently, [57] study the risks of relying on imputed data. The authors demonstrate (i) the non-conformality of imputation strategies, i.e., the optimal imputation strategy depends on the downstream task; and (ii) the potential statistical bias associated with imputation under MCAR patterns. Our work identifies non-random patterns of missingness and theoretically explores imputation biases beyond MCAR patterns. Importantly, we also show that the optimal strategy depends not only on the downstream task but on the data distribution and missingness patterns.
Finally, at the intersection of algorithmic fairness, missingness, and machine learning for health, [58, 59, 60, 61, 38] describe multiple challenges linked to medical data, among which they state that historical biases may lead to missingness patterns that could impact fairness, but they do not empirically study this. While informative missingness has recently received revived attention [1, 61], no work has studied its potential association with fairness and provided the theoretical framework to understand and handle group-specific patterns. Our work aims to address these gaps in the literature by characterising different types of group-specific missingness patterns in medicine, theoretically analysing the impact of imputation strategies on algorithmic fairness, and exploring the impact of different imputation strategies under different clinical presence scenarios.
3 Clinical missingness
The central motivation of this paper is that the underlying — often unobserved — missingness process can reflect disparities and, therefore have large, unanticipated impacts on group-specific performance that are not well understood. To better understand the implications of different forms of clinical missingness and their implications, we review the literature for historical examples of missingness processes. We then provide a formalisation of the identified types of missingness based on their causal structure, highlighting their group-specific nature.
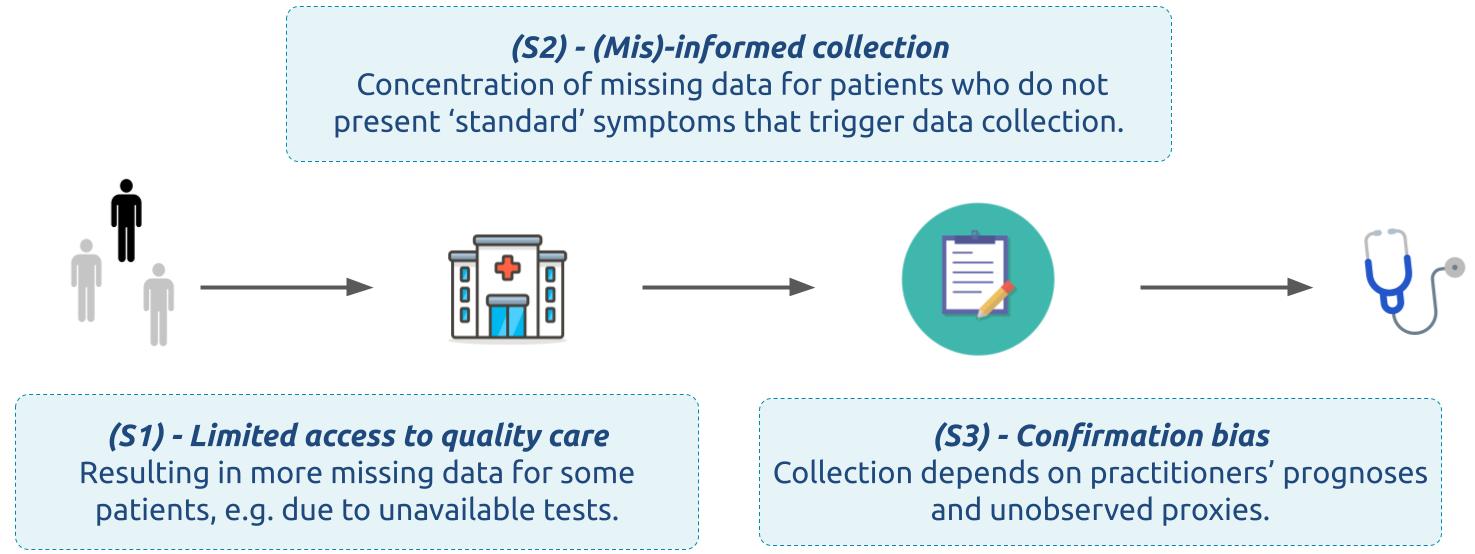
In this review, we distinguish three forms of missingness processes (illustrated in Figure 1):
-
(S1)
Limited access to quality care. If and when certain groups do not have access to the same health services and quality care as others, this may result in more missing covariates for disadvantaged groups.
-
(S2)
(Mis)-informed collection. Often, medical research has focused on a subset of the population. The resulting guidelines may be ill-adapted to other groups, and relevant covariates may be missing due to standard recommendations of when to collect certain information.
-
(S3)
Confirmation bias. The collection of certain types of data depends on practitioners’ prognoses and informative proxies that are not recorded. These prognoses may be affected by group-specific expectations.
These scenarios have substantial medical evidence, which we summarise in Section 3.1. Furthermore, these three scenarios are mathematically distinct, as shown by the formalisation in Section 3.2.
3.1 Clinical evidence
Multiple studies in the medical literature provide evidence of different pathways through which the data-generating process may result in group-specific missingness patterns. We provide a succinct, structured review of the literature, taxonomized into the three distinct types of clinical missingness defined above.
Historical evidence of limited access to quality care.
Socioeconomic factors impact access to care and, consequently, missingness. For instance, education [62], urban residence [62], insurance [63], distance to hospitals [62] or mobility [64] have been shown to impact patients’ interactions with the healthcare system. These differences in medical interactions may translate into inconsistent medical history [60], and limited access to advanced diagnostic tools [65], and may also impact behaviours such as additional waiting time before seeking care [66], and avoidance of preventive care [67]. Such reduced access to care for some subgroups of the population can result in missingness. For instance, the lack of medical history is in itself a problem of missing data. Avoidance or lack of access to care may translate into less frequent checkup data, and, therefore, a sparse record of patients’ health evolution. Finally, limited access to more advanced diagnostic tools leads to absent tests in medical records.
Historical evidence of (mis)-informed collection.
Historically, studies focused on perceived highest-risk groups and were constrained by the available and willing-to-participate patient population: breast cancer has been predominantly studied in women [68, 69], cardiovascular disease in men [70], skin cancers in whiter skins [71], and autism in men [72]. Resultant medical practices and guidelines target these groups. However, substantial evidence shows the prevalence of these conditions among a more diverse population: men experience 1% of breast cancers [73], 1 out of 3 women dies from cardiovascular disease [74], neoplasm can be cancerous in non-white populations, and autism has an estimated male-female ratio of 4.2:1 [75]. Stemming from social constructs and biological differences, distinct groups may present and express different symptoms for the same condition. [76] shows how biological sex influences condition manifestation through genetics and how the associated social construct of gender has epigenetic effects across a large set of cardiac conditions. The misalignment between condition manifestation in these groups and existing tests and guidelines can result in missing covariates necessary to identify the condition. Testing recommendations may only be prescribed conditioned on the observation of “standard” symptoms. If the symptoms considered do not include frequent symptoms for a marginalised subgroup, this will result in more missing tests for this group. For instance, women with heart failure may experience fatigue while men are more likely to report chest pain [77]. As guidelines have focused on male patients [78], this difference in the expressed symptoms may not trigger further testing for women, as suggested by the difference in echocardiography between men and women [78].
Historical evidence of confirmation bias.
Practitioners may perform or record a test only if they suspect that it will be informative. This phenomenon has been evidenced in the literature showing that the presence of tests in medical records is more closely related to the outcome than the actual test results [79, 80]. [81] also suggest that missing laboratory tests correspond to healthy results. Conversely, [82, 2, 83] show that sicker patients present more complete data. Under this data-generating mechanism, the way a condition affects different groups may result in group-specific testing patterns. For instance, general practitioners are more likely to record weights for underweight or overweight patients [84]. However, weights’ distribution may differ depending on socio-economic characteristics [84] and, consequently, result in group-specific patterns of observation.
3.2 Formalisation
Each of the three scenarios above has different dependence structures between the observation processes and the resulting data. Formalisation and causal representation of these links permit further understanding of their dissimilarities, group-specific nature, and relation to standard patterns of missingness.
Consider a set of covariates influenced by the underlying condition and the group membership . Following the notations from [85], let be the indicator of observation of such that the observed value is defined as:
We formalise the proposed scenarios in the bi-dimensional case: is the concatenation of two covariates (, ). One covariate is always observed, while is potentially missing. Following these notations, Figure 2 displays the directed acyclic graphs (DAGs) associated with each scenario. Each DAG shows the dependencies between missingness, group membership, covariates, and outcome. Note that this formalisation generalises when and are sets of covariates, but would not capture the potential dependencies between two partially missing covariates that could occur with more covariates.
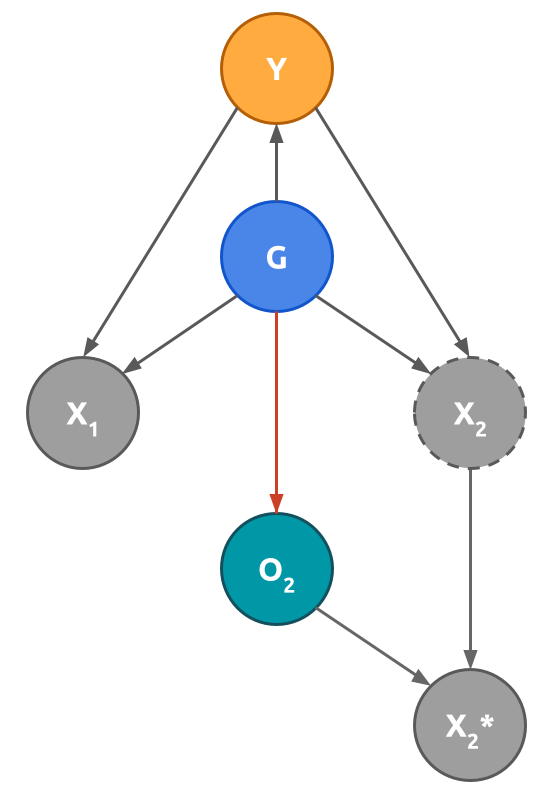
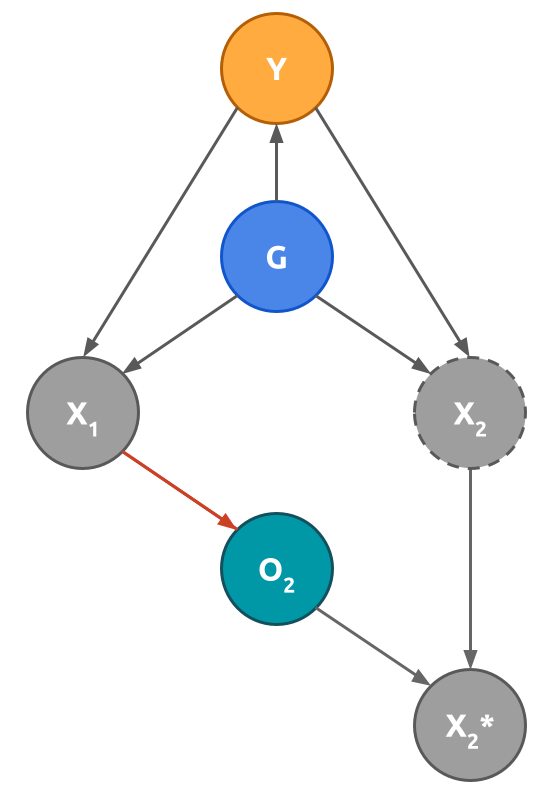
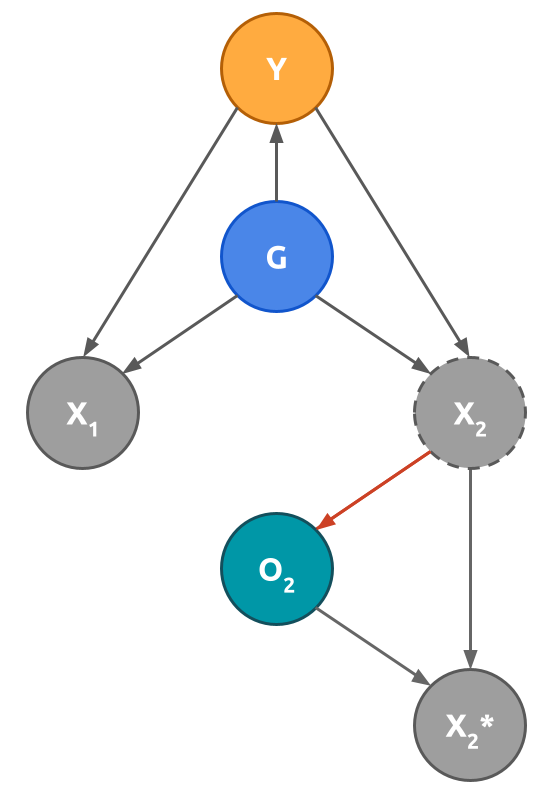
The DAGs in Figure 2 highlight similarities and differences between the three scenarios. We assume the same dependence between group membership, condition, and covariates across the three scenarios. The condition prevalence, i.e., how often a patient may present the condition , may depend on directly or through different mediators — merged with for clarity. The condition manifestation, i.e., how the condition impacts covariates, may also depend on , hence the connections both between and , and and . As an example of these two distinct mechanisms, women and men present a similar risk of heart failure [86],— a similar condition prevalence. However, women express different symptoms than men with, for instance, more frequent symptoms of fatigue for women and chest pain for men [77] — different condition manifestations.
The DAGs also underline key differences in the missingness structure. In (S1), different groups have unequal access to care, thus the group membership informs the missingness process because of differences in socioeconomic factors. Meanwhile, the influence of medical covariates on the missingness patterns characterises both (S2) and (S3). In (S2), guidelines for measuring may depend on other observed covariates, whereas in (S3), measuring depends on the missing value itself — or unobservable covariates correlated with it. For instance, (S2) may consist of a guideline recommending to measure if is within a given range. (S3) differs as practitioners would measure only if this same covariate is expected to be in a given range.
Importantly, these representations highlight the connection between clinical missingness and group-specific patterns. Even under no direct dependence of the missingness process on group membership, there exist indirect pathways between and through condition manifestation and prevalence. Missingness processes with dependencies on any of the covariates would, therefore, present group-specific patterns of missingness.
This formalisation further embeds group-specific patterns in the traditional missingness framework: Missing Completely At Random (MCAR), Missing At Random (MAR) and Missing Not At Random (MNAR). Assuming observation of group membership and no unobserved confounders, (S1) and (S2) are sub-types of MAR patterns as missingness only depends on observed covariates. (S1) corresponds to what has been identified in the literature as group-specific MCAR pattern [57], in which each group-specific missingness process is independent of any other covariate, i.e., MCAR, given the group membership. (S3) corresponds to MNAR in which the dependence is on the missing covariate itself. Considering group membership highlights clinically relevant missingness subpatterns of the traditional framework.
4 Theoretical analysis of imputation and group fairness
Section 3 shows that different types of clinical presence can lead to different missingness patterns. This section demonstrates why the properties of the missingness process matter. Specifically, we theoretically analyse the relationship between missingness patterns, imputation methodology, and group-fairness of the reconstruction error. We do so by focusing on two commonly used imputation strategies that are amenable to tractable analyses.
In the literature, the choice of imputation is guided by improving expected reconstruction quality, i.e., reducing the expected reconstruction error between the imputed value and ground truth. Yet, this expected reconstruction quality depends on the missingness process, and thus cannot be assessed in practice. The complexity in identifying the appropriate missingness assumptions and, therefore, optimal imputation for a given problem has led practitioners to often use simple imputation strategies such as mean imputation [6] — in which missing values are imputed with the mean of the observed data. However, while mean imputation is easy to implement, this strategy assumes (i) a MCAR process and (ii) a homogeneous population. Because these assumptions are unlikely to hold, intuition often leads researchers and practitioners to use mean imputation in subgroups of the population, as this is expected to better capture heterogeneity and improve reconstruction quality for subgroups. This group-specific mean imputation is a common imputation strategy [87, 88, 89], also used when fairness is a primary consideration [15]. Under this approach, each missing value is imputed with the mean values of the subgroup to which the missing datapoint belongs.
Motivated by these practices, we analyse group-specific mean imputation and compare it with population mean imputation. We first show how the reconstruction error under different imputation strategies can be expressed in terms of the properties of the data and of the missingness process. A direct implication of this result is that, given an observed dataset, the problem of choosing the imputation strategy that reduces the fairness gap in reconstruction error is under-determined. We then show that under a substantial set of missingness patterns, group-specific mean imputation can actually hurt group fairness in reconstruction quality, compared with population mean imputation. In other words, stratifying by group membership can counter-intuitively deteriorate the reconstruction quality in the marginalised group that one aims to protect (Theorem 4.2) and increase the gap in reconstruction error between groups (Theorem 4.3). This is a novel finding that results from expressing the reconstruction error as a function of group-specific properties of the missingness process. We empirically study this in Section 5 and Section 6, and further show that this same phenomenon also occurs when the performance of imputation strategies is measured in terms of downstream prediction performance.
4.1 Problem setting
Population mean imputation replaces any missing value in a covariate with that covariate’s mean, observed at the population level. The group-specific extension of this strategy replaces each missing value with the mean computed in the group the datapoint belongs to. Formally, population mean imputation and group-specific mean imputation associate the imputed value to the point as follows:
where is the observed population mean, , and is the observed group specific mean, . are the indices of -members, with indicating if point is observed and indicating group membership. Note that dimensions are omitted in this notation as these imputation strategies treat each covariate independently.
Given any group , we consider two metrics of interest proposed in [57]. First is the reconstruction error for group under imputation strategy , . Second is the reconstruction error gap between this group’s error and the error in the rest of the population, . Formally, these quantities are defined as follows:
Definition 4.1 (Reconstruction error).
The reconstruction error of an imputation in a group is the average distance between the underlying true and imputed values over all missing data for that group:
| (1) |
An optimal imputation strategy assigns the true value to any missing value, resulting in .
To quantify algorithmic fairness, [57] adapts the equal performance definition [38] to the imputation context:
Definition 4.2 (Equal Performance).
An imputation is fairer than another with regard to group if its absolute performance gap is the smaller, i.e. , where for some performance metric , and the associated covariates and group for patient .
Connecting this measure of algorithmic fairness with reconstruction error leads to the measure of the reconstruction error gap, defined by the difference in a group’s reconstruction error compared with the rest of the population:
Under this definition, imputation is considered fairer than another if its reconstruction gap is smaller, i.e., . A null gap reflects equal error across groups. If , then this means group has a larger reconstruction error than the rest of the population, a group fairness concern. Throughout our analysis, we compare the reconstruction errors of each group under different strategies, as well as the resulting performance gaps.
4.2 Relationship between missingness patterns and imputation strategies
Equipped with the two key metrics of group’s reconstruction error and group’s reconstruction gap , we now investigate the impacts of the imputation strategy and the missingness process on these measures of algorithmic fairness. In Theorem 4.1, we express each reconstruction error, and , as a function of (i) the underlying distribution of the covariate, and (ii) the missingness process. The missingness process is measured through , the observation rate, and , the correlation between observation indicators and the covariate values. For the same observed data, the studied imputation strategies can result in largely different reconstruction errors because of the missingness process and the influence of the underlying distribution. Detailed proof of the theorem is provided in Appendix A, Proof A.1.
Theorem 4.1 (Group and population mean imputations’ reconstruction error).
Assuming i.i.d. data points , one can express the reconstruction error in group resulting from group mean imputation as:
| (2) |
where the missingness process is represented through (i) , the unobserved correlation between the observation indicator and the ground truth covariate values, and (ii) , the observation rate in group , which is observable. Other values impacting the reconstruction error are reflective of the underlying covariate distribution. This includes , the ground truth variance of the covariate in the group ; and , the variance of the unobserved values of this same group.
Under the same assumptions, one can compute the reconstruction error in a group using population mean imputation as a function of the previously-defined quantity :
| (3) |
Intuition.
These reconstruction error expressions highlight that (i) reconstruction errors are functions of the missingness process and the data distribution, (ii) population mean reconstruction error is a function of group mean reconstruction error.
First, the expressions in Theorem 4.1 illustrate the dependence of reconstruction error both on the unobserved missingness process and the underlying covariate distribution. From the distribution, the covariate’s standard deviation directly affects the magnitude of the error because the more spread out the unobserved values are, the less accurate constant imputation strategies are. The distribution further influences the reconstruction error through the variance of the covariate’s unobserved values , equally increasing the expected reconstruction errors for both imputation strategies.
Crucially, the expressions also show the influence of the missingness process on reconstruction error. The observed rate of missingness, , affects the magnitude of the error as more extreme observation rates increase reconstruction error. The correlation also plays a central role in imputation quality. For instance, if the missingness process follows (S1), the marginalised group presents a different rate of uniformly distributed missing data, which leads to since data is MCAR in each group. Under (S2) and (S3) though, this correlation depends on the specific application, encompassing any possible value. Consider an example following (S2) in which general practitioners would only weigh patients based on a recorded family history of obesity. Similarly, consider an instance of (S3) in which practitioners only weigh patients that they perceive to be likely overweight. These two examples lead to a positive correlation between missingness and observed values as the patients with recorded weight are more likely to have an above-average weight.
Thus, while these quantities express the quality of the studied imputation strategies, the reconstruction errors depend upon the characteristics of the observation process and underlying distribution. These quantities cannot be estimated from observed data alone.
Second, the population reconstruction error is a function of the group mean reconstruction error ( depends on , i.e., the first term from expression). The only difference in the reconstruction error of the two imputation strategies is driven by the difference between group- and population- observed means. This expression underlines the balance between the difference in what each strategy imputes () and the group-imputation errors (). Importantly, a larger absolute correlation always increases the group imputation reconstruction error. However, this is not true in population reconstruction error in which the difference in means may counteract an increase in .
Consider an example from (S3) in which practitioners only record the weights of underweight patients. In this case, is negative and subsequently, is positive. Further in this example, the underweight group presents a smaller mean weight than the overall population, i.e., . Then, the co-occurrence of these two phenomena results in if , and thus the population mean imputation outperforms the group mean imputation for group .
4.3 Fairness comparison between group-specific imputation and population imputation
The assumed superiority of group-specific imputation strategies with respect to reconstruction error relies on an oversimplification of the missingness process, assuming independence between missing values and the missingness process, i.e., . When this assumption holds, the previous theorem shows that group-specific imputation will indeed have smaller reconstruction errors. However, as discussed earlier, this simplifying assumption is unlikely to hold under clinical missingness, where the correlation between the missing values and the missingness indicator can be positive or negative depending on the underlying covariate distribution and missingness process.
In this subsection, we illustrate that this is not an innocuous assumption. When violated it affects group fairness, measured by the group reconstruction error and by the gap between the reconstruction errors in the marginalised group and the rest of the population (). Theorems 4.2 and 4.3 show that the advantage of group-specific imputation is not guaranteed under clinical missingness. Group mean imputation can actually lead to a larger reconstruction error than the population mean imputation for group : and a wider fairness gap in reconstruction error: . These findings question the assumed benefits of group-specific imputation on algorithmic fairness under complex missingness patterns. While practitioners aim to reduce the reconstruction error gap by controlling on group membership, Theorems 4.2 and 4.3 show there are settings where this practice may either increase the fairness gap or further harm the population they try to protect, where harm is defined as a worse reconstruction error for that group. In Section 5, we complement this result by empirically showing that such settings are not edge cases. The proof of Theorems 4.2 and 4.3 are presented in Appendix A, Proofs A.2 and A.3.
Theorem 4.2 (Comparison of group and population mean imputations’ reconstruction error).
The group reconstruction error resulting from group mean imputation is larger than the one resulting from population mean imputation, i.e. , iff one of the following conditions holds:
| (4) |
Intuition.
Theorem 4.1 introduced a connection between the reconstruction error, the covariate distribution, and the missingness process; Theorem 4.2 now explicitly analyses when group imputation counter-intuitively worsens the reconstruction error for a given group in comparison to population imputation.
Consider the case when the observable group mean is larger than the population (). In this setting, only the inequality on the right side of Theorem 4.2 can be satisfied. If the missingness process, characterised by and scaled by , is sufficiently positive and pronounced relative to the normalised difference in means, then population mean imputation results in smaller reconstruction errors than group imputation. This is because the missing values are on average smaller than the observed group mean when the correlation is positive. Thus, the missing values are closer to than , resulting in the superiority of population mean imputation (). The more positively pronounced the missingness process is, the more different the two imputation strategies can be where population imputation would still be superior. On the other hand, if the correlation is negative, the missing values are on average larger than both the observed group and population means, and therefore consistently closer to the group mean. Thus, group imputation would then always be better in the case of negative correlation. (Similar reasonings follow when ).
Theorem 4.3 (Comparison of group and population mean imputations’ fairness gaps).
Under the simplifying assumptions , and , both imputation strategies penalise the marginalised group and the reconstruction gap is larger for the group imputation than the population one (i.e., ) iff:
| or | |||
with , the ratio of the population belonging to group , , , and .
Intuition.
We are concerned about imputation harming group fairness. Consider a group negatively impacted by imputation, where imputation increases its reconstruction error in comparison to the rest of the population (). Under this consideration, Theorem 4.3 proves there exist settings where using population imputation reduces the absolute fairness gap compared to group imputation. Appendix Figure 8 illustrates an example in which these inequalities are satisfied.
Multiple combinations of missingness processes and underlying covariate distributions can lead to the same observed data. Some of these would satisfy the inequalities of Theorem 4.3, and others not. Knowledge of the observation process is, therefore, necessary to resolve the otherwise under-determined problem of identifying the most beneficial imputation strategy for the protected group. If this process is unknown, practitioners must acknowledge missingness assumptions and remember that reconstruction error properties demonstrated under MCAR settings do not generalise to more complex patterns.
While these theoretical results focus on two simple, mathematically-tractable imputation strategies, they underline how imputation choice is less intuitive than it seems. Importantly, controlling for group membership may be counter-intuitively harmful. Indeed, this theme is something that we investigate empirically in simulation and real-world data in the rest of this paper, seeing evidence that this finding also holds when imputation performance is measured with respect to downstream prediction performance and fairness.
5 Empirical evidence of the impact of imputation on algorithmic fairness
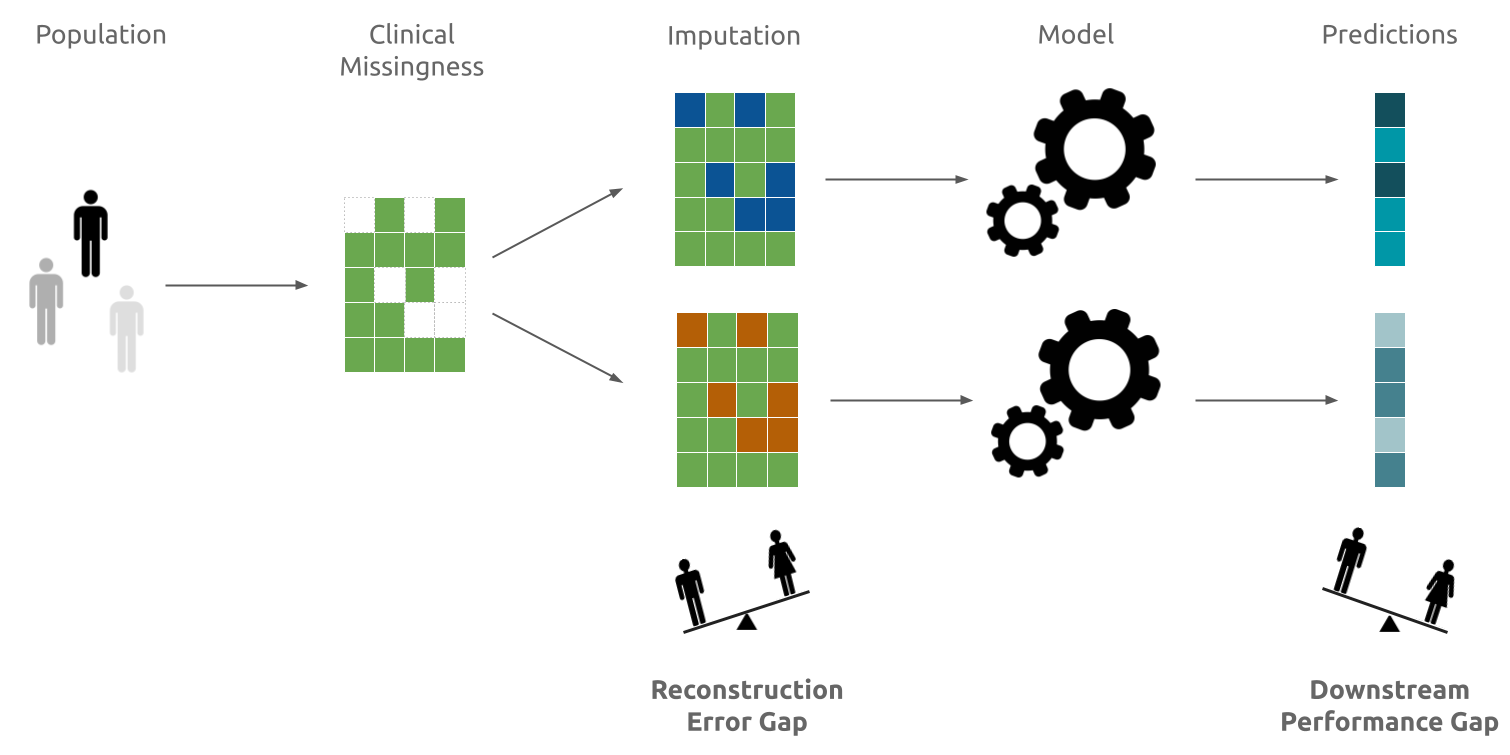
The previous sections identify group-specific patterns of clinical missingness, and show that these may translate into disparities in reconstruction errors. In this section, we provide evidence of this phenomenon through simulations. First, we introduce the data generation in Section 5.1 and the handling of missingness in Section 5.2. By using simulations, we are able to control the underlying clinical missingness patterns and measure the impact of imputation on reconstruction errors for each group and the gap between them, as shown in Section 5.3. Imputation choices may also impact prediction disparities, thus we study the effect of different imputation strategies on algorithmic fairness of downstream predictions in Section 5.4. Figure 3 summarises how our experiments study algorithmic fairness concerns in both reconstruction error and downstream prediction performance. For reproducibility, code for all experiments is available on Github111https://github.com/Jeanselme/ClinicalPresenceFairness.
5.1 Data generation
Our experiments rely on a population of patients with associated covariates , marginalised group membership , and outcome of interest . Assume a simulated population consisting of a bi-dimensional covariate set (), with individuals divided into two groups (), and consider the marginalised group () is a minority in the population with patients for in the majority. We assume the two groups differ in condition manifestation, i.e., positive cases across groups differ in how they express the condition in the covariates . Both groups present the same condition prevalence, with of the population presenting the condition. To enforce a difference in condition manifestation, negatives () are drawn from a shared bi-dimensional normal distribution, while patients affected by the condition are sampled from two different normal distributions, depending on their group membership. This simulation therefore consists of three clusters illustrated in Figure 4, and the associated predictive task is to classify between positive and negative cases. (See Appendix B.1 for full data generation protocol and further simulations).
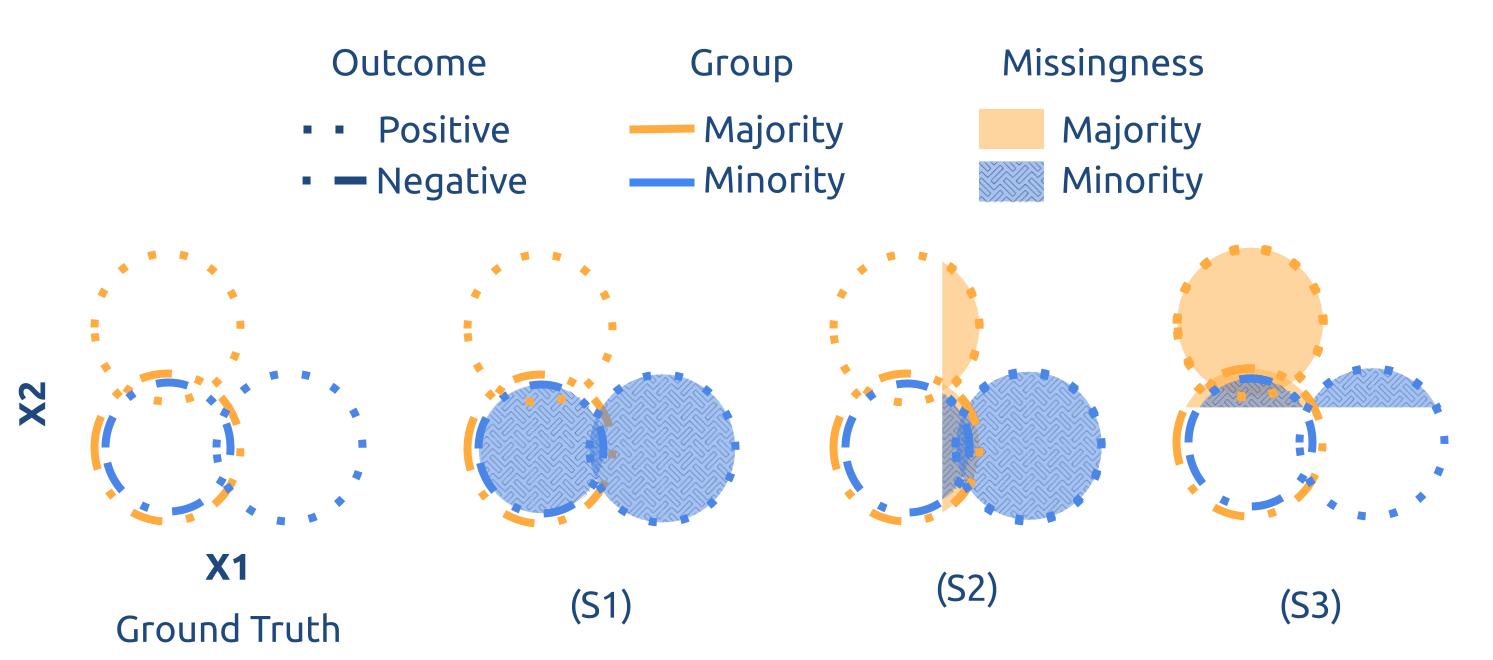
We then enforce the three clinical missingness patterns introduced in Section 3, by masking covariates on the second dimension . The proposed missingness processes reflect the DAGs introduced in Figure 2: the missingness process has a direct dependence on in (S1), while an indirect one in (S2) and (S3) through the difference in condition manifestation in these groups. Figure 4 provides a graphical summary of how clinical missingness is enforced on the synthetic data. Note how the different scenarios result in group-specific missingness patterns affecting group-specific clusters.
Formally, 50% of the data in the second dimension is removed in a given subgroup to enforce the three clinical presence scenarios as follows:
-
•
Limited access to quality care (S1):
-
•
(Mis)-informed collection (S2):
-
•
Confirmation bias (S3):
5.2 Handling Missingness
Missing data need to be imputed to use traditional statistical models. While the theoretical results of Section 4 focus on two mean imputation strategies, our experiments also explore if these conclusions generalise over a larger set of common strategies to deal with missingness:
Population mean imputation (Mean).
Missing data are replaced by the population mean of each covariate.
Conditional group-mean imputation (Group Mean).
Missing data are replaced by the group mean of each covariate.
Multiple Imputation using Chained Equation (MICE).
Missing data are iteratively drawn from a regression model built over all other available covariates after median initialisation. This approach is repeated times with an associated predictive model for each imputed draw. At test time, the same imputation generates imputed points for which models’ predictions are averaged. MICE is recommended in the literature [90, 91, 26, 92, 22], based on the argument that it quantifies the uncertainty associated with the missingness process. In the experiments, we used 10 iterations repeated 10 times, resulting in datasets with associated predictive models.
Group MICE.
The previous MICE strategy assumes a MAR mechanism. To make such assumption more plausible, [13] recommend the addition of potentially informative covariates. In our experiment, we therefore adjust in the regression for both group membership and all available covariates for imputing the missing data.
Group MICE Missing.
Encoding missingness has been shown to improve performance when the patterns of missingness are informative [93, 94, 95, 96]. As clinical missingness can contain informative patterns [1, 94], we concatenate missingness indicators to the imputed data from Group MICE (Appendix B.1 explores the concatenation of missingness indicators with the other strategies).
5.3 Impact on reconstruction error gaps
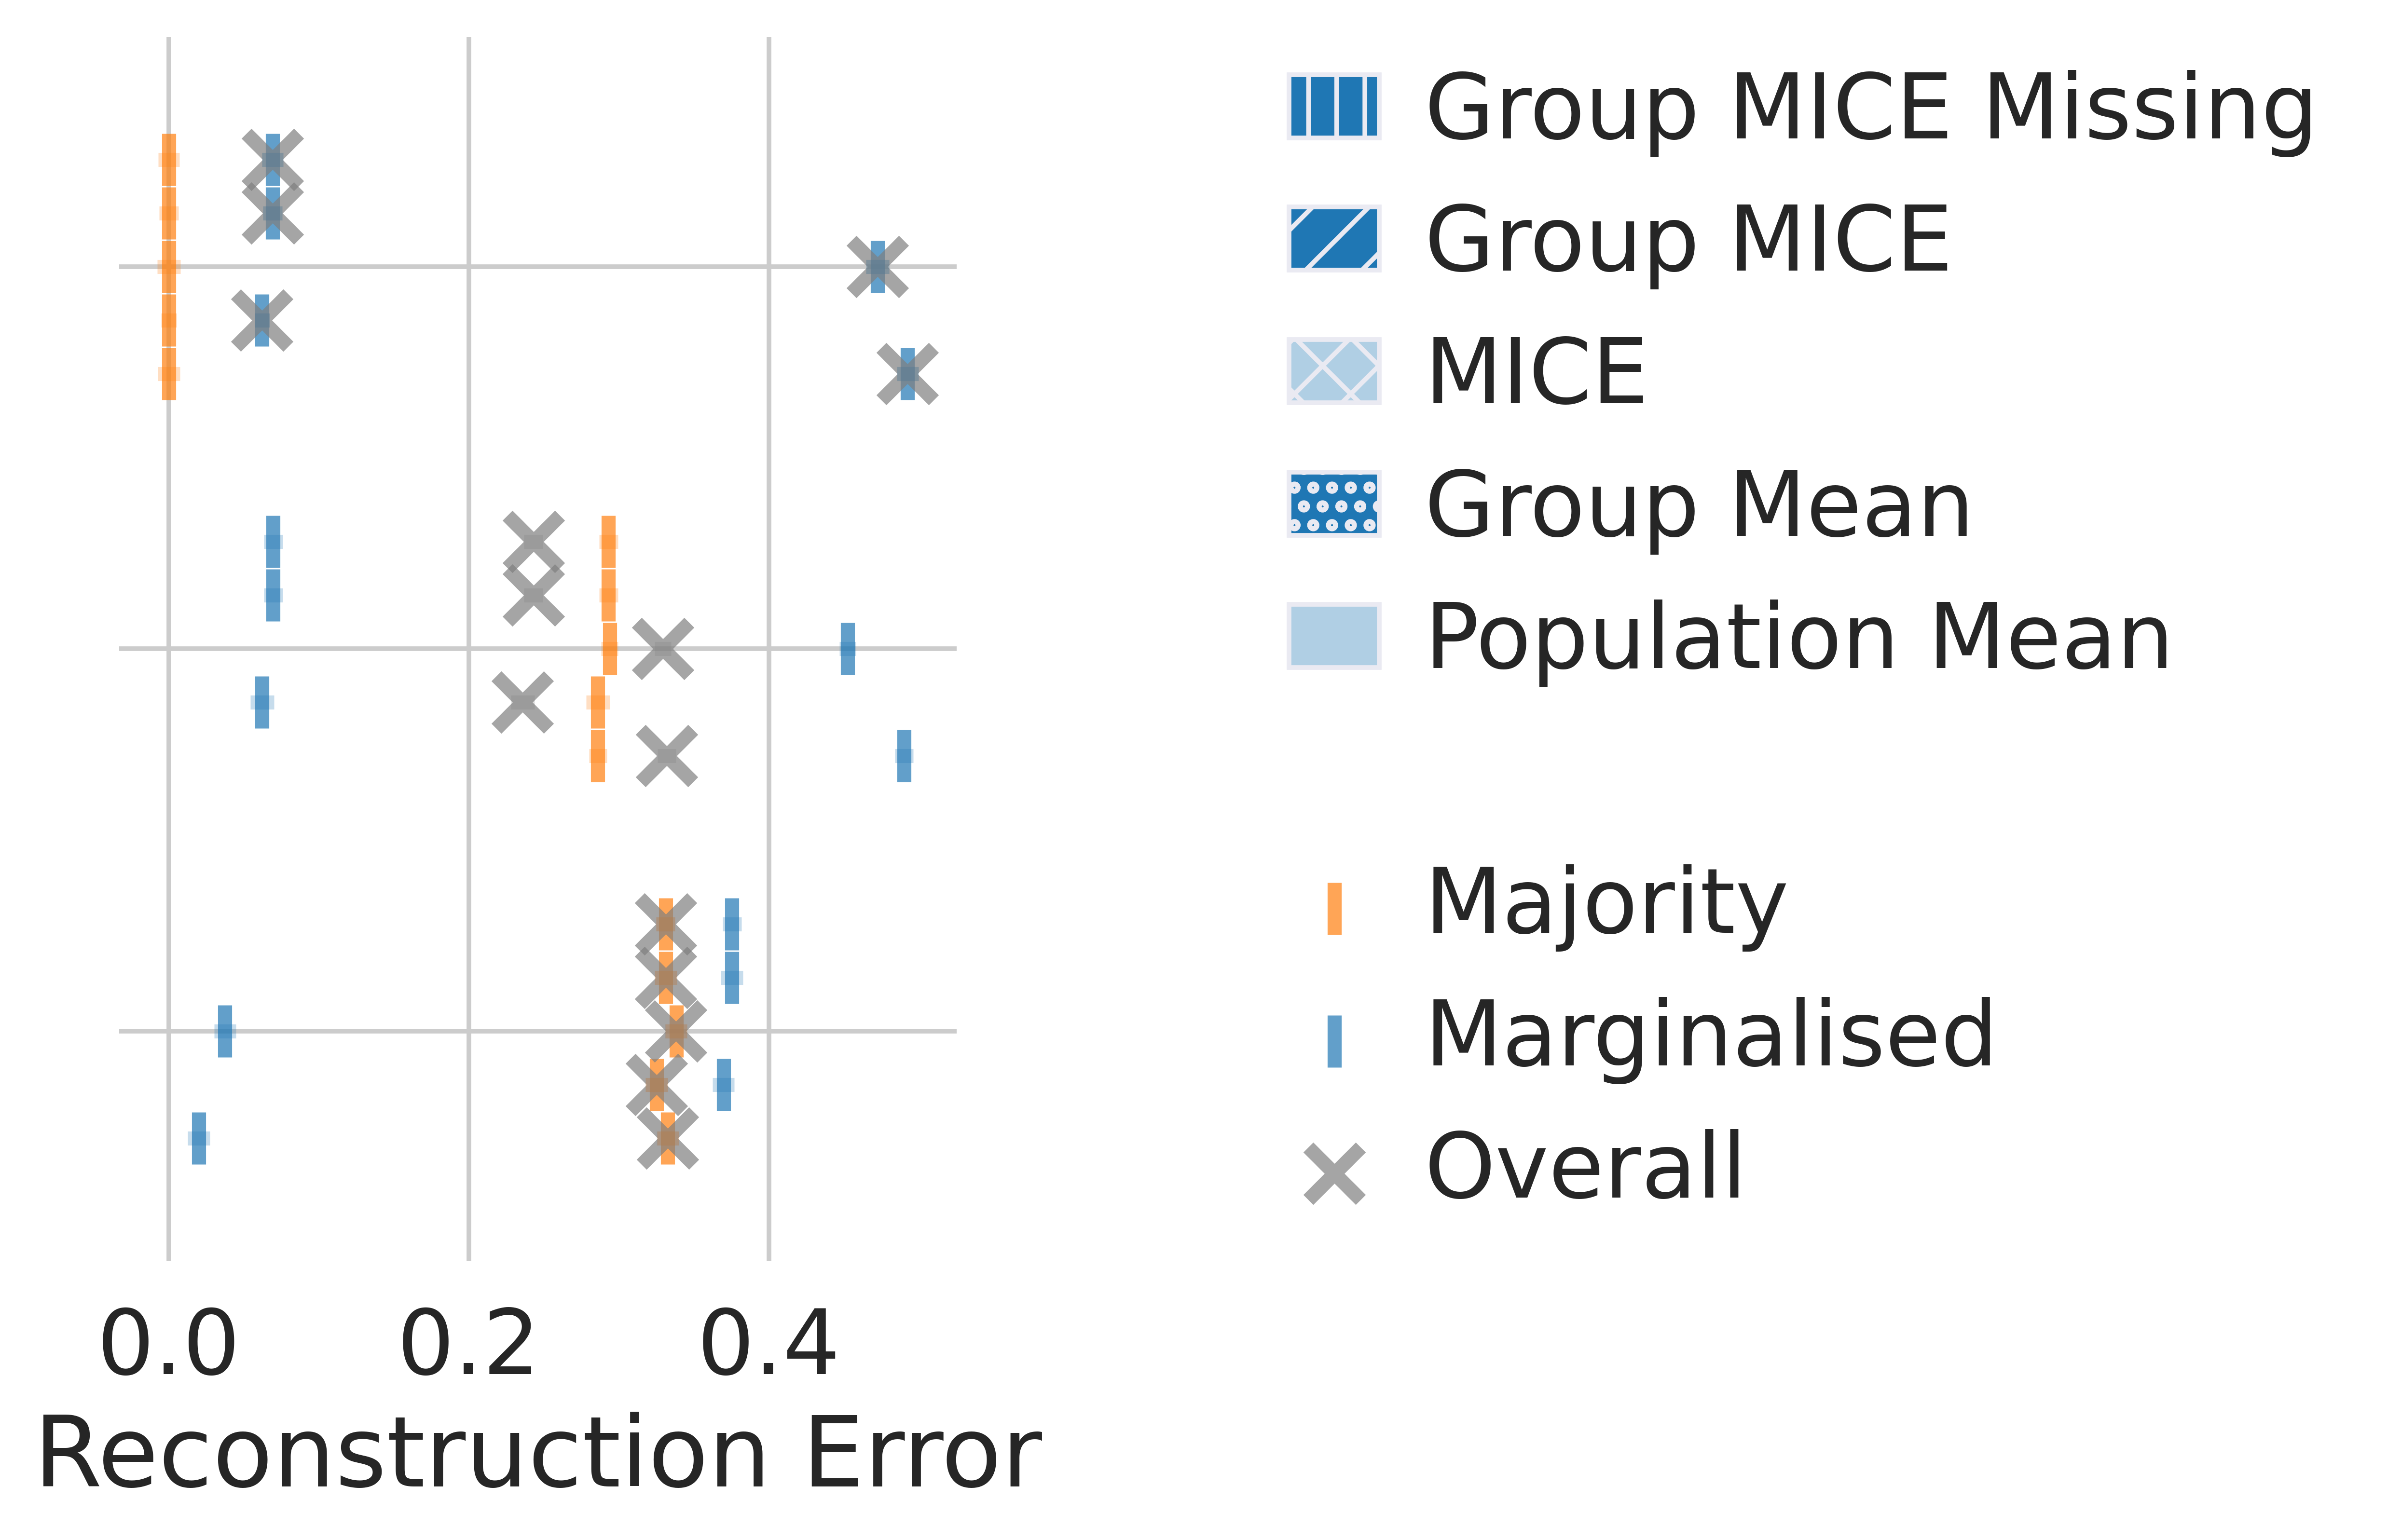
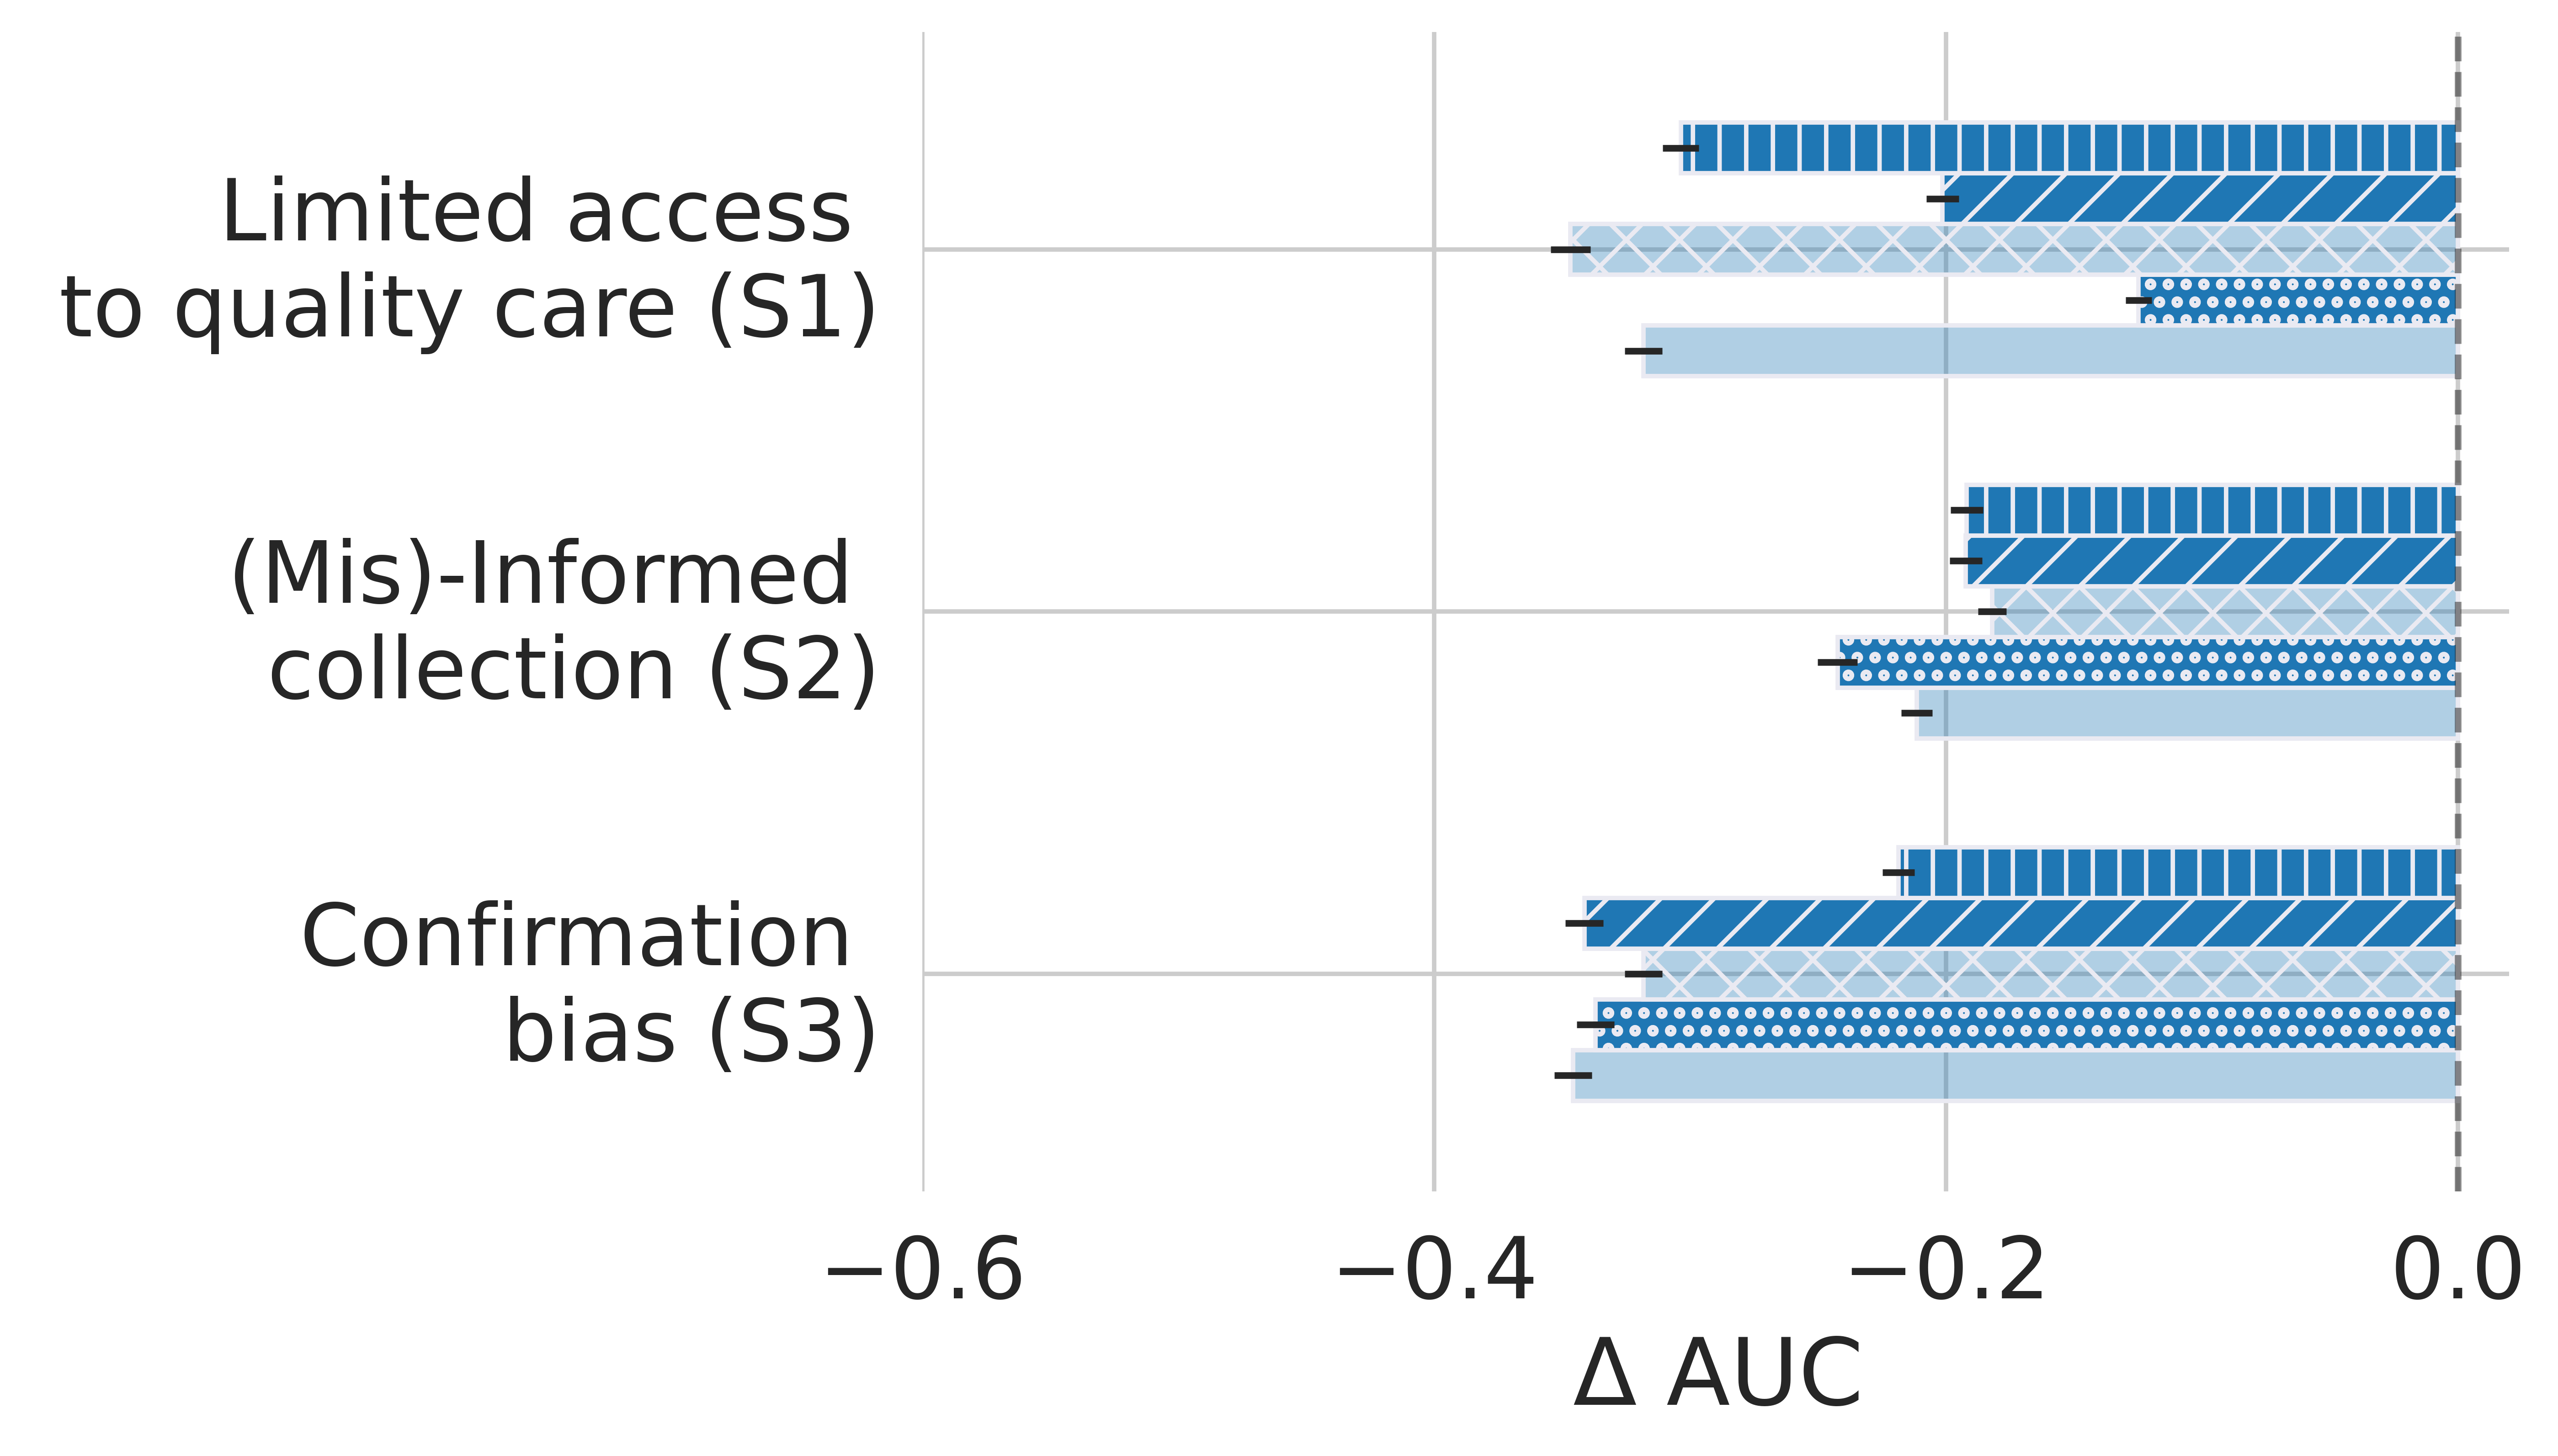
We analyse the impact of imputation on reconstruction quality over 100 repetitions of the proposed simulations. The three identified clinical presence scenarios are independently enforced. As the underlying distribution and missingness process are known, we can compute the reconstruction error gaps. Figure 5 (left panel) presents the gap in reconstruction error, , between the marginalised group and the rest of the population. A larger absolute value corresponds to a larger difference in data quality for each group. A negative sign expresses a better quality of data produced for the marginalised group relative to the majority, while a positive sign favours the majority. Figure 5 (right panel) presents the overall reconstruction errors as well as the reconstruction errors for each group. The results are presented for each imputation strategy across the three clinical missingness scenarios. In this figure, the dark-coloured bars represent group-specific imputation strategies, while the light-coloured bars are population-wide imputation strategies (MICE or Population Mean). Figure 5 empirically illustrates the theoretical results presented in Section 4 and provides new insights.
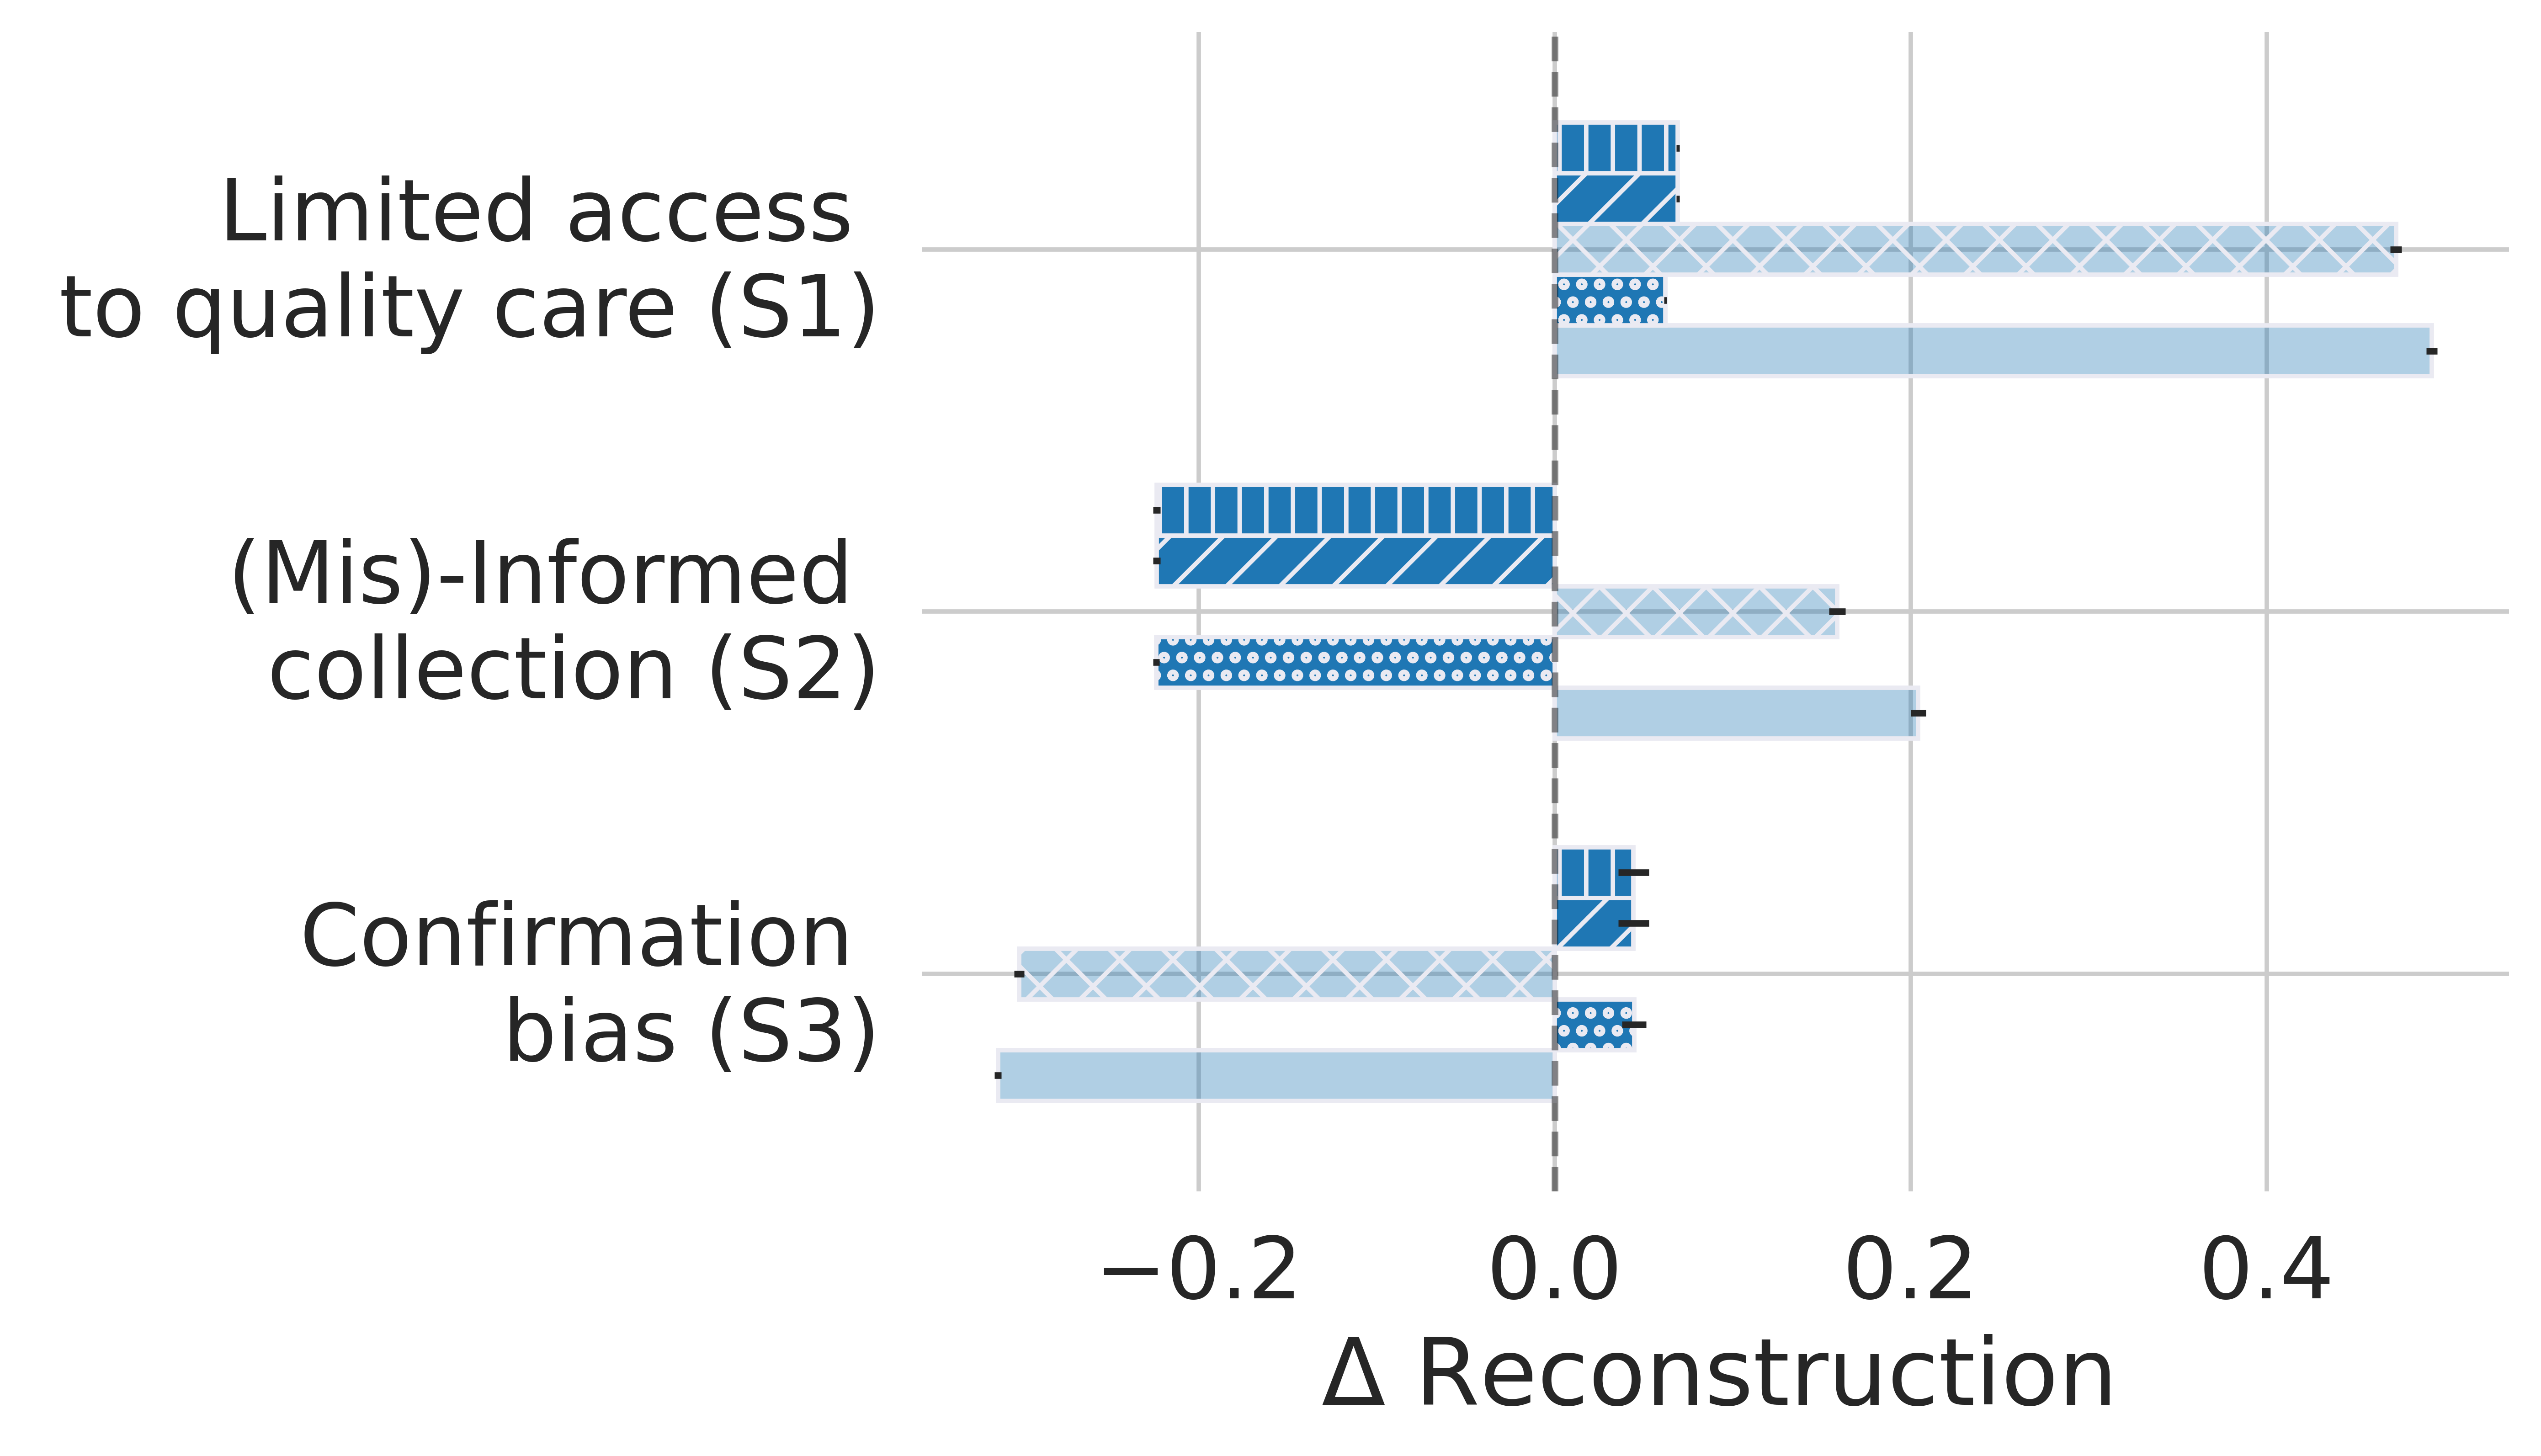
Insight 1.1: Different imputation strategies may have similar reconstruction errors at the population level while having different group reconstruction gaps.
The right panel in Figure 5 shows that, for scenario (S3), multiple imputation strategies have the same overall reconstruction errors (marked by grey crosses) but different subgroups’ errors (in colour). Consequently, different reconstruction gaps arise for different strategies under the same observed data, as shown by the left panel. This observation echoes the results from Theorem 4.1 showing how two imputation strategies may result in different group reconstruction errors.
Insight 1.2: No imputation strategy consistently outperforms the others across clinical presence scenarios.
Figure 5 shows that under (S1), group imputation presents minimal reconstruction gaps (left panel), and minimal overall reconstruction error (right panel). In this context, group imputation strategies should be preferred. However, the choice is less clear in (S2), as group imputation strategies present overall lower reconstruction errors but larger reconstruction gaps compared with their population imputation alternatives. Specifically, if practitioners prioritise algorithmic fairness, MICE imputation should be preferred under (S2), as it has the smallest absolute gap in reconstruction error. On the other hand, if the overall error is the main concern, group mean imputation should be preferred. As in Theorems 4.2 and 4.3, this observation underlines that no imputation either consistently improves algorithmic fairness or consistently reduces overall reconstruction error across different missingness processes.
Insight 1.3: Current recommendations for group-specific imputation can increase the reconstruction gap and yield a worse reconstruction error for the marginalised group.
Note how in the simulation (S2), the group mean imputation presents a lower marginalised group reconstruction error than its population alternative, as illustrated by the blue vertical bars on the right panel of Figure 5. However, an opposite observation can be made under (S3), in which the population mean imputation presents a smaller reconstruction error for the marginalised group. This means that group imputation benefits the marginalised group in (S2) but negatively impacts this group under (S3). This empirically illustrates the results of Theorem 4.2 demonstrating that group imputation may have adverse effects on the marginalised group that one aims to protect. Further, the reconstruction gaps in the left panel show that the population mean presents a lower reconstruction gap under (S2) but a larger one under (S3) in comparison to the group mean imputation. This observation echoes Theorem 4.3 showing that group imputation may present a larger fairness gap under some observation processes. Importantly, Group MICE and MICE present similar trends as group mean and population mean across (S2) and (S3), indicating that these results extend beyond mean imputation.
5.4 Impact on downstream algorithmic fairness
While reconstruction error gaps demonstrate how imputation impacts data quality, its estimation involves knowledge of the missingness process. Furthermore, imputation is often an intermediate step towards a different end goal, such as predictive modelling. Different imputation strategies impact the data available for modelling and therefore, may impact performance and algorithmic fairness in downstream predictions. Researchers and practitioners commonly explore algorithmic fairness in predictions to assess and mitigate the risks associated with a model. We propose to similarly measure how the choice of imputation affects downstream group-specific performance and potentially reinforces disparities in data marked by clinical missingness.
To this end, we complement the previously described imputation pipelines with a logistic regression. The prediction task is to differentiate between positive and negative cases. Note that we explore a single model since our goal is not to quantify how different prediction models may mitigate disparities in data quality; instead, we want to assess the downstream impact of imputation strategies on prediction.
Analogous to the quantification of algorithmic fairness in reconstruction error, we adopt the equal predictive performance across groups definition of algorithmic fairness ([38], see Definition 4.2). We use the Area Under the Curve for the Receiver Operating Characteristic curve (AUC), i.e., metric in Definition 4.2. The AUC measures each group’s discriminative performance and is commonly used as a measure of algorithmic fairness in machine learning for healthcare [97, 98, 99]. A smaller absolute gap corresponds to less difference in discriminative performance between groups. A negative gap corresponds to a worse-performing model for the marginalised group. Figure 6 presents the gap between the majority and the marginalised group’s performance (left panel) and the group-specific AUCs (right panel). These results are computed on a 20% test set and averaged over the 100 simulations.
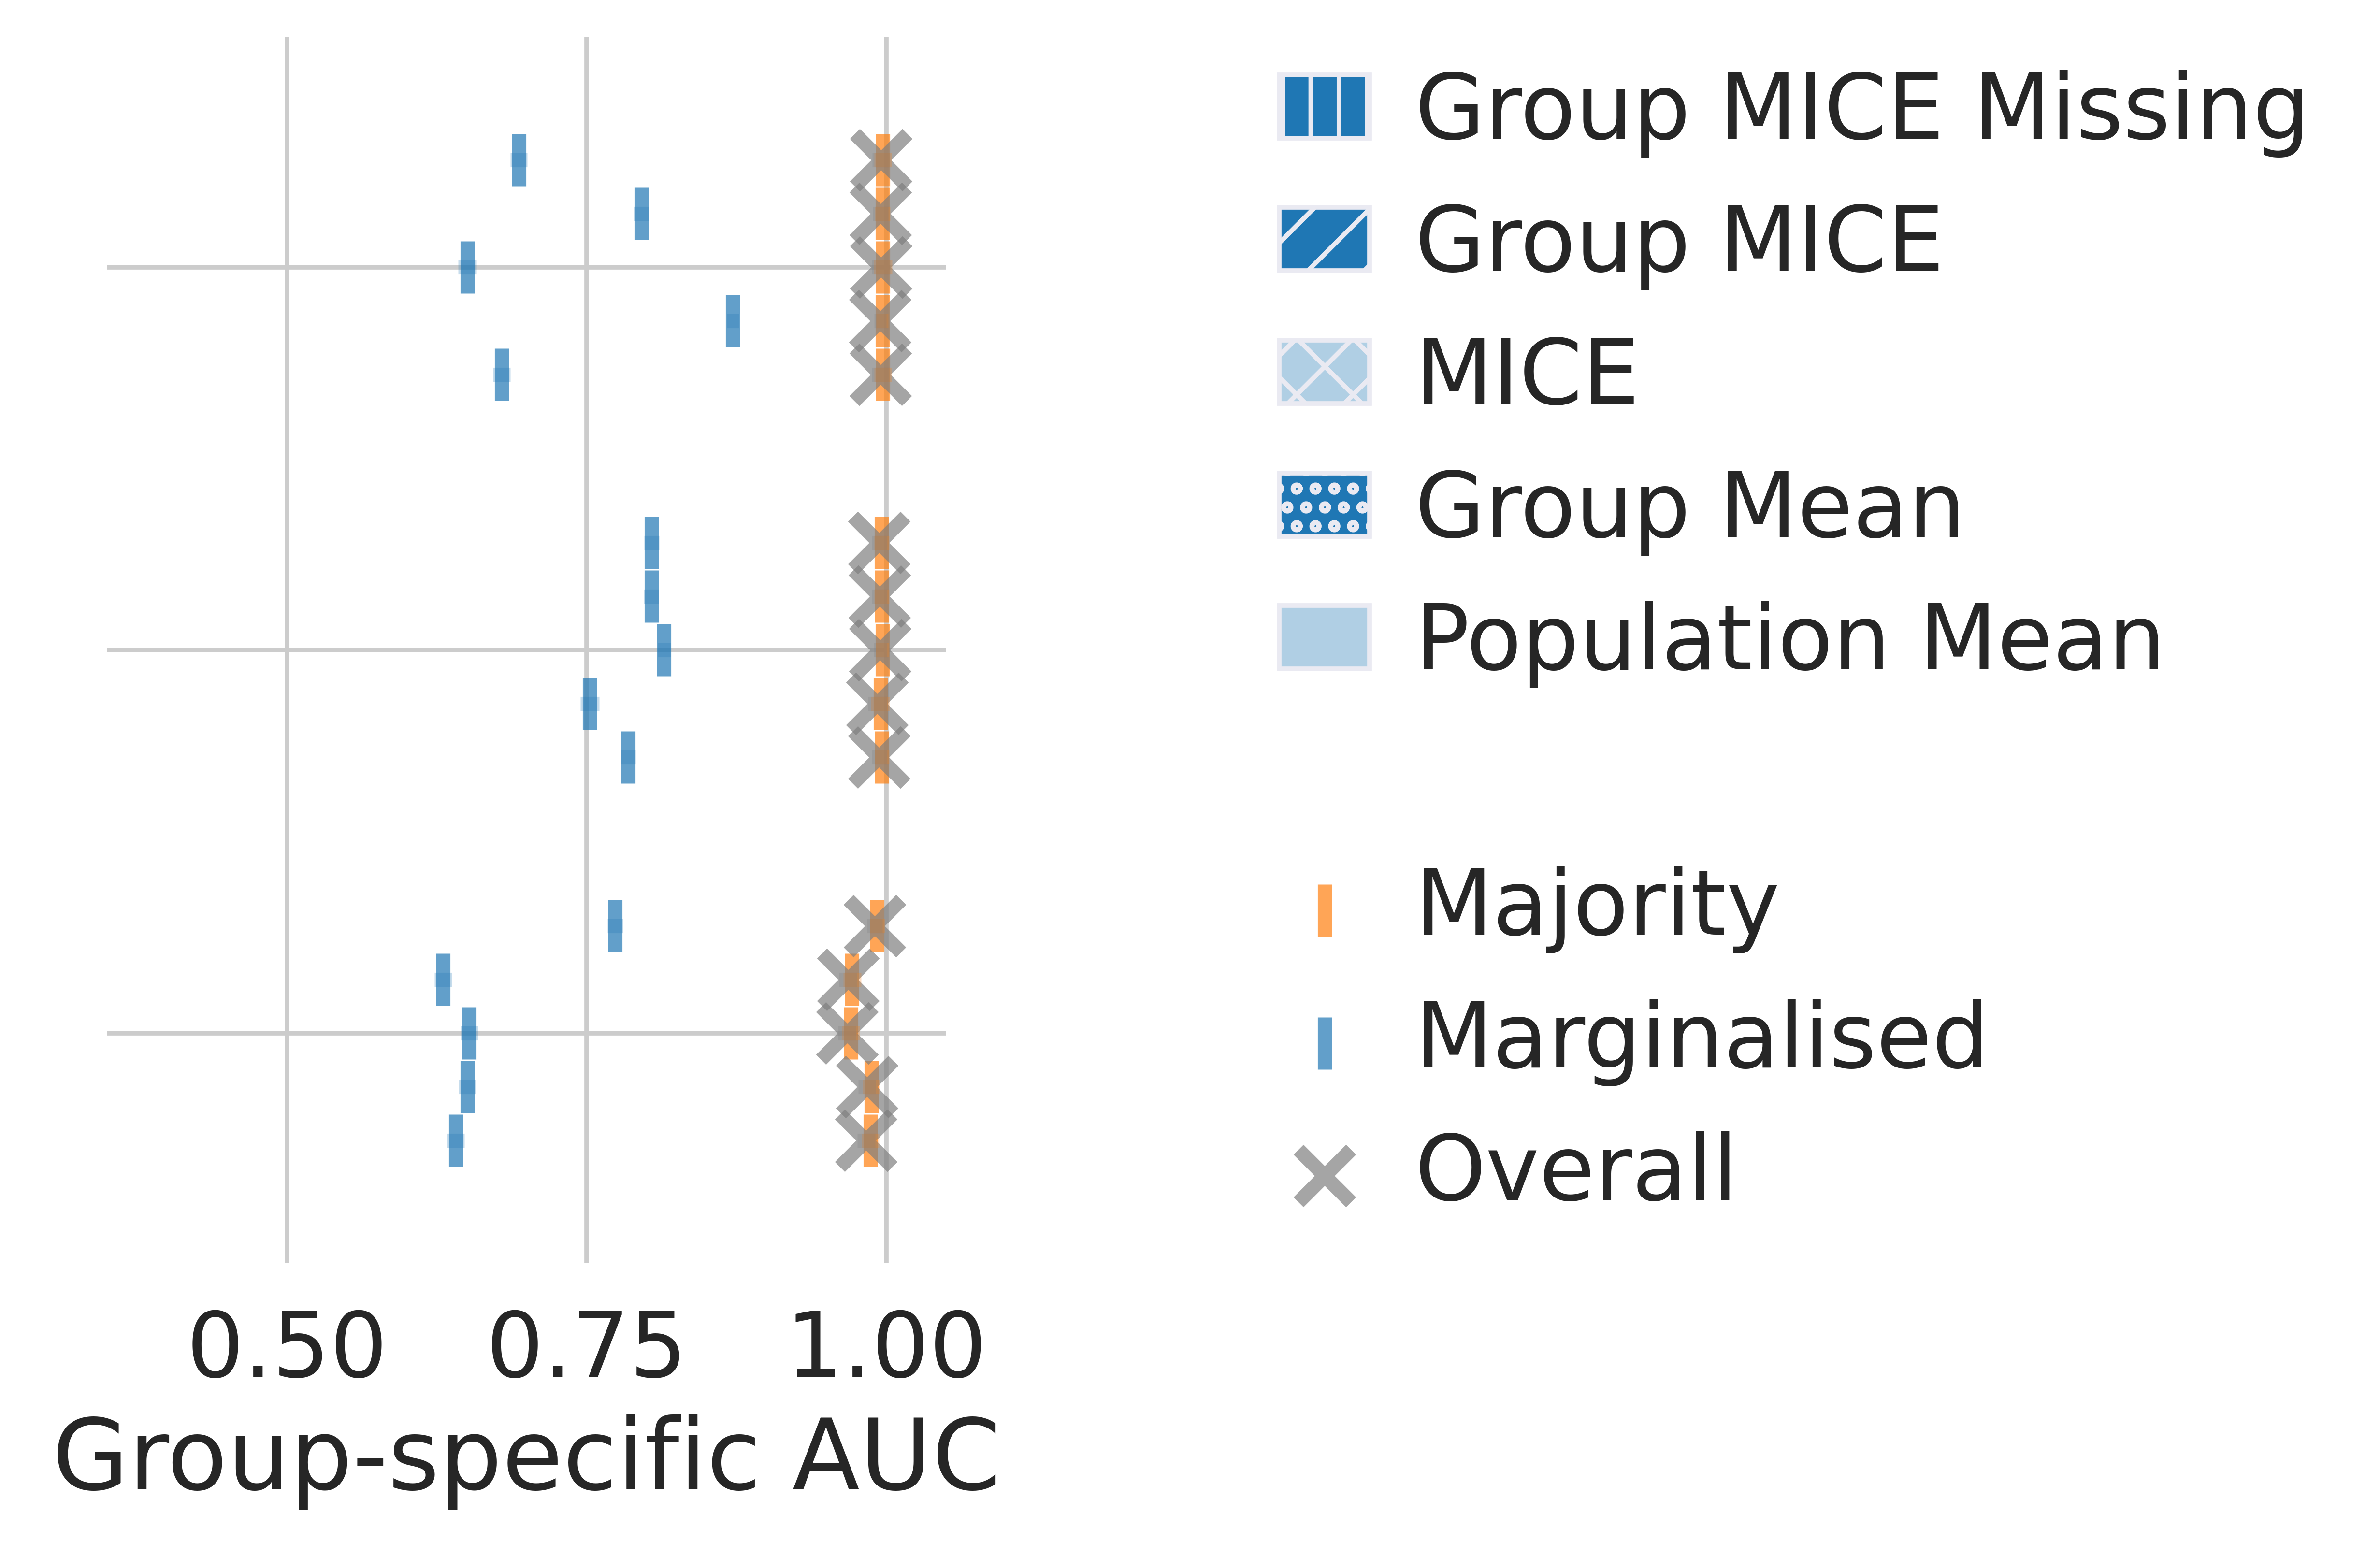
This analysis on downstream performance echoes the insights described in Section 5.3. Imputation strategies impact the data distribution available for modelling. Group-specific reconstruction qualities are then transposed into performance differences.
Insight 2.1: Different imputation strategies may result in similar downstream performance at the population level while having different group performance gaps.
Figure 6’s right panel indicates that all imputation strategies present similar AUC performances at the population level. They also present similar performances for the majority. However, performance differences for the marginalised group can be stark. Note how the AUC evaluated on the marginalised group under (S1) presents a gap of more than between the population and group mean imputation strategies. Similarly to Insight 1.1 for reconstruction errors, equal overall performances do not translate into equal group-specific performances. This observation is also observed for the other strategies, as shown by the similar gap for MICE imputation strategies.
Insight 2.2: No strategy consistently outperforms the others across clinical presence scenarios.
When considering the AUC gaps presented in Figure 6, note how the smallest gap is achieved by Group Mean in (S1), MICE in (S2) and Group MICE Missing in (S3). Despite similar overall performances, different imputation strategies should be preferred under these three scenarios to reduce the performance gap. While the result of which imputation strategy is best for each scenario is specific to this simulation, this exemplifies how no strategy consistently reduces the performance gap across groups. Importantly, different imputation strategies should be preferred under the same underlying distributions but different missingness processes.
Insight 2.3: Current recommendations for group-specific imputation and use of missingness indicators can increase the performance gap and yield a worse performance for the marginalised group.
In Figure 6’s left panel, Group MICE presents a larger performance gap than MICE in (S3). Controlling for group membership to make the MAR assumption more plausible is not always suitable as it may add noise, or impact data distributions. The resulting distributions may be less separable by the model and, therefore, lead to poorer performance. Likewise, see how the model considering missingness provides an edge in (S3) compared to Group MICE, but hurts algorithmic fairness and marginalised group performance in (S1). This observation reinforces the necessity of conducting a sensitivity analysis on the choice of imputation. Additionally, it underlines how the benefit of controlling on relevant covariates depends on the missingness process.
Through simulations, this section provides empirical evidence for rejecting a series of hypotheses that underlie assumptions and recommendations made by common practice for handling missingness. A summary of these hypotheses is presented in Table 1. First, overall equal performance does not correspond to equal subgroups’ performance; two imputation strategies may yield the same overall performance but different algorithmic fairness properties. Second, which imputation has superior performance depends on the missingness process and therefore there is no consistent “best” strategy across settings. Third, group imputation strategies can counter-intuitively increase reconstruction errors and reduce downstream predictive performance. Lastly, group imputation strategies do not necessarily reduce the fairness gaps. These observations converge towards the necessity of measuring the impact of different imputation strategies on fairness properties’ robustness.
| Hypotheses | Imputation quality | Predictive performance |
|---|---|---|
| Equally performing approaches at the population level have similar algorithmic fairness properties | ✗ | ✗ |
| Imputation properties are consistent across missingness processes | ✗ | ✗ |
| Controlling/stratifying on group results in improved group performance | ✗ | ✗ |
| Controlling/stratifying on group reduces group disparities | ✗ | ✗ |
6 Case study: MIMIC III
Section 5 uses simulations to illustrate the algorithmic fairness consequences of imputation on both reconstruction error and downstream performance. To further demonstrate that these insights have important practical implications, we show evidence of these concerns in a real-world setting, on a widely used observational dataset.
6.1 Dataset and Empirical Setup
We model short-term survival using the laboratory tests from the widely studied Medical Information Mart for Intensive Care (MIMIC III) dataset [100]. Following data harmonisation (as in [101]), we select adults who survived 24 hours or more after admission to the intensive care unit, resulting in a set of 36,296 patients sharing 67 laboratory tests. The goal is to predict short-term survival (7 days after the observation period — ) using the most recent value of each laboratory test observed in the first 24 hours of observation (). We select short-term survival as it is a standard task in the machine learning literature [102, 103, 104] and the associated labels are less likely to suffer from group-specific misdiagnosis, and, therefore, disentangles our analysis from potential biases in labelling.
There is a large amount of missing data in MIMIC III data because all possible laboratory tests are not performed. Using the same imputation strategies presented in Section 5.2, we first impute missing data, resulting in , to enable modelling. After this preprocessing, our analysis consists of a logistic regression model —a pillar in the medical literature [105, 106]— to discriminate between positive and negative cases (). To avoid overfitting, we use a logistic regression with the strength of the penalty selected through cross-validation among . Patients are split into three sets: 80% for training, 10% for hyper-parameter tuning and 10% for testing.
This model could have important consequences on patients’ life. Deploying this model can inform care prioritisation of patients with predicted elevated risks. Thus, ensuring equitable care is central to this problem. Following the same evaluation procedure as in the simulations, we measure the gap between group AUC performance as a group fairness metric.
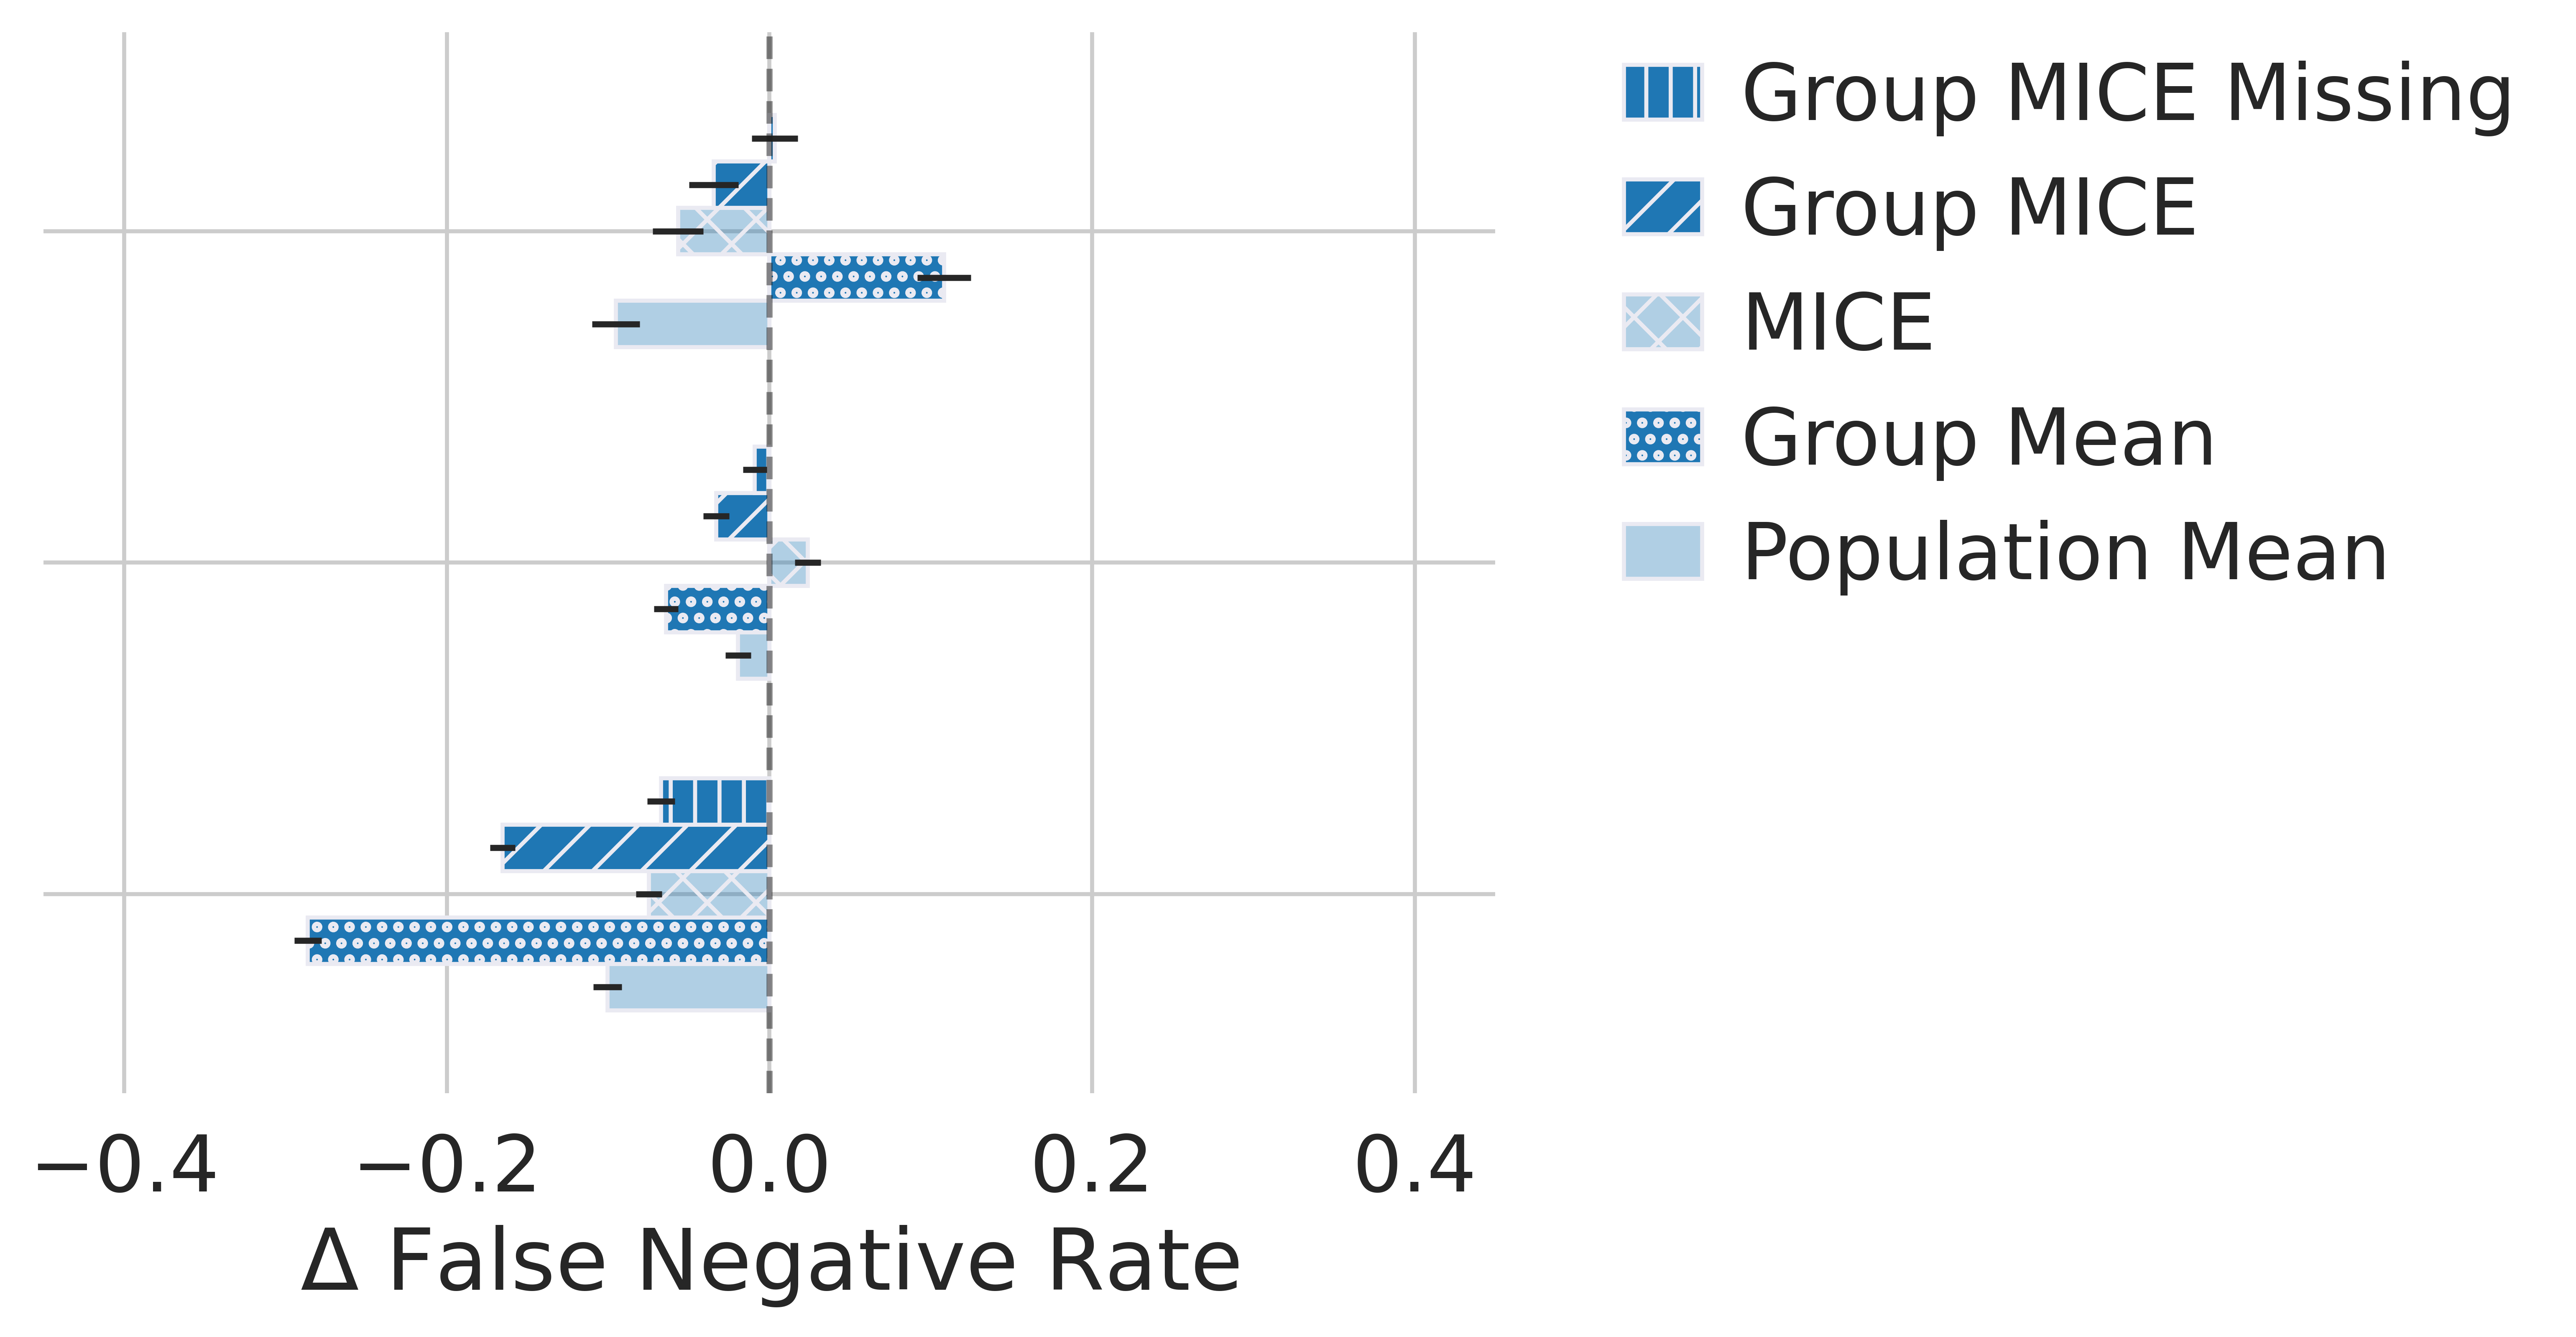
However, this metric does not directly quantify how deployment can hurt subgroups if a hospital were to use a fixed allocation of resources to treat patients (such as beds or staff limits). Thus, as a second algorithmic fairness metric, we assume the availability of priority care for 30% of the population, and evaluate the False Negative Rate (FNR) given this resource threshold. In other words, higher FNR in this setting measures how often the model incorrectly deprioritises high-risk patients. A gap in FNR between groups illustrates differences in the rates of missed patients between groups. (Additional experimental design descriptions and results are provided in Appendix B. Sensitivity to the prioritisation threshold is analysed in Appendix B.2).
6.2 Downstream algorithmic fairness consequences
We find that imputation has algorithmic fairness consequences in real-world medical data. The presented experiments focus on groups defined by the following attributes: ethnicity (Black vs non-Black)222MIMIC’s reported ethnicity contains 40 different categories, several referring to Black ethnicities such as Black African American, Black Haitian or Black African; for our analysis, we considered all Black ethnicities as one group., sex (female vs male), and insurance (publicly vs privately insured)333For our analysis, we considered private insurance versus all other types of reported insurance.. We first investigate if MIMIC presents distinct group-specific missingness patterns. Then, we explore the impact of imputation strategies on downstream predictive performance, both at the population and group levels, echoing Insights 2.1 to 2.3. This analysis provides the following insights that parallel and enrich the synthetic experiments’ results.
| Orders | Distinct tests | |||
|---|---|---|---|---|
| Alive+ | 5.68 (4.64) | * | 40.80 (6.73) | * |
| Dead+ | 7.57 (5.44) | 37.22 (7.50) | ||
| Black | 5.24 (4.08) | * | 40.94 (6.94) | * |
| Other | 5.86 (4.77) | 40.52 (6.84) | ||
-
•
+ By the 8th day after admission.
| Orders | Distinct tests | |||
|---|---|---|---|---|
| Female | 5.54 (4.45) | * | 40.75 (6.89) | * |
| Male | 6.03 (4.91) | 40.41 (6.80) | ||
| Public | 5.67 (4.57) | * | 40.46 (6.76) | * |
| Private | 6.11 (5.01) | 40.75 (7.01) | ||
-
•
Significant t-test p-value ( 0.001).
Insight 3.0: Real-world data presents group-specific clinical missingness.
MIMIC data collection is the product of structured guidelines, medical intuition and prioritisation rules used in intensive care units. This process likely consists of an unknown mixture of the clinical missingness scenarios described in Section 3 that may impact subgroups differently. While the causes of clinical missingness cannot be conclusively determined from observational data alone, one can examine missing data and identify evidence of group-specific patterns. Table 2 shows the number of orders and the number of distinct laboratory tests (out of the 67 possible tests) performed during the first-day post-admission for different subgroups.
In Table 2 we observe that there are a larger number of orders for patients who die during their stay compared with the ones who survive. This pattern could be consistent with a possible confirmation bias scenario (S3). Doctors may monitor more closely sicker patients, or patients with conditions with higher mortality. Another example of non-random missingness is that there are fewer test orders for female, Black, and publicly insured patients, but little difference in the number of distinct tests prescribed. This may be explained by the underlying conditions or other medically relevant factors, which may be different across groups. Importantly, the combination of similar diversity of tests but less frequent observations results in a less up-to-date patient’s health status available for modelling. Thus, even though the cause of testing differences is unclear, these observations show the connection between group membership, testing patterns, and outcomes.
| Group-specific | ||||
|---|---|---|---|---|
| \cdashline3-5 Strategy | Population | Ethnicity | Sex | Insurance |
| Mean | 0.745 (0.011) | 0.744 (0.011) | 0.747 (0.011) | 0.745 (0.011) |
| MICE | 0.736 (0.012) | 0.738 (0.012) | 0.734 (0.012) | 0.730 (0.011) |
| MICE Missing | 0.785 (0.010) | 0.787 (0.009) | 0.787 (0.009) | 0.782 (0.010) |
Insight 3.1: Different imputation strategies may have similar prediction performance at the population level while having opposite group performance gaps.
All group-specific mean imputation and population mean perform similarly at the population level, measured in terms of AUC, as shown in Table 3. However, Figure 7 highlights how these strategies impact marginalised groups differently. Both the amplitudes and signs of the gaps vary across imputation strategies, and this occurs both when considering gaps in AUC and gaps in FNR. Consider the ethnicity partition: these strategies have opposite algorithmic fairness consequences, measured in terms of FNR. Group mean imputation would result in a larger FNR gap, with a smaller FNR for non-Black than Black patients; by contrast, population mean imputation would reduce the gap in FNR, and yield a smaller FNR for Black than non-Black patients. This observation echoes the results from Theorem 4.3 and Insight 2.1, and shows that the group mean imputation may widen the fairness gap in comparison to its population imputation alternative. Additionally, Table 8 in Appendix echoes Theorem 4.2 with a smaller absolute FNR for Black patients when using the population imputation. Crucially, this highlights how two pipelines, solely differing in their handling of missingness, can harm or favour the marginalised group’s performance relative to the rest of the population, drastically shifting a model’s algorithmic fairness properties.
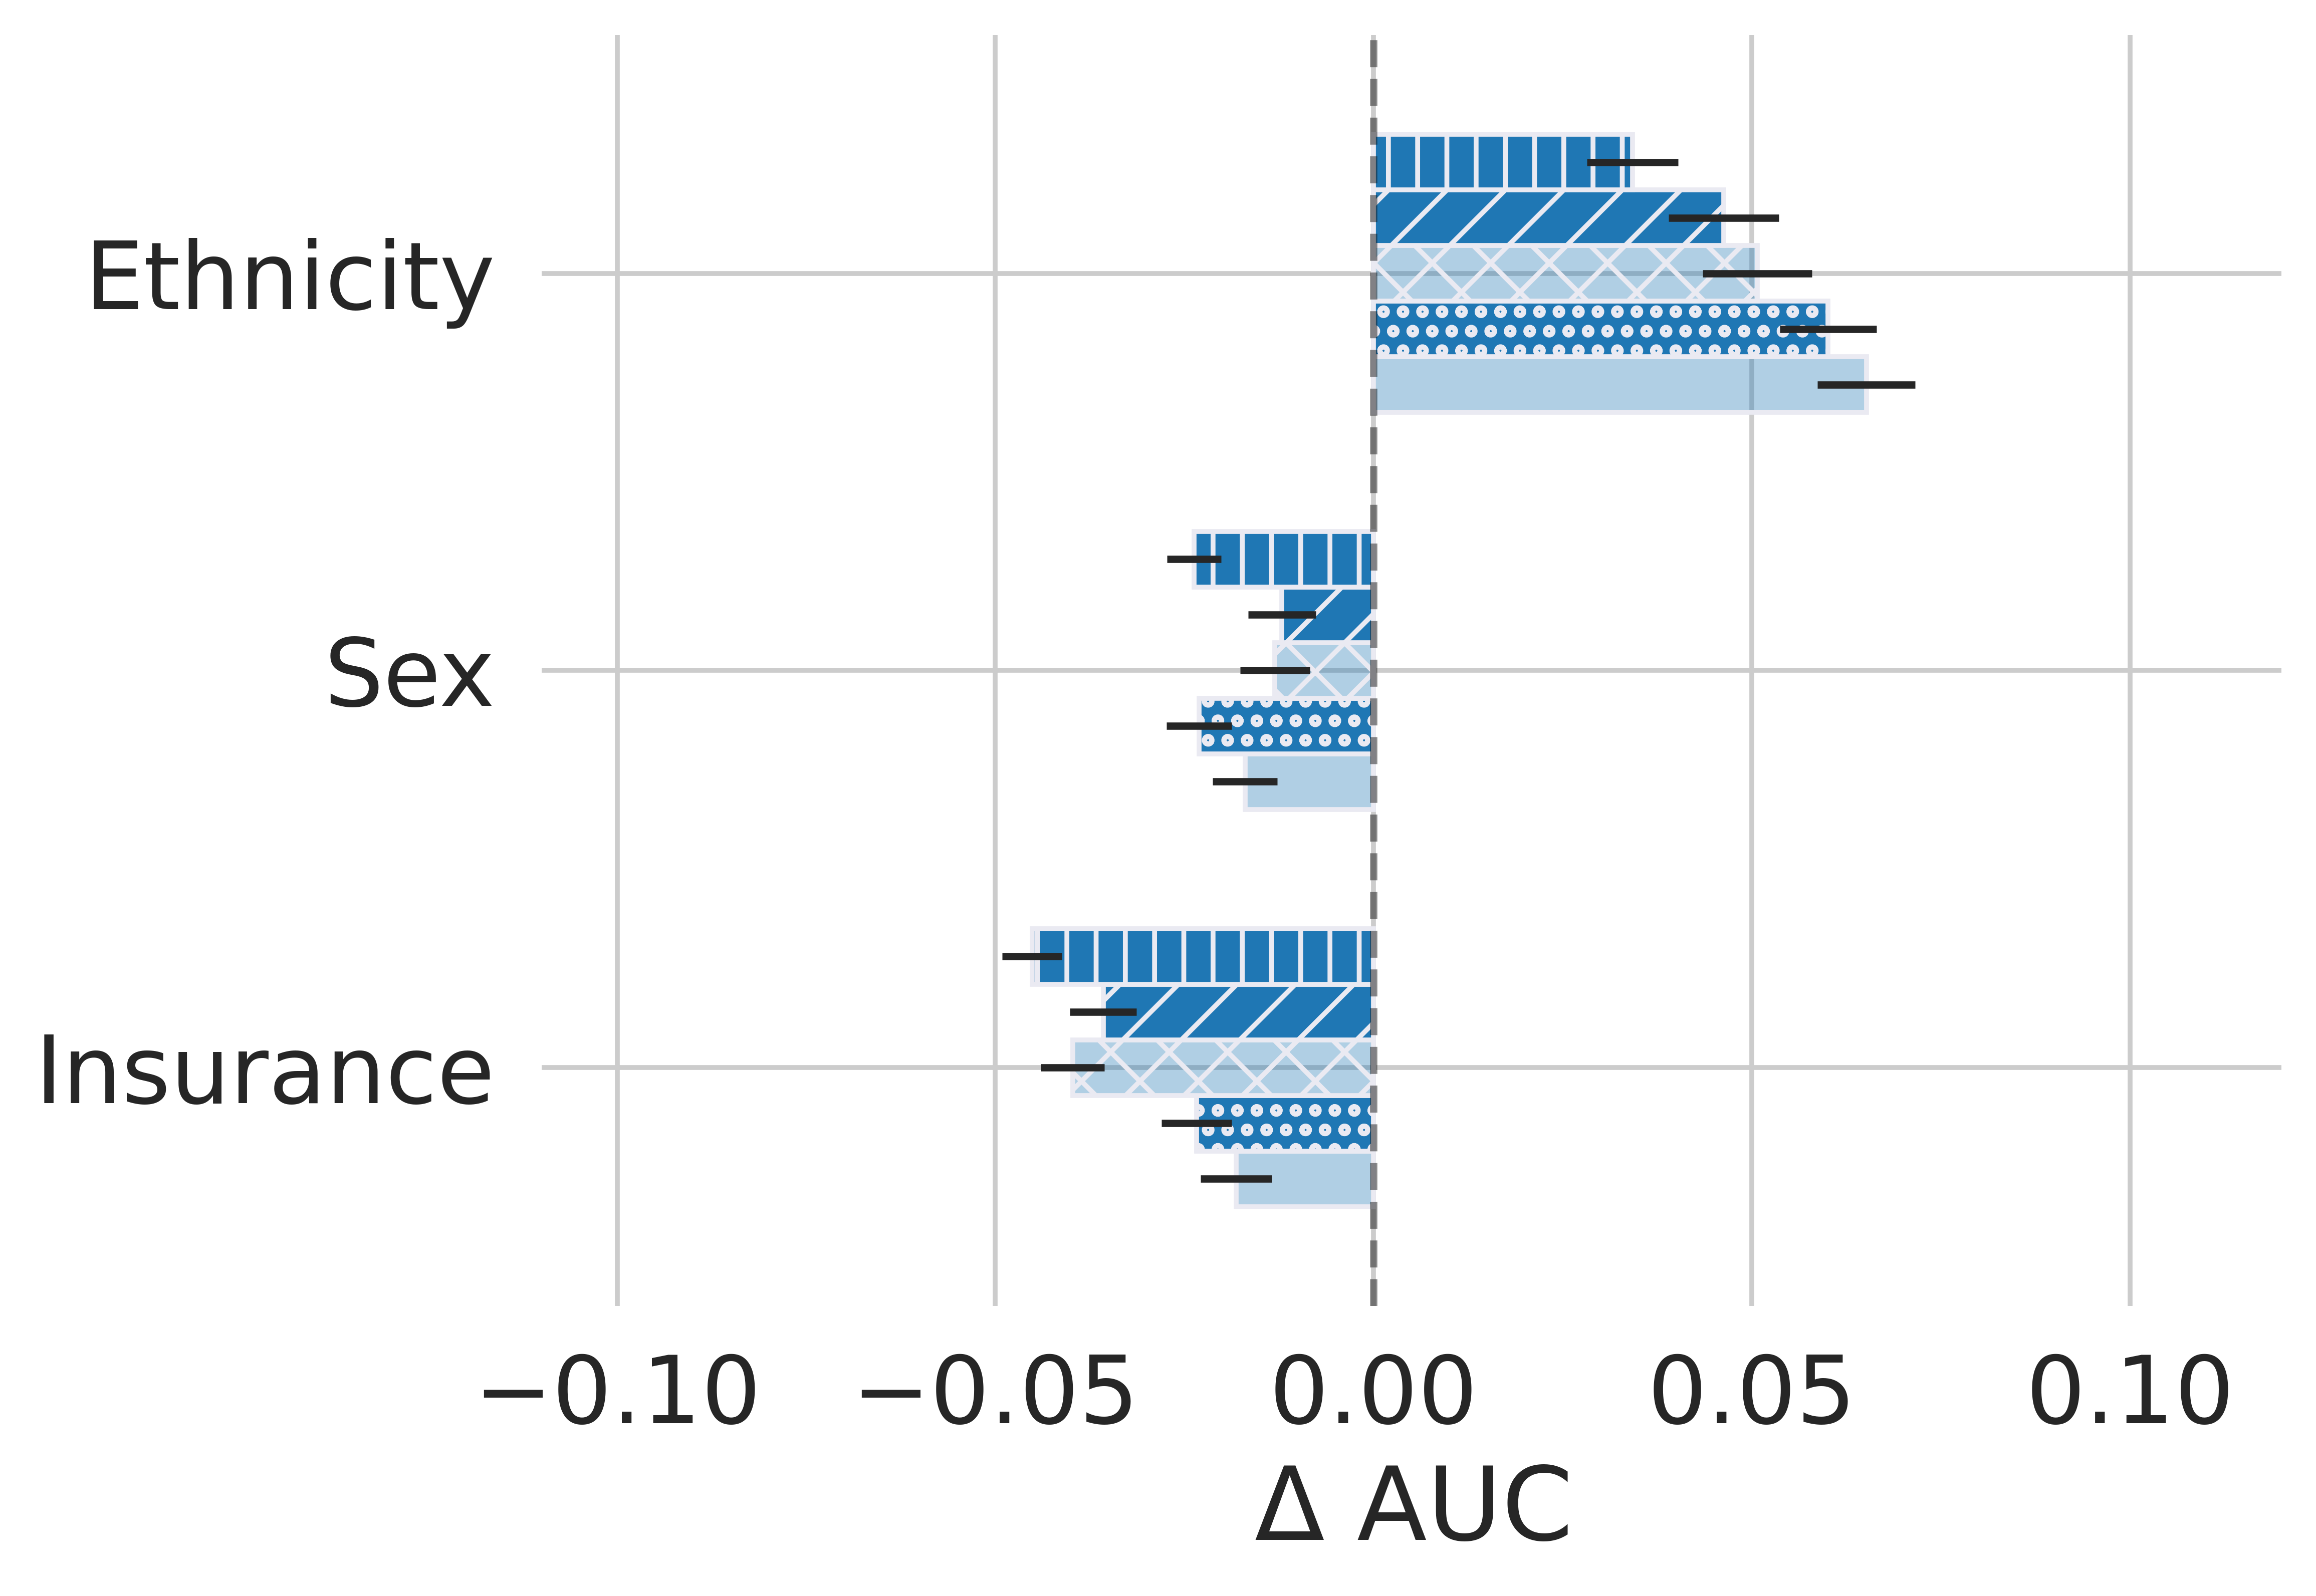
Insight 3.2: No imputation strategy consistently outperforms the others across groups.
In Figure 7, Group MICE Missing imputation would have the smallest AUC gap between ethnicity subgroups. However, note that using this strategy would result in the largest AUC gap when partitioning the population by insurance type. This observation shows that a given imputation strategy may be the most beneficial in terms of algorithmic fairness when considering one demographic attribute, while being the most detrimental with respect to another demographic attribute. Theorem 4.1 and Insight 2.2 demonstrate how the missingness process impacts the optimal imputation strategy for a given group. Expanding on these findings, this experiment reveals how, if different group partitions present different missingness processes, the optimal imputation strategy can be group dependent.
Insight 3.3: Current recommendations for group-specific imputation and use of missingness indicators can increase the performance gap and yield a worse performance for the marginalised groups.
Echoing Insight 2.3, using Group MICE Missing (containing the missingness indicator) results in a larger AUC gap than using Group MICE for the sex and insurance partitions, as shown in Figure 7’s left panel. Similarly, in considering insurance subgroups, the group imputation strategies present larger absolute FNR gaps in comparison to their population alternatives. As algorithmic fairness of prediction performance is a function of both the imputation choices and the unobserved missingness processes, common practices can be suboptimal under complex patterns of clinical missingness.
7 Discussion
In this section, we provide a summary of our contributions, recommendations, and future research directions stemming from this work.
7.1 Contributions
The fairness literature has explored how machine learning pipelines can reinforce biases present in data. Our work demonstrates how biases may be reflected, not only in what is present, but in what is absent from the data. This observation repositions the overlooked imputation step as critical for improved algorithmic fairness.
In the context of machine learning for health, interactions between patients and the healthcare system can result in group-specific missingness patterns that may impact downstream algorithmic fairness under different imputation strategies. We reviewed historical examples from the literature and characterised three distinct mechanisms leading to group-specific missingness. Our analysis demonstrated that no imputation strategy consistently provides better performances or algorithmic fairness properties, both in terms of reconstruction error and downstream performances. An imputation strategy providing an edge under one missingness process can under-perform in another. We provided evidence that common intuitions rarely hold under complex patterns of missingness. In particular, the imputation practice of controlling for, or stratifying by, group membership may counter-intuitively hurt algorithmic fairness and group-specific performance. Crucially, the algorithmic fairness properties associated with a machine learning pipeline are dependent upon the choice of imputation strategy and could be reversed by using another strategy. For instance, based on the same data, one imputation strategy could result in a pipeline with similar performance between groups, while another may present strong discrepancies against or in favour of a marginalised group. The experiments conducted using the MIMIC III dataset demonstrated the relevance of the identified problem as more than a merely theoretical concern, showing that group-specific missingness patterns are present in a widely used electronic health record dataset, and the choice of imputation strategy can drastically impact algorithmic fairness properties of a downstream prediction task.
Overlooking the importance of imputation has resulted in the current practice of relying on a single strategy and does not assess whether the algorithmic fairness properties of a predictive model are sensitive to the choice of imputation. Our analysis has critical repercussions on the study of algorithmic fairness in clinical predictive analyses in which practitioners can and must carefully consider the sensitivity of algorithmic fairness to the imputation step. While imputation’s reconstruction error and associated fairness gap cannot be evaluated in practice, its downstream predictive implications can be.
Critically, imputation affects both model development and evaluation. In settings where one can assume that the missingness process will remain the same during deployment, experimenting with different imputation strategies helps in selecting the strategy that yields better fairness conclusions. Meanwhile, if efforts are made to enhance data quality and reduce the amount of missing data at deployment, then assessing the downstream algorithmic fairness properties under different imputation strategies captures the uncertainty regarding the algorithmic fairness properties of the predictive model. In these settings, this assessment is essential for quantifying the confidence in a given analysis’s fairness conclusions. Our work illustrates the potential of sensitivity analysis in imputation strategies as a valuable tool when implementing data-driven prediction models in the presence of clinical missingness. We illustrate an example of this predictive group fairness sensitivity analysis in the MIMIC III experiments.
7.2 Recommendations
Contrary to current practice, missingness should not be considered as a disconnected problem, but rather as an integral part of our understanding of algorithmic fairness. Learning from medical data without sufficient attention to the potential disparities present in clinical missingness could reinforce and automatise inequities, and further harm historically marginalised groups. Particularly, our work calls for caution in imputation choice and its associated algorithmic fairness consequences, and shows that appropriate handling of missing data is important towards reducing health inequities. We invite practitioners to:
-
1.
Study the missingness process: if there is access to the upstream process generating the data, explore which assumptions best describe the missingness process. While MCAR and MAR assumptions present attractive theoretical guarantees, they may not apply in real-world clinical settings, as shown in Section 3.
-
2.
State the missingness assumptions: report assumptions made about the missingness process in preprocessing and modelling. The importance of explicitly stating assumptions underlying imputation done during preprocessing ought to be underscored, as these are rarely reported in current practice. Opacity on these assumptions often leads practitioners to not account for the observation process’s complexity. Clear communication of the underlying assumptions is critical for aligning methodological choices with clinical missingness, and also for defining the analysis’ scope and limitations.
-
3.
Consider differences in the missingness process between training and deployment: report how the missingness process is assumed to change at deployment time. In some cases, the missingness process may remain the same between the training and the deployment phases. In other cases, the missingness process may differ between these two phases. The latter may be especially true if the deployment of the model constitutes an incentive to collect more complete, higher-quality data. Considering this difference can guide the analysis and interpretation of the impact of imputation strategies on downstream predictions, as we detail in the next point.
-
4.
Evaluate the impact of different imputation strategies: measure the impact of different imputation strategies on the algorithmic fairness properties of a predictive model. Report the change in fairness conclusions one would observe under different imputation strategies. If the data quality is likely to improve at deployment, this sensitivity analysis quantifies the uncertainty in the fairness conclusions associated with the unknown missingness process. If the missingness process is likely to remain the same, this sensitivity analysis can guide model selection, and practitioners should select the one that achieves the most acceptable trade-off between performance and algorithmic fairness.
7.3 Future work
In future work, there are three axes of potential research. First, clinical missingness is only one dimension of how clinical presence shapes the data-generating process. The interaction between patients and the healthcare system not only imprints missingness, but it may also shape aspects such as the temporality of medical time series, which may similarly convey group-specific disparities that current machine learning pipelines may amplify. Second, the development of a toolbox for quantification of the uncertainty of the fairness conclusions associated with the missingness process would be valuable to express a model’s deployment risk. Third, this work focuses on the impact of imputation on algorithmic fairness. Future work can study the interplay between missingness and other stages of the machine learning pipeline, such as characterising how the model choice may interact with disparities in the missingness patterns.
Acknowledgements
Vincent Jeanselme acknowledges the support of The Alan Turing Institute’s Enrichment Scheme and the partial support of the UKRI Medical Research Council (MC_UU_00002/5 and MC_UU_00002/2). Maria De-Arteaga acknowledges the support of NIH through grant R01NS124642.
References
- [1] Vincent Jeanselme, Glen Martin, Niels Peek, Matthew Sperrin, Brian Tom, and Jessica Barrett. Deepjoint: Robust survival modelling under clinical presence shift. arXiv preprint arXiv:2205.13481, 2022.
- [2] Anis Sharafoddini, Joel A Dubin, David M Maslove, Joon Lee, et al. A new insight into missing data in intensive care unit patient profiles: observational study. JMIR medical informatics, 7(1):e11605, 2019.
- [3] Roderick J Little, Ralph D’Agostino, Michael L Cohen, Kay Dickersin, Scott S Emerson, John T Farrar, Constantine Frangakis, Joseph W Hogan, Geert Molenberghs, Susan A Murphy, et al. The prevention and treatment of missing data in clinical trials. New England Journal of Medicine, 367(14):1355–1360, 2012.
- [4] Nicole G Weiskopf, George Hripcsak, Sushmita Swaminathan, and Chunhua Weng. Defining and measuring completeness of electronic health records for secondary use. Journal of biomedical informatics, 46(5):830–836, 2013.
- [5] Nicole Gray Weiskopf and Chunhua Weng. Methods and dimensions of electronic health record data quality assessment: enabling reuse for clinical research. Journal of the American Medical Informatics Association, 20(1):144–151, 2013.
- [6] SWJ Nijman, AM Leeuwenberg, I Beekers, I Verkouter, JJL Jacobs, ML Bots, FW Asselbergs, KGM Moons, and TPA Debray. Missing data is poorly handled and reported in prediction model studies using machine learning: a literature review. Journal of Clinical Epidemiology, 142:218–229, 2022.
- [7] Richard J Chen, Tiffany Y Chen, Jana Lipkova, Judy J Wang, Drew FK Williamson, Ming Y Lu, Sharifa Sahai, and Faisal Mahmood. Algorithm fairness in ai for medicine and healthcare. arXiv preprint arXiv:2110.00603, 2021.
- [8] Harold P Freeman and Richard Payne. Racial injustice in health care, 2000.
- [9] Vincent Jeanselme, Maria De-Arteaga, Jonathan Elmer, Sarah M Perman, and Artur Dubrawski. Sex differences in post cardiac arrest discharge locations. Resuscitation plus, 8:100185, 2021.
- [10] Luke K Kim, Patrick Looser, Rajesh V Swaminathan, James Horowitz, Oren Friedman, Ji Hae Shin, Robert M Minutello, Geoffrey Bergman, Harsimran Singh, S Chiu Wong, et al. Sex-based disparities in incidence, treatment, and outcomes of cardiac arrest in the united states, 2003–2012. Journal of the American Heart Association, 5(6):e003704, 2016.
- [11] Keith Norris and Allen R Nissenson. Race, gender, and socioeconomic disparities in ckd in the united states. Journal of the American Society of Nephrology, 19(7):1261–1270, 2008.
- [12] Jielu Lin, Christopher S Marcum, Melanie F Myers, and Laura M Koehly. Racial differences in family health history knowledge of type 2 diabetes: exploring the role of interpersonal mechanisms. Translational Behavioral Medicine, 8(4):540–549, 2018.
- [13] Jason S Haukoos and Craig D Newgard. Advanced statistics: missing data in clinical research—part 1: an introduction and conceptual framework. Academic Emergency Medicine, 14(7):662–668, 2007.
- [14] Jiang Li, Xiaowei S Yan, Durgesh Chaudhary, Venkatesh Avula, Satish Mudiganti, Hannah Husby, Shima Shahjouei, Ardavan Afshar, Walter F Stewart, Mohammed Yeasin, et al. Imputation of missing values for electronic health record laboratory data. NPJ digital medicine, 4(1):147, 2021.
- [15] Virginia J Howard, Dawn O Kleindorfer, Suzanne E Judd, Leslie A McClure, Monika M Safford, J David Rhodes, Mary Cushman, Claudia S Moy, Elsayed Z Soliman, Brett M Kissela, et al. Disparities in stroke incidence contributing to disparities in stroke mortality. Annals of neurology, 69(4):619–627, 2011.
- [16] Roderick JA Little and Donald B Rubin. Statistical analysis with missing data, volume 793. John Wiley & Sons, 2019.
- [17] Roderick JA Little and Donald B Rubin. The analysis of social science data with missing values. Sociological Methods & Research, 18(2-3):292–326, 1989.
- [18] Gustavo EAPA Batista, Maria Carolina Monard, et al. A study of k-nearest neighbour as an imputation method. His, 87(251-260):48, 2002.
- [19] Dimitris Bertsimas, Agni Orfanoudaki, and Colin Pawlowski. Imputation of clinical covariates in time series. Machine Learning, 110(1):185–248, 2021.
- [20] Craig D Newgard and Roger J Lewis. Missing data: how to best account for what is not known. Jama, 314(9):940–941, 2015.
- [21] Donald B Rubin. Multiple imputation for nonresponse in surveys, volume 81. John Wiley & Sons, 2004.
- [22] Ian R White, Patrick Royston, and Angela M Wood. Multiple imputation using chained equations: issues and guidance for practice. Statistics in medicine, 30(4):377–399, 2011.
- [23] Brett K Beaulieu-Jones, Daniel R Lavage, John W Snyder, Jason H Moore, Sarah A Pendergrass, and Christopher R Bauer. Characterizing and managing missing structured data in electronic health records: data analysis. JMIR medical informatics, 6(1):e8960, 2018.
- [24] Derrick A Bennett. How can i deal with missing data in my study? Australian and New Zealand journal of public health, 25(5):464–469, 2001.
- [25] Lehana Thabane, Lawrence Mbuagbaw, Shiyuan Zhang, Zainab Samaan, Maura Marcucci, Chenglin Ye, Marroon Thabane, Lora Giangregorio, Brittany Dennis, Daisy Kosa, et al. A tutorial on sensitivity analyses in clinical trials: the what, why, when and how. BMC medical research methodology, 13(1):1–12, 2013.
- [26] Angela M Wood, Ian R White, and Simon G Thompson. Are missing outcome data adequately handled? a review of published randomized controlled trials in major medical journals. Clinical trials, 1(4):368–376, 2004.
- [27] Uri Kartoun, Shaan Khurshid, Bum Chul Kwon, Aniruddh P Patel, Puneet Batra, Anthony Philippakis, Amit V Khera, Patrick T Ellinor, Steven A Lubitz, and Kenney Ng. Prediction performance and fairness heterogeneity in cardiovascular risk models. Scientific Reports, 12(1):12542, 2022.
- [28] Michelle Van Ryn. Research on the provider contribution to race/ethnicity disparities in medical care. Medical care, pages I140–I151, 2002.
- [29] Alexandra Chouldechova and Aaron Roth. A snapshot of the frontiers of fairness in machine learning. Communications of the ACM, 63(5):82–89, 2020.
- [30] Irene Y Chen, Emma Pierson, Sherri Rose, Shalmali Joshi, Kadija Ferryman, and Marzyeh Ghassemi. Ethical machine learning in healthcare. Annual Review of Biomedical Data Science, 4, 2020.
- [31] Shira Mitchell, Eric Potash, Solon Barocas, Alexander D’Amour, and Kristian Lum. Algorithmic fairness: Choices, assumptions, and definitions. Annual Review of Statistics and Its Application, 8:141–163, 2021.
- [32] Sahil Verma and Julia Rubin. Fairness definitions explained. In 2018 ieee/acm international workshop on software fairness (fairware), pages 1–7. IEEE, 2018.
- [33] Cynthia Dwork, Moritz Hardt, Toniann Pitassi, Omer Reingold, and Richard Zemel. Fairness through awareness. In Proceedings of the 3rd innovations in theoretical computer science conference, pages 214–226, 2012.
- [34] Matt J Kusner, Joshua Loftus, Chris Russell, and Ricardo Silva. Counterfactual fairness. Advances in neural information processing systems, 30, 2017.
- [35] Razieh Nabi and Ilya Shpitser. Fair inference on outcomes. In Proceedings of the AAAI Conference on Artificial Intelligence, volume 32, 2018.
- [36] Moritz Hardt, Eric Price, and Nati Srebro. Equality of opportunity in supervised learning. Advances in neural information processing systems, 29, 2016.
- [37] Alexandra Chouldechova. Fair prediction with disparate impact: A study of bias in recidivism prediction instruments. Big data, 5(2):153–163, 2017.
- [38] Alvin Rajkomar, Michaela Hardt, Michael D Howell, Greg Corrado, and Marshall H Chin. Ensuring fairness in machine learning to advance health equity. Annals of internal medicine, 169(12):866–872, 2018.
- [39] Alexandra Chouldechova, Diana Benavides-Prado, Oleksandr Fialko, and Rhema Vaithianathan. A case study of algorithm-assisted decision making in child maltreatment hotline screening decisions. In Conference on Fairness, Accountability and Transparency, pages 134–148. PMLR, 2018.
- [40] Anthony W Flores, Kristin Bechtel, and Christopher T Lowenkamp. False positives, false negatives, and false analyses: A rejoinder to machine bias: There’s software used across the country to predict future criminals. and it’s biased against blacks. Fed. Probation, 80:38, 2016.
- [41] Alejandro Noriega-Campero, Michiel A Bakker, Bernardo Garcia-Bulle, and Alex’Sandy’ Pentland. Active fairness in algorithmic decision making. In Proceedings of the 2019 AAAI/ACM Conference on AI, Ethics, and Society, pages 77–83, 2019.
- [42] Irene Chen, Fredrik D Johansson, and David Sontag. Why is my classifier discriminatory? Advances in Neural Information Processing Systems, 31, 2018.
- [43] Irene Y Chen, Peter Szolovits, and Marzyeh Ghassemi. Can ai help reduce disparities in general medical and mental health care? AMA journal of ethics, 21(2):167–179, 2019.
- [44] Stephen Pfohl, Ben Marafino, Adrien Coulet, Fatima Rodriguez, Latha Palaniappan, and Nigam H Shah. Creating fair models of atherosclerotic cardiovascular disease risk. In Proceedings of the 2019 AAAI/ACM Conference on AI, Ethics, and Society, pages 271–278, 2019.
- [45] Laleh Seyyed-Kalantari, Guanxiong Liu, Matthew McDermott, Irene Y Chen, and Marzyeh Ghassemi. Chexclusion: Fairness gaps in deep chest x-ray classifiers. In BIOCOMPUTING 2021: proceedings of the Pacific symposium, pages 232–243. World Scientific, 2020.
- [46] Haoran Zhang, Amy X Lu, Mohamed Abdalla, Matthew McDermott, and Marzyeh Ghassemi. Hurtful words: quantifying biases in clinical contextual word embeddings. In proceedings of the ACM Conference on Health, Inference, and Learning, pages 110–120, 2020.
- [47] Faisal Kamiran and Toon Calders. Classification with no discrimination by preferential sampling. In Proc. 19th Machine Learning Conf. Belgium and The Netherlands, volume 1. Citeseer, 2010.
- [48] Toshihiro Kamishima, Shotaro Akaho, and Jun Sakuma. Fairness-aware learning through regularization approach. In 2011 IEEE 11th International Conference on Data Mining Workshops, pages 643–650. IEEE, 2011.
- [49] Solon Barocas and Andrew D Selbst. Big data’s disparate impact. California law review, pages 671–732, 2016.
- [50] Fernando Martínez-Plumed, Cèsar Ferri, David Nieves, and José Hernández-Orallo. Fairness and missing values. arXiv preprint arXiv:1905.12728, 2019.
- [51] Christian Fricke et al. Missing fairness: The discriminatory effect of missing values in datasets on fairness in machine learning, 2020.
- [52] Emily Getzen, Lyle Ungar, Danielle Mowery, Xiaoqian Jiang, and Qi Long. Mining for equitable health: Assessing the impact of missing data in electronic health records. medRxiv, 2022.
- [53] Yanchen Wang and Lisa Singh. Analyzing the impact of missing values and selection bias on fairness. International Journal of Data Science and Analytics, 12(2):101–119, 2021.
- [54] Kartik K Ganju, Hilal Atasoy, Jeffery McCullough, and Brad Greenwood. The role of decision support systems in attenuating racial biases in healthcare delivery. Management science, 66(11):5171–5181, 2020.
- [55] Simon Caton, Saiteja Malisetty, and Christian Haas. Impact of imputation strategies on fairness in machine learning. Journal of Artificial Intelligence Research, 74:1011–1035, 2022.
- [56] Yiliang Zhang and Qi Long. Fairness in missing data imputation. arXiv preprint arXiv:2110.12002, 2021.
- [57] Haewon Jeong, Hao Wang, and Flavio P Calmon. Fairness without imputation: A decision tree approach for fair prediction with missing values. In Proceedings of the AAAI Conference on Artificial Intelligence, volume 36, pages 9558–9566, 2022.
- [58] Muhammad Aurangzeb Ahmad, Carly Eckert, and Ankur Teredesai. The challenge of imputation in explainable artificial intelligence models. arXiv preprint arXiv:1907.12669, 2019.
- [59] Marzyeh Ghassemi, Tristan Naumann, Peter Schulam, Andrew L Beam, Irene Y Chen, and Rajesh Ranganath. A review of challenges and opportunities in machine learning for health. AMIA Summits on Translational Science Proceedings, 2020:191, 2020.
- [60] Milena A Gianfrancesco, Suzanne Tamang, Jinoos Yazdany, and Gabriela Schmajuk. Potential biases in machine learning algorithms using electronic health record data. JAMA internal medicine, 178(11):1544–1547, 2018.
- [61] Robin Mitra, Sarah F McGough, Tapabrata Chakraborti, Chris Holmes, Ryan Copping, Niels Hagenbuch, Stefanie Biedermann, Jack Noonan, Brieuc Lehmann, Aditi Shenvi, et al. Learning from data with structured missingness. Nature Machine Intelligence, 5(1):13–23, 2023.
- [62] Debasis Barik and Amit Thorat. Issues of unequal access to public health in india. Frontiers in public health, 3:245, 2015.
- [63] Catherine Hoffman and Julia Paradise. Health insurance and access to health care in the united states. Annals of the New York Academy of Sciences, 1136(1):149–160, 2008.
- [64] Ala Szczepura. Access to health care for ethnic minority populations. Postgraduate medical journal, 81(953):141–147, 2005.
- [65] Yu-Kai Lin, Mingfeng Lin, and Hsinchun Chen. Do electronic health records affect quality of care? evidence from the hitech act. Information Systems Research, 30(1):306–318, 2019.
- [66] Joel S Weissman, Robert Stern, Stephen L Fielding, and Arnold M Epstein. Delayed access to health care: risk factors, reasons, and consequences, 1991.
- [67] Kyle T Smith, Denise Monti, Nageen Mir, Ellen Peters, Renuka Tipirneni, and Mary C Politi. Access is necessary but not sufficient: factors influencing delay and avoidance of health care services. MDM Policy & Practice, 3(1):2381468318760298, 2018.
- [68] N Arnould, O Pouget, M Gharbi, and JP Brettes. Breast cancer in men: are there similarities with breast cancer in women? Gynecologie, Obstetrique & Fertilite, 34(5):413–419, 2006.
- [69] Sharon H Giordano. Breast cancer in men. New England Journal of Medicine, 378(24):2311–2320, 2018.
- [70] Birgit Vogel, Monica Acevedo, Yolande Appelman, C Noel Bairey Merz, Alaide Chieffo, Gemma A Figtree, Mayra Guerrero, Vijay Kunadian, Carolyn SP Lam, Angela HEM Maas, et al. The lancet women and cardiovascular disease commission: reducing the global burden by 2030. The Lancet, 397(10292):2385–2438, 2021.
- [71] Hugh M Gloster Jr and Kenneth Neal. Skin cancer in skin of color. Journal of the American Academy of Dermatology, 55(5):741–760, 2006.
- [72] Judith Gould and Jacqui Ashton-Smith. Missed diagnosis or misdiagnosis? girls and women on the autism spectrum. Good Autism Practice (GAP), 12(1):34–41, 2011.
- [73] Metin Yalaza, Aydın İnan, and Mikdat Bozer. Male breast cancer. The journal of breast health, 12(1):1, 2016.
- [74] Mariana Garcia, Sharon L Mulvagh, C Noel Bairey Merz, Julie E Buring, and JoAnn E Manson. Cardiovascular disease in women: clinical perspectives. Circulation research, 118(8):1273–1293, 2016.
- [75] Jinan Zeidan, Eric Fombonne, Julie Scorah, Alaa Ibrahim, Maureen S Durkin, Shekhar Saxena, Afiqah Yusuf, Andy Shih, and Mayada Elsabbagh. Global prevalence of autism: A systematic review update. Autism Research, 15(5):778–790, 2022.
- [76] Franck Mauvais-Jarvis, Noel Bairey Merz, Peter J Barnes, Roberta D Brinton, Juan-Jesus Carrero, Dawn L DeMeo, Geert J De Vries, C Neill Epperson, Ramaswamy Govindan, Sabra L Klein, et al. Sex and gender: modifiers of health, disease, and medicine. The Lancet, 396(10250):565–582, 2020.
- [77] Seongkum Heo, Mi-Seung Shin, Seon Young Hwang, Minjeong An, Jin-Kyu Park, SunHwa Kim, Jae Lan Shim, and JinShil Kim. Sex differences in heart failure symptoms and factors associated with heart failure symptoms. Journal of Cardiovascular Nursing, 34(4):306–312, 2019.
- [78] Anna Strömberg and Jan Mårtensson. Gender differences in patients with heart failure. European Journal of Cardiovascular Nursing, 2(1):7–18, 2003.
- [79] Denis Agniel, Isaac S Kohane, and Griffin M Weber. Biases in electronic health record data due to processes within the healthcare system: retrospective observational study. Bmj, 361, 2018.
- [80] Rose Sisk, Lijing Lin, Matthew Sperrin, Jessica K Barrett, Brian Tom, Karla Diaz-Ordaz, Niels Peek, and Glen P Martin. Informative presence and observation in routine health data: A review of methodology for clinical risk prediction. Journal of the American Medical Informatics Association, 2020.
- [81] Brian J Wells, Kevin M Chagin, Amy S Nowacki, and Michael W Kattan. Strategies for handling missing data in electronic health record derived data. Egems, 1(3), 2013.
- [82] Alexander Rusanov, Nicole G Weiskopf, Shuang Wang, and Chunhua Weng. Hidden in plain sight: bias towards sick patients when sampling patients with sufficient electronic health record data for research. BMC medical informatics and decision making, 14(1):51, 2014.
- [83] Nicole G Weiskopf, Alex Rusanov, and Chunhua Weng. Sick patients have more data: the non-random completeness of electronic health records. In AMIA Annual Symposium Proceedings, volume 2013, page 1472. American Medical Informatics Association, 2013.
- [84] BD Nicholson, P Aveyard, CR Bankhead, W Hamilton, FDR Hobbs, and S Lay-Flurrie. Determinants and extent of weight recording in uk primary care: an analysis of 5 million adults’ electronic health records from 2000 to 2017. BMC medicine, 17(1):1–11, 2019.
- [85] Karthika Mohan and Judea Pearl. Graphical models for processing missing data. Journal of the American Statistical Association, 116(534):1023–1037, 2021.
- [86] Carolyn SP Lam, Clare Arnott, Anna L Beale, Chanchal Chandramouli, Denise Hilfiker-Kleiner, David M Kaye, Bonnie Ky, Bernadet T Santema, Karen Sliwa, and Adriaan A Voors. Sex differences in heart failure. European heart journal, 40(47):3859–3868c, 2019.
- [87] Keith B Burt, Robert Whelan, Patricia J Conrod, Tobias Banaschewski, Gareth J Barker, Arun LW Bokde, Uli Bromberg, Christian Büchel, Mira Fauth-Bühler, Herta Flor, et al. Structural brain correlates of adolescent resilience. Journal of Child Psychology and Psychiatry, 57(11):1287–1296, 2016.
- [88] Matthew Chun, Robert Clarke, Tingting Zhu, David Clifton, Derrick Bennett, Yiping Chen, Yu Guo, Pei Pei, Jun Lv, Canqing Yu, et al. Utility of single versus sequential measurements of risk factors for prediction of stroke in chinese adults. Scientific reports, 11(1):17575, 2021.
- [89] Mette S Nielsen, Bodil Just Christensen, Julie Berg Schmidt, Louise Tækker, Lotte Holm, Susanne Lunn, Christian Ritz, Nicolai J Wewer Albrechtsen, Jens Juul Holst, Theresia M Schnurr, et al. Predictors of weight loss after bariatric surgery—a cross-disciplinary approach combining physiological, social, and psychological measures. International Journal of Obesity, 44(11):2291–2302, 2020.
- [90] Kristel JM Janssen, A Rogier T Donders, Frank E Harrell Jr, Yvonne Vergouwe, Qingxia Chen, Diederick E Grobbee, and Karel GM Moons. Missing covariate data in medical research: to impute is better than to ignore. Journal of clinical epidemiology, 63(7):721–727, 2010.
- [91] Craig D Newgard and Jason S Haukoos. Advanced statistics: missing data in clinical research—part 2: multiple imputation. Academic Emergency Medicine, 14(7):669–678, 2007.
- [92] Xiao-Hua Zhou, George J Eckert, and William M Tierney. Multiple imputation in public health research. Statistics in medicine, 20(9-10):1541–1549, 2001.
- [93] Rolf HH Groenwold. Informative missingness in electronic health record systems: the curse of knowing. Diagnostic and prognostic research, 4(1):1–6, 2020.
- [94] Zachary C Lipton, David Kale, and Randall Wetzel. Directly modeling missing data in sequences with rnns: Improved classification of clinical time series. In Machine Learning for Healthcare Conference, pages 253–270, 2016.
- [95] Maytal Saar-Tsechansky and Foster Provost. Handling missing values when applying classification models. Journal of Machine Learning Research, 2007.
- [96] Matthew Sperrin, Glen P Martin, Rose Sisk, and Niels Peek. Missing data should be handled differently for prediction than for description or causal explanation. Journal of Clinical Epidemiology, 125:183–187, 2020.
- [97] Agostina J Larrazabal, Nicolás Nieto, Victoria Peterson, Diego H Milone, and Enzo Ferrante. Gender imbalance in medical imaging datasets produces biased classifiers for computer-aided diagnosis. Proceedings of the National Academy of Sciences, 117(23):12592–12594, 2020.
- [98] Eliane Röösli, Selen Bozkurt, and Tina Hernandez-Boussard. Peeking into a black box, the fairness and generalizability of a mimic-iii benchmarking model. Scientific Data, 9(1):1–13, 2022.
- [99] Haoran Zhang, Natalie Dullerud, Karsten Roth, Lauren Oakden-Rayner, Stephen Pfohl, and Marzyeh Ghassemi. Improving the fairness of chest x-ray classifiers. In Gerardo Flores, George H Chen, Tom Pollard, Joyce C Ho, and Tristan Naumann, editors, Proceedings of the Conference on Health, Inference, and Learning, volume 174 of Proceedings of Machine Learning Research, pages 204–233. PMLR, 07–08 Apr 2022.
- [100] Alistair EW Johnson, Tom J Pollard, Lu Shen, H Lehman Li-Wei, Mengling Feng, Mohammad Ghassemi, Benjamin Moody, Peter Szolovits, Leo Anthony Celi, and Roger G Mark. Mimic-iii, a freely accessible critical care database. Scientific data, 3(1):1–9, 2016.
- [101] Shirly Wang, Matthew BA McDermott, Geeticka Chauhan, Marzyeh Ghassemi, Michael C Hughes, and Tristan Naumann. Mimic-extract: A data extraction, preprocessing, and representation pipeline for mimic-iii. In Proceedings of the ACM Conference on Health, Inference, and Learning, pages 222–235, 2020.
- [102] Chirag Nagpal, Vincent Jeanselme, and Artur Dubrawski. Deep parametric time-to-event regression with time-varying covariates. In Russell Greiner, Neeraj Kumar, Thomas Alexander Gerds, and Mihaela van der Schaar, editors, Proceedings of AAAI Spring Symposium on Survival Prediction - Algorithms, Challenges, and Applications 2021, volume 146 of Proceedings of Machine Learning Research, pages 184–193. PMLR, 22–24 Mar 2021.
- [103] Evan J Tsiklidis, Talid Sinno, and Scott L Diamond. Predicting risk for trauma patients using static and dynamic information from the mimic iii database. Plos one, 17(1):e0262523, 2022.
- [104] Jinghong Xu, Li Tong, Jiyou Yao, Zilu Guo, Ka Yin Lui, XiaoGuang Hu, Lu Cao, Yanping Zhu, Fa Huang, Xiangdong Guan, et al. Association of sex with clinical outcome in critically ill sepsis patients: a retrospective analysis of the large clinical database mimic-iii. Shock (Augusta, Ga.), 52(2):146, 2019.
- [105] Todd G. Nick and Kathleen M. Campbell. Logistic Regression, pages 273–301. Humana Press, Totowa, NJ, 2007.
- [106] Benjamin A Goldstein, Ann Marie Navar, Michael J Pencina, and John Ioannidis. Opportunities and challenges in developing risk prediction models with electronic health records data: a systematic review. Journal of the American Medical Informatics Association, 24(1):198–208, 2017.
Appendix A Proofs
In this section, we demonstrate the theoretical results introduced in Section 4.
Notations.
Consider an imputation strategy that replaces missing data with a constant value for the group . Our work analyses , the group-specific reconstruction error for imputation , and , the gap in reconstruction error between group and the rest of the population.
All capital letters stand for random variables: for group membership, for the observation process and for the covariates. Throughout the proofs, we characterise the missingness process with , the unobserved correlation between the observation indicator and the ground truth covariate values, and , the observation rate in the group . The covariate is described with for its mean, for its variance. Exponent expresses an observed quantity. Subscript indicates subgroup characteristics.
Finally, the population is defined by the ratio of members in group in comparison to the rest of the population, i.e., .
A.1 Theorem 4.1
Theorem.
Assuming i.i.d. data points , one can express the reconstruction error in group resulting from group mean imputation as:
| (5) |
where the missingness process is represented through (i) , the unobserved correlation between the observation indicator and the ground truth covariate values and (ii) , the observation rate in group , which is observable. Other values impacting the reconstruction error are reflective of the underlying covariate distribution. This includes , the ground truth variance of the covariate in the group ; and , the variance of the unobserved values of this same group.
Under the same assumptions, one can compute the reconstruction error in a group using population mean imputation as a function of the previously-defined quantity :
| (6) |
Proof.
Proof. First, we express the reconstruction error of a constant imputation strategy considering each covariate independently. For clarity, we denote by if , if .
| (7) |
Remark.
This first expression demonstrates that the reconstruction error of any constant imputation is lower bounded by the variance of the unobserved data: these constant strategies do not capture any of this variance.
Using this decomposition, we further explore how group mean imputation impacts the reconstruction error. As a reminder, group mean imputation replaces missing values in group with the observed group mean, i.e., . The square root of the first term in Equation (7), that we refer as , therefore simplifies to:
| (By definition of covariance) | ||||
Similarly, in the context of population mean imputation, which replaces the missing values with the observed mean, i.e., , results in the simplification of the first term as:
One can further decompose this equality to disentangle distributions’ properties from missingness processes:
| (By Bayes rule) | ||||
| (8) |
with , the proportion of patients member of group , and , the overall observation rate, i.e. . This last expression is obtained by a decomposition of similar to the one proposed for the computation of . ∎
A.2 Theorem 4.2
Theorem.
The group reconstruction error resulting from group mean imputation is larger than the one resulting from population mean imputation, i.e. , iff one of the following conditions holds:
| (9) |
Proof.
Proof. This inequality can be rewritten as:
To demonstrate this inequality, we explore the four different cases.
Case 1: and
Case 2: and
Case 3: and
Case 4: and
Combining cases 1 and 2, and cases 3 and 4 lead to:
∎
A.3 Theorem 4.3
Theorem.
Under the simplifying assumptions , and , both imputation strategies penalise the marginalised group and the reconstruction gap is larger for the group imputation than the population one (i.e., ) iff:
| or | |||
with , the ratio of the population belonging to group , , , and .
Proof.
Proof. Let consider these following two expressions and separately. First, consider the expression , this can further be expressed as follows:
Using Equation (8), this corresponds to:
Assuming results in :
with ,
and , .
Second, consider , we focus on the case in which both components are positive. The equivalence is obtained by considering the complementary case in which both components are negative.
| (Assuming ) | ||||
with and .
Therefore is equivalent to satisfy the following set of equations:
| or | |||
∎
Example.
Consider a dataset with the following observed characteristics: observed means and , the marginalised group ratio , and the observation rates: and . Further, we assume the underlying data characteristic , and . Figure 8 illustrates the theoretical fairness gap difference and the area satisfying the previous theorems under varying missingness characteristics and .
This example provides evidence that for a set of observed characteristics, the problem of the optimal imputation strategy from a reconstruction error point of view is under-determined. Specifically, two missingness processes could lead to the same observed data characteristics but impact which imputation to choose.
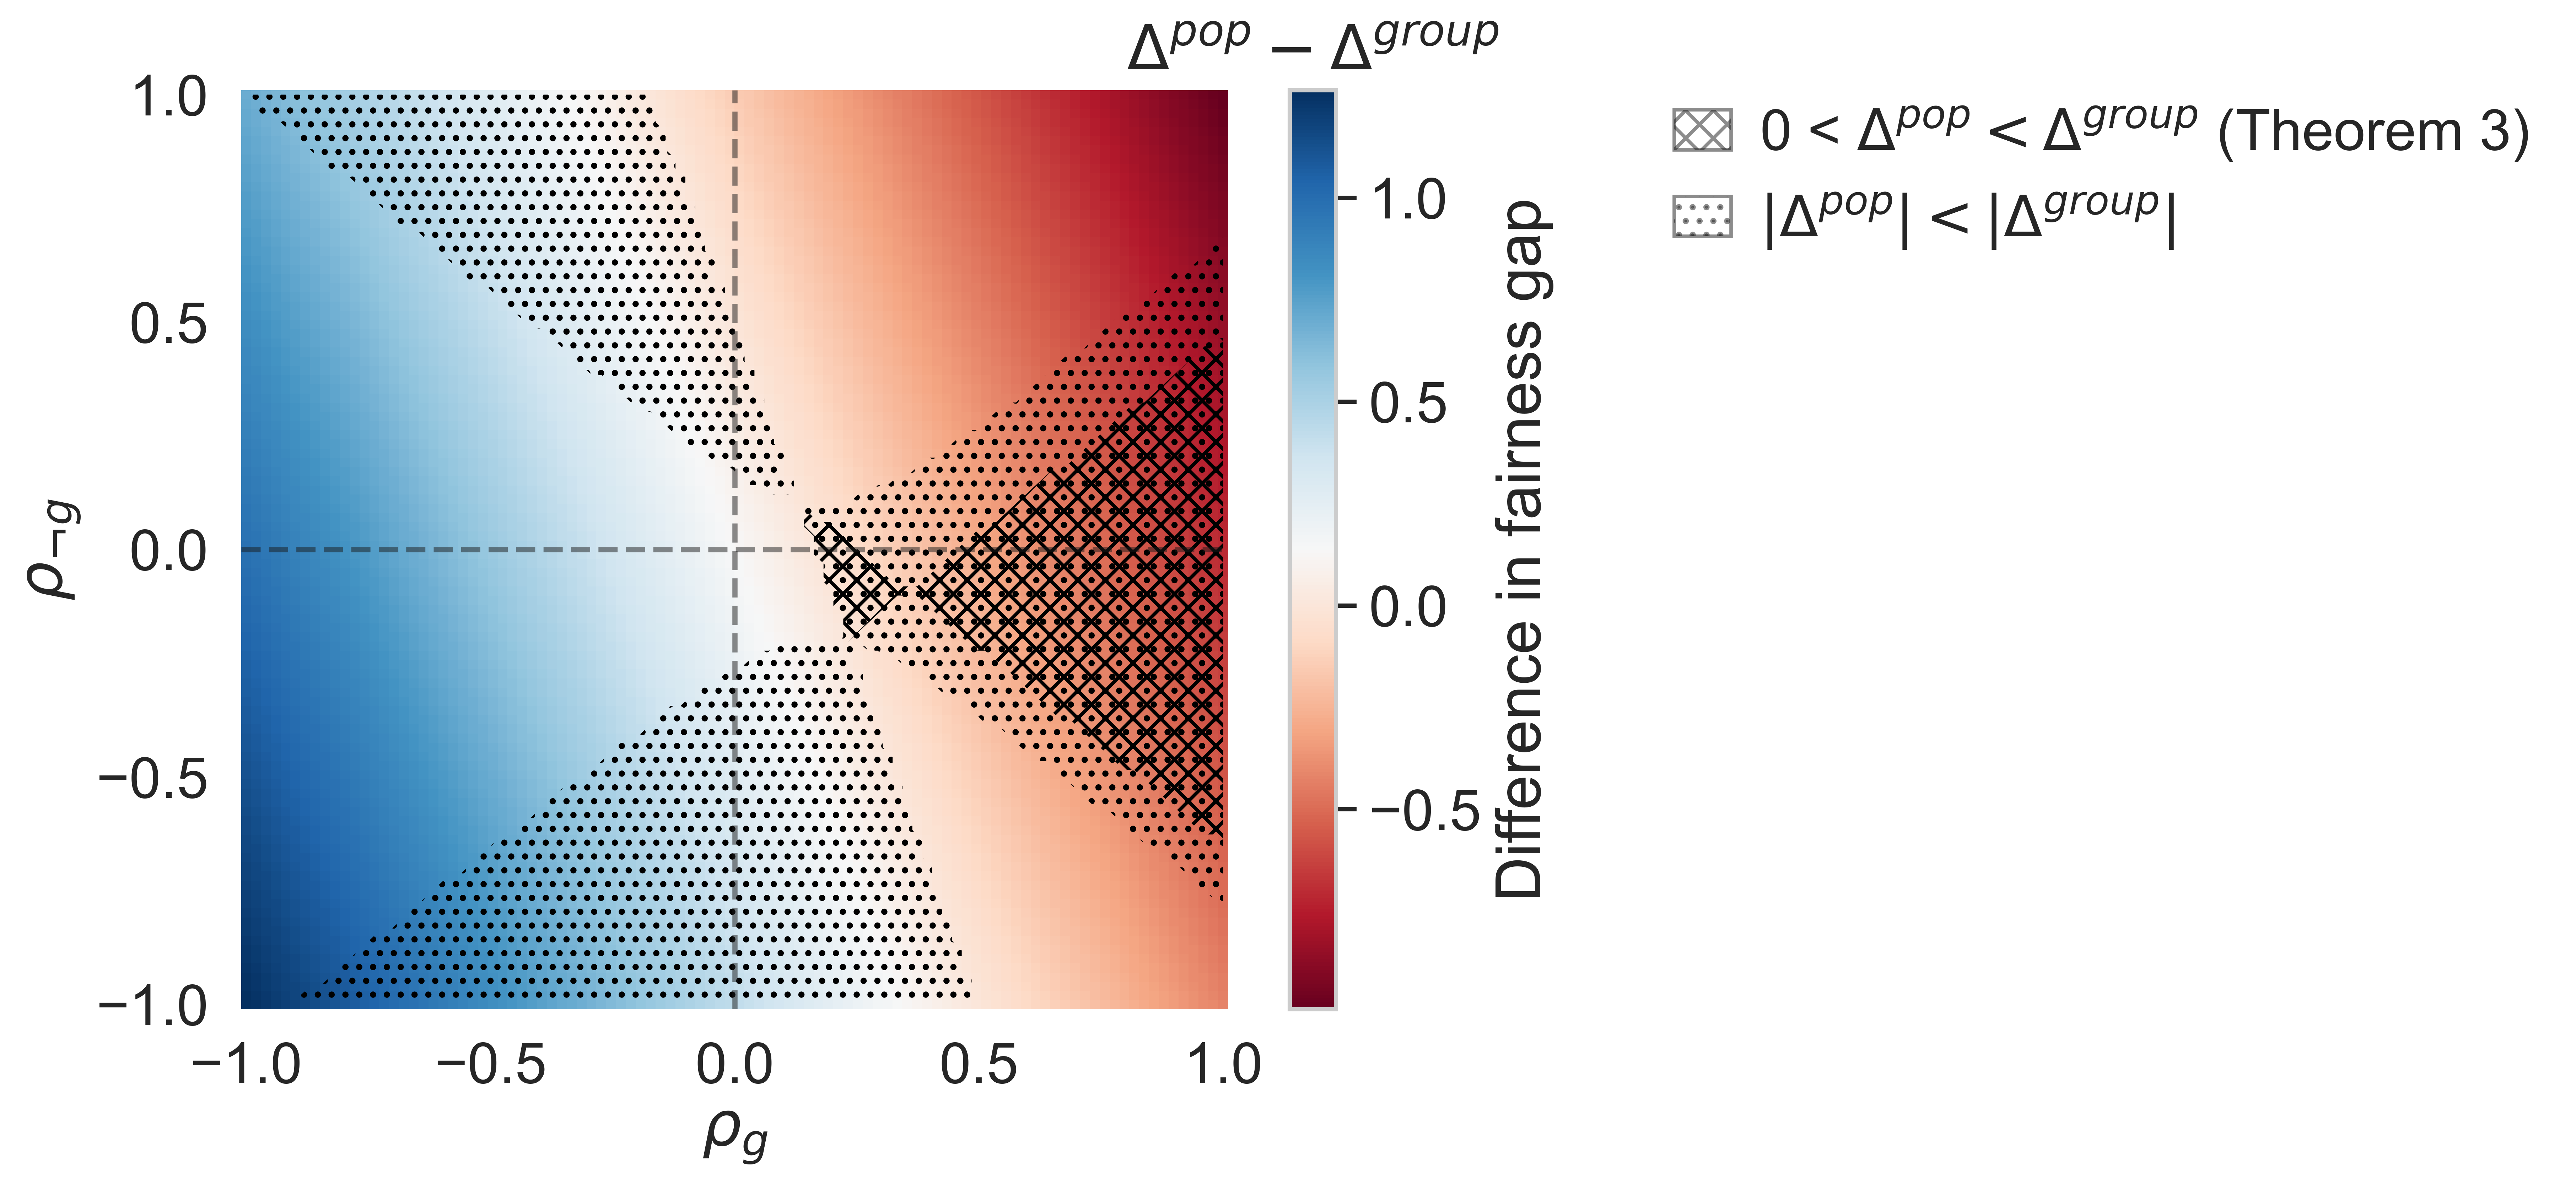
Appendix B Experiments
This section provides additional details on the experimental design.
B.1 Simulation study
Data Generation.
The proposed synthetic population consists of 100,000 points for the majority group and 1,000 for the marginalised group resulting in a sample size of with a ratio of 100:1. Each individual is represented in this dataset as a pair of covariates, i.e., . For each group, 2/3 presents the condition, i.e., . Negatives are drawn from the normal distribution . The condition characterisation, i.e., the boundary between positive and negatives, differs between groups with positive from the majority (resp. the marginalised group) sampled from (resp. ). Figure 9 shows the density distribution of the generated population.
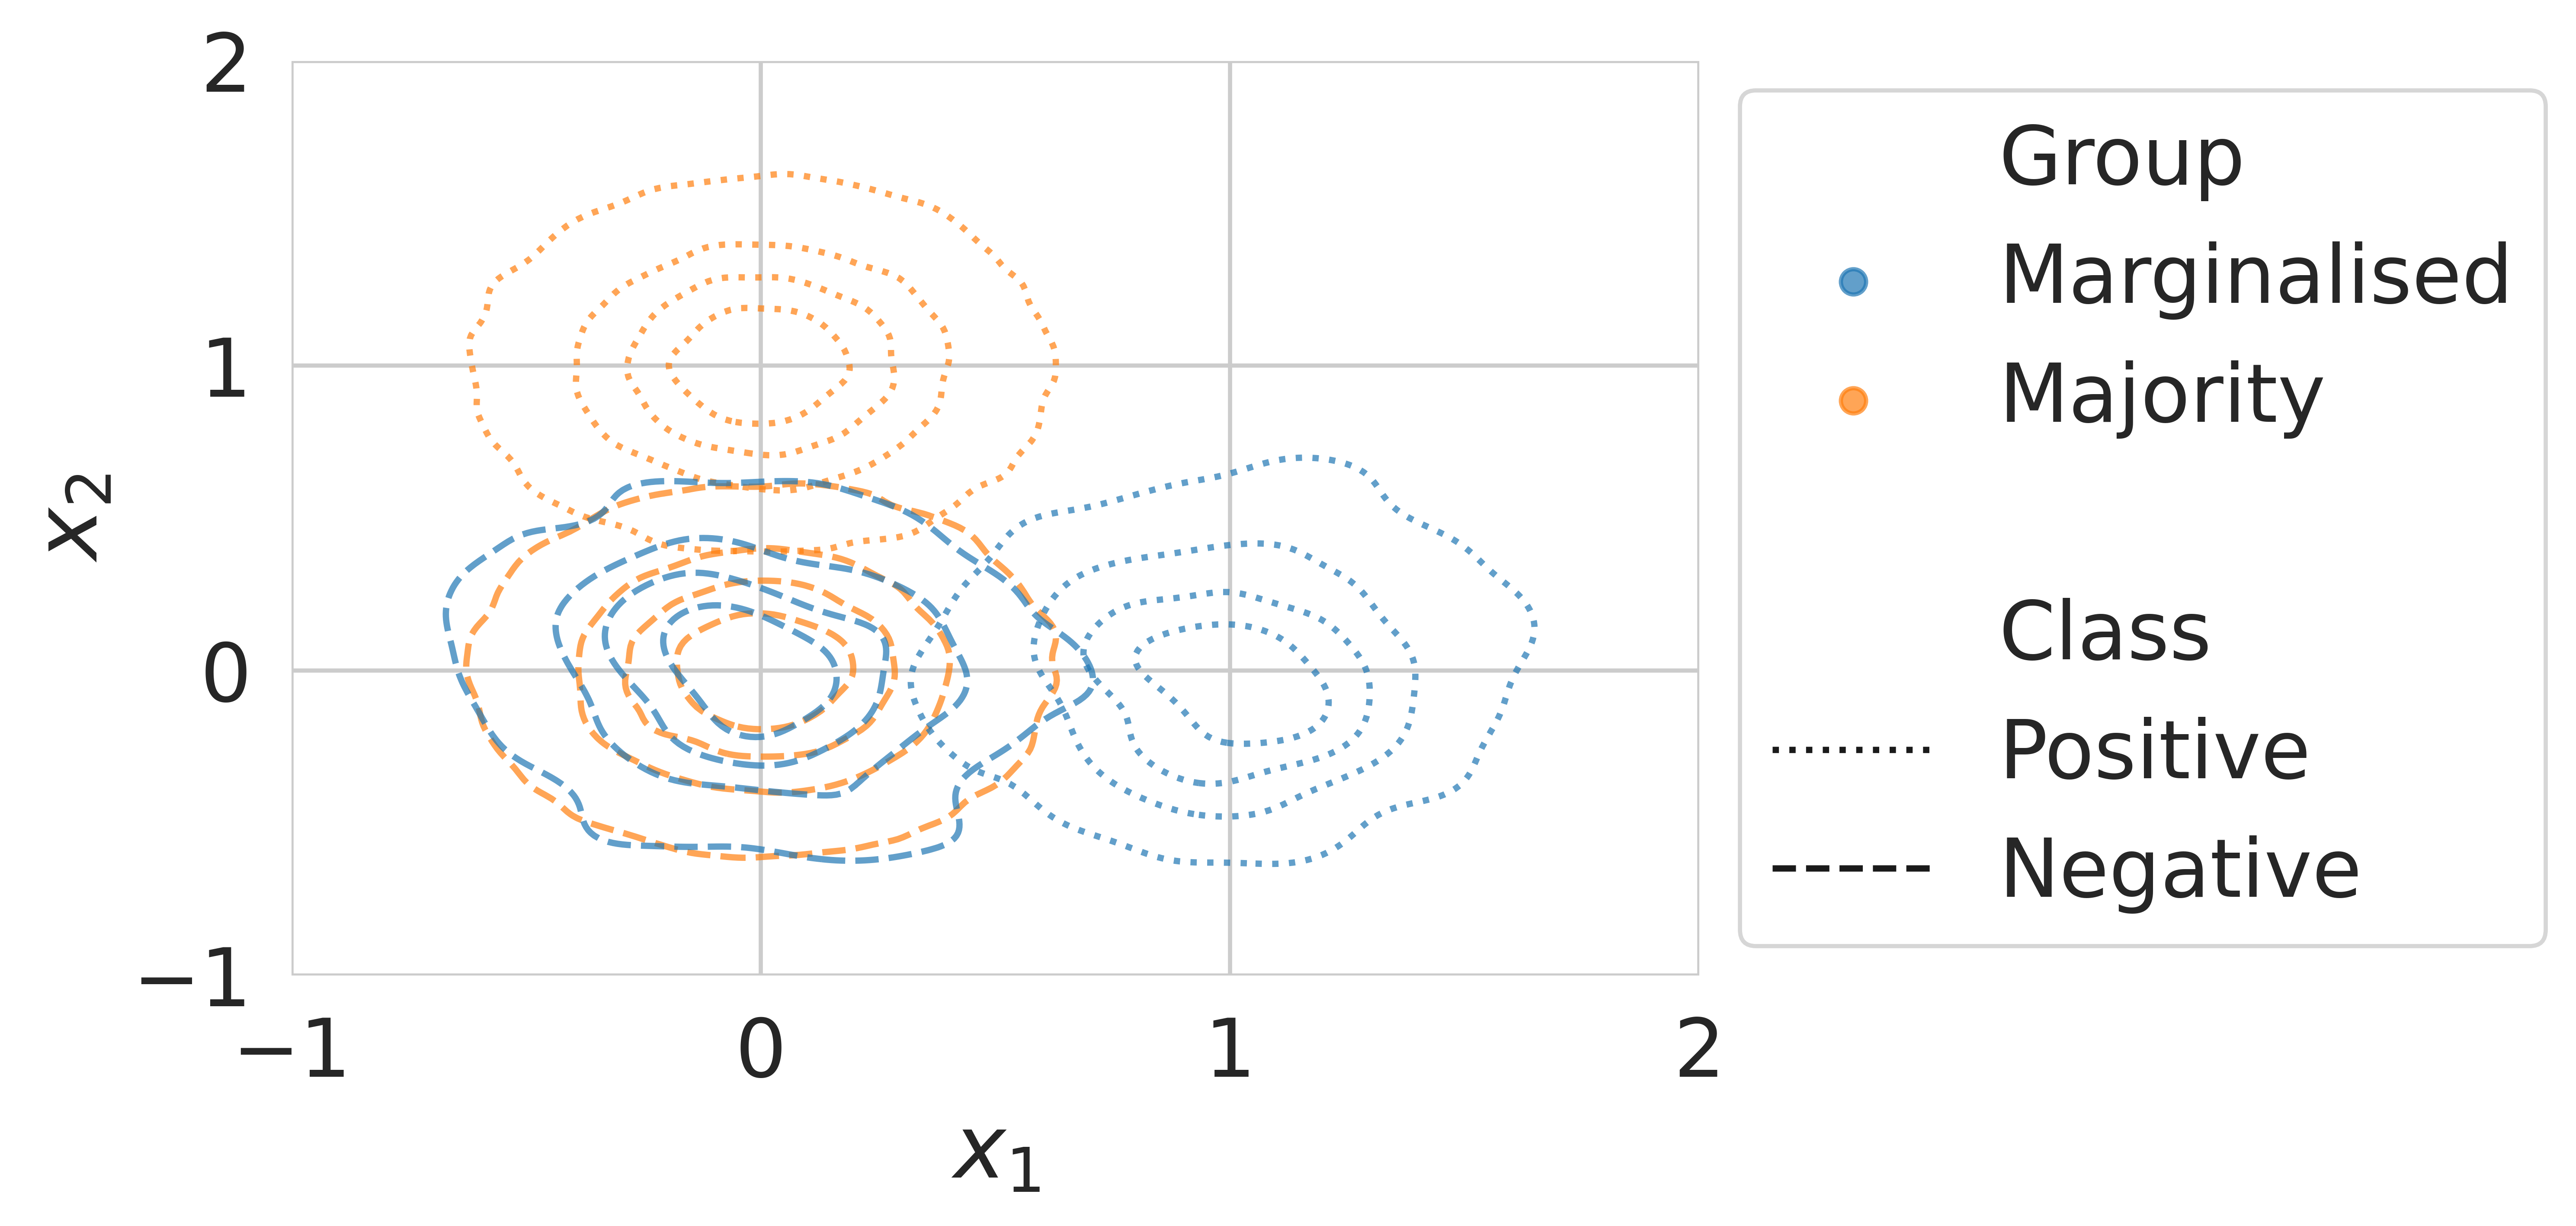
Missingness.
In this synthetic population, 50% of the dimension is removed in a given subgroup to enforce the three clinical presence scenarios. We enforce the following clinical missingness:
-
•
Limited access to quality care (S1):
-
•
(Mis)-informed collection (S2):
-
•
Confirmation bias (S3):
With the observation indicator associated with and , the group membership ( indicates a member of the marginalised group).
Modelling.
We generate 100 datasets and enforce the different missingness patterns before running a logistic regression with an l2 penalty (). Results are computed on the 20% test set and averaged over the 100 iterations with 95% confidence bounds reported.
Tabular results.
Table 4 presents the reconstruction error differentiated by groups, scenarios and imputation strategies averaged over 100 simulations presented in Section 5.3. Similarly, Table 5 presents the AUC averaged over the different imputation strategies as presented in Section 5.4.
| Imputation strategy | |||
| Scenario | Group | Population Mean | Group Mean |
| (S1) | Overall | 0.493 (0.016) | 0.062 (0.004) |
| Majority | 0.000 (0.000) | 0.000 (0.000) | |
| Marginalised | 0.493 (0.016) | 0.062 (0.004) | |
| \cdashline2-4 | 0.493 (0.016) | 0.062 (0.004) | |
| (S2) | Overall | 0.332 (0.007) | 0.236 (0.006) |
| Majority | 0.286 (0.007) | 0.286 (0.007) | |
| Marginalised | 0.490 (0.019) | 0.062 (0.005) | |
| \cdashline2-4 | 0.204 (0.021) | -0.224 (0.009) | |
| (S3) | Overall | 0.333 (0.002) | 0.325 (0.002) |
| Majority | 0.333 (0.002) | 0.325 (0.002) | |
| Marginalised | 0.020 (0.010) | 0.370 (0.035) | |
| \cdashline2-4 | -0.313 (0.010) | 0.045 (0.035) | |
Missingness Indicators.
In Section 5.4, we only considered the addition of the missingness indicators to the Group MICE. In this Appendix, we present how this technique impacts each imputation strategy performance. Table 6 presents the AUC for each pipeline relying on the imputed data resulting from the different imputation strategies and their concatenation with the missingness indicator (as described in Section 5.2). These results echo the same insights. :
-
•
Different imputation strategies may result in equal downstream performance at the population level while having different group performance gaps
-
•
No strategy consistently outperforms the others across clinical presence scenarios
-
•
Current recommendations for group-specific imputation can increase the performance gap and yield a worse performance for the marginalised group.
When comparing Table 5 and Table 6, these experiments underline that predictive performances are often improved by the addition of the missingness indicators. However, this gain is not equally distributed across groups and may increase the fairness gaps.
| Imputation strategy | |||||
| Scenario | Group | Population Mean | Group Mean | MICE | Group MICE |
| (S1) | Overall | 0.995 (0.000) | 0.995 (0.000) | 0.996 (0.000) | 0.995 (0.000) |
| Majority | 0.997 (0.000) | 0.997 (0.000) | 0.997 (0.000) | 0.997 (0.000) | |
| Marginalised | 0.679 (0.037) | 0.872 (0.026) | 0.651 (0.039) | 0.795 (0.033) | |
| \cdashline2-6 | -0.318 (0.037) | -0.125 (0.026) | -0.347 (0.040) | -0.201 (0.033) | |
| (S2) | Overall | 0.994 (0.000) | 0.993 (0.000) | 0.995 (0.000) | 0.994 (0.000) |
| Majority | 0.996 (0.000) | 0.995 (0.000) | 0.997 (0.000) | 0.996 (0.000) | |
| Marginalised | 0.785 (0.031) | 0.753 (0.040) | 0.815 (0.028) | 0.804 (0.032) | |
| \cdashline2-6 | -0.212 (0.031) | -0.242 (0.040) | -0.182 (0.028) | -0.192 (0.032) | |
| (S3) | Overall | 0.983 (0.001) | 0.984 (0.001) | 0.967 (0.001) | 0.968 (0.001) |
| Majority | 0.987 (0.001) | 0.987 (0.001) | 0.970 (0.001) | 0.972 (0.001) | |
| Marginalised | 0.641 (0.037) | 0.650 (0.037) | 0.652 (0.037) | 0.630 (0.038) | |
| \cdashline2-6 | -0.346 (0.037) | -0.337 (0.037) | -0.318 (0.037) | -0.341 (0.038) | |
| Imputation strategy with missingness indicator | |||||
| Scenario | Group | Population Mean | Group Mean | MICE | Group MICE |
| (S1) | Overall | 0.996 (0.000) | 0.995 (0.000) | 0.996 (0.000) | 0.996 (0.000) |
| Majority | 0.997 (0.000) | 0.997 (0.000) | 0.997 (0.000) | 0.997 (0.000) | |
| Marginalised | 0.725 (0.034) | 0.872 (0.026) | 0.684 (0.037) | 0.694 (0.036) | |
| \cdashline2-6 | -0.272 (0.034) | -0.125 (0.026) | -0.313 (0.037) | -0.304 (0.036) | |
| (S2) | Overall | 0.995 (0.000) | 0.993 (0.000) | 0.995 (0.000) | 0.994 (0.000) |
| Majority | 0.997 (0.000) | 0.995 (0.000) | 0.997 (0.000) | 0.996 (0.000) | |
| Marginalised | 0.835 (0.027) | 0.753 (0.040) | 0.831 (0.027) | 0.804 (0.032) | |
| \cdashline2-6 | -0.161 (0.027) | -0.242 (0.040) | -0.166 (0.027) | -0.192 (0.032) | |
| (S3) | Overall | 0.991 (0.001) | 0.984 (0.001) | 0.990 (0.001) | 0.990 (0.001) |
| Majority | 0.993 (0.001) | 0.987 (0.001) | 0.993 (0.001) | 0.993 (0.001) | |
| Marginalised | 0.773 (0.032) | 0.650 (0.037) | 0.776 (0.032) | 0.774 (0.032) | |
| \cdashline2-6 | -0.220 (0.032) | -0.337 (0.037) | -0.216 (0.032) | -0.219 (0.032) | |
Sensitivity to distribution.
The proposed simulations have focused on a given underlying distribution of data in which the marginalised group presents the condition differently than the majority. In this section, we propose to study when the condition manifestation is the same across groups but the condition prevalence differs. As discussed in Section 3, this group difference may result in different group-specific missingness processes.
Consider a population of patients with a ratio of 100:1 for the majority. Patients without the condition are drawn from the normal distribution and positives are sampled from . Contrarily to the previous simulations, the marginalised group has a prevalence of 50% while the rest of the population, 10%. We then enforce the three previously described missingness processes. Figure 10 illustrates how the same three proposed missingness processes would be expressed in this population. Importantly, due to differences in the prevalence, the missingness processes still differentially affect the two groups. For instance, the proposed (S2) affects the positive cases of both groups, representing 10% resp. 50% of these groups.
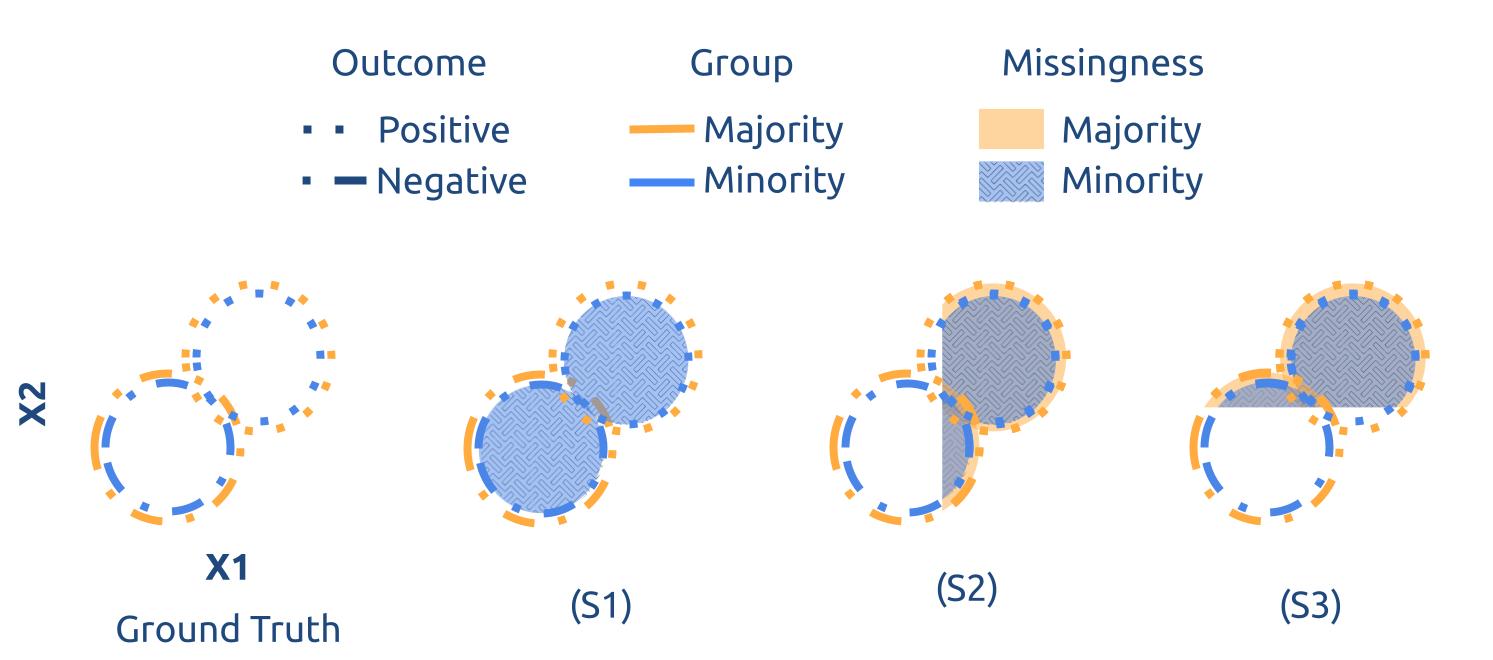
Figures 11 and 12 present the associated reconstruction error and AUC performance differentiated by scenario and imputation strategies. This set of experiments shows that group-specific condition prevalence would lead to similar discrepancies in missingness process, reconstruction errors and performance gaps. Importantly, no imputation strategy would consistently lead to a better or fairer performance in the studied settings. This result stands despite no difference in condition manifestation, highlighting the need for a thorough evaluation of different imputation strategies.
Correlated covariates.
The introduced distributions do not present correlations between the covariates at the group level. While the missingness process may introduce informative correlation that MICE imputation may leverage for improved imputation, this setting may not present the full strength of MICE imputation strategies. In this final set of experiments, we enforce correlation between and using the same simulations than in Section 5.1 except that the value of is added to . This results in the distribution with correlated covariates as schematised in Figure 13, in which we enforce the same three missing scenarios.
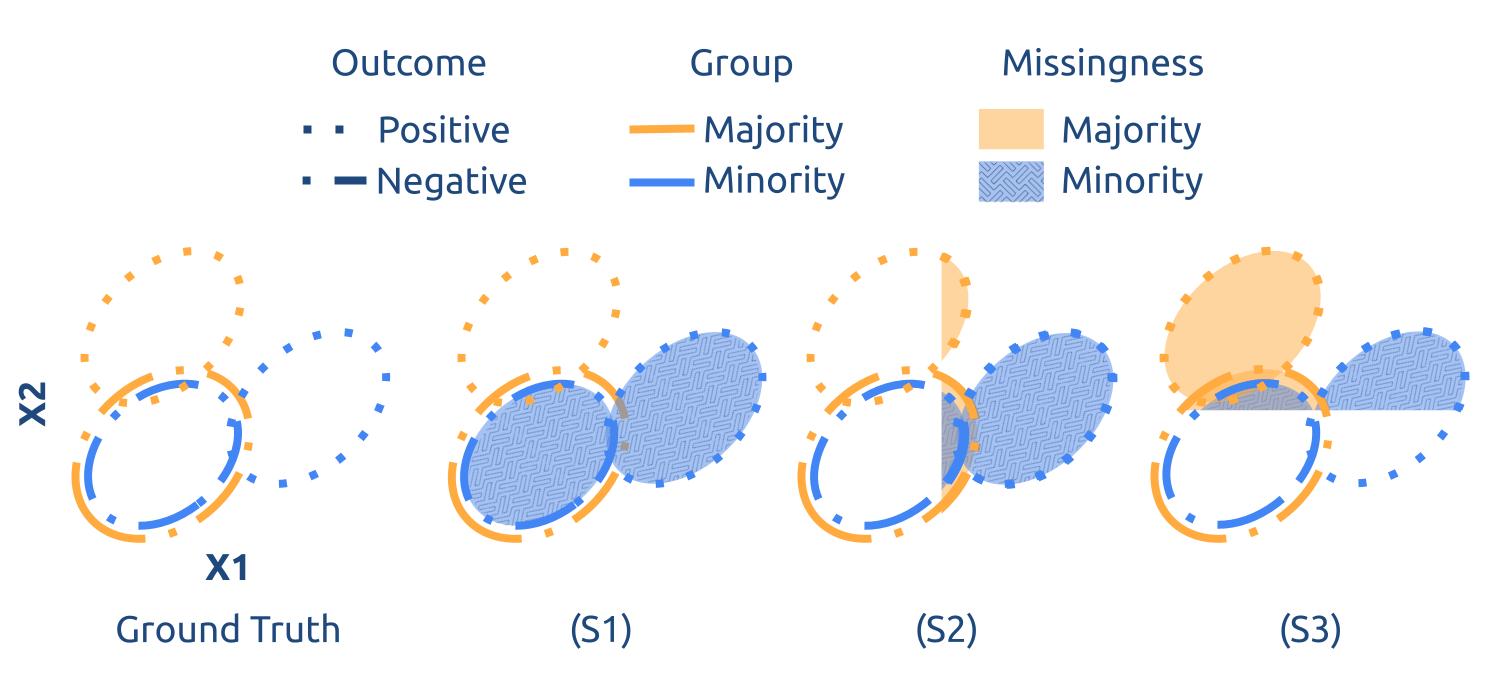
Figures 11 and 12 present the associated reconstruction error and AUC performance differentiated by scenario and imputation strategies. These figures echo the results presented in Section 5. Importantly, MICE and its group alternative do not consistently present superior performance. For instance, Group Mean presents the smallest reconstruction gap in (S3) and Population Mean reduced predictive difference in both (S2) and (S3).
B.2 MIMIC III
Dataset.
After preprocessing [101] and standardisation, the MIMIC III dataset consists of patients with 67 different laboratory tests. Focusing on the three marginalised groups of interest, the population can be further divided into marginalised subgroups as presented in Figure 16. This representation underlines the importance of identifying subgroups at risk in the studied population.
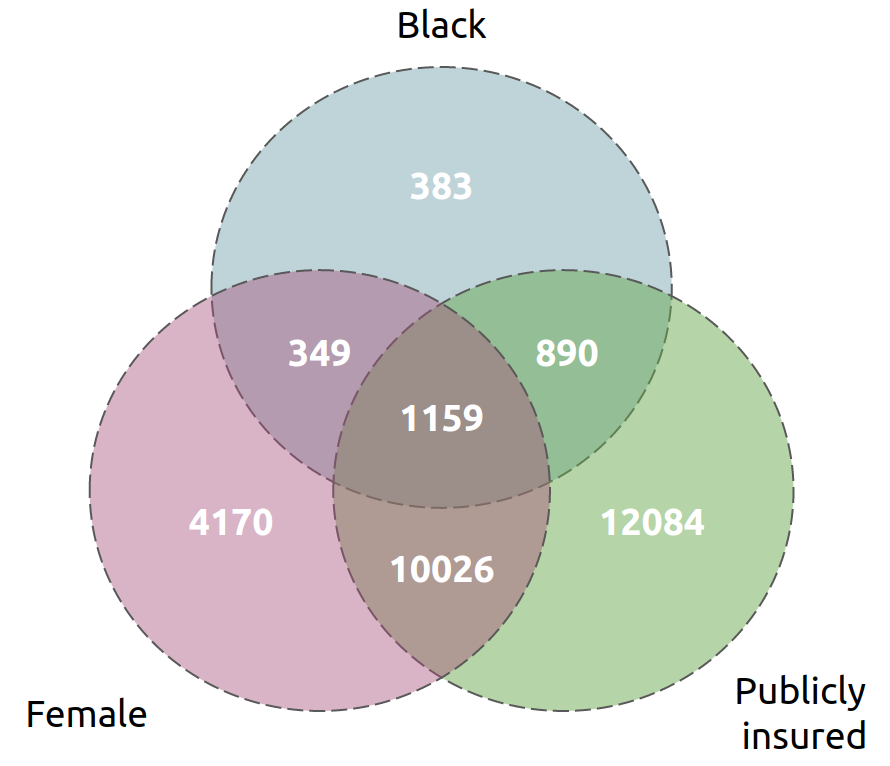
Experimental design.
For this real-world dataset, patients are split into three groups: 80% for training, 10% for validation and 10% for hyper-parameters selection. The hyper-parameter search consisted of the l2 penalty selection for the logistic regression among .
We bootstrapped the test set 100 times and report the mean and 95% confidence bounds.
Tabular results.
Table 7 presents the AUC for each group and imputation strategy. Similarly, Table 8 details the false negative rate performances.
| Imputation strategy | ||||
| Group | Population Mean | Group Mean | MICE | Group MICE |
| Black | 0.807 (0.030) | 0.802 (0.030) | 0.785 (0.035) | 0.782 (0.036) |
| Non Black | 0.742 (0.010) | 0.742 (0.010) | 0.735 (0.010) | 0.735 (0.010) |
| Female | 0.736 (0.016) | 0.733 (0.016) | 0.729 (0.018) | 0.726 (0.018) |
| Male | 0.753 (0.016) | 0.756 (0.016) | 0.742 (0.015) | 0.738 (0.014) |
| Public | 0.735 (0.011) | 0.732 (0.012) | 0.722 (0.012) | 0.715 (0.013) |
| Private | 0.753 (0.021) | 0.755 (0.021) | 0.762 (0.019) | 0.751 (0.021) |
| Imputation strategy | ||||
| Group | Population Mean | Group Mean | MICE | Group MICE |
| Black | 0.271 (0.074) | 0.458 (0.082) | 0.314 (0.078) | 0.336 (0.076) |
| Non Black | 0.366 (0.017) | 0.350 (0.017) | 0.371 (0.018) | 0.371 (0.018) |
| Female | 0.348 (0.030) | 0.330 (0.028) | 0.381 (0.030) | 0.361 (0.032) |
| Male | 0.367 (0.027) | 0.394 (0.027) | 0.357 (0.026) | 0.394 (0.026) |
| Public | 0.336 (0.019) | 0.310 (0.018) | 0.348 (0.019) | 0.344 (0.021) |
| Private | 0.437 (0.041) | 0.596 (0.041) | 0.423 (0.039) | 0.510 (0.036) |
Missingness Indicators.
Similarly, Table 9 presents the AUC for each group and imputation strategy when missingness indicators are added to the regression model. Table 10 shows the false negative rate for the same pipelines. This analysis shows that the missingness patterns are informative of the outcome of interest as adding the missingness indicators as regressors improves performance. Note, however, that MICE Group presents lower AUC performance than MICE in Table 9. This observation echoes the criticism that group imputation may lead to suboptimal performance. Finally, these tables underline how no strategy consistently outperforms the others across groups.
| Imputation strategy with missingness indicators | ||||
| Group | Population Mean | Group Mean | MICE | Group MICE |
| Black | 0.827 (0.027) | 0.825 (0.027) | 0.818 (0.028) | 0.817 (0.029) |
| Non Black | 0.786 (0.010) | 0.785 (0.010) | 0.781 (0.010) | 0.783 (0.010) |
| Female | 0.770 (0.013) | 0.770 (0.013) | 0.772 (0.014) | 0.772 (0.014) |
| Male | 0.801(0.013) | 0.800 (0.013) | 0.793 (0.013) | 0.796 (0.013) |
| Public | 0.773 (0.010) | 0.773 (0.011) | 0.767 (0.011) | 0.766 (0.010) |
| Private | 0.816 (0.016) | 0.810 (0.017) | 0.819 (0.017) | 0.811 (0.018) |
| Imputation strategy with missingness indicators | ||||
| Group | Population Mean | Group Mean | MICE | Group MICE |
| Black | 0.224 (0.063) | 0.459 (0.077) | 0.229 (0.063) | 0.294 (0.070) |
| Non Black | 0.299 (0.017) | 0.273 (0.017) | 0.294 (0.017) | 0.290 (0.017) |
| Female | 0.295 (0.024) | 0.255 (0.025) | 0.292 (0.025) | 0.278 (0.026) |
| Male | 0.296 (0.025) | 0.314 (0.024) | 0.285 (0.025) | 0.287 (0.026) |
| Public | 0.290 (0.020) | 0.250 (0.020) | 0.286 (0.019) | 0.280 (0.019) |
| Private | 0.302 (0.038) | 0.448 (0.043) | 0.295 (0.037) | 0.348 (0.040) |
Controlling for all groups.
In Section 6, the group-specific results correspond to the imputation associated with each respective group. As practitioners aim to reduce the performance gap across all presented groups simultaneously, we propose alternative group imputation strategies in which we control over all groups. Specifically, group mean imputation associate to each patient the group mean associated with its Ethnicity, Sex and Insurance. Similarly, Group MICE regresses on the three groups simultaneously.
The use of these imputation strategies result in the updated Figure 17. These experiments leads to identical conclusions.
Threshold sensitivity.
In Section 6, we present results for a policy of 30% additional care. As we arbitrarily chose this threshold, we propose to measure how the results vary under two different thresholds: 5% and 50%. Additionally, we introduce an additional metric to quantify equity in care delivery. When considering a fixed resource threshold (30%), we measure each group’s prioritisation — the proportion of all patients who would receive care under this policy, regardless of their ground-truth condition. A gap in prioritisation quantifies how care is delivered differently across groups while a gap in FNR between groups illustrates how patients would be incorrectly de-prioritised across groups.
Figures 18, 19 and 20 present the results at 5%, 30% and 50% thresholds. First, note that the magnitude of the in prioritisation increases with larger thresholds, but similar trends are observed. This indicates that members of the same group have similar risk scores. Increasing the threshold, therefore, further penalises this whole group. Second, the in false positive rates demonstrates how the choice of imputation is sensitive to the target task. In addition to validating the insights from Section 6, this set of experiments demonstrates that the target task may also affect whether an imputation strategy favours or penalises a given group.