suppSupplementary References \sidecaptionvposfigurec
Communication network dynamics
in a large organizational hierarchy
Abstract
Most businesses impose a supervisory hierarchy on employees to facilitate management, decision-making, and collaboration.
In contrast, routine inter-employee communication patterns within workplaces tend to emerge more naturally, as a consequence of both supervisory relationships and the needs of the organization.
Scholars of organizational management have proposed theories relating organizational trees to communication dynamics and measures of business performance.
Separately, network scientists have studied the topological structure of communication patterns in different types of organizations.
However, the nature of the relationship between a formal organizational structure and emergent communications between employees remains unclear.
In this paper, we study associations between organizational hierarchy and communication dynamics among approximately 200,000 employees of a large software company in May 2019.
We propose new measures of communication reciprocity and new shortest-path distances for trees to characterize the frequency of messages passed up, down, and across the organizational hierarchy.
By dividing the organization into 88 teams – organizational trees rooted at the senior leadership level – we identify distinct communication network structures within and between teams.
These structures are related to the function of these teams within the company, including sales, marketing, engineering, and research.
We discuss the relationship of routine employee communication patterns to supervisory hierarchies in this company, and empirically evaluate several theories of organizational management and performance.
Keywords: communication dynamics, email network, organizational hierarchy, reciprocity, reporting distance, path analysis, latent tree reconstruction
1 Introduction
Most organizations impose a supervisory hierarchy on their employees to facilitate management, decision-making, and collaboration (Robbins,, 2004; Galbraith,, 2008). In contrast, routine interpersonal communication patterns within workplaces tend to emerge more naturally, as a consequence of both supervisory relationships and the needs of the organization. “If the formal organization is the skeleton of a company,” Krackhardt and Hanson, (1993) analogize, “the informal is the central nervous system driving the collective thought processes, actions, and relations of its business units.” Understanding the relationship between these two networks is crucial to successful management of an organization (Cross et al.,, 2007).
Scholars of organizational behavior and management have proposed theories relating social network features to measures of business performance (Tichy et al.,, 1979; Krackhardt and Stern,, 1988) and researchers have described strategies to measure and improve communication networks within an organization (Cross et al.,, 2007; Nielsen,, 2016). Some of this work makes explicit claims about how communication network features relate to organizational effectiveness. For example, Krackhardt and Stern, (1988) conjecture that effective organizations have a higher rate of between-team than within-team communication. Alternatively, Hatch and Schultz, (1997) and Holtzhausen, (2002) argue that communication is better in decentralized organizations in which “authority is dispersed downward in the hierarchy.” Several authors claim that the highest-performing employees have more communication network connections (Cross et al.,, 2002; Nielsen,, 2016).
To evaluate these theories, management researchers, computer scientists, and network scientists have proposed frameworks and methodologies for studying latent, or unmeasured, hierarchical structure within interaction or communication networks (Capobianco and Molluzzo,, 1979; Palus et al.,, 2011; Fire and Puzis,, 2016). One objective is to use communication network features to classify individuals by rank or job title in the corresponding organizational hierarchy, thereby uncovering network correlates of institutional position. A common approach is computing network measures of centrality for employees, then ranking them in order of importance. For example, Shetty and Adibi, (2004) use entropy to measure importance of employees, and Namata et al., (2006) use variations in email counts to rank employees. Rowe et al., (2007) rank individuals based on a combination of communication flow statistics such as average response time and topological statistics such as the number of communication network cliques to which each employee belongs. Hossain, (2009) and Michalski et al., (2011) use classical centrality measures to rank employees, and Wang et al., (2013) adapt the PageRank algorithm (Page et al.,, 1999) for email networks, which they call HumanRank. Zhang et al., (2009) assess supervised clustering techniques for predicting missing job titles based on the number of emails sent and received by each employee. Dong et al., (2015) find that “structural holes” in the communication network are useful for identifying “high-status” individuals, and that these individuals form a “rich club” community of employees that is connected, balanced, and dense. Nurek and Michalski, (2020) show that auxiliary employee information, such as number of days of overtime worked, can improve classification of job title.
Beyond classifying employees by rank or job title, there are three methods in the literature that attempt to infer a tree-like structure (ideally the entire organizational hierarchy) using inter-employee communication data. Creamer et al., (2007) segment employees into hierarchical levels, then link them by an edge when two employees exchanged at least emails, though this does not guarantee the inferred organization is a tree. Maiya and Berger-Wolf, (2009) use a distance-based approach that assumes interactions are most common between supervisors and their direct reports, as well as between organizational peers. Gupte et al., (2011) define “agony” as the difference in rank plus one for communications that are directed from a lower-ranked to a higher-ranked employee, and infer the organizational hierarchy that minimizes agony. While the hierarchical random graph model from Clauset et al., (2008) infers a hierarchy specifically given a network input, it does not produce a spanning tree, i.e. a tree with a vertex set equal to that of the input graph, and therefore its objective is different than the aforementioned methods.
Much of the methodology used to study the relationship between organizational hierarchy and communication patterns (and much of what is known about this relationship) comes from analyses of the Enron email corpus (Klimt and Yang,, 2004), which consists of email communications among a group of senior employees of the firm in advance of its collapse in 2001. Appendix Table A.1 shows a summary of these methods. Despite the repeated analysis of this data, the full organizational hierarchy of Enron employees is not publicly available: the Enron email corpus only consists of 158 employees that mostly belong to upper management. More insidiously, insights gained from analyses of the Enron data may reflect features of this uniquely dysfunctional corporate environment: observed associations between the email network and organizational hierarchy in this failing business may not be representative of more successful organizations. Indeed, Eckhaus and Sheaffer, (2018) use sentiment analysis to show that a semantic measure of “hubris” in email content increases closer to the Enron collapse. Similarly, Diesner and Carley, (2005) argue that during the crisis, communication transcended the formal positions more than in previous months. Consequently, it is essential to move beyond the study of the Enron corpus in order to understand how an organization’s structure relates to its communication dynamics.
Toward this end, researchers have conducted several empirical analyses of other organizations, but each is limited in scope. Holtzhausen, (2002) study a South African financial services organization to assess the relationship between decentralization and communication. However, both communication and decentralization were only measured via survey response rather than via communication logs and the actual organizational hierarchy. Guimera et al., (2006) characterize a university email network and relate it to the community structure within the institution. Similarly, Boeva et al., (2017) study a telecommunications company to evaluate metrics for comparing the formal organization to the informal communication structure, and Sims et al., (2014) study communication patterns within Los Alamos National Laboratory through email records. In all three of these studies, organizational structures are coarsely measured and communication dynamics are only considered between units consisting of many individuals – colleges and administrative blocks in Guimera et al., (2006), divisions in Boeva et al., (2017), and programs/projects in Sims et al., (2014) – rather than between individual employees.
How do emergent communication dynamics relate to organizational hierarchy in a large and successful organization? Are communication network centrality measures a good proxy for organizational position? What is the relationship between organizational rank and frequency of communication? Empirically testing organizational theories, especially those postulating relationships between network centrality measures and organizational position, would require data from a large organization’s individual-level organizational hierarchy with finely observed communication patterns between all employees. Availability of replicates – data from subgroups or teams within the organization – would permit testing of organizational theories across business task areas.
In this paper, we study the relationship between the formal organizational hierarchy and emergent email communication dynamics among 241,718 employees at a large software company in May 2019. The data set is larger than any other organization described in the literature and consists of each employee’s location in the company’s supervisory/reporting hierarchy, as well as monthly email communication counts between all pairs of employees. We characterize the topological distance and direction of email messages passed up, down, and across the organizational hierarchy. By dividing the organization into 88 teams – organizational trees rooted at the senior leadership level – we identify distinct communication network structures within and between teams. We also evaluate established methods for latent structure estimation and employee rank classification using the email communication network, and assess their correspondence to the true organizational tree across the whole organization and within individual teams. We conclude with a discussion of the relationship between routine employee communication patterns and the supervisory hierarchy, and empirically evaluate several theories of organizational management and performance.
2 Data
Data used in this analysis consist of email communications between employees and the organizational hierarchy of all employees. Email communications consist of monthly counts of emails between pairs of employees distinguished by sender and recipient. A total of 26.8 million emails between employees are represented in these counts. The organizational data are represented by directional reporting relationships between employees. Unique anonymous employee identifiers link employees across both data sets. A total of 241,718 unique employee identifiers are present across the data sets, with 89% present in both data sets. We construct two networks by selecting records belonging to employees present in both data sets. In the directed email communications network, nodes correspond to employees and edges are weighted by the total number emails over one month. The weighted adjacency matrix consists of elements . The organizational tree is constructed using directional reporting relationships, where the Chief Executive Officer is the root. Nodes in the organizational tree represent employees and edges represent (unweighted) reporting relationships.
To accommodate the existence of divisions with distinct business roles within the company, we divide the organization into sub-organizations consisting of sub-trees of the organizational hierarchy, which we call teams. This allows us to compare the teams for insight into how organizational structures affect communication. To construct teams, we first identify a set of team leaders, defined as employees two steps below the CEO in the organizational chart. A team’s organizational tree is defined as the rooted tree with the team leader as the root, which is a a subtree of the entire organizational tree. Its corresponding email network is the email communications network induced by all of the organizational descendants of the team leader; the team email network is a subgraph of the entire email network. Because not all employees are present in both the email network and organizational tree, we take the intersection of the nodes in a team’s organizational tree and email network and redefine these networks as the subgraphs induced by this intersection. We exclude teams with fewer than 100 members from this analysis. As a final data cleaning step, we remove isolated individuals to ensure that each team’s email network is connected. In order to preserve the connected structure of the team’s organizational tree, we remove only individuals who did not send or receive emails, and who are also terminal nodes in the team’s organizational tree. For individuals higher in the team’s hierarchy (and therefore necessary to preserve the tree structure) who did not send or receive any emails, we add a single directed edge originating from the individual on that team with the highest out-degree. In total, we add only 788 edges, which is less than of all of the edges. Our final email network is the union of all of the teams’ email networks plus all of the original edges between the different teams. By construction, each team is connected in the organizational hierarchy, and the overall email network is also connected. It consists of 197k nodes and 24.6 million edges.
For every node, we record several employee features. First, we record each employee’s supervisor, which is the employee that the node reports to in the organizational tree. We say that a group of teams is in the same division when their respective team leaders share a supervisor, who by construction reports directly to the CEO. Finally, we record each node’s level, which is the number of steps below the CEO in the organizational hierarchy. In total, the data set consists of a total of 88 teams within 12 divisions. The sizes of the teams range from 99 to 19,458 (average 2,237, standard deviation 3,612) and the depth of the teams, which is the maximum level of individuals in the team, ranges from 5 to 13 (average 8.5, SD 1.7).
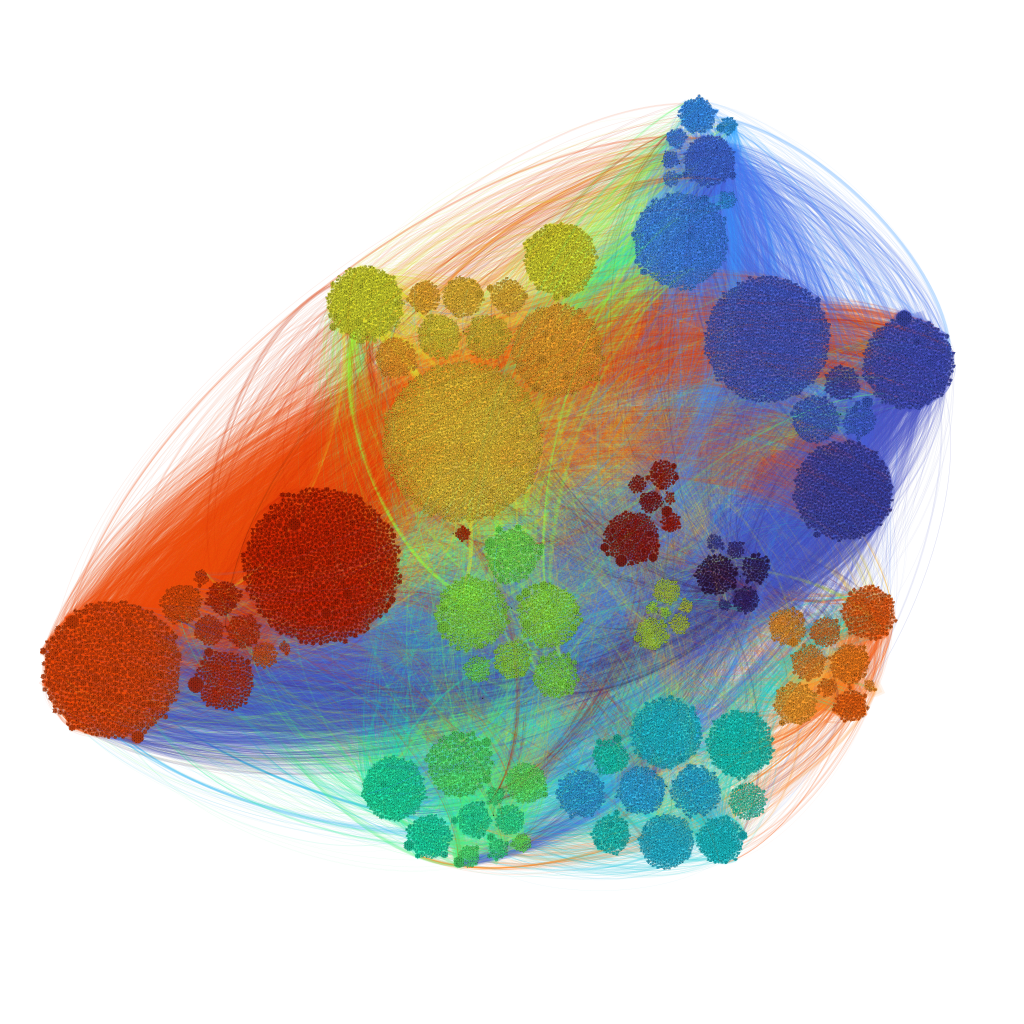
Figure 1 shows a visualization of the organizational tree and email network using the Gephi software package (Bastian et al.,, 2009). Teams are colored with the same color scheme in both networks, and colors are assigned to teams on a spectrum so that teams within the same division have similar colors. On the left, black edges denote the top of the organizational tree, from the CEO to the division leaders to the team leaders. Within teams, nodes are organized first by level and then by direct report. On the right, edges are directed and colored according to the source of emails, i.e. the email sender. For visual clarity, we only include edges where emails were reciprocated and at least 30 total were exchanged over the course of the month Guimera et al., (2006). We then visualize the giant connected component, which consists of 94% of the original nodes (185,276) but just 3% of the edges (762,936), thus making the visualization manageable to compute and clearer to render.

3 Results
3.1 Email communication network
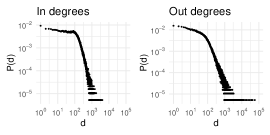
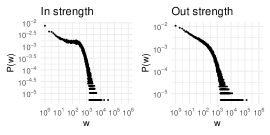
We first study the degree distributions of the email network. The total degree is the number of email relationships with nonzero weight, which we separate into in (received) and out (sent) degrees. The average total degree is 250 (SD 402), and the median is 166 indicating a heavy right skew in the degree distribution. The 95th percentiles of in and out degrees are 349 and 451, respectively. By symmetry, since both sender and recipient are in the data set, the average in and out degrees are equal to half of the average total degree. Figure 3 shows a rapid decay in degree frequency that is consistent with patterns observed in other communication networks (Onnela et al.,, 2007). The long tail indicates that there are a few employees who receive emails from thousands of employees, and even fewer “super-senders” who send emails to tens of thousands of employees. This highly skewed out-degree distribution has been been identified in prior work on communication patterns in organizations, and may reflect activity related to email lists or listservs (Guimera et al.,, 2006; Onnela et al.,, 2007).
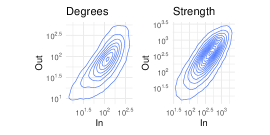
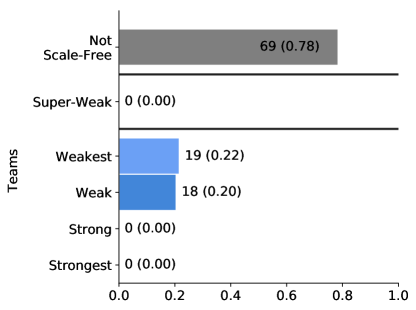
Based on a Kolmogorov-Smirnov test, the total degrees follow a power-law distribution with an estimated power law exponent of (SD 0.1) (Clauset et al.,, 2009; Gillespie,, 2015). However, we also include the recent scale-free analysis proposed in Broido and Clauset, (2019) at the team-level in Appendix A.2, which shows that 69 of the 88 teams are not scale-free. In and out degrees also show a strong positive Pearson correlation (). The same trend holds () for total strength, which is the sum of the edge weights and represents the total volume of email. In and out strength are the total number of emails received and sent, respectively. The average total strength is 861 (SD 1204), the median total strength is 563, and the 95th percentiles of in and out strength are 1,272 and 1,461, respectively.
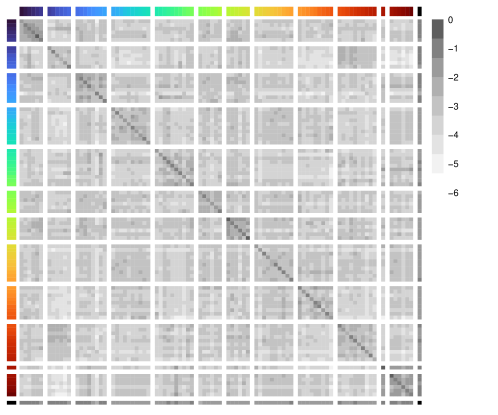
Figure 2 shows the team adjacency matrix . The element is the proportion of pairs of employees from teams and that have ever exchanged an email:
where is the number of employees in team and is the indicator function. The rows and columns of the block matrix are sorted so that teams are clustered by their divisions.
Figure 2 shows that more emails are exchanged within teams than between teams, and the block diagonal structure also shows that communication is more common within divisions. The average diagonal (within team) is 0.091, which is the average proportion of pairs in the same team that exchanged at least one email in May 2019, and the average off-diagonal (between team) is 0.002. This indicates that teams are dense but communication between teams is sparse. The last row/column represents the CEO and their direct reports, which is evidence of the “rich club” phenomenon – the tendency for central nodes to be embedded in dense communities – at the top of the organizational chart (Colizza et al.,, 2006; Dong et al.,, 2015).
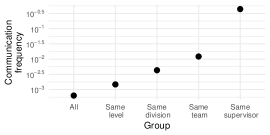
Figure 3 shows communication frequency within different groups of employees: all employees, those at the same level of the organizational hierarchy, those within the same division, those within the same team, and those who share a supervisor. Communication patterns largely cluster around the organizational structure: within teams, within divisions, within the same organizational level, and among those with the same supervisor.
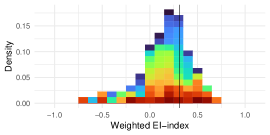
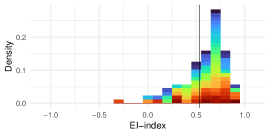
Krackhardt and Stern, (1988) argue that successful organizations respond better to crises when there are links between different teams, hypothesizing that organizations with a positive EI-index will respond effectively to crises. The EI-index for team and the organization EI-index are given as
respectively, where and are the number of external (between teams) and internal (within team) links, respectively, for team :
Figure 3 shows the distribution of EI-index values across teams; all but one team has a positive EI-index (average 0.58, SD 0.23) with the EI-index of the organization as a whole equal to 0.53. In contrast, the EI-indices for organizations reported by Krackhardt and Stern, (1988) span the range from -1 to 1, but are only reported on networks with very few (25-36) nodes. Though the number of communication links as a proportion of all possible links is higher with teams than between teams (see Figure 2), the unweighted EI-index is positive, indicating more external than internal links. This happens because the number of external and internal links in the EI-index are not normalized by the number of possible external and internal links, and there are far more employees who are not a member of a given team (who could become external links) than there are employees who are members of that team (who could become internal links). We also show in Figure 3 the distribution of weighted EI-indices in which and are replaced with the total volume of external and internal emails, respectively. Here, we see that 21 of the 88 teams have negative weighted EI-index (average 0.15, SD 0.27).
3.2 Sent versus received emails
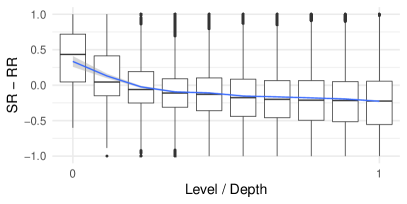
Next, we investigate the dynamics of emails that are sent by employees compared to those that are received. Link reciprocity for directed networks has been well studied in both binary (Garlaschelli and Loffredo,, 2004) and weighted settings (Squartini et al.,, 2013). The reciprocity of our email network is (SD = 0.01) without the weights and (SD = 0.14) with the weights. However, we are interested in reciprocity at the individual node level. For this, we propose two measures of node-level reciprocity. First, we measure the proportion of sent emails that are part of reciprocated communications, which we refer to as sent reciprocation. That is, the proportion of all email relationships in which sent at least one email to among all recipients who ever sent an email to . We similarly measure the proportion of received emails, or received reciprocation. For any individual , these are defined as
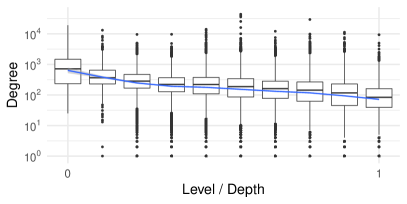
respectively. Figure 4 shows the difference of these proportions as a function of the employee’s level, which we recall is the number of steps below the CEO in the organization, relative to the depth of that employee’s team. This normalization ensures that employees that are at the bottom of their team’s hierarchy are grouped together no matter how deep each team is. We see that employees higher in the organization send emails that are reciprocated more often than they reciprocate emails that they receive.
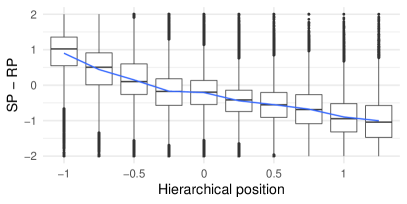
We also study the dynamics of sent and received emails as a function of position within one’s team. For every individual in team , the hierarchical position (Boeva et al.,, 2017) is
where is the hierarchical difference between and ,
Inspired by this differencing, we define sent position and received position for individual as
respectively. Thus +1 indicates every email was sent (received) to someone below in the organization, -1 to someone above in the organization, and 0 proportionately above and below. Note that each sum is normalized by the volume sent by the individual. The difference of these proportions is shown in Figure 4 as a function of HP. The lower an employee is in the organization (the more negative their HP), their sent position is, on average, higher than their received position. This is not surprising since there is a strong negative correlation between SP and RP, which implies that the difference is going to be more positive the higher you are in the organization. In short, if an employee sends most emails down the organization, then most emails they receive are likely to be sent from below, and vice-versa.
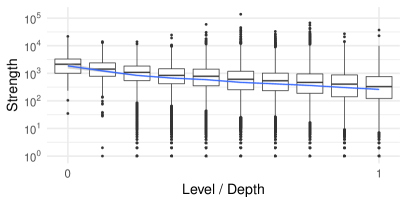
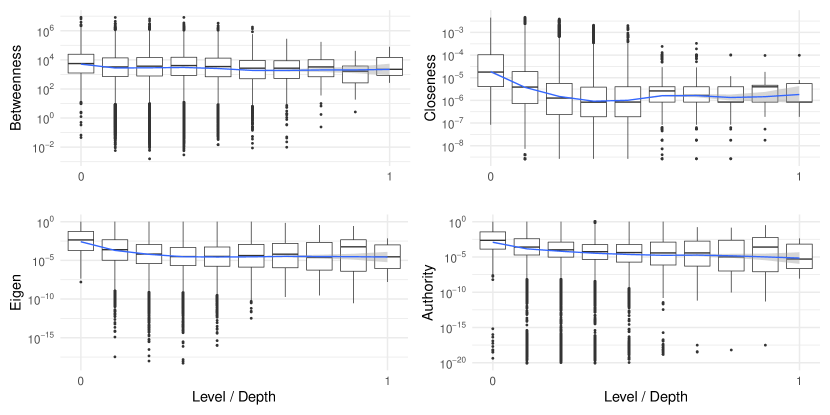
Finally, we evaluate the claim that the most important members in the organization – those closest to the CEO – have more communication connections (Cross et al.,, 2002; Nielsen,, 2016). Figure 4 shows that there is some truth to this claim: on average, both total degree and total strength in the entire email network decrease for employees further down the organizational chart. We show in Appendix Table A.2 that, assuming a linear model, the slopes of these trends are significantly less than zero. By looking at individual teams, we can assess importance with several additional measures of node centrality that we cannot otherwise, for computational reasons, compute on the entire email network. We compute four measures of centrality – betweenness, closeness, eigenvalue, and authority (see Kolaczyk and Csárdi,, 2014, for definitions) – shown in Appendix Figure A.3.
3.3 Reporting distance
Another approach to studying the relationship between organizational structure and frequency of communication is to consider the distance between two employees in the organizational chart. A path between individuals and is a sequence of edges connecting them and the path length is defined as the number of edges in a path. For each team, we compute three different path length measures between each pair of employees.
For any two employees and in the organizational chart, we count the number of steps up and the number of steps down, in the shortest path from to . We describe how to compute these efficiently in Appendix A.5.1. Note that by symmetry, .
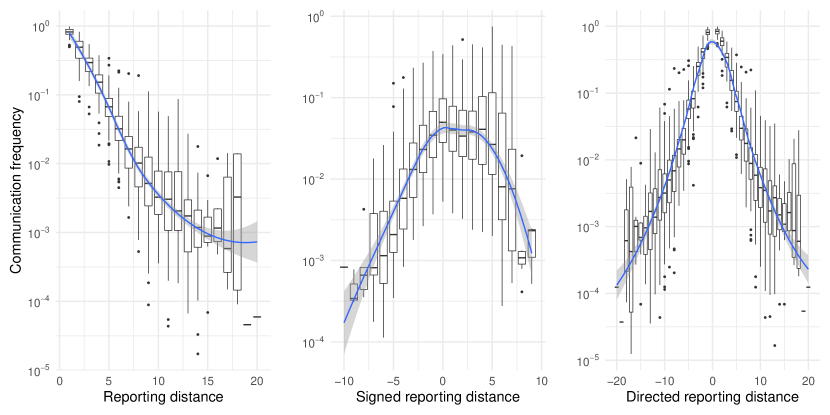
We define three notions of reporting distance as a function of these path length quantities: reporting distance, signed reporting distance, and directed reporting distance. Respectively, these distances between and are defined as
RD is just the ordinary shortest path length. SRD is a measure of the total distance travelled up or down the organizational tree to get from to , which is zero if and have the same level, is positive if is lower than in the organization, and is negative otherwise. SRD is close to the definition of “agony” described in Gupte et al., (2011): . Finally, DRD is the reporting distance signed by whether is higher or lower than in the organization.
Note that only RD is a true distance; neither SRD nor DRD satisfies symmetry or the identity of indiscernibles, but we prove in Appendix A.5.2 Proposition 1 that SRD satisfies the equality for all in the tree, and hence SRD is a quasipseudometric on the set of employees (Kim,, 1968).
Figure 5 shows the average number of emails exchanged between pairs of employees as a function of these reporting distances. Appendix Figure A.4 shows analogous plots by communication frequency. On average, the closer two employees are in the organizational tree, the more they communicate. This shows that communication increases exponentially by local proximity to others, similar to the the global clustering in Figure 2.
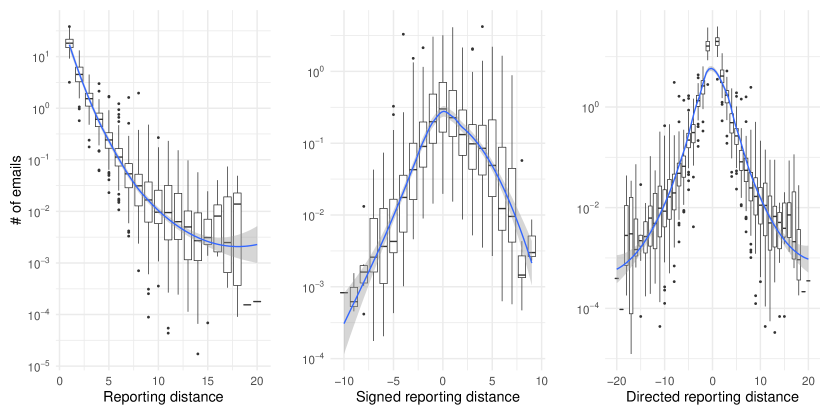
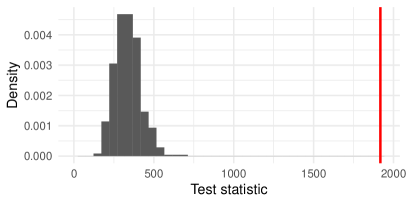
Does the frequency of communication between employees depend on their relative ranks in the organizational hierarchy? To assess whether the right and center plots of Figure 5 are symmetric about zero, we perform two permutation tests. Let . We construct a test statistic as
where . We obtain a null distribution by randomly permuting the number of emails exchanged among pairs whose reporting distances are the same. That is, by permuting the rows/columns of within the sets for . For each replicate, we obtain a new email network from which we can compute . By design, the relationship between the DRD in the organizational tree and communication in is symmetric around 0 under this permutation.
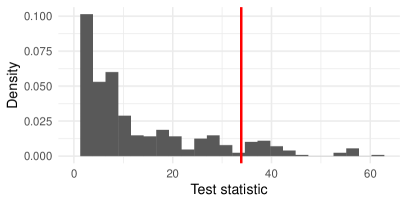
We repeat this times within each team, except for the 4 teams that had members, whose permutations were too computationally expensive. We compare the empirical distribution of the test statistic under permutation with , shown in Appendix Figure A.6. We find that the directed reporting difference is not symmetric about zero: that is, we reject the null hypothesis of symmetry under this permutation distribution at the empirical 95% confidence level. We similarly perform a test of symmetry for the signed reporting distance using the same permutation scheme but with the signed reporting distance in place of . We find the observed result is not significantly different than what we would expect for a truly symmetric relationship. The empirical distribution is shown in Appendix Figure A.6.
3.4 Reconstructing the organizational hierarchy
Finally, we assess the existing methodology for reconstructing a tree structure from network data. Each of the methods makes implicit assumptions about the relationship between the organizational hierarchy and emergent communication dynamics. Maiya and Berger-Wolf, (2009) propose a distance-based tree reconstruction model: “as the distance between individuals within a hierarchy grows, we assume the probability of interaction decays.” Gupte et al., (2011) propose a tree reconstruction method that minimizes agony in the communication network, based on the idea that “when people connect to other people who are lower in the hierarchy, this causes them social agony” and thus “higher rank nodes are less likely to connect to lower rank nodes”. As a benchmark method for tree reconstruction, we compute the minimum spanning tree of the communication network (Prim,, 1957). The minimum spanning tree of a graph is a tree with the same vertex set that minimizes the sum of the edge weights. The implicit model for the minimum spanning tree is therefore one that minimizes the total emails exchanged between connected nodes. As this is contrary to what we find – the highest rates of communication are between connected nodes (Figure 5) – we also implement the maximum spanning tree. We refer to these methods as “Distance,” “Agony,” “Min ST,” and “Max ST,” respectively.
To evaluate these approaches, we apply each reconstruction method separately to the team communication networks except for the 16 teams with 3,000 members. For Agony, we implement the algorithm from Tatti, (2014). For each reconstruction method, we compute the distance from the output tree to the true team organizational structure using the Frobenius distance and the centrality distance (Donnat and Holmes,, 2018). For the definitions and interpretations of these tree distances, see Appendix A.6. We also measure the classification rate of the “manager status” implicit in the reconstruction method, in which a node is a “manager” if its in degree is positive, i.e. the proportion of nodes whose leaf status in the reconstruction agrees with the true hierarchy.
We note that Agony guarantees the output is a Eulerian graph, which means that the in and out degrees are equal, but this ensures that the graph is not a tree. Similarly, Distance is guaranteed to produce a spanning graph, but a tree is not guaranteed since the maximum likelihood solution can place a node as the child of an unobserved root. We find, in fact, that using the email totals as weights in the distance-based model results in this trivial solution (all nodes are children of an unobserved root) for all of the teams, and consequently we only show the results based on the unweighted communication networks.
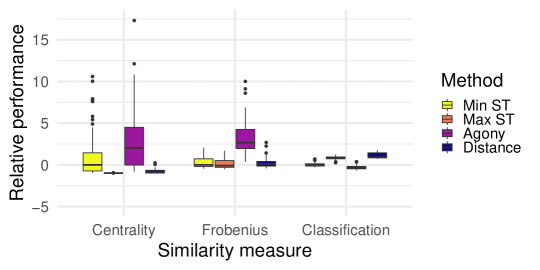
The results are given in Figure 6 and show that neither Agony nor Distance perform consistently better at reconstructing features of the organizational hierarchy than the baseline. To understand why, recall that Agony is based on the hypothesis that higher ranking nodes are less likely to communicate with lower ranking nodes. Under this implicit theory of communication dynamics, communication frequency ought to be asymmetric around agony. However, we find in Section 3.3 that communication frequency is not statistically significantly asymmetric about SRD, which is close to agony. Another reason this method performs poorly is that it assumes a linear relationship between level differences in the organizational hierarchy and communication patterns, which is not what we observe in Figure 5: there is more communication between high- and low-ranking employees than would be expected if communication decreased monotonically with reporting distance. This can be interpreted as less friction between far individuals and these direct lines of communication are suggestive of small-world paths within the organization. Gupte et al., (2011) noted that such non-linearity could be an interesting direction for future work. This non-linearity also primarily explains why the distance-based method from Maiya and Berger-Wolf, (2009) fails to reconstruct the true organizational hierarchy.
Finally, we note that the Frobenius distance, which counts edge and non-edge discrepancies equally is artificially low for “Distance” since a tree only has edges (out of possible edges) and Distance tends to output a graph with fewer edges. On the other hand, it is artificially high for Agony since Agony produces a Eulerian graph that tends to have many edges.
4 Discussion
In this study, we find that in a large and successful software company, communication patterns have a strong association with organizational structure and that communication between employees increases with their organizational proximity, both globally across the organization (Figure 2) and locally within teams (Figure 3). Figure 2 also provides evidence of the “rich club” phenomenon at the top of the organization in which the most central employees are embedded in dense communities (Colizza et al.,, 2006; Dong et al.,, 2015). Similarly, Figure 4 and Appendix Figure A.3 show that measures of employees’ centrality or importance in the communication network are larger for employees higher in the organizational chart, in agreement with several substantive theories of organizational behavior (Namata et al.,, 2006; Michalski et al.,, 2011; Wang et al.,, 2013).
Inspired by the use of hierarchical differences in the hierarchical position metric (Boeva et al.,, 2017), we have introduced new statistical measures of communication reciprocity. We find that information flows asymmetrically – more frequently up than down the organizational hierarchy – and that reciprocation of communication depends on employees’ position in the organization (Figure 4). In particular, high-ranking employees send emails that are reciprocated more often than they reciprocate emails. This finding supports agony (Gupte et al.,, 2011) as a useful measure of organizational distance, since communication frequency decreases as the distance between employees increases. However, we find that the emergent communication dynamics are much more complex than those predicted by existing theories. Consequently the reconstruction methods based on those overly simplistic theories inadequately capture the true relationships between these topological structures. Agony, for example, supposes that communication in social networks is governed by a latent social hierarchy in which more popular individuals (higher in the social hierarchy) are less likely to communicate with individuals below them in the social hierarchy. However, based on the lack of significance of our permutation test about the relationship between agony (equivalent to signed reporting distance) and communication frequency, as well as the poor performance of the agony-based reconstruction method in Figure 6, this theory may not be an accurate model for how communication works in an organization, which is not surprising since we should expect information to flow both up and down in a functioning organization. Similarly, Maiya and Berger-Wolf, (2009) assume communication decreases monotonically with reporting distance, which is not what we find in Figure 5. Instead, a more realistic distance-based method for organizations might encourage “small-world” links between upper management and low-level employees, as well as asymmetric communication up and down the hierarchy.
There are several limitations in this work. We were unable to match 11% of employees across the communication and organizational structures, which could affect team and global summary measures. In particular, if the missing employees had roles or structural positions substantially unlike those of observed employees, this could result in selection bias that might alter the associations we found between network characteristics and role. The temporal resolution of communication data is another possible limitation: although our measures of communication are observed rather than surveyed, the counts are aggregated over the entire month. For this reason, we have not conducted a temporal/longitudinal analysis of communication dynamics. We also do not have information about individual emails and multiple recipients, which prevents us from filtering out mass emails from super-senders (Guimera et al.,, 2006; Onnela et al.,, 2007) and from studying who initiates communication as a function of position in the hierarchy. Similarly, we do not have meta-data on the employees and teams. Most conspicuously, we are lacking productivity/performance metrics that would allow us to make concrete business suggestions about how to optimize the organizational structure if we had productivity measures on teams or employees. However, this suggests a causal analysis in order to disentangle whether organization links facilitate communication, or if people in dense organizations are naturally more communicative. Additionally, more contextual information (e.g. tenure at the company, previous positions within the company, projects assigned during the analysis time, etc.) would allow for more substantive interpretations of the results. Finally, computations for the non-degree centrality measures, the reporting distances, and the reconstruction methods were not feasible on the entire email network, and it is possible that the individual team results are not reflective of the entire organization.
The study of organizational communication – in large and successful businesses – is still an emerging field. As we have shown, some theories of organization and communication capture important features of real-world communication patterns. But these theories may be too simplistic to adequately explain or predict organizational structures using communication data alone. Empirical validation of organizational theories in a real data set, as we have tried to do here, is one way for management scholars to ensure that substantive hypotheses about communication dynamics match reality. Better measures of directional communication flow within organizational structures – like the signed and directional reporting distances proposed above – could help researchers understand these emergent communication dynamics. Likewise, improved methods for reconstructing organizations should be rooted in realistic ideas about how directional communication dynamics relate to the organizational structure, rather than facile theories of employee popularity or importance. Development of realistic explanatory models of communication conditional on an organizational tree might permit more accurate reconstruction of organizational trees.
References
- Bastian et al., (2009) Bastian, M., Heymann, S., and Jacomy, M. (2009). Gephi: an open source software for exploring and manipulating networks. In Proceedings of the international AAAI conference on web and social media, volume 3, pages 361–362.
- Boeva et al., (2017) Boeva, V., Lundberg, L., Kota, S. M. H., and Sköld, L. (2017). Analysis of organizational structure through cluster validation techniques: Evaluation of email communications at an organizational level. In 2017 IEEE International Conference on Data Mining Workshops (ICDMW), pages 170–176. IEEE.
- Broido and Clauset, (2019) Broido, A. D. and Clauset, A. (2019). Scale-free networks are rare. Nature Communications, 10(1):1–10.
- Capobianco and Molluzzo, (1979) Capobianco, M. F. and Molluzzo, J. C. (1979). The strength of a graph and its application to organizational structure. Social Networks, 2(3):275–283.
- Clauset et al., (2008) Clauset, A., Moore, C., and Newman, M. E. (2008). Hierarchical structure and the prediction of missing links in networks. Nature, 453(7191):98–101.
- Clauset et al., (2009) Clauset, A., Shalizi, C. R., and Newman, M. E. (2009). Power-law distributions in empirical data. SIAM Review, 51(4):661–703.
- Colizza et al., (2006) Colizza, V., Flammini, A., Serrano, M. A., and Vespignani, A. (2006). Detecting rich-club ordering in complex networks. Nature Physics, 2(2):110–115.
- Creamer et al., (2007) Creamer, G., Rowe, R., Hershkop, S., and Stolfo, S. J. (2007). Segmentation and automated social hierarchy detection through email network analysis. In International Workshop on Social Network Mining and Analysis, pages 40–58. Springer.
- Cross et al., (2002) Cross, R., Borgatti, S. P., and Parker, A. (2002). Making invisible work visible: Using social network analysis to support strategic collaboration. California Management Review, 44(2):25–46.
- Cross et al., (2007) Cross, R., Parise, S., and Weiss, L. M. (2007). The role of networks in organizational change. The McKinsey Quarterly, 3:28–41.
- Diesner and Carley, (2005) Diesner, J. and Carley, K. M. (2005). Exploration of communication networks from the Enron email corpus. In SIAM International Conference on Data Mining: Workshop on Link Analysis, Counterterrorism and Security, Newport Beach, CA, pages 3–14. Citeseer.
- Dong et al., (2015) Dong, Y., Tang, J., Chawla, N. V., Lou, T., Yang, Y., and Wang, B. (2015). Inferring social status and rich club effects in enterprise communication networks. PloS One, 10(3):e0119446.
- Donnat and Holmes, (2018) Donnat, C. and Holmes, S. (2018). Tracking network dynamics: A survey using graph distances. The Annals of Applied Statistics, 12(2):971–1012.
- Eckhaus and Sheaffer, (2018) Eckhaus, E. and Sheaffer, Z. (2018). Managerial hubris detection: the case of Enron. Risk Management, 20(4):304–325.
- Fire and Puzis, (2016) Fire, M. and Puzis, R. (2016). Organization mining using online social networks. Networks and Spatial Economics, 16(2):545–578.
- Galbraith, (2008) Galbraith, J. R. (2008). Organization design. Handbook of Organization Development, pages 325–352.
- Garlaschelli and Loffredo, (2004) Garlaschelli, D. and Loffredo, M. I. (2004). Patterns of link reciprocity in directed networks. Physical review letters, 93(26):268701.
- Gillespie, (2015) Gillespie, C. S. (2015). Fitting heavy tailed distributions: The powerlaw package. Journal of Statistical Software, 64(2):1–16.
- Guimera et al., (2006) Guimera, R., Danon, L., Diaz-Guilera, A., Giralt, F., and Arenas, A. (2006). The real communication network behind the formal chart: Community structure in organizations. Journal of Economic Behavior & Organization, 61(4):653–667.
- Gupte et al., (2011) Gupte, M., Shankar, P., Li, J., Muthukrishnan, S., and Iftode, L. (2011). Finding hierarchy in directed online social networks. In Proceedings of the 20th International Conference on World Wide Web, pages 557–566.
- Hatch and Schultz, (1997) Hatch, M. J. and Schultz, M. (1997). Relations between organizational culture, identity and image. European Journal of Marketing.
- Holtzhausen, (2002) Holtzhausen, D. (2002). The effects of a divisionalised and decentralised organisational structure on a formal internal communication function in a South African organisation. Journal of Communication Management.
- Hossain, (2009) Hossain, L. (2009). Effect of organisational position and network centrality on project coordination. International Journal of Project Management, 27(7):680–689.
- Kim, (1968) Kim, Y.-W. (1968). Pseudo quasi metric spaces. Proceedings of the Japan Academy, 44(10):1009–1012.
- Klimt and Yang, (2004) Klimt, B. and Yang, Y. (2004). The Enron corpus: A new dataset for email classification research. In European Conference on Machine Learning, pages 217–226. Springer.
- Kolaczyk and Csárdi, (2014) Kolaczyk, E. D. and Csárdi, G. (2014). Statistical Analysis of Network Data With R, volume 65. Springer.
- Krackhardt and Hanson, (1993) Krackhardt, D. and Hanson, J. R. (1993). Informal networks: The company behind the chart. Harvard Business Review, pages 104–111.
- Krackhardt and Stern, (1988) Krackhardt, D. and Stern, R. N. (1988). Informal networks and organizational crises: An experimental simulation. Social Psychology Quarterly, pages 123–140.
- Maiya and Berger-Wolf, (2009) Maiya, A. S. and Berger-Wolf, T. Y. (2009). Inferring the maximum likelihood hierarchy in social networks. In 2009 International Conference on Computational Science and Engineering, volume 4, pages 245–250. IEEE.
- Michalski et al., (2011) Michalski, R., Palus, S., and Kazienko, P. (2011). Matching organizational structure and social network extracted from email communication. In International Conference on Business Information Systems, pages 197–206. Springer.
- Namata et al., (2006) Namata, G., Getoor, L., and Diehl, C. (2006). Inferring formal titles in organizational email archives. In Proc. of the ICML Workshop on Statistical Network Analysis.
- Nielsen, (2016) Nielsen, C. (2016). What work email can reveal about performance and potential. Harvard Business Review.
- Nurek and Michalski, (2020) Nurek, M. and Michalski, R. (2020). Combining machine learning and social network analysis to reveal the organizational structures. Applied Sciences, 10(5):1699.
- Onnela et al., (2007) Onnela, J.-P., Saramäki, J., Hyvönen, J., Szabó, G., Lazer, D., Kaski, K., Kertész, J., and Barabási, A.-L. (2007). Structure and tie strengths in mobile communication networks. Proceedings of the National Academy of Sciences, 104(18):7332–7336.
- Page et al., (1999) Page, L., Brin, S., Motwani, R., and Winograd, T. (1999). The pagerank citation ranking: Bringing order to the web. Technical report, Stanford InfoLab.
- Palus et al., (2011) Palus, S., Brodka, P., and Kazienko, P. (2011). Evaluation of organization structure based on email interactions. International Journal of Knowledge Society Research (IJKSR), 2(1):1–13.
- Prim, (1957) Prim, R. C. (1957). Shortest connection networks and some generalizations. The Bell System Technical Journal, 36(6):1389–1401.
- Robbins, (2004) Robbins, S. P. (2004). Organizational Theory: Structure, Design and Applications.
- Rowe et al., (2007) Rowe, R., Creamer, G., Hershkop, S., and Stolfo, S. J. (2007). Automated social hierarchy detection through email network analysis. In Proceedings of the 9th WebKDD and 1st SNA-KDD 2007 Workshop on Web Mining and Social Network Analysis, pages 109–117.
- Shetty and Adibi, (2004) Shetty, J. and Adibi, J. (2004). The Enron email dataset database schema and brief statistical report. Information sciences institute technical report, University of Southern California, 4(1):120–128.
- Sims et al., (2014) Sims, B. H., Sinitsyn, N., and Eidenbenz, S. J. (2014). Hierarchical and matrix structures in a large organizational email network: visualization and modeling approaches. In Social Network Analysis-Community Detection and Evolution, pages 27–43. Springer.
- Squartini et al., (2013) Squartini, T., Picciolo, F., Ruzzenenti, F., and Garlaschelli, D. (2013). Reciprocity of weighted networks. Scientific Reports, 3(1):1–9.
- Tatti, (2014) Tatti, N. (2014). Faster way to agony. In Joint European Conference on Machine Learning and Knowledge Discovery in Databases, pages 163–178. Springer.
- Tichy et al., (1979) Tichy, N. M., Tushman, M. L., and Fombrun, C. (1979). Social network analysis for organizations. Academy of Management Review, 4(4):507–519.
- Wang et al., (2013) Wang, Y., Iliofotou, M., Faloutsos, M., and Wu, B. (2013). Analyzing communication interaction networks (CINs) in enterprises and inferring hierarchies. Computer Networks, 57(10):2147–2158.
- Zhang et al., (2009) Zhang, C., Hurst, W. B., Lenin, R. B., Yuruk, N., and Ramaswamy, S. (2009). Analyzing organizational structures using social network analysis. In Advances in Enterprise Engineering III, pages 143–156. Springer.
Appendix A Appendix
A.1 Analyses of communication and organizational structure in the Enron corpus
The Enron email corpus consists of email communications among a group of senior employees of the firm in advance of its collapse in 2001 \citepsuppklimt2004enron, and has been used to study the relationship between organizational hierarchy and communication patterns. We summarize relevant analyses in Table A.1.
| Citation | Task | Method |
|---|---|---|
| \citetsuppshetty2004enron | Classify rank | Entropy |
| \citetsuppnamata2006inferring | Classify rank | Email counts |
| \citetsupprowe2007automated | Classify rank | Flow and topological statistics |
| \citetsuppcreamer2007segmentation | Reconstruct organization | Classify rank then add edges |
| \citetsupphossain2009effect | Classify rank | Centrality |
| \citetsuppzhang2009analyzing | Predict missing rank | Sent vs received email counts |
| \citetsuppmichalski2011matching | Classify rank | Centrality |
| \citetsupppalus2011evaluation | Compare hierarchies | Hierarchical Position vs Social Score |
| \citetsuppwang2013analyzing | Classify rank | PageRank modification |
| \citetsuppdong2015inferring | Classify rank | Structural holes |
| \citetsuppnurek2020combining | Classify rank | Exogenous nodal information |
A.2 Scale-free analysis
A primary feature of network analyses is the study of the network’s degree distribution, and one of the most prevalent beliefs is the ubiquity of scale-free networks \citepsuppalbert2002statistical. However, a more recent survey concludes that scale-free networks are rare \citepsuppbroido2019scale. Using the same methodology, we classify the the email networks at the team level, which is summarized in Figure A.1. Note that in our analysis, we include every team even though only 9 of the 88 teams satisfies the original inclusion criteria from \citetsuppbroido2019scale that the mean degree is less than .
A.3 Comparing network summary statistics
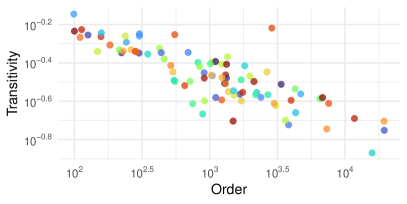
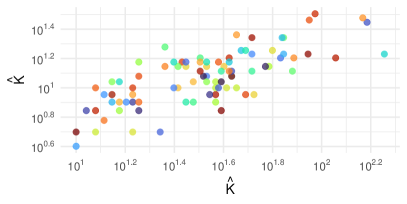
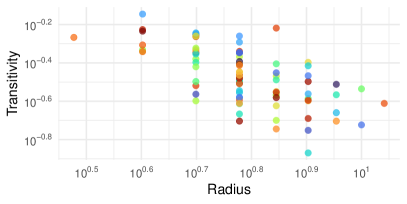
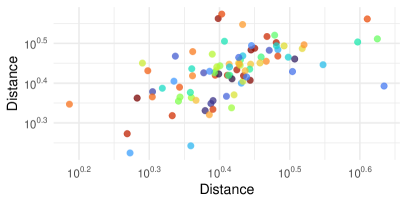
There are many network summary statistics that we can compute for both the email network and organizational tree. In Figure A.2, we show four of the clearest relationships between individual network summary statistics of a team’s organizational tree (x-axis) and their corresponding email network (y-axis). Starting at the top left and going clockwise, the Pearson correlations are , and .
A.4 Importance in email network
A.4.1 Linear model of position on degree/strength
Figure 4 shows that both degree and strength are negatively associated with position in the hierarchy. That is, the lower an employee is in their team’s hierarchy, the lower their degree/strength. To assess whether this relationship is significant, we run four linear models of position against (log) degree and (log) strength. Table A.2 provides the coefficient estimates and standard errors, which reveals that all four relationships are significantly different than zero.
| Model | (SE) | (SE) |
|---|---|---|
| 505.70 (4.66) | -374.22 (6.69) | |
| 1625.32 (14.73) | -1117.26 (21.26) | |
| 6.20 (0.02) | -1.90 (0.02) | |
| 7.35 (0.02) | -1.89 (0.03) |
A.4.2 Centrality measures
We want to assess whether importance in the email network corresponds to importance in the organization. We assess this for each team and importance in the team’s organization is defined as relative position. For importance in the email network, we consider four measures of centrality – betweenness, closeness, eigenvalue, and authority \citepsupp[see][for definitions]kolaczyk2014statistical – which is shown in Figure A.3.
A.5 Path analysis
A.5.1 Computing and
In a tree , there is a unique shortest path between any two nodes . This shortest path can take steps both up and down the tree, and hence its length is the sum of the number of steps up and down, . Dijkstra’s algorithm is used to compute the shortest path lengths between the nodes in a graph, and can be modified to compute and as follows.
First, assume is directed down, i.e. the in-degree of the root node is 0 and all other nodes have in-degree equal to 1. Create the transpose of that is directed up, say , and then create the graph . Note that the adjacency matrix of is now symmetric. We equip weights to the edges of such that,
where and are prime and . Next, run Dijkstra’s algorithm on , which will return the shortest (weighted) path lengths between all nodes, say . We can finally recover the desired quantities as
In our calculations, we take and .
A.5.2 Reporting distances
Both signed reporting distance and directed reported distance can be negative, so neither is a true metric. Moreover, neither satisfies the identity of indiscernibles, since any two nodes that are on the same level will have SRD and DRD equal to zero. Likewise, neither satisfies symmetry. However, they both satisfy a negative symmetry since and .
DRD does not satisfy the triangle inequality. As one counterexample, suppose reports directly to , and both and are direct reports to some fourth node. Then , but and .
Interestingly, SRD satisfies the triangle equality.
Proposition 1.
Let be a tree. For any ,
Proof.
Let . If any two nodes are the same, then the result is trivial since .
Next, let all be different. Suppose lies on the shortest path from to . It follows that . Thus
The last equality is due to the fact that, since lies on the shortest path from to , .
On the other hand, suppose does not lie on the shortest path from to . We proceed by induction on the length of the shortest path from to . If , then, and are connected. Without loss of generality, say and . Then the shortest path from to is just one edge longer than the shortest path from to . That is, . Thus
The penultimate equality uses the fact that To see the last equality, observe that since , we know that must report directly to . Furthermore, because does not lie on the path from to , the first step on the shortest path from to must go down. Therefore, the shortest path from to must go through . It follows that , hence
With our basis for induction established, assume that holds for . We are done if we can show the result holds when .
If , then there exists a point on the shortest path from to . Since , we know that and . By assumption, it follows that and . Putting these together, we have
Note that the penultimate equality follows from the fact that is on the shortest path from to . Our induction is complete and concludes our proof. ∎
A.5.3 Communication frequency
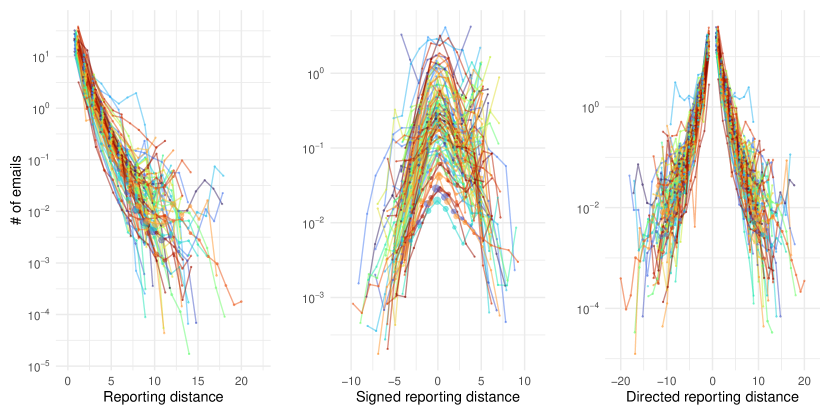
Figure A.4 shows the communication frequency between pairs of employees as a function of the reporting distances. As in Figure 5, on average, the closer two employees are in the organizational tree, the more frequently they communicate.
A.5.4 Team path analysis
In Figure 5, we summarized the average number of emails exchanged across teams in boxplots. In Figure A.5, we show the same plot broken out by individual team.
A.5.5 Permutation tests
We performed two permutation tests to see whether the right and center plots of Figure 5 are symmetric about zero. Recall that our test statistic is
where and . In Figure A.6, we show our null distributions, which we obtained by randomly permuting the number of emails exchanged among pairs whose reporting distances are the same. The null distributions are aggregated over different permutations within each team, except for the 4 teams that had members, whose permutations were too computationally expensive. The empirical test statistics are given by the red lines.
A.6 Tree distances
| (Frobenius) | ||||
| (\citetsupp[Eq 4.2]donnat2018tracking) |
The first measures how many edges are in agreement between the estimated tree, , and the true tree, . The second measures the agreement of centrality measures for the nodes in each graph and “a change in centrality can be understood as a drift of the node away from (or toward) the core of the network” \citepsuppdonnat2018tracking.
ref \bibliographystylesuppapalike