The black hole X-ray binary MAXI J1348–630 in quiescence
Abstract
The properties of the disk/jet coupling in quiescent black hole low mass X-ray binaries (BH LMXBs) are still largely unknown. In this paper we present the first quasi-simultaneous radio and X-ray detection in quiescence of the BH LMXB MAXI J1348–630, which is known to display a hybrid disk/jet connection that depends on the accretion rate. We performed deep X-ray and radio observations using the Chandra X-ray Observatory and the Australia Telescope Compact Array. MAXI J1348–630 is detected for the first time in quiescence at an X-ray luminosity erg s-1: one of the lowest X-ray luminosities observed for a quiescent BH LMXB, possibly implying a short orbital period for the system. MAXI J1348–630 is also detected in radio at erg s-1. These detections allow us to constrain the location of MAXI J1348–630 on the radio/X-ray diagram in quiescence, finding that the source belongs to the standard (radio-loud) track in this phase. This provides a strong confirmation that hybrid-correlation sources follow the standard track at low luminosities and down to quiescence, thus improving our knowledge of the disk/jet connection in BH LMXBs.
keywords:
accretion, accretion discs – black holes physics – stars: individual: MAXI J1348–630 – ISM: jets and outflows – radio continuum: stars – X-rays: binaries1 Introduction
Black holes (BH) low mass X-ray binaries (LMXBs) are generally observed when they enter into bright outbursts. During such phases, the X-ray luminosity from the accretion disk increases by several orders of magnitude, and the systems transition between different accretion states with well-defined spectral and timing properties (Homan & Belloni, 2005; Remillard & McClintock, 2006; Tetarenko et al., 2016; Belloni & Motta, 2016). In addition, synchrotron-emitting compact jets and moving plasma bubbles, which carry away a significant fraction of the accretion power, are observed in the radio band during, respectively, the hard state and the hard-to-soft state transition (e.g. Corbel et al. 2000; Fender 2001, 2006). However, BH LMXBs are for most of their time in a quiescent state, with low accretion rates and X-ray luminosities in the range between and erg s-1, corresponding to Eddington fractions of for a 10 BH (e.g. Plotkin et al. 2013; Reynolds et al. 2014; Plotkin et al. 2021). While quiescence is the most common state for a BH LMXB, the properties of the accretion flow and of the jets at low luminosities still need to be properly characterized.
When in quiescence, the infrared and optical emission from these systems is dominated by the companion star, while compact jets, albeit faint, are still present and can be detected in the radio band (e.g. Plotkin et al. 2017; Gallo et al. 2019). It appears that the jet properties are essentially the same between outburst and quiescence, with the radio spectrum that might change from flat-to-inverted to moderately steep (Corbel et al., 2013; Tremou et al., 2020). This supports the current picture of the quiescence state as a sort of low-luminosity version of the hard state, with very similar spectral and physical properties (e.g. Gallo et al. 2019). Moreover, the compact jets in quiescence might channel a larger fraction (with respect to the outburst phase) of the radiative power of the accretion flow, strongly motivating radio observations of quiescent accreting compact objects (e.g. Plotkin et al. 2019). The dominance of the jets at these low luminosities is also believed to be responsible for an observed progressive X-ray spectral softening (e.g. Corbel et al. 2006; Plotkin et al. 2013). In analogy with the hard state, the properties of the accretion flow should also be similar, and, according to one of the main proposed scenarios, the BH could be fed by a hot radiatively inefficient accretion flow (e.g. Narayan & Yi 1994; Esin et al. 1997).
Compact jets from BH LMXBs are fundamentally connected to the accretion flow, as the levels of jet emission strongly depends on the accretion rate, both in outburst and in quiescence. This is observed in the hard state as a non-linear correlation between the radio and X-ray luminosities taking the form of a power law (). Such correlation is observed over several orders of magnitude in luminosity on the so-called radio/X-ray diagram (e.g. Hannikainen et al. 1998; Corbel et al. 2000; Corbel et al. 2003), and it is today an important diagnostic of the accretion/ejection coupling in BH LMXBs, which can also be used to constrain the emission mechanisms in these sources. Two main groups of BHs are currently observed on the radio/X-ray diagram, displaying two distinct correlations with different power law indices . The upper track, historically called standard, but often referred to as radio-loud, is characterised by and includes well-known sources as GX 339–4, V404 Cyg and MAXI J1820070 (Corbel et al., 2000; Corbel et al., 2003; Corbel et al., 2013; Gallo et al., 2003; Bright et al., 2020; Shaw et al., 2021). On the other hand, sources on the lower track are labeled as outliers (or radio-quiet) and display indices (Coriat et al., 2011; Jonker et al., 2012; Gallo et al., 2014; Monageng et al., 2021; Carotenuto et al., 2021b). The majority of BH LMXBs appears now to belong to this second group. Interestingly, thanks to dense monitoring campaigns, some of the outliers were found to display a hybrid correlation, transitioning between the two tracks at different X-ray luminosities, between and (Coriat et al., 2011; Carotenuto et al., 2021b). While the size of the available data sets of BH LMXBs on the radio/X-ray diagram increased considerably in the recent years, the reasons for the observed distribution of sources on the diagram are still unclear. Possible explanations include geometric effects, different jet physical properties and different accretion flow properties (e.g. Pe’er & Casella 2009; Coriat et al. 2011; Xie & Yuan 2016; Motta et al. 2018).
Much less is known about the properties of the two groups of sources in quiescence, since the quiescent regions of the radio/X-ray diagram are still greatly unexplored, due to the extreme faintness of quiescent BH LMXBs. So far, only a handful of BH LMXBs have been detected in quiescence, mostly appearing to be compatible with the standard track (e.g. Gallo et al. 2006; Miller-Jones et al. 2011; Corbel et al. 2013; Ribó et al. 2017; Tremou et al. 2020), while the behaviour of outliers is completely uncertain. Outlier (or hybrid) sources could re-join the standard track in quiescence (Coriat et al., 2011), but this has still to be confirmed with additional observations.
In this Letter we present the first radio and X-ray detection in quiescence of MAXI J1348–630, constraining its location on the diagram at the lowest possible luminosities. MAXI J1348–630 is a BH LMXB discovered in 2019, when it entered into a bright outburst (Tominaga et al., 2020). The source appears to be located at a close distance, between 2.2 and 3.4 kpc (Chauhan et al., 2021; Lamer et al., 2021), which is favourable for a study of the system in quiescence. In Carotenuto et al. (2021a) we have presented the full radio and X-ray monitoring of MAXI J1348–630 during its 2019/2020 outburst, and we refer to that paper for details on the various outburst phases. Our radio observations detected and covered the entire evolution of compact jets in the outburst phase, during which MAXI J1348–630 also displayed some extremely energetic large-scale discrete ejecta (Carotenuto et al., 2021a; Carotenuto et al., 2022). Combining the detections of compact jets with the quasi-simultaneous X-ray observations, we were able to cover the whole evolution of MAXI J1348–630 on the radio/X-ray diagram, finding that this source belongs to the numerous group of outliers. In fact, MAXI J1348–630 displays a clear hybrid radio/X-ray correlation, re-joining the standard track at erg s-1, and it is today the hybrid-correlation source with the most detailed coverage on the diagram, and such coverage was obtained during a single outburst (Carotenuto et al., 2021b). Therefore, constraining its behaviour in quiescence is critical for completing the full track of the source on the radio/X-ray diagram, which is something unprecedented an hybrid source.
2 Observations
To constrain the quiescent level of MAXI J1348–630 in radio and X-rays, we performed a quasi-simultaneous observation of the source with the NASA Chandra X-ray observatory (Weisskopf et al., 2000) and with the Australia Telescope Compact Array (ATCA, Frater et al. 1992).
2.1 Chandra observation
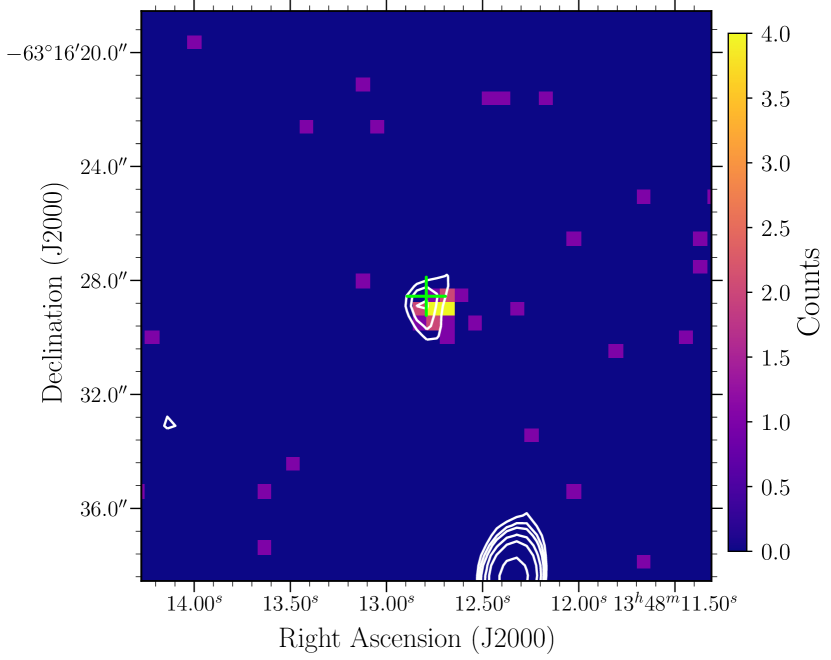
The Chandra observations of MAXI J1348–630 were performed with the Advanced CCD Imaging Spectrometer (ACIS-S) on 2021 June 28 (30 ks; ObsId 25054) under Director’s Discretionary Time (PI: F. Carotenuto). We restricted the observation to the back-illuminated chip S3, providing the best low-energy response. The X-ray data analysis was performed using the Chandra Interactive Analysis of Observation (CIAO) software 4.14.1 (Fruscione et al., 2006), with the calibration files CALDB version 4.9.6. We filtered to only keep the events in the energy range 0.3–8 keV. No background flare was detected. The fluximage script was used to create the X-ray images, keeping the bin size to 1 (1 pixel = 0.492″) (see Fig. 1). A single X-ray source is detected at a position consistent with MAXI J1348–630.
We extracted an energy spectrum in the 0.3–8 keV energy range from a circular source region with a 2″ radius, while the background was extracted from an annulus with an inner radius of 10″ and an outer radius of 20″. Spectral analysis was carried out with XSPEC (Arnaud, 1996). Our main goal with the X-ray spectral analysis was to estimate the unabsorbed flux in the 1–10 keV band. Hence, we fitted the spectrum with a simple absorbed power law model (tbabspowerlaw), for which the tbabs component accounts for interstellar absorption, modelled with an equivalent hydrogen column density () by using wilm abundances (Wilms et al., 2000) and vern cross-sections (Verner et al., 1996). Concerning the spectral parameters, the power law photon index was fixed to , in accordance with what is generally measured for BH LMXBs in quiescence (Corbel et al., 2006, 2008; Plotkin et al., 2013), and the column density was fixed to cm-2, measured from X-ray observations during the outburst (Carotenuto et al., 2021a, b). As generally prescribed for low-counts observations, Cash statistics cstat (Cash, 1979) was used in the fitting process. We then calculated the 1–10 keV X-ray unabsorbed flux using the XSPEC convolution model cflux.
2.2 ATCA observation
A long ATCA observation was performed between 3 and 5 July 2021, less than a week after the Chandra observation, for a total of 24 hours on source (proposal ID C3416, PI Carotenuto). During this interval, the array was in the 6B extended configuration. The observation was taken simultaneously in the C and X bands, at central frequencies of 5.5 and 9 GHz, respectively. For each central frequency, the total bandwidth was 2 GHz. PKS 1934–638 was used for bandpass and flux calibration, while PKS 1352–63 was used for the complex gain calibration. The data were first flagged and then calibrated using standard procedures with the Common Astronomy Software Application (casa, McMullin et al. 2007). Imaging was carried out with the standard tclean algorithm in casa with a natural weighting scheme chosen in order to maximize sensitivity. To obtain the lowest possible rms, we stacked the two bands into a single image, adopting the Multi-term (Multi Scale) Multi-Frequency Synthesis (MTMFS, or MS-MFS, Rau & Cornwell 2011) as a deconvolution algorithm in order to take into account the large fractional bandwidth, using two Taylor terms. In this configuration, the rms reached 3 Jy beam-1. To obtain the radio flux density , we fitted a point source in the image plane with the casa task imfit.
3 The quiescent level of MAXI J1348–630

We obtained a significant detection of MAXI J1348–630 in quiescence, both in radio and X-rays. The detection is shown in Figure 1. In the X-rays, 21 counts from MAXI J1348–630 were collected by Chandra (0.3–8 keV) in the 30 ks of exposure, implying an unambiguous detection at the lowest level of activity of the source. After spectral fitting (Section 2.1), we obtain an integrated unabsorbed flux erg cm-2 s-1 in the 110 keV energy range. This can be then converted to the integrated luminosity . For consistency with Carotenuto et al. (2021b), in this paper we assume distance kpc (Chauhan et al., 2021) and we quote the luminosities with a factor in order to include the distance estimation by Lamer et al. (2021). We obtain erg s-1.
MAXI J1348–630 has also been detected in radio during its quiescence phase. As can be seen from Figure 1, with 24 h of ATCA exposure time, MAXI J1348–630 is detected as a point source at its known location, at a significance level of and with a peak flux of Jy. The faint radio emission coming from the core location can be safely attributed to the presence of compact jets in quiescence, as observed for other BH LMXBs (Corbel et al., 2013; Gallo et al., 2019; Tremou et al., 2020). We then converted the measured radio flux density to the 5 GHz monochromatic luminosity , conservatively assuming a flat radio spectrum. This leads to a monochromatic 5 GHz radio luminosity erg s-1.
With the quasi-simultaneous radio and X-ray detection in quiescence, we obtain a new, critical measurement for MAXI J1348–630, completing the coverage of this source on the radio/X-ray diagram. The updated radio/X-ray diagram is shown in Figure 2. One can immediately notice that MAXI J1348–630 aligns very well with the standard track defined by GX 339–4, V404 Cyg and MAXI J1820070 (e.g. Corbel et al. 2013). Along the detection in quiescence, the clear confirmation that MAXI J1348–630 lies on the standard track in quiescence is one of the main results of this work. We performed a a simple power law fit to the three points on the diagram with erg s-1 (see Figure 2 and Carotenuto et al. 2021b), including the detection in quiescence and the two lowest detection in the outburst lying on the standard track. The fit, relying on curvefit from the SciPy package, yields , which is fully consistent with the standard track (e.g. Corbel et al. 2013).
4 Discussion
MAXI J1348–630 is one of the few BH LMXBs detected in quiescence both in the radio and X-ray bands. Due to the need of quasi-simultaneous deep observations, these detections are exceedingly rare at present. Even if a model-independent mass estimation of the BH is not yet available, the quiescence X-ray luminosity of MAXI J1348–630 corresponds to an Eddington fraction 10, assuming a BH. Currently, the BH LMXB with the lowest known X-ray luminosity in quiescence is GS 2000+25, detected with Chandra at 1030 erg s-1, namely 10 (Rodriguez et al., 2020). The detections at such low Eddington fractions are among the lowest level of activity ever explored for an accreting compact object. However, for GS 2000+25 a radio counterpart was not detected (Rodriguez et al., 2020).
The most interesting result of this work revolves around the location of MAXI J1348–630 on the radio/X-ray diagram in quiescence. In Carotenuto et al. (2021b), we demonstrated that MAXI J1348–630 belongs to the less-explored group of the so-called hybrid-correlation sources. With this detection, we can confirm for the first time that these sources follow the standard track down to quiescence. Moreover, after this work and the coverage presented in Carotenuto et al. (2021b), MAXI J1348–630 becomes the first BH LMXB to be characterised on the radio/X-ray diagram for over seven orders of magnitude in X-ray luminosity and almost four orders of magnitude in radio luminosity, during a single outburst and in quiescence. The continuity of evolution on the standard track from the end of the outburst (see Figure 2 and Carotenuto et al. 2021b), and the displayed power law X-ray spectrum, are consistent with the current picture of the quiescence state as a low-luminosity analogue of the hard state (e.g. Gallo et al. 2019).
It is then possible to compare the location of MAXI J1348–630 on the diagram with the handful of other BH LMXBs for which radio and X-ray detections in quiescence are available, shown in Figure 2. MAXI J1348–630 appears to have a quiescence luminosity that is comparable in radio and X-rays with A0620–00 (Gallo et al., 2006), MWC 656 (Ribó et al., 2017) and XTE J1118+480 (Gallo et al., 2014). Stringent radio upper limits are also available for Swift J1357.2–0933 (Plotkin et al., 2016) and GS 2000+25 (Rodriguez et al., 2020). On the other hand, MAXI J1348–630 displays a quiescent luminosity which is at least one order of magnitude lower than other very relevant quiescent BH LMXBs on the diagram, such as GX 339–4 (Corbel et al., 2013; Tremou et al., 2020) and V404 Cyg (Plotkin et al., 2017).
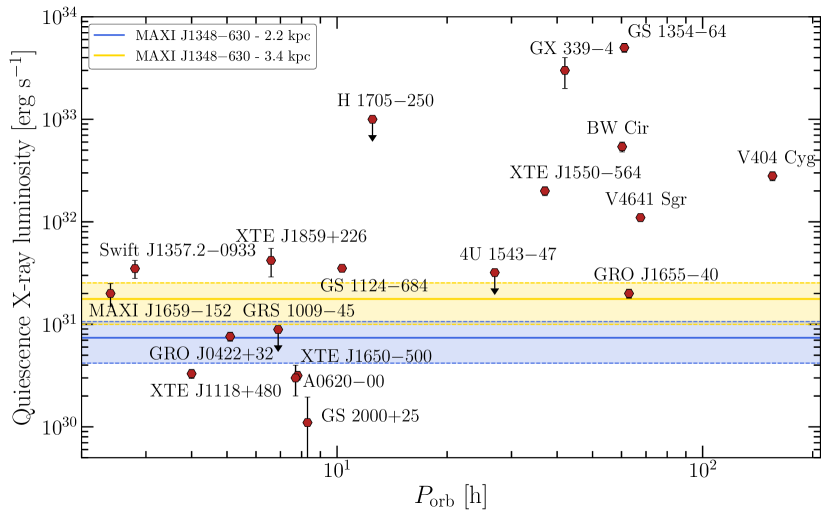
A relation between the quiescent X-ray luminosity and the orbital period exists for X-ray binaries (Menou et al., 1999; Garcia et al., 2001), where a higher in quiescence is expected for higher , due to the larger size of the accretion disk. While the orbital period of MAXI J1348–630 is currently unknown, from its quiescence X-ray luminosity it is possible to speculate that its is likely shorter than h, as can be seen from Figure 3, at both possible distances. This is also in line with the peak luminosity in outburst ( , Carotenuto et al. 2021a), which might suggest a similar order of magnitude for (Wu et al., 2010).
A detection of MAXI J1348–630 in quiescence on the standard track also supports the findings obtained for V404 Cyg and MAXI J1820070 (Plotkin et al., 2017; Shaw et al., 2021), ruling out the possibility that the X-ray emission in quiescence is dominated by the synchrotron radiation produced by the jet. Such scenario, in fact, would result in a steepening of the observed correlation at low luminosities (Yuan & Cui, 2005), which is instead not observed.
The X-ray spectrum of MAXI J1348–630 in quiescence can be adequately described with an absorbed power law with . The spectral softening when approaching quiescence is a well-known phenomenon (Corbel et al., 2006, 2008; Plotkin et al., 2013; Liu et al., 2019), observed also in MAXI J1348–630 (Carotenuto et al., 2021a). Such softening could be explained by a lack of hard X-ray photons resulting from the decrease of the inverse Compton scattering efficiency at low luminosities (Esin et al., 1997; Qiao & Liu, 2013; Liu et al., 2019), or by a dominance at low accretion rate of Comptonization from thermal particles at the base of the jet, and not in the corona (Markoff et al., 2005; Poutanen et al., 2014; Plotkin et al., 2015).
Thanks to this new detection in quiescence, we obtained the complete coverage of the evolution of MAXI J1348–630 on the radio/X-ray diagram, from the quiescent state to the peak luminosity during the outburst. We believe that the full data set of MAXI J1348–630 on the diagram will turn out to be particularly important for testing different models describing the disk/jet connection in accreting BHs, leading to major improvements in our understanding of hybrid-correlation sources and, more in general, of the behaviour of BH LMXBs on the diagram.
Acknowledgements
We thank the anonymous referee for the careful reading of the manuscript and for the valuable comments. This research has made use of data obtained from the Chandra X-ray Observatory and software provided by the Chandra X-ray Center (CXC) in the application package CIAO. FC, SC and AT thank Jamie Stevens and staff from the Australia Telescope National Facility (ATNF) for scheduling the ATCA radio observations. ATCA is part of the ATNF which is funded by the Australian Government for operation as a National Facility managed by CSIRO. We acknowledge the Gomeroi people as the traditional owners of the ATCA observatory site. FC acknowledges support from the Royal Society through the Newton International Fellowship programme (NIF/R1/211296) and from the project Initiative d’Excellence (IdEx) of Université de Paris (ANR-18-IDEX-0001). We acknowledge the use of the Nançay Data Center, hosted by the Nançay Radio Observatory (Observatoire de Paris-PSL, CNRS, Université d’Orléans), and supported by Region Centre-Val de Loire. This project also made use of matplotlib (Hunter, 2007), numpy (Harris et al., 2020) and Overleaf (http://www.overleaf.com).
Data availability
The un-calibrated ATCA visibility data are publicly available at the ATNF archive at https://atoa.atnf.csiro.au. The Chandra data are instead available from the Chandra Data Archive at https://cxc.harvard.edu/cda.
References
- Arnaud (1996) Arnaud K. A., 1996, in Jacoby G. H., Barnes J., eds, Astronomical Society of the Pacific Conference Series Vol. 101, Astronomical Data Analysis Software and Systems V. p. 17
- Belloni & Motta (2016) Belloni T. M., Motta S. E., 2016, Transient Black Hole Binaries. Springer-Verlag, p. 61, doi:10.1007/978-3-662-52859-4_2
- Bright et al. (2020) Bright J., et al., 2020, Nature Astronomy, 4, 1
- Carotenuto et al. (2021a) Carotenuto F., et al., 2021a, MNRAS, 504, 444
- Carotenuto et al. (2021b) Carotenuto F., et al., 2021b, MNRAS, 505, L58
- Carotenuto et al. (2022) Carotenuto F., Tetarenko A. J., Corbel S., 2022, MNRAS, 511, 4826
- Cash (1979) Cash W., 1979, ApJ, 228, 939
- Charles et al. (2019) Charles P., Matthews J. H., Buckley D. A. H., Gandhi P., Kotze E., Paice J., 2019, MNRAS, 489, L47
- Chauhan et al. (2021) Chauhan J., et al., 2021, MNRAS, 501, L60
- Corbel et al. (2000) Corbel S., et al., 2000, A&A, 359, 251
- Corbel et al. (2003) Corbel S., Nowak M. A., Fender R. P., Tzioumis A. K., Markoff S., 2003, A&A, 400, 1007
- Corbel et al. (2006) Corbel S., Tomsick J. A., Kaaret P., 2006, ApJ, 636, 971
- Corbel et al. (2008) Corbel S., Koerding E., Kaaret P., 2008, MNRAS, 389, 1697
- Corbel et al. (2013) Corbel S., et al., 2013, MNRAS, 428, 2500
- Coriat et al. (2011) Coriat M., et al., 2011, MNRAS, 414, 677
- Esin et al. (1997) Esin A. A., McClintock J. E., Narayan R., 1997, ApJ, 489, 865
- Fender (2001) Fender R. P., 2001, MNRAS, 322, 31
- Fender (2006) Fender R., 2006, in Compact stellar X-ray sources. pp 381–419
- Frater et al. (1992) Frater R. H., Brooks J. W., Whiteoak J. B., 1992, Journal of Electrical and Electronics Engineering Australia, 12, 103
- Fruscione et al. (2006) Fruscione A., et al., 2006, in Society of Photo-Optical Instrumentation Engineers (SPIE) Conference Series. p. 62701V, doi:10.1117/12.671760
- Gallo et al. (2003) Gallo E., Fender R. P., Pooley G. G., 2003, MNRAS, 344, 60
- Gallo et al. (2006) Gallo E., Fender R. P., Miller-Jones J. C. A., Merloni A., Jonker P. G., Heinz S., Maccarone T. J., van der Klis M., 2006, MNRAS, 370, 1351
- Gallo et al. (2014) Gallo E., et al., 2014, MNRAS, 445, 290
- Gallo et al. (2019) Gallo E., et al., 2019, MNRAS, 488, 191
- Garcia et al. (2001) Garcia M. R., McClintock J. E., Narayan R., Callanan P., Barret D., Murray S. S., 2001, ApJ, 553, L47
- Hannikainen et al. (1998) Hannikainen D. C., et al., 1998, A&A, 337, 460
- Harris et al. (2020) Harris C. R., et al., 2020, Nature, 585, 357
- Homan & Belloni (2005) Homan J., Belloni T., 2005, Ap&SS, 300, 107
- Hunter (2007) Hunter J. D., 2007, Computing in Science and Engineering, 9, 90
- Jonker et al. (2010) Jonker P. G., et al., 2010, MNRAS, 401, 1255
- Jonker et al. (2012) Jonker P. G., et al., 2012, MNRAS, 423, 3308
- Lamer et al. (2021) Lamer G., Schwope A. D., Predehl P., Traulsen I., Wilms J., Freyberg M., 2021, A&A, 647, A7
- Liu et al. (2019) Liu H., Dong A., Weng S., Wu Q., 2019, MNRAS, 487, 5335
- Markoff et al. (2005) Markoff S., Nowak M. A., Wilms J., 2005, ApJ, 635, 1203
- McMullin et al. (2007) McMullin J. P., Waters B., Schiebel D., Young W., Golap K., 2007, in Shaw R. A., Hill F., Bell D. J., eds, Astronomical Society of the Pacific Conference Series Vol. 376, Astronomical Data Analysis Software and Systems XVI. p. 127
- Menou et al. (1999) Menou K., Esin A. A., Narayan R., Garcia M. R., Lasota J.-P., McClintock J. E., 1999, ApJ, 520, 276
- Miller-Jones et al. (2011) Miller-Jones J. C. A., Jonker P. G., Maccarone T. J., Nelemans G., Calvelo D. E., 2011, ApJ, 739, L18
- Monageng et al. (2021) Monageng I. M., Motta S. E., Fender R., Yu W., Woudt P. A., Tremou E., Miller-Jones J. C. A., van der Horst A. J., 2021, MNRAS, 501, 5776
- Motta et al. (2018) Motta S. E., Casella P., Fender R. P., 2018, MNRAS, 478, 5159
- Narayan & Yi (1994) Narayan R., Yi I., 1994, ApJ, 428, L13
- Pe’er & Casella (2009) Pe’er A., Casella P., 2009, ApJ, 699, 1919
- Plotkin et al. (2013) Plotkin R. M., Gallo E., Jonker P. G., 2013, ApJ, 773, 59
- Plotkin et al. (2015) Plotkin R. M., Gallo E., Markoff S., Homan J., Jonker P. G., Miller-Jones J. C. A., Russell D. M., Drappeau S., 2015, MNRAS, 446, 4098
- Plotkin et al. (2016) Plotkin R. M., et al., 2016, MNRAS, 456, 2707
- Plotkin et al. (2017) Plotkin R. M., et al., 2017, ApJ, 834, 104
- Plotkin et al. (2019) Plotkin R. M., Miller-Jones J. C. A., Chomiuk L., Strader J., Bruzewski S., Bundas A., Smith K. R., Ruan J. J., 2019, ApJ, 874, 13
- Plotkin et al. (2021) Plotkin R. M., Bahramian A., Miller-Jones J. C. A., Reynolds M. T., Atri P., Maccarone T. J., Shaw A. W., Gandhi P., 2021, MNRAS, 503, 3784
- Poutanen et al. (2014) Poutanen J., Veledina A., Revnivtsev M. G., 2014, MNRAS, 445, 3987
- Qiao & Liu (2013) Qiao E., Liu B. F., 2013, ApJ, 764, 2
- Rau & Cornwell (2011) Rau U., Cornwell T. J., 2011, A&A, 532, A71
- Remillard & McClintock (2006) Remillard R. A., McClintock J. E., 2006, ARA&A, 44, 49
- Reynolds & Miller (2011) Reynolds M. T., Miller J. M., 2011, ApJ, 734, L17
- Reynolds et al. (2014) Reynolds M. T., Reis R. C., Miller J. M., Cackett E. M., Degenaar N., 2014, MNRAS, 441, 3656
- Ribó et al. (2017) Ribó M., et al., 2017, ApJ, 835, L33
- Rodriguez et al. (2020) Rodriguez J., et al., 2020, ApJ, 889, 58
- Shaw et al. (2021) Shaw A. W., et al., 2021, ApJ, 907, 34
- Tetarenko et al. (2016) Tetarenko B. E., Sivakoff G. R., Heinke C. O., Gladstone J. C., 2016, ApJS, 222, 15
- Tominaga et al. (2020) Tominaga M., et al., 2020, ApJ, 899, L20
- Tremou et al. (2020) Tremou E., et al., 2020, MNRAS, 493, L132
- Verner et al. (1996) Verner D. A., Ferland G. J., Korista K. T., Yakovlev D. G., 1996, ApJ, 465, 487
- Weisskopf et al. (2000) Weisskopf M. C., Tananbaum H. D., Van Speybroeck L. P., O’Dell S. L., 2000, in Truemper J. E., Aschenbach B., eds, Society of Photo-Optical Instrumentation Engineers (SPIE) Conference Series Vol. 4012, X-Ray Optics, Instruments, and Missions III. pp 2–16, doi:10.1117/12.391545
- Wilms et al. (2000) Wilms J., Allen A., McCray R., 2000, ApJ, 542, 914
- Wu et al. (2010) Wu Y. X., Yu W., Li T. P., Maccarone T. J., Li X. D., 2010, ApJ, 718, 620
- Xie & Yuan (2016) Xie F.-G., Yuan F., 2016, MNRAS, 456, 4377
- Yuan & Cui (2005) Yuan F., Cui W., 2005, The Astrophysical Journal, 629, 408