JWST/NIRCam Observations of Stars and HII Regions in Galaxies: Properties of Star Forming Complexes on 150 pc Scales
Abstract
The onset of the JWST-era provides a much-improved opportunity to characterize the resolved structure of early star forming systems. Previous Spitzer observations of galaxies revealed the presence of old stars and luminous HII regions (via [OIII]+H emission), but the poor resolution stunted our ability to map their locations with respect to the star forming regions identified in the rest-UV. In this paper, we investigate the internal structure of 12 of the most luminous galaxies in the EGS field observed with recent JWST/NIRCam imaging. The systems appear clumpy in the rest-UV, with more than half of the light coming from to 109 M⊙ star forming complexes that are - 480 pc in size. The clumps tend to be dominated by young stars (median = 36 Myr), but we also find large variations in clump ages within individual galaxies. The [OIII]+H EW varies significantly across individual galaxies (reflecting differences in stellar and gas properties), but the HII regions largely track the UV-bright complexes. Perhaps surprisingly, the rest-optical continuum is just as clumpy as the UV, and we do not find older (and redder) nuclear stellar components that were previously undetected or faint in the UV. The majority of the stellar mass in bright galaxies appears to be contained in the pc-scale clumpy star forming complexes, reflecting the very active phase of assembly that is common in reionization-era galaxies.
keywords:
galaxies: high-redshift – galaxies: evolution – dark ages, reionization, first stars1 Introduction
Over the last two decades, the Hubble Space Telescope (HST) has conducted a series of deep near-infrared imaging campaigns, enabling the identification of large samples of star forming galaxies at (Bouwens et al. 2015; Finkelstein et al. 2015; McLeod et al. 2016; Bouwens et al. 2022b; see Robertson 2022 for a review). At these redshifts, HST images are limited to the rest-frame ultraviolet, revealing the unobscured star forming component of these early star forming systems. Observations at 3-5 m with the Spitzer Space Telescope have extended our view into the rest-frame optical, providing a more robust census of the total stellar content of early galaxies. By combining HST and Spitzer photometry for large samples at , the bulk integrated properties of the population have been established (see Stark 2016 for a review), revealing relatively low stellar masses ( M⊙), large specific star formation rates ( Gyr-1) and blue UV continuum slopes () indicative of minimal dust reddening. Collectively these observations are consistent with reionization-era galaxies undergoing rising star formation histories, leading to rapid mass growth and typical light-weighted stellar ages of 50-200 Myr (e.g., Laporte et al., 2021; Whitler et al., 2022a; Stefanon et al., 2022).
Meaningfully building on this picture of early galaxy assembly will require a resolved view of the stars, gas, and dust within galaxies. The internal structure of early star forming systems has long been mostly out of reach observationally, with a picture mostly limited to the rest-frame UV. Moderate resolution HST/WFC3 images (FWHM = 0.2 arcsec) often reveal multiple-component kpc-scale clumpy structures in massive and UV-luminous reionization era galaxies (e.g., Bowler et al., 2017; Marrone et al., 2018; Matthee et al., 2017, 2019) . Separations between the individual clumps are often upwards of 5 kpc in individual UV-luminous systems at (e.g., Bowler et al., 2017). Gravitational lensing has extended these studies to intrinsically fainter galaxies in deep cluster fields imaged by HST. After correcting for magnification, these dwarf galaxies are commonly revealed to be star forming components of size pc, with the most highly-magnified sources probing 10 pc scales similar to super star clusters (e.g., Kawamata et al., 2015; Vanzella et al., 2019, 2020; Bouwens et al., 2022a). These galaxies appear smaller than expected from extrapolation of size-luminosity scaling relations (e.g., Shibuya et al., 2015), leading some to suggest that the lowest luminosity galaxies probed by HST may only host a single star forming complex (e.g., Bouwens et al., 2022a). If true, the rest-UV properties (i.e., UV slope, MUV) would potentially only be applicable to a small sub-region within a larger galaxy (e.g., Zick et al., 2018).
Observations of gas and dust in luminous galaxies with the Atacama Large Millimeter Array (ALMA) have begun to complement the rest-UV picture from HST (Matthee et al., 2017; Smit et al., 2018; Hashimoto et al., 2018; Bowler et al., 2022; Bouwens et al., 2022c). In some galaxies, the dust continuum is offset from the UV emission, suggesting that there are heavily-obscured star forming components that are faint or undetected in existing HST imaging (e.g., Bowler et al., 2022). In other systems with ALMA data, the dust emission is co-spatial but more extended than the UV (Bowler et al., 2022), again revealing star forming regions not well-recovered in the HST imaging. Meanwhile, ALMA detections of far-IR fine structure emission lines (i.e,. [OIII]88m and [CII]158m) are changing our view of galaxies thought to have low stellar masses ( M⊙) based on UV to optical SEDs dominated by very young ( Myr) stellar populations. Recent works have revealed significant spatial variations of [OIII] emission line properties (tracing ionized gas) in galaxies, suggesting these galaxies could be comprised of several stellar populations at different ages (Wong et al., 2022; Witstok et al., 2022; Akins et al., 2022). It has also been shown that these systems can have orders of magnitude larger dynamical masses (i.e., 1011 M⊙), potentially accommodating an older ( Myr) stellar population which (together with a large gas fraction) dominates the mass but is outshined by a recent burst (Topping et al., 2022).
A complete picture of the internal structure of galaxies will ultimately require higher resolution imaging at longer wavelengths where the spatial distribution of old stars can clearly be established. At lower redshifts (, the clumpy star forming structures tend to be located at the outskirts of an older and dustier stellar component; the derived stellar mass distribution in these systems is much less clumpy than the rest-frame UV (e.g., Wuyts et al., 2012; Lee et al., 2013). The poor resolution of Spitzer (FWHM 2 arcsec) has long stood in the way of such an investigation at , and as such it is not clear whether the UV-emitting regions identified by HST are co-spatial with the older stellar populations, or whether they are embedded (or at the outskirts) of a larger structure of older stars and gas.
The spatial resolution provided by JWST at 2-5 m enables the first resolved view of the rest-optical continuum emission in reionization-era galaxies, allowing the distribution of young and old stellar populations to be mapped within early galaxies. In this paper, we use NIRCam imaging of the EGS field to study the internal structure of 12 reionization-era galaxies. The data were taken as part of the CEERS Early Release Science observations (ERS:1345, PI: Finkelstein). The systems chosen for this study are bright galaxies (F200W= 24.9 to 26.6) identified photometrically in Bouwens et al. (2015) via HST imaging of the EGS field. We describe the sample selection, NIRCam imaging reduction and analysis in §2. In §3, we use the NIRCam imaging to create maps of UV and optical continuum emission across each galaxy, investigating whether the star forming complexes are offset from the older stellar population which may dominate the light at longer wavelengths. We also probe the star forming regions via maps of strong rest-optical emission lines ([OIII]+H) created from NIRCam long wavelength filters which are dominated by line emission. For each galaxy, we characterize the size and physical properties of the star forming complexes (i.e., stellar mass, age, star formation rate surface density). Finally we discuss implications for the build-up of galaxies in the reionization era, comparing these structures to systems at lower redshifts.
Throughout this paper, we adopt a flat CDM cosmology with = 70 km s-1 Mpc-1, , and . All magnitudes are measured in the AB system (Oke & Gunn, 1983) unless otherwise stated. The equivalent widths are calculated in the rest-frame with positive values for emission.
2 Data & Sample Analysis
[t] Name RA Dec. F150W F200W F356W F410M (mag) (mag) (mag) (mag) EGSI-9136950177 214.806959 52.838203 EGSZ-9338153359 214.890898 52.893217 EGSZ-9314453285 214.881001 52.891207 EGSI-9179549499 214.824915 52.830484 EGSZ-9271353221 214.863024 52.889431 EGSZ-9419055074 214.924558 52.918690 EGSZ-9350655307 214.896097 52.925157 EGSI-0020500266 215.008510 53.007336 EGSZ-9135048459 214.806240 52.812713 EGSZ-9262051131 214.859155 52.853586 EGSY-9105550297 214.793938 52.841534 EGSY-9587400281 214.994754 53.007741
In this section, we first describe the NIRCam imaging used for our analysis (§2.1), before discussing the sample selection and integrated galaxy properties (§2.2) and our spatially-resolved analysis (§2.3).
2.1 NIRCam imaging
The JWST/NIRCam imaging utilized in this work were taken as part of the Cosmic Evolution Early Release Science (CEERS111https://ceers.github.io/, ERS:1345; Finkelstein et al., 2017) survey during June 2022 (see Bagley et al. 2022 for a more detailed description of the observations). These NIRCam data include imaging in six broad-band filters (F115W, F150W, F200W, F277W, F356W, and F444W) as well as one medium-band filter (F410M) across four independent pointings for a total on-sky coverage of 40 arcmin2. Imaging in the short wavelength (SW) filters (F115W, F150W, and F200W) and long wavelength (LW) filters (F277W, F356W, F444W, and F410M) have a resolution of 0.062″ and 0.125″, respectively. At , these filters simultaneously probe the rest-frame UV light dominated by young massive stars and the optical emission from the nebular and stellar continuum as well as strong emission lines (e.g., H, [O iii], and H). This enables us to resolve reionization-era galaxies in the rest UV and optical at comparably high resolution. While a detailed description of the NIRCam imaging data reduction can be found in Endsley et al. (2022), we briefly summarize the major steps below.
To produce co-added mosaics for each NIRCam filter, we first retrieve the calibrated flat-fielded individual exposures (*_cal.fits) from the MAST Portal222https://mast.stsci.edu/portal/Mashup/Clients/Mast/Portal.html and subsequently perform a global background subtraction on each science exposure using the sep package333https://sep.readthedocs.io/en/v1.0.x/index.html. To provide the best possible astrometric alignment, we next process images through calwebb_image3444https://jwst-pipeline.readthedocs.io/en/latest/index.html separately for each NIRCam filter, pointing, and module combination given a slight (0.2 arcsec) offset in the world coordinate system of the NIRCam module A vs. B fits file headers (private communication with NIRCam instrument team). In this process, we have corrected the noise, obtained robust background estimates, and implemented updated photometric calibrations specific to each NIRCam detector derived by Gabe Brammer555https://github.com/gbrammer/grizli/pull/107 (see Endsley et al. 2022). Each of the output co-adds (*_i2d.fits) are then separately aligned to the Gaia astrometric frame using the tweakreg package666https://drizzlepac.readthedocs.io/en/latest/tweakreg.html, adopting the Gaia-aligned HST/WFC3 F160W mosaic from CHArGE (see below) as a reference image. It was not possible to perform direct astrometric alignment to the Gaia frame for each co-added NIRCam image due to the low density of unsaturated Gaia stars with proper motion measurements in the EGS field (3 per pointing and module combination). Nonetheless, with tweakreg we are able to achieve sub-pixel accuracy of the resulting astrometry, with an RMS offset of 6–15 mas relative to the HST CHArGE mosaics. We then combine all co-added images for each filter into a single mosaic by resampling them onto a grid with a pixel scale of 30 mas pixel-1, where the world coordinate system of this grid is the same for all filters.
We also use HST/ACS imaging in the EGS field for constraining the physical properties of the galaxies analyzed in this work. The ACS mosaics utilized here were produced as part of the Complete Hubble Archive for Galaxy Evolution (CHArGE) project (Kokorev in prep.) and are matched to the Gaia astrometric frame with a pixel scale of 40 mas pixel-1. These CHArGE mosaics include data in the F435W, F606W, and F814W bands as part of the following surveys: the All-Wavelength Extended Groth Strip International Survey (AEGIS; Davis et al. 2007), the Cosmic Assembly Near-infrared Deep Extragalactic Legacy Survey (CANDELS; Grogin et al. 2011; Koekemoer et al. 2011), and the Ultraviolet Imaging of the Cosmic Assembly Near-infrared Deep Extragalactic Legacy Survey Fields (UVCANDELS777https://archive.stsci.edu/hlsp/uvcandels; PI: Teplitz).
The HST and JWST imaging introduced above span nearly a factor of four in angular resolution from a PSF full width at half maximum (FWHM) of 0.045 arcsec in ACS/F435W to 0.18 arcsec in WFC3/F160W. To ensure robust color calculations, we must therefore account for variations in the PSF across different images. At the same time, we aim to preserve as much signal-to-noise as possible, particularly in the shorter wavelength filters which probe the Lyman-alpha break. We have thus opted to homogenize the PSFs of all the NIRCam LW mosaics (as well as the WFC3 mosaics used by our companion papers) to that of WFC3/F160W, while the ACS and NIRCam SW mosaics are homogenized to the PSF of ACS/F814W.888The ACS/F814W and WFC3/F160W mosaics have slightly larger FWHM relative to that of NIRCam/F200W and NIRCam/F444W, respectively, given the smaller mirror size of HST. Our algorithm for performing the PSF homogenization largely follows that of Endsley et al. (2021) where we construct the PSF of each mosaic by stacking cutouts of unsaturated isolated stars (oversampling to a resolution of 3 mas pixel-1 for this step) and then derive PSF convolution kernels using the Python photutils package (Bradley et al., 2021). The PSF encircled energy distributions after convolution are found to agree with the targeted PSF (i.e. ACS/F814W or WFC3/F160W) to within 1–2 per cent at radii 0.1″ in all bands.
2.2 Sample Selection and Galaxy Properties
| Name | log () | sSFR | Age | EW [O iii]+H | ||
|---|---|---|---|---|---|---|
| (mag) | (Gyr-1) | (Myr) | (Å) | |||
| EGSI-9136950177 | ||||||
| EGSZ-9338153359 | ||||||
| EGSZ-9314453285 | ||||||
| EGSI-9179549499 | ||||||
| EGSZ-9271353221 | ||||||
| EGSZ-9419055074 | ||||||
| EGSZ-9350655307 | ||||||
| EGSZ-9135048459 | ||||||
| EGSI-0020500266 | ||||||
| EGSZ-9262051131 | ||||||
| EGSY-9105550297 | ||||||
| EGSY-9587400281 |
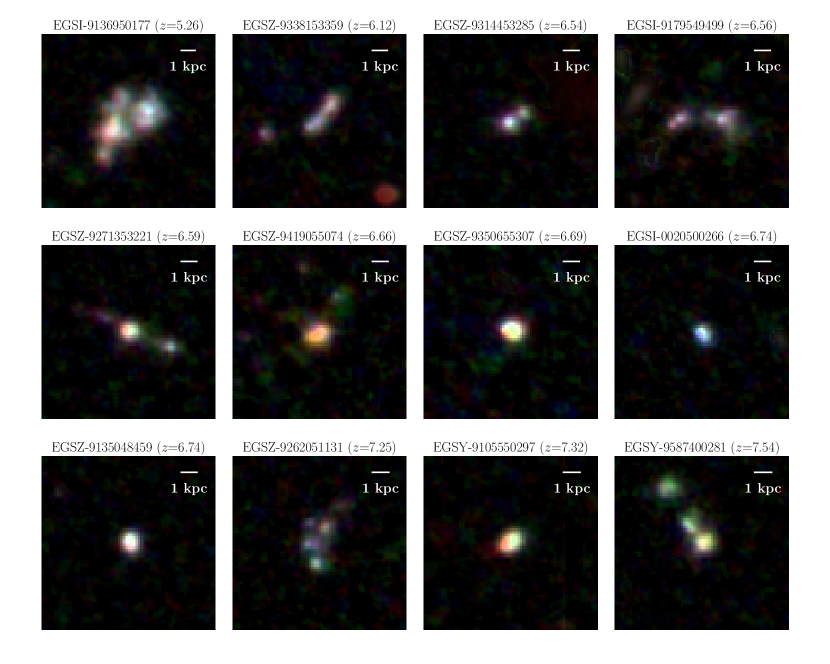
The goal for this study is to provide a resolved view of the brightest galaxies in the reionization era. Our sample is based on the galaxies previously identified in existing HST imaging of the EGS field (Bouwens et al., 2015; Roberts-Borsani et al., 2016; Bouwens et al., 2016, 2019; Leonova et al., 2022). We limit our selection to those systems that fall into the CEERS/NIRCam footprint observed on June 29, 2022. Our current study is focused on 12 galaxies with photometric redshifts between with H-band magnitudes brighter than H = 26.6 mag to ensure that we are able to resolve enough pixels at the required signal-to-noise ratio with the NIRCam data. However, we note that in a future paper, we will investigate the resolved properties of the more general population of high-z galaxies with a well-selected sample directly from the NIRCam imaging. We list the 12 HST-selected bright galaxies in Table 1, and adopted the source names from the original literature sources. Color postage stamp images based on the NIRCam SW imaging are also presented in Figure 1.
The NIRCam photometry in the seven filters for our sample are extracted with custom elliptical apertures. In this process, we ensure the aperture includes the total galaxy flux as indicated by Photutils (Bradley et al., 2021) segmentation maps in all filters, while also avoiding light from neighbouring contaminants. These contaminants are identified by their detections in the HST/ACS optical filters, suggesting they lie at lower redshifts than our galaxies. Photometry uncertainties are estimated by placing the same aperture in the surrounding 10″x10″ regions with all the sources being masked. The photometry is then corrected for aperture loss, which is estimated by centering the aperture at the corresponding PSF. We list the NIRCam photometry in four of the filters (F150W and F200W sampling the rest-UV, and F356W and F444W sampling the rest-optical) in Table 1. In the same manner, we also extract the HST/ACS short-wavelength filters (F435W, F606W, and F814W) photometry, which will be used for constraining the photometric redshift when deriving galaxy properties.
Following the procedure described in Whitler et al. (2022a), we fit the HST+NIRcam photometry with BayEsian Analysis of GaLaxy sEds (BEAGLE v0.20.4; Chevallard & Charlot, 2016), providing constraints on the physical properties of our galaxies. The Gutkin et al. (2016) models are adopted, which self-consistently combine the latest version of Bruzual & Charlot (2003) stellar population models underpinned by the parsec isochrones (Bressan et al., 2012; Chen et al., 2015) and the nebular emission computed by Cloudy (Ferland et al., 2013). We place uniform prior on redshift from , which allows us to obtain updated constraints on the photometric redshifts with the inclusion of NIRCam photometry. A constant star formation history (CSFH) is assumed for our fiducial models, with the total stellar mass allowed to vary from and the star formation period from 1 Myr to the age of the Universe at the corresponding redshift. We note that CSFH models can underpredict the stellar mass and age of galaxies dominated by very young light-weighted ages (e.g., Tang et al., 2022; Whitler et al., 2022a; Tacchella et al., 2022), and we thus also consider more flexible star formation histories in our analysis later in this paper. We adopt the Chabrier (2003) initial mass function with the upper-mass cutoff of 300 . Narrow log-normal priors are used on stellar metallicity (center , standard deviation ) and ionization parameter (, ), as motivated by spectroscopic observations of the high-ionization emission lines at = 7 – 9 (e.g., Stark et al., 2017; Hutchison et al., 2019). The nebular metallicity (including dust and gas-phase) is kept the same as the stellar metallicity, with a fixed dust-to-metal mass ratio of . Future investigation will investigate the impact of alpha enhancement, but we note that the effects of depletion do decouple the gas and stellar metallicity in our models. Finally, we assume the SMC dust attenuation curve (Pei, 1992) with V-band optical depth varying from , and adopt the Inoue et al. (2014) model for the intergalactic medium (IGM) attenuation.
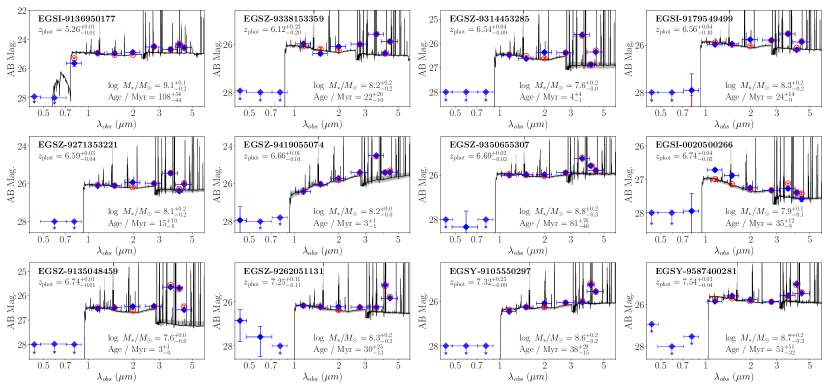
The spectral energy distribution (SED) fits are shown in Figure 2. The resulting constraints on the integrated properties, such as absolute UV magnitude (MUV), stellar mass (), and the specific star formation rates (sSFRs), are summarized in Table 2. The updated photometric redshifts derived from the new NIRCam photometry (together with HST/ACS constraints) place our galaxies at . The varies from -19.86 to -21.60, with the median absolute magnitude (-20.8) near M, assuming the luminosity function of Bowler et al. 2017. The galaxies in our sample have moderate stellar masses that range from to . Adoption of more flexible star formation histories can increases these masses by a factor of several for the systems with the youngest light-weighted ages (see Whitler et al. 2022a; Topping et al. 2022). The galaxies are found to span a range of sSFRs (9 – 361 Gyr-1) and light-weighted stellar population ages (3 to 107 Myr), both derived assuming CSFH. The youngest among them are likely experiencing a recent upturn or burst of star formation, powering high [O iii]+H equivalent widths (456 – 3436 Å). These emission lines can heavily contaminate the NIRCam filters, allowing us to map the spatial distribution of these lines in the following sections.
[t] Name log () Age EW [O iii]+H (mag) (pc) (pc) (Myr) (Å) 9136-C1 9136-C2 9136-C3 – 9136-C4 9338-C1 9338-C2 – 9338-C3 – 9338-C4 9314-C1 9314-C2 9179-C1 9179-C2 9179-C3 – 9271-C1 9271-C2 9271-C3 9419-C1 9419-C2 9350-C1 0020-C1 9135-C1 9262-C1 9262-C2 9262-C3 9262-C4 – 9105-C1 9587-C1 9587-C2 – 9587-C3 9587-C4 –
2.3 Spatially Resolved Analysis of NIRCam Images
We produce spatially resolved continuum maps in the rest-frame UV and optical using the NIRCam images. We use the F200W images to probe the UV continuum powered by the recently-formed stars. This bandpass covers rest-frame 2000 – 3000 Å at the redshifts of our sample. Two versions of the UV maps are created, one at original resolution in our fiducial reduction and the other matched to the same resolution of the F444W images. The first version shows the morphology at its highest resolution, while the latter is used to uniformly extract the NIRCam SEDs in subregions of the galaxy. The NIRCam images also allow for a view of the resolved morphology in the optical, which was inaccessible with the earlier HST imaging. The optical continuum is sensitive to light from older stellar populations as well as the nebular continuum powered by young stars. We carefully identify filters that are least impacted by strong emission lines (in particular, H, [O iii], and H), based on their photometric redshifts and the Beagle SEDs. The F356W images are used for 4 galaxies, F410M for another 5 galaxies, and F444W for the remaining 3 sources. These filters sample the continuum emission at rest-frame wavelengths of 4000 – 5300 Å.
As already mentioned in Section 3.1, the galaxies in our sample power prominent rest-optical emission lines ([O iii]+H) which can heavily contaminate one or more NIRCam filters (F356W, F410M, or F444W). This leads to large flux excesses in the contaminated filters as compared to adjacent continuum-dominated filters (e.g., F356W - F444W < -1 for EGSZ-9314453285 as shown in Table 1). At the redshifts of our sample, the [O iii]+H emission lines fall in the F356W filter for 8, and the F410M for 4 galaxies. We estimate the continuum from the adjacent filters that are least contaminated by emission lines, which is then subtracted from the image of line-dominated filter. The resulting maps correspond to the distribution of the [O iii]+H emission lines, which we will compare with the UV continuum morphology.
The high-resolution NIRCam images also allow us to characterize the structural properties for our sample, which are often resolved into multiple components. We visually identify the UV clumps associated with each of galaxy from the NIRCam F115W, F150W, and F200W images, treating those with a single component as one clump. Following the procedures in Matthee et al. (2017), we constrain the deconvolved half-light radius () in both UV and optical for individual clumps by fitting 2D asymmetric exponential profile with the IMFIT software (Erwin, 2015). We use the PSF constructed by stacking the star images in Section 2.1 for model convolution and estimate the size uncertainties via bootstrap resampling of 100 iterations. For galaxies with multiple clumps, we first fit all clumps together with multi-component models to constrain their sizes. When a satisfactory multi-component fit is not possible, we separate and fit the relatively fainter clumps alone, and refit the remaining clumps with multi-component models. Objects with 1 pixel in the rest-UV filters and 2 pixels in the rest-optical (roughly 1/2 FWHM of the corresponding PSF) are taken as unresolved, and we only list their sizes as upper limits. The rest-UV images have a factor 2 higher resolution than the optical images, leading some of closely separated components resolved in the UV to be blended together on the optical images. We thus place upper limits for their optical size based on the FWHM measured from the radial profile. The resulting measurements are reported in Table 3, with the clumps ordered and labeled by their F200W magnitudes (see the next Section).
2.4 Stellar population modeling
The spatial resolution and wide wavelength coverage (from rest-UV to optical) of NIRCam enables us to constrain the stellar population properties of the individual structures within each galaxy. In particular, the relative strength of rest-UV and optical continuum and the flux excess due to emission lines place much-improved constraints on the light-weighted stellar population ages and the dust content than was possible with UV data on its own. We derive the stellar population properties for the UV-selected clumps by fitting stellar population models to the PSF-matched NIRCam photometry. We will also consider the stellar population properties of the lower surface brightness emission that surrounds the clumps, testing whether the clumps are embedded in an older component of the galaxy.
The photometry for clumps and the surrounding medium have been extracted from PSF-homogenized NIRCam images, with all filters convolved to the same resolution of F444W. The clump photometry is measured with a fixed 6-pix (0.18″) diameter aperture, which, at the typical UV sizes of these structures, is large enough to capture the emission from the central region but avoids contamination from the surrounding medium. The aperture loss is taken into account based on the PSF-convolved models from our exponential profile fitting on the F200W images. We also estimate the photometric errors with blank apertures, taking the standard deviation from at least 500 apertures randomly put on the 10″10″ source-masked images. The photometry for the lower surface brightness medium between the clumps is calculated by masking all pixels within 4 pixels from any clumps to reduce their contamination. To define the outer extent of this inter-clump medium, we use the galaxy segmentation maps produced with Photutils, including the pixels that are 2 above the background. The uncertainties are derived from the standard deviation of the background pixels in the same 10″10″ region.
The NIRCam photometry is then fit with Beagle to derive constraints on the stellar population and dust properties in the different components. The redshifts for each clump and the surrounding medium are fixed to those fitted with the integrated galaxy photometry (see Table 1), allowing us to focus on the SED differences induced by the variations of the stellar population ages or the dust content. We adopt the same models and settings as those for constraining the integrated properties (see Section 2.2), also assuming a CSFH. We report the inferred absolute UV magnitudes, stellar masses, light-weighted stellar population ages, V-band optical depths, and the rest-frame EW [O iii]+H for each of the components in Table 3.
3 Results and Discussion
In this section, we present our results on the spatially resolved properties of galaxies based on the JWST/NIRCam imaging. We begin by investigating the rest-UV structures in our galaxies (§3.1), focusing on the spatially-resolved properties of the star forming clumps revealed in individual galaxies. We then investigate the light distributions of both optical continuum and emission lines, and compare them with the location of the UV clumps (§3.2). Lastly, we discuss the nature of the star forming clumps and their implications for mass assembly in galaxies (§3.3).
3.1 Star Forming Clumps in Galaxies
Previous studies of galaxies have characterized the resolved structure in early galaxies using HST/WFC3 imaging (e.g., Ouchi et al., 2013; Sobral et al., 2015; Bowler et al., 2017; Matthee et al., 2017), revealing important insights into the clumpy nature of luminous star forming systems. In the following, we take advantage of the higher spatial resolution, improved sensitivity, and additional filters of JWST/NIRCam to build on these studies investigating the internal properties in galaxies.
The NIRCam rest-UV images reveal a range of structures in our galaxies (Figure 1). The majority (8/12) of the sample are resolved into 2 – 4 clumps, with four of these galaxies showing 4 clumps. For the eight galaxies, the clumps are separated by 0.3 – 4.3 kpc, with the closest separations found in EGSZ-9338153359 (0.6 kpc), EGSI-9179549499 (0.6 kpc), and EGSY-9587400281 (0.3 kpc). The rest of the sample is well-described by a single component. These basic properties are broadly similar to the previous findings derived from HST imaging (e.g., Ouchi et al., 2013; Sobral et al., 2015; Bowler et al., 2017; Matthee et al., 2017). The individual clumps can be quite luminous, with spanning from -18.66 to -20.67. The clumps often dominate the total UV light of each galaxy, contributing at least 76% of the total F200W flux. The most luminous galaxies (-20.7) appear more likely to contain 3 – 4 clumps, while the fainter (-20.7) systems tend to show only one single clump. This suggests a multi-component structure is common in the most luminous galaxies with single clumps being common at lower luminosities, in agreement with previous studies (e.g., Bowler et al., 2017; Bouwens et al., 2022a). These high surface brightness UV structures are sites of vigorous star formation (e.g., Dekel & Burkert, 2014; Guo et al., 2015; Vanzella et al., 2017a, 2019)
While these UV structures are often marginally resolved with the WFC3 images, the higher-resolution NIRCam data allow for improved constraints on their sizes. The UV half-light radius () of each clump has been constrained by profile-fitting with 2D exponential models. The derived values range from pc up to 480 pc. The small sizes are comparable to those of complexes of star clusters found at high redshift (e.g., Vanzella et al., 2017a, 2020; Bouwens et al., 2022a), which we will discuss later. The profile fits show that the UV structures are not always symmetric, with ellipticities ranging from 0.0 – 0.7 when resolved. The asymmetric morphology is clear in the images and can be a signature of interactions among the clumps or suggests that these structures are unresolved conglomerations of smaller unrelaxed structures. This is also consistent with the close separations among the clumps found in some systems, where two peaks are found at a distance of just 2 pixels ( 300 pc) with both being very compact unresolved systems (e.g., EGSZ-9338153359, and EGSY-9587400281). Given their close separation, such clumps are likely interacting and will presumably merge together.
Prior to the JWST era, our interpretation of these clumpy structures was stunted by the absence of rest-optical imaging at comparable spatial resolution as provided by HST. The longer wavelength emission is critical for assessing the age of the clumpy structures, while also allowing dusty or old red structures (that may dominate the galaxy mass while being faint in the UV) to be identified. NIRCam provides access to the rest-optical emission with some of its LW filters. As described in §2.4, we have fit the SEDs of all clumps identified in the images of our galaxy samples using the Beagle tool. The modeling shows that the stellar masses for the clumps vary from to (assuming CSFH). When combined with the estimated sizes of the clumps, this corresponds to a stellar mass surface density of to 1117 pc-2. The SED fits also reveal variations of dust content across individual galaxies with multiple components, with the optical depths varying from negligible values up to 0.1 – 0.3 (e.g., EGSI-9136950177, EGSZ-9271353221, and EGSZ-9419055074), consistent with gradients identified in ALMA far-IR continuum observations (e.g., Bowler et al., 2022). The variation in UV color in different clumps is clear in Figure 1, with some star forming complexes being much redder in the UV than the others (e.g., those in EGSI-9136950177, and EGSZ-9271353221).
The ages of the clumpy star forming complexes give some insight into their nature. The inferred light-weighted ages (assuming a CSFH) are fairly young, with a median age of 36 Myr. This is in general younger than the star-forming clumps uncovered at lower redshifts (e.g., Guo et al., 2015). However, a wide range of ages can also be found within seven of the galaxies. In the case of EGSZ-9338153359, the youngest clump is dominated by an extremely young (2 Myr) stellar population, while another clump 2 kpc away appears much older (200 Myr). It is clear that at least in the most luminous star forming galaxies at , the integrated SED is comprised of the sum of several distinctly different stellar populations with varying light-weighted ages and dust content.
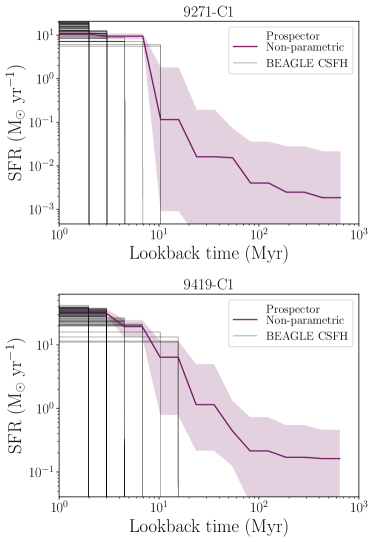
However as recently shown by Whitler et al. (2022a), even galaxies with light dominated by extremely young massive stars, a significant number of old stars can still be hidden. By adopting the same approach as Whitler et al. (2022a), we fit the SEDs of the youngest star-forming clumps with non-parametric SFH, using the Prospector (Johnson et al., 2021) code (also see Whitler et al. 2022b). We adopt the continuity prior with a fixed redshift at which the star formation starts. In doing so, we allow for significant amount of star formation at earlier epochs than CSFH models in cases where the galaxy has experienced a recent burst. In Figure 3, we present the resulting constraints on the past star formation with Prospector for two of the clumps, i.e., 9419-C1, and 9135-C1. The results suggest that stars older than 50 Myr could still contribute up to 25% of the total stellar mass of the star forming complexes that have light-weighted CSFH ages younger than 5 Myr, increasing the derived stellar mass by a factor of a few times. In this case, the clumps (150 pc in scale) identified in NIRCam would potentially be dominated by the light from very young recently-formed star clusters (10 pc in scale and unresolved in our imaging), but would also contain fainter older clusters or field stars from previous generations of star formation. Such old stars are seen in nearby complexes with very young star clusters (e.g., Aloisi et al., 2007; Corbin et al., 2008; Grebel & Chu, 2000).
3.2 Spatially-Resolved Maps of Optical Continuum and [O iii]+H Emission
To understand the variations of the clump properties in more detail, we make spatially resolved maps of the rest-optical continuum, comparing them against the UV maps. Based on the redshifts and the Beagle SED fits to the integrated photometry, we are able to identify filters that are least impacted by nebular lines and thus are dominated by the continuum emission from the nebular gas and older stellar populations. We present the optical continuum morphology in Figure 4. In general, the optical morphology appears to also be clumpy, resembling the structures seen in the UV. We do not find evidence for very red clumps dominated by extremely old stellar population or obscured star formation that were previously hidden in the UV. Such reddened nuclear structures may appear at later epochs or in higher mass reionization-era galaxies (also see the recent results from the GLASS-JWST program in Treu et al. 2022). The overall very similar rest-UV and rest-optical morphology for galaxies is also consistent with the recent findings with the NIRCam imaging in the GLASS-JWST program (Treu et al., 2022). For the systems in this sample, the rest-optical emission peaks where the UV clumps are located. For each clump, the offsets between the optical and UV peaks ( 0.03″) are found to be within the astrometric uncertainties (0.015–0.025″). It is apparent in Figure 4 that the ratio of UV to optical luminosity varies from clump to clump, with some of UV-bright regions significantly fainter at longer wavelengths (e.g., 9271-C2), reflecting the variations in age and attenuation discussed above. This also leads to observable offsets between the integrated barycenter of the two maps (i.e., the first-moment flux weighted center; see Bowler et al. 2017), with the largest offset found in EGSZ-9338153359 at 0.16″.
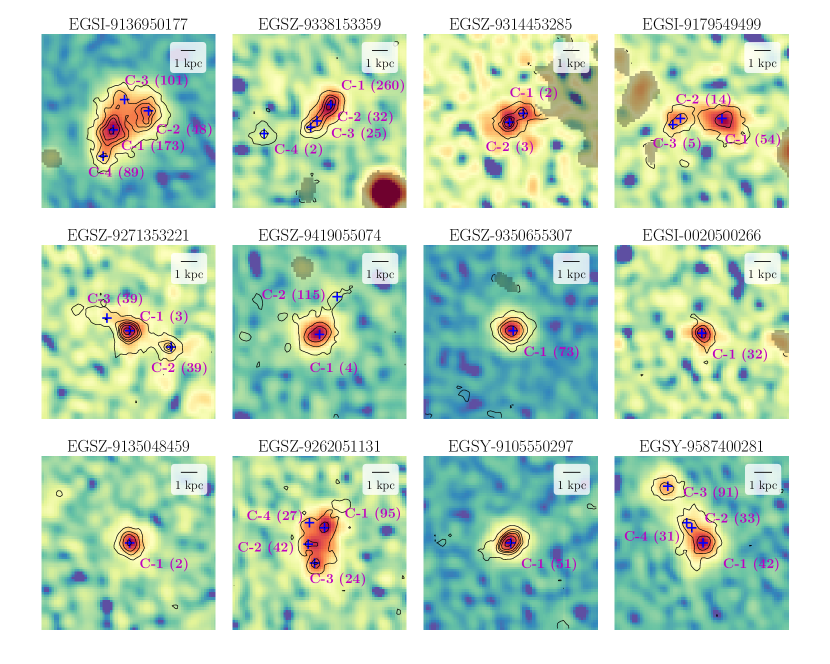
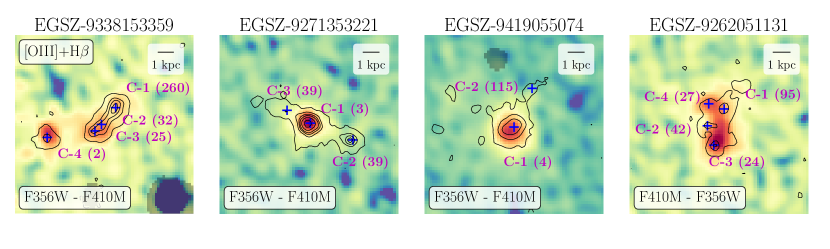
The strength of [O iii]+H emission lines tracks the locations of HII regions. The equivalent width has been shown to strongly correlate with the age of the stellar population (and gas conditions) in the extreme emission line galaxy regime that is common at (e.g., Tang et al., 2019; Endsley et al., 2021; De Barros et al., 2019). Much more prominent line emission is seen in very young stellar populations with weak underlying optical continuum. Taking advantage of the NIRCam LW filters that are heavily contaminated by these lines, we map the [O iii]+H emission to provide additional insights into the distribution of the H ii regions and the age variations among clumps. We carefully isolate these filters by their clear flux excess relative to the continuum filters in the Beagle SEDs at the inferred redshift, and then subtract the underlying optical continuum emission (which we described above). In Figure 5, we present the emission line maps for four galaxies with large inferred variations of clump ages from our SED fits. It is clear that the youngest UV structures (e.g., 9338-C2, and 9271-C1) are found where the line emission is strongest relative to the continuum. The brightest clumps in the UV do not always power large flux excess in the line-dominated filters. We find this in particular occurs toward clumps with older stellar population ages (e.g., 95 – 260 Myr for 9338-C1 and 9262-C1 assuming a CSFH). Because we find significant age variations in clumps across individual galaxies, we also find varying EW of the [O iii]+H emission lines. This is also consistent with the recently studies that have reported variations of the FIR [OIII] 88 m emission line properties that also traces the ionized gas in galaxies (Wong et al., 2022; Witstok et al., 2022; Akins et al., 2022). Measurements of the emission line EWs in the NIRCam photometry help to break the degeneracy between age and dust, improving constraints on both. For example, in EGSZ-941905574, the brightest clump (9419-C1) has clearly red UV colors (F150W-F200W = 0.33 mag), but powers a prominent knot on the [O iii]+H map. The Beagle modeling favors a younger stellar population age ( Myr) than the clump in this system with bluer UV colors but negligible emission line excesses ( Myr). Many spectral properties (i.e, the [OIII]/[OII] ratio) correlate with the [O iii]+H EW (e.g., Tang et al. 2019; Du et al. 2020; Tang et al. 2021). The variations in [O iii]+H EW across individual galaxies in our sample suggest that there are likely to be strong gradients in line ratios across different clumps in a given galaxy. Care must be taken to interpret future NIRSpec/MSA observations which may only be sensitive to one of several clumps in an individual galaxy. The measured line ratios may not be representative for all bright star forming complexes within the galaxy.
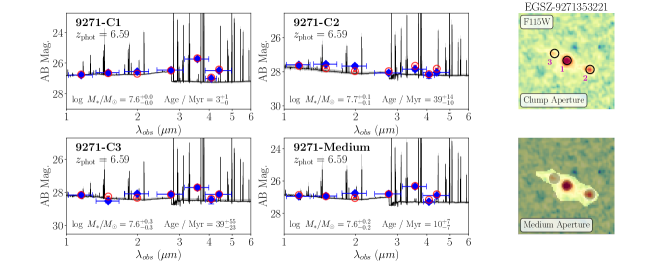
While many clumps in our galaxies show very young light-weighted ages ( 25 Myr), it is conceivable that they may be embedded in an older stellar population that is more smoothly distributed. To test this, we constrain the stellar population properties of the lower surface brightness interclump medium by fitting its NIRCam SEDs with Beagle in the same way as that for the clumps. As described in Section 2, the photometry for this region is extracted by summing the flux at 2 above the background, but masking the pixels (distance 4 pxiels) close to the location of any clumps. We also consider different choices of masking radius (5 and 6 pixels), but we find consistent results on the inferred stellar population ages for the medium. This suggests that our results are unlikely to be biased by contamination from the clump flux. In Figure 6, we present an example of resulting fits (EGSZ-9271353221), along with the apertures used to extract the photometry. In this galaxy, the interclump region also shows a flux excess in the F356W filter compared to the adjacent continuum-dominated filter, with strength in between the three clumps. While slightly older than the brightest clump (9271-C1, at Myr), it has a clearly smaller light-weighted age ( Myr) than the other two clumps ( Myr, all assuming a CSFH). The light-weighted ages for the interclump medium still fall in the age range spanned by the clumps when we use different masking radius ( Myr with masking radius 5 – 6 pixels). When considering the full sample, our results suggest that the interclump medium is not always older than all of the clumps, with inferred ages spanning 2 – 83 Myr. When the lower surface brightness regions are found to older than 50 Myr, clumps with comparable ages can also be seen in the same system. It is conceivable that such extended and diffuse structures consist of stars stripped off from the clumps of similar ages during their interactions.
3.3 The nature of compact star-forming clumps
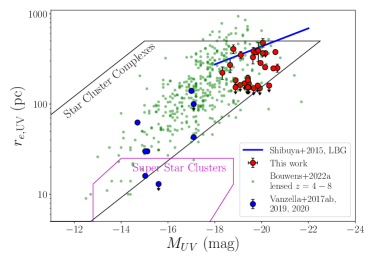
The clumpy star forming complexes identified in this paper resemble compact structures previously uncovered at leveraging the magnification provided by gravitational lensing (e.g., Kawamata et al., 2018; Bouwens et al., 2021, 2022a; Meštrić et al., 2022). In Figure 7 (left panel), we show the position of these clumps in the plane of rest-UV size and UV luminosity. For reference, we compare to magnification-corrected measurements of the gravitationally-lensed galaxies identified in the Hubble Frontier Fields from Bouwens et al. (2022a). Both the lensed and unlensed clumps follow a similar relationship between the luminosity and size, with the sources presented in this paper mostly probing the luminous end (given the absence of magnification). The star forming clumps are not surprisingly (on average) smaller than individual Lyman Break Galaxies (LBGs) at these redshifts (adopting the Bouwens et al. 2022a linear fit of the luminosity-size relation for the Shibuya et al. 2015 LBGs), occupying a region more similar to the star cluster complexes found at lower redshifts (e.g., Bastian et al., 2006; Livermore et al., 2015; Zanella et al., 2019; Messa et al., 2019). The resolution limit of NIRCam at these redshift prevents us from identifying substructures within the 150 pc scales spanned by many of our clumps. It is likely that several young star clusters ( pc in size) are dominating the light from our clumps. Characterizing such smaller structures requires gravitational lensing (e.g. Vanzella et al., 2017a, b, 2019, 2020). NIRCam imaging of massive galaxy clusters will allow many such star clusters to be identified, complementing the characterization of larger clump complexes that is possible in the field.
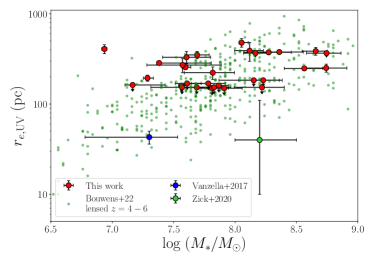
The internal structure of galaxies, with most of the stellar mass locked in bright star forming complexes, points to a rapid phase of mass assembly, consistent with the large sSFR expected at these high redshifts (e.g., Topping et al. 2022; Stefanon et al. 2022; Leethochawalit et al. 2022). The presence of multiple clumpy components separated by 1 to 4 kpc (and asymmetric single components) suggests merger activity may be common, as suggested by pair counts (Duncan et al., 2019). In the right panel of Figure 7, we show the mass-size relationship of the star forming complexes, as compared to the faint lensed galaxies from Bouwens et al. (2022a). We note that the lensed galaxies do not have rest-optical measurements, so the stellar masses have been converted assuming a fixed stellar age, consistent with what has been adopted in (Bouwens et al. 2022a; also see Kikuchihara et al. 2020). The position of the UV-bright clumps on the size - stellar mass plane implies large stellar mass surface densities, ranging from 8 – 1117 pc-2. The largest values approach those measured for the most compact star-forming complexes uncovered with lensing (e.g., Vanzella et al., 2017a; Zick et al., 2018), and are potentially sites of proto-globular clusters in formation (e.g., D’Ercole et al., 2008). The assembly and merging of these dense structures may dominate the mass growth of the galaxy (e.g., Ouchi et al., 2013; Conselice, 2014), helping eventually to build early bulge-like structures at high redshifts.
4 Summary
We characterize the internal structure of 12 star forming galaxies at using JWST/NIRCam imaging of the EGS field. The galaxies are bright (F200W=24.9 to 26.6) and were selected in HST imaging of the EGS field. The NIRCam images sample the SEDs from the rest-frame UV to optical with up to 150 pc resolution, enabling maps to be made of the relative distribution of young star forming regions and old stellar populations. We also create maps of [OIII]+H emission using filters dominated by strong emission lines, tracking the locations of the HII regions. We characterize the size distribution and SED-based properties of the sub-components identified in each galaxy. We summarize our primary conclusions below.
1. The galaxies generally appear clumpy in the rest-UV, with the light dominated by star forming complexes (or “clumps”) with stellar masses of 106 M⊙ to 108 M⊙. The UV-detected clumps are generally very compact in the NIRCam images with median effective radii of 236 pc (ranging from pc to 480 pc). Most of the galaxies in our sample sample (8 of 12) are comprised of multiple bright clumps with typical separations of 0.3 to 4.3 kpc, similar to what has been seen in UV-luminous galaxies at (e.g., Bowler et al. 2017; Matthee et al. 2017). The bright star forming complexes are embedded in a more diffuse (“interclump”) UV-emitting stellar population. In our sample, we find that the clumps comprise on average at least 76% of the UV luminosity. The star forming complexes vary significantly in their UV continuum colors, with variations seen within individual galaxies (as also seen at HST resolution by Bowler et al. 2022).
2. We characterize the ages of the star forming complexes using the SEDs of the clumps identified in the NIRCam images. The light-weighted ages of the clumps in galaxies tend to be young, with a median of 36 Myr (here assuming CSFH), much younger than the clumps seen in galaxies at . Within a given galaxy, the clumps can vary significantly in age, with some complexes extremely young (5 Myr) and others several kpc away showing much older stellar populations (100 Myr). When we adopt more flexible star formation histories we find that the youngest clumps ( Myr) can be fit with non-negligible contributions from older stellar populations (e.g., Whitler et al. 2022a, b; Tacchella et al. 2022). It is plausible that these very young clumps ( pc in size) are dominated by the light from a small recently-formed super star cluster which outshines the light of older stars in its vicinity.
3. The longer wavelength NIRCam imaging (2-5m) allows us to test whether the young UV-emitting star forming complexes surround a central nuclear structure with older stars which dominates the mass. In the 12 galaxies considered in this paper, we find that the distribution of rest-optical continuum closely matches that seen in the rest-UV, with emission peaking in the bright star forming complexes. We find no evidence in the rest-optical for old and red central clumps which are undetected (or faint) in the rest-frame UV. Such old nuclear structures may not yet be present in the brightest reionization-era galaxies. Instead a significant fraction of the galaxy mass appears to be situated in the clumpy star forming complexes.
4. We characterize the properties of the regions between the clumps, testing whether the star forming complexes are embedded in an older and more smoothly-distributed stellar population. In some cases, we do find that the interclump medium is dominated by an old ( Myr) stellar population which contributes a significant amount of mass to the galaxy. However in these galaxies, there is nearly always at least one UV-bright clump with a similarly old age as the more diffuse lower surface brightness population. The data therefore do not suggest the UV-bright clumps are situated in a uniformly older population of stars.
5. We create maps of [OIII]+H emission using (continuum-subtracted) line-dominated filters in the LW NIRCam channels, enabling the distribution of HII regions to be mapped across the galaxies. We find significant gradients in the [OIII]+H strength across individual galaxies, with some star forming complexes powering much stronger line emission (for similar optical continuum strength) than other complexes located kpc away. These variations are likely driven in part by the differences in the stellar population ages of the underlying star forming components. Given the correlation between rest-optical spectral properties and [OIII] EW (e.g., Tang et al. 2019), we expect significant variations in line ratios across UV-bright reionization era galaxies. Care must be take in interpreting results from NIRSpec MSA observations which may only probe a small sub-region within these systems.
6. The UV sizes and luminosities of the star forming complexes in our sample are consistent with the relationship between effective radii and MUV derived for faint gravitationally lensed galaxies in the Hubble Frontier Fields (Bouwens et al., 2022a), sampling the higher mass end probed by the lensing fields. The light from the clumps are likely powered by one or more super star clusters below our pc resolution limit, perhaps providing signposts of proto-globular clusters in formation.
With most of their stellar mass found to be in luminous star forming complexes 150-480 pc in size, reionization-era galaxies are clearly in a phase of rapid assembly. These structures may eventually merge together (e.g., Ouchi et al. 2013; Conselice 2014), building denser nuclear structures. Future observations with JWST will soon build on this picture. NIRSpec integral field spectroscopy targeting bright galaxies will soon reveal the kinematics and dynamical mass of the individual star forming components, while longer wavelength imaging with MIRI will help clarify the contribution of old stellar populations to the youngest star forming complexes. Sub-parsec resolution cosmological simulations will also complement our understanding of the conditions for forming such star forming complexes in early galaxies (e.g., Calura et al., 2022). Collectively these studies will help establish the origin of the bright star forming complexes in galaxies and their role in the build-up of early galaxy structures.
Acknowledgements
The authors thank the anonymous referee for their helpful comments that improved and strengthened this paper. DPS acknowledges support from the National Science Foundation through the grant AST-2109066. RE acknowledges funding from NASA JWST/NIRCam contract to the University of Arizona, NAS5-02015. LW acknowledges support from the National Science Foundation Graduate Research Fellowship under Grant No. DGE-2137419.
The authors thank Jacopo Chevallard for use of the Beagle tool used for much of our SED fitting analysis. We thank Gabe Brammer for providing the optical imaging of the EGS as part of CHArGE program. This material is based in part upon High Performance Computing (HPC) resources supported by the University of Arizona TRIF, UITS, and Research, Innovation, and Impact (RII) and maintained by the UArizona Research Technologies department.
DATA AVAILABILITY
The JWST and HST imaging data used in this work are available through the MAST Portal (https://mast.stsci.edu/portal/Mashup/Clients/Mast/Portal.html). The photometry and analysis code used in this work will be shared upon reasonable request to the corresponding author.
References
- Akins et al. (2022) Akins H. B., et al., 2022, ApJ, 934, 64
- Aloisi et al. (2007) Aloisi A., et al., 2007, ApJ, 667, L151
- Bagley et al. (2022) Bagley M. B., et al., 2022, arXiv e-prints, p. arXiv:2211.02495
- Bastian et al. (2006) Bastian N., Emsellem E., Kissler-Patig M., Maraston C., 2006, A&A, 445, 471
- Bouwens et al. (2015) Bouwens R. J., et al., 2015, ApJ, 803, 34
- Bouwens et al. (2016) Bouwens R. J., et al., 2016, ApJ, 830, 67
- Bouwens et al. (2019) Bouwens R. J., Stefanon M., Oesch P. A., Illingworth G. D., Nanayakkara T., Roberts-Borsani G., Labbé I., Smit R., 2019, ApJ, 880, 25
- Bouwens et al. (2021) Bouwens R. J., Illingworth G. D., van Dokkum P. G., Ribeiro B., Oesch P. A., Stefanon M., 2021, AJ, 162, 255
- Bouwens et al. (2022a) Bouwens R. J., Illingworth G. D., van Dokkum P. G., Oesch P. A., Stefanon M., Ribeiro B., 2022a, ApJ, 927, 81
- Bouwens et al. (2022b) Bouwens R. J., Illingworth G., Ellis R. S., Oesch P., Paulino-Afonso A., Ribeiro B., Stefanon M., 2022b, ApJ, 931, 81
- Bouwens et al. (2022c) Bouwens R. J., et al., 2022c, ApJ, 931, 160
- Bowler et al. (2017) Bowler R. A. A., Dunlop J. S., McLure R. J., McLeod D. J., 2017, MNRAS, 466, 3612
- Bowler et al. (2022) Bowler R. A. A., Cullen F., McLure R. J., Dunlop J. S., Avison A., 2022, MNRAS, 510, 5088
- Bradley et al. (2021) Bradley L., et al., 2021, astropy/photutils: 1.3.0, Zenodo, doi:10.5281/zenodo.5796924
- Bressan et al. (2012) Bressan A., Marigo P., Girardi L., Salasnich B., Dal Cero C., Rubele S., Nanni A., 2012, MNRAS, 427, 127
- Bruzual & Charlot (2003) Bruzual G., Charlot S., 2003, MNRAS, 344, 1000
- Calura et al. (2022) Calura F., et al., 2022, MNRAS, 516, 5914
- Chabrier (2003) Chabrier G., 2003, PASP, 115, 763
- Chen et al. (2015) Chen Y., Bressan A., Girardi L., Marigo P., Kong X., Lanza A., 2015, MNRAS, 452, 1068
- Chevallard & Charlot (2016) Chevallard J., Charlot S., 2016, MNRAS, 462, 1415
- Conselice (2014) Conselice C. J., 2014, ARA&A, 52, 291
- Corbin et al. (2008) Corbin M. R., Kim H., Jansen R. A., Windhorst R. A., Cid Fernandes R., 2008, ApJ, 675, 194
- D’Ercole et al. (2008) D’Ercole A., Vesperini E., D’Antona F., McMillan S. L. W., Recchi S., 2008, MNRAS, 391, 825
- Davis et al. (2007) Davis M., et al., 2007, ApJ, 660, L1
- De Barros et al. (2019) De Barros S., Oesch P. A., Labbé I., Stefanon M., González V., Smit R., Bouwens R. J., Illingworth G. D., 2019, MNRAS, 489, 2355
- Dekel & Burkert (2014) Dekel A., Burkert A., 2014, MNRAS, 438, 1870
- Du et al. (2020) Du X., Shapley A. E., Tang M., Stark D. P., Martin C. L., Mobasher B., Topping M. W., Chevallard J., 2020, ApJ, 890, 65
- Duncan et al. (2019) Duncan K., et al., 2019, ApJ, 876, 110
- Endsley et al. (2021) Endsley R., Stark D. P., Chevallard J., Charlot S., 2021, MNRAS, 500, 5229
- Endsley et al. (2022) Endsley R., Stark D. P., Whitler L., Topping M. W., Chen Z., Plat A., Chisholm J., Charlot S., 2022, arXiv e-prints, p. arXiv:2208.14999
- Erwin (2015) Erwin P., 2015, ApJ, 799, 226
- Ferland et al. (2013) Ferland G. J., et al., 2013, Rev. Mex. Astron. Astrofis., 49, 137
- Finkelstein et al. (2015) Finkelstein S. L., et al., 2015, ApJ, 810, 71
- Finkelstein et al. (2017) Finkelstein S. L., et al., 2017, The Cosmic Evolution Early Release Science (CEERS) Survey, JWST Proposal ID 1345. Cycle 0 Early Release Science
- Grebel & Chu (2000) Grebel E. K., Chu Y.-H., 2000, AJ, 119, 787
- Grogin et al. (2011) Grogin N. A., et al., 2011, ApJS, 197, 35
- Guo et al. (2015) Guo Y., et al., 2015, ApJ, 800, 39
- Gutkin et al. (2016) Gutkin J., Charlot S., Bruzual G., 2016, MNRAS, 462, 1757
- Hashimoto et al. (2018) Hashimoto T., et al., 2018, Nature, 557, 392
- Hutchison et al. (2019) Hutchison T. A., et al., 2019, ApJ, 879, 70
- Inoue et al. (2014) Inoue A. K., Shimizu I., Iwata I., Tanaka M., 2014, MNRAS, 442, 1805
- Johnson et al. (2021) Johnson B. D., Leja J., Conroy C., Speagle J. S., 2021, ApJS, 254, 22
- Kawamata et al. (2015) Kawamata R., Ishigaki M., Shimasaku K., Oguri M., Ouchi M., 2015, ApJ, 804, 103
- Kawamata et al. (2018) Kawamata R., Ishigaki M., Shimasaku K., Oguri M., Ouchi M., Tanigawa S., 2018, ApJ, 855, 4
- Kikuchihara et al. (2020) Kikuchihara S., et al., 2020, ApJ, 893, 60
- Koekemoer et al. (2011) Koekemoer A. M., et al., 2011, ApJS, 197, 36
- Laporte et al. (2021) Laporte N., Meyer R. A., Ellis R. S., Robertson B. E., Chisholm J., Roberts-Borsani G. W., 2021, MNRAS, 505, 3336
- Lee et al. (2013) Lee B., et al., 2013, ApJ, 774, 47
- Leethochawalit et al. (2022) Leethochawalit N., et al., 2022, arXiv e-prints, p. arXiv:2207.11135
- Leonova et al. (2022) Leonova E., et al., 2022, MNRAS, 515, 5790
- Livermore et al. (2015) Livermore R. C., et al., 2015, MNRAS, 450, 1812
- Marrone et al. (2018) Marrone D. P., et al., 2018, Nature, 553, 51
- Matthee et al. (2017) Matthee J., et al., 2017, ApJ, 851, 145
- Matthee et al. (2019) Matthee J., et al., 2019, ApJ, 881, 124
- McLeod et al. (2016) McLeod D. J., McLure R. J., Dunlop J. S., 2016, MNRAS, 459, 3812
- Messa et al. (2019) Messa M., Adamo A., Östlin G., Melinder J., Hayes M., Bridge J. S., Cannon J., 2019, MNRAS, 487, 4238
- Meštrić et al. (2022) Meštrić U., et al., 2022, MNRAS, 516, 3532
- Oke & Gunn (1983) Oke J. B., Gunn J. E., 1983, ApJ, 266, 713
- Ouchi et al. (2013) Ouchi M., et al., 2013, ApJ, 778, 102
- Pei (1992) Pei Y. C., 1992, ApJ, 395, 130
- Roberts-Borsani et al. (2016) Roberts-Borsani G. W., et al., 2016, ApJ, 823, 143
- Robertson (2022) Robertson B. E., 2022, ARA&A, 60, 121
- Shibuya et al. (2015) Shibuya T., Ouchi M., Harikane Y., 2015, ApJS, 219, 15
- Smit et al. (2018) Smit R., et al., 2018, Nature, 553, 178
- Sobral et al. (2015) Sobral D., Matthee J., Darvish B., Schaerer D., Mobasher B., Röttgering H. J. A., Santos S., Hemmati S., 2015, ApJ, 808, 139
- Stark (2016) Stark D. P., 2016, ARA&A, 54, 761
- Stark et al. (2017) Stark D. P., et al., 2017, MNRAS, 464, 469
- Stefanon et al. (2022) Stefanon M., Bouwens R. J., Illingworth G. D., Labbé I., Oesch P. A., Gonzalez V., 2022, ApJ, 935, 94
- Tacchella et al. (2022) Tacchella S., et al., 2022, ApJ, 927, 170
- Tang et al. (2019) Tang M., Stark D. P., Chevallard J., Charlot S., 2019, MNRAS, 489, 2572
- Tang et al. (2021) Tang M., Stark D. P., Chevallard J., Charlot S., Endsley R., Congiu E., 2021, MNRAS, 501, 3238
- Tang et al. (2022) Tang M., Stark D. P., Ellis R. S., 2022, MNRAS, 513, 5211
- Topping et al. (2022) Topping M. W., et al., 2022, MNRAS, 516, 975
- Treu et al. (2022) Treu T., et al., 2022, arXiv e-prints, p. arXiv:2207.13527
- Vanzella et al. (2017a) Vanzella E., et al., 2017a, MNRAS, 467, 4304
- Vanzella et al. (2017b) Vanzella E., et al., 2017b, ApJ, 842, 47
- Vanzella et al. (2019) Vanzella E., et al., 2019, MNRAS, 483, 3618
- Vanzella et al. (2020) Vanzella E., et al., 2020, MNRAS, 494, L81
- Whitler et al. (2022a) Whitler L., Stark D. P., Endsley R., Leja J., Charlot S., Chevallard J., 2022a, arXiv e-prints, p. arXiv:2206.05315
- Whitler et al. (2022b) Whitler L., Endsley R., Stark D. P., Topping M., Chen Z., Charlot S., 2022b, arXiv e-prints, p. arXiv:2208.01599
- Witstok et al. (2022) Witstok J., et al., 2022, MNRAS, 515, 1751
- Wong et al. (2022) Wong Y. H. V., et al., 2022, ApJ, 929, 161
- Wuyts et al. (2012) Wuyts S., et al., 2012, ApJ, 753, 114
- Zanella et al. (2019) Zanella A., et al., 2019, MNRAS, 489, 2792
- Zick et al. (2018) Zick T. O., Weisz D. R., Boylan-Kolchin M., 2018, MNRAS, 477, 480