4p short = 4P, long = public-private people partnership, \DeclareAcronymac-rlnc short = AC-RLNC, long = Adaptive and Casual Network Coding , \DeclareAcronymap short = AP, long = access point , \DeclareAcronymatcll short = ATCLL, long = Aveiro Tech City Living Lab , \DeclareAcronymbss short = BSS , long = basic service set, \DeclareAcronymcam short = CAM , long = cooperative awareness message, \DeclareAcronymcv2x short = C-V2X, long = cellular-vehicle-to-everything , \DeclareAcronymdbms short = DBMS, long = database management system , \DeclareAcronymdcu short = DCU , long = data-collection unit, \DeclareAcronymdenm short = DENM, long = decentralized environmental notification message , \DeclareAcronymev short = EV, long = emergency vehicle, \DeclareAcronymiab short = IAB, long = Integrated and Access Backhaul, \DeclareAcronymicn short = ICN, long = information-centric networking, \DeclareAcronymiot short = IoT , long = Internet-of-things, \DeclareAcronymiiot short = IIoT , long = industrial Internet-of-things, \DeclareAcronymits-s short = ITS-S , long = Intelligent Transport System Station, \DeclareAcronymlifo short = LIFO, long = last in first out, \DeclareAcronymllc short = LLC, long = Low Latency Communications, \DeclareAcronymlos short = LoS, long = line-of-sight, \DeclareAcronymmec short = MEC , long = multi-access edge computing, \DeclareAcronymmqtt short = MQTT, long = message queue telemetry transport, \DeclareAcronymndn short = NDN, long = named data network-based, \DeclareAcronymnsa short = NSA , long = non-standalone, \DeclareAcronymobu short = OBU, long = on-board unit, \DeclareAcronymocb short = OCB, long = outside the context of a BSS, \DeclareAcronymotaa short = OTAA, long = over-the-air activation, \DeclareAcronymovs short = OVS , long = Open vSwitch , \DeclareAcronymp2i short = P2I, long = people-to-infrastructure, \DeclareAcronymp2p short = P2P, long = people-to-people, \DeclareAcronympdr short = PDR, long = packet delivery ratio , \DeclareAcronympgp short = PGP , long = Pretty Good Privacy , \DeclareAcronympoa short = PoA , long = point of access, \DeclareAcronymran short = RAN , long = radio access network, \DeclareAcronymrf short = RF, long = radio frequency, \DeclareAcronymrssi short = RSSI, long = received signal strength indication, \DeclareAcronymrsu short = RSU, long = road-side unit, \DeclareAcronymrtsp short = RTSP, long = real-time streaming protocol, \DeclareAcronymru short = RU, long = radio unit, \DeclareAcronymsa short = SA , long = standalone, \DeclareAcronymsbc short = SBC , long = single-board computer, \DeclareAcronymsdn short = SDN, long = software-defined network, \DeclareAcronymsdr short = SDR , long = software-defined radio , \DeclareAcronymsmf short = SMF , long = single-mode optical fiber, \DeclareAcronymtcp short = TCP , long = transmission control protocol, \DeclareAcronymtsn short = TSN , long = time-sensitive network, \DeclareAcronymuav short = UAV, long = unmanned aerial vehicle, \DeclareAcronymue short = UE, long = user equipment , long-plural-form = user equipment , \DeclareAcronymurllc short = URLLC, long = Ultra Reliable LLC , \DeclareAcronymv2i short = V2I , long = vehicle-to-infrastructure, \DeclareAcronymv2v short = V2V , long = vehicle-to-vehicle, \DeclareAcronymv2x short = V2X, long = vehicle-to-everything , \DeclareAcronymvam short = VAM, long = VRU awareness message, \DeclareAcronymvanet short = VANET , long = vehicular ad-hoc network, \DeclareAcronymvcm short = VCM, long = VANET connection manager , \DeclareAcronymvm short = VM, long = virtual machine, \DeclareAcronymvru short = VRU, long = vulnerable road user ,
Aveiro Tech City Living Lab: A Communication, Sensing and Computing Platform for City Environments
Abstract
This article presents the deployment and experimentation architecture of the Aveiro Tech City Living Lab (ATCLL) in Aveiro, Portugal. This platform comprises a large number of \acliot devices with communication, sensing and computing capabilities. The communication infrastructure, built on fiber and Millimeter-wave (mmWave) links, integrates a communication network with radio terminals (WiFi, ITS-G5, C-V2X, 5G and LoRa(WAN)), multiprotocol, spread throughout 44 connected points of access in the city. Additionally, public transportation has also been equipped with communication and sensing units. All these points combine and interconnect a set of sensors, such as mobility (Radars, Lidars, video cameras) and environmental sensors. Combining edge computing and cloud management to deploy the services and manage the platform, and a data platform to gather and process the data, the living lab supports a wide range of services and applications: \acliot, intelligent transportation systems and assisted driving, environmental monitoring, emergency and safety, among others. This article describes the architecture, implementation and deployment to make the overall platform to work and integrate researchers and citizens. Moreover, it showcases some examples of the performance metrics achieved in the city infrastructure, the data that can be collected, visualized and used to build services and applications to the cities, and, finally, different use cases in the mobility and safety scenarios.
Index Terms:
Smart Cities, Test-bed and Trials, Vehicular Networks, Software Defined Networks, Connectivity ManagementI Introduction
The concept of smart cities is not new [1]. In the last decade several cities have gone through some form of digitisation and sensing to analyse their behavior and the one of their citizens, and be able to actuate to processes that are not optimized, such as in the environment, health and mobility areas. A key pillar in this process is the interconnection of the several city elements.
Over the years there have been numerous research contributions related to connectivity in different scenarios, including mobile scenarios with people, bicycles, and vehicles, but very few of them offer actual experimental results to support their claims, even if at a small scale. The large majority of existing works still rely on numerical computations and computer simulations, not addressing the impairments of real environments.
The level of research that can be done in real environments can leverage the interaction with citizens and their services usability. On one side, research can be tested in real environments with real users, making them a beneficial part of the research. On another side, the applicability of the research can be tested and improved while it is being deployed and assessed in real environments.
In a urban living lab, multiple stakeholders (citizens, researchers, business, authorities, and city managers) form \acp4p to solve problems, collaborate, cooperate, and innovate in a real-life context [2]. Urban living labs emerge with the increasing demand to solve urban issues, innovate, and make cities more inclusive. This is the purpose of our work: we have been deploying an advanced, large-scale communication, sensing and computation infrastructure, spread throughout the city of Aveiro in Portugal, that will be at the service of researchers, digital industries, startups, scale-ups, R&D centers, entrepreneurs and other stakeholders interested in developing, testing or demonstrating concepts, products or services, to solve the city-related problems.
This article presents the current deployment of the Aveiro Tech City Living Lab (ATCLL)111https://aveiro-living-lab.it.pt/. It is supported by state-of-the-art fiber link technology (spread across 16 km in the city), reconfigurable radio units, 5G-NR radio, and 5G network services. The access infrastructure covers 44 strategic points in the urban area of Aveiro, in the form of Smart Lamp Posts or wall boxes on building facades with communication technologies, edge-based computing units and sensors. The communication infrastructure integrates a communication network with radio terminals, multiprotocol (5G, 4G, ITS-G5, WiFi, and LoRaWAN/LoRa), spread throughout the city, connected by fiber optics to a data processing center. Buses and garbage collection vehicles have also been equipped with communication units with WiFi, ITS-G5 and 5G technologies, and sensors, which currently record mobility and environmental data, making a complete live map of these parameters in the city, and providing the required data for traffic monitoring and safe driving systems. All these points combine and interconnect a set of sensors, such as mobility sensors (GPS, traffic radars, LiDARs, and video cameras) and environmental sensors (such as temperature, humidity, pollution) with remote data collection units throughout the city, providing enough data to support a wide range of services and applications: from \aciot and Internet access to citizens, to mobility and assisted driving, intelligent transportation systems, environmental monitoring, emergency and safety, among others.
This article describes the architecture, the technologies and the mechanisms developed to make the overall platform to work and integrate researchers and citizens, testing mechanisms and providing services to the city. It also describes some examples of the performance metrics achieved in the city infrastructure, the data that can be collected, visualized and used to build services and applications to the cities, and different use cases in the mobility and safety area that can be implemented and tested in the platform.
The remainder of this paper is organized as follows. Section II contains the related work on living labs and deployments throughout the world. Section III presents the proposed architecture of the living lab. Section IV discusses the multi-technology communication approach with people, sensors and vehicles. This is followed by section V that contains the computing/edge approach, and the process to automate the deployment of services and applications. Section VI contains the process to manage, process, and share data. Section VII discusses the obtained results and section VIII presents the defined use cases. Finally, section IX presents our conclusions.
II Related Work
This section presents some of the related work on living labs on smart campuses or smart cities deployed over the last years. We include a trend on the evolution of these living labs throughout this decade.
In 2010, Timo Ojala [3] proposed an urban and open testbed in the city of Oulu, Finland, with both WiFi and Bluetooth technologies and devices, to demonstrate the potential of such infrastructure. The main goal was to study the utilization of pervasive computing services with technology pilots and service prototypes. Through the creation of an Open Ubiquitous City Challenge, several researchers created new applications through the WiFi and Bluetooth data, contributing to this urban testbed.
The SmartSantander is a city-scale experimental research facility in the city of Santander, Spain. The SmartSantander [4] monitors the environment by using low-cost sensors to measure the air quality, noise level and luminosity level, and contains wireless technologies such as IEEE 802.15.4 and cellular GPRS. The project also monitors the occupancy of some outdoor parking spaces using ferromagnetic wireless sensors, and provides parking status information to the citizens using display panels or mobile applications. SmartSantander contains a smart and automated irrigation system that sustainably manages the water consumption. It also provides context-sensitive information and services using augmented reality. The SmartSantander living lab continued to grow over the years. The authors installed devices in 140 buses, taxis, and vans. With this information, they can assess environmental and traffic conditions [5].
In 2016 it was presented the City of Things, a smart city testbed established in Antwerp, Belgium [6]. The City of Things allowed the researchers to perform experiments on large-scale multi-technology \aciot networks, data, and in the living lab. The technologies deployed are IEEE 802.1ac on 2.4 and 5 GHz, DASH7 on 433 and 868 MHz, Bluetooth (Low Energy), IEEE 802.15.4, IEEE 802.15.4g and LoRa. With this platform, they were able to monitor air quality, traffic, parking spot occupancy, and manage smart parking signs.
There are also several \aciot sensing testbeds that focus more on the \aciot architecture and services, with base wireless technologies such as WiFi, Bluetooth, LoRa or cellular, and environment sensing. Examples emerge from Mexico [7] for environment, water and energy; from university campuses as living labs for energy management, such as in Brazil [8]; from Antwerp [9] for air quality measurement, traffic monitoring through traffic counter sensors and smart parking. Dublin also contains a platform222https://smartdublin.ie/ on a business perspective, that addresses several areas such as environment and mobility.
The platform in [10] presents a real-world testbed for research and development in vehicular networking that has been deployed successfully in the seaport of Leixões, Portugal. The testbed allows cloud-based code deployment and, through ITS-G5 technology, it allows remote network control and distributed data collection from moving container trucks, cranes, tow boats, patrol vessels, and roadside units, thereby enabling a wide range of experiments and performance analyses.
PortoLivingLab [11] is a smart city testbed located in the city of Porto, Portugal. Through the deployment of several sensors installed in city buses and other static locations, it can collect, through ITS-G5 or LTE, data about the environment (noise and air pollution), weather, public transport, and people’s flows. This originated three monitoring platforms with sensing capabilities and a common backend infrastructure. The first monitoring platform is a crowdsensing research tool that collects data from participants’ smartphones through WiFi and cellular. The second one allows monitoring the environment through WiFi. The last one contains a network of buses, each one equipped with an \acobu in order to achieve \acv2v and \acv2i communication.
PASMO [12] is a highway ITS road between the seaside and Aveiro/Ílhavo, in Portugal, providing vehicular communications through ITS-G5. This road enables the test of vehicular communications and road automotive use cases. The living lab presented in this paper, in the city of Aveiro, integrates with PASMO in the highway.
On the 5G perspective, l’Aquila in Italy has been proposed as a living lab for 5G experimentation [13], but only the fiber optical ring has been presented, as well as use cases to be tested. Bristol in UK has also a testbed that is being used on a business perspective333https://www.bristol.gov.uk/, which encompasses some technologies, such as 5G in specific places.
On a different perspective, living labs for autonomous driving have also been deployed. The work in [14] presents the Autonomous Vehicles — AV Living Lab that spreads across the shopping center BTC in Ljubljana, Slovenia, with autonomous vehicle demonstration events.
Our approach in this paper goes beyond these several examples in different aspects: (i) the Aveiro TechCity Living Lab encompasses different communication technologies for people, sensors and vehicles, simultaneously; (ii) it includes different sensors, in a fusion approach, addressing the monitoring with different perspectives and higher accuracy; (iii) it encompasses both access, edge, and core infrastructure, and both network and data management; (iv) it is programmable and with third-party seamless integration; and (v) it addresses different use case scenarios, from environment to mobility and self-driving.
III Aveiro Tech City Living Lab Architecture
atcll has been designed with the following three main objectives: (i) to build a communication, sensing, and computing infrastructure connected by fiber optics integrating a communication multiprotocol network with radio terminals for short, medium and long-range communication; (ii) to implement a sensing platform capable of understanding the environment quality and citizens’ behaviour within the city, and providing new solutions towards efficient traffic management, intelligent transportation systems and citizens’ safety; and (iii) to provide an open platform for third-party partners to test their own protocols, mechanisms, prototypes, or explore collected data to build new services and applications.
The structure of the platform can be divided in the following manner: (i) access and edge, which is supported on fiber technology, edge computing, high data-rate \acsdn devices and radio units, either dedicated and \acsdr based; (ii) sensing devices and platform, static and mobile, collecting various forms of data, and computing edge units; (iii) backhaul and core, which consists of the datacenter with core network devices and servers to manage the network; and (iv) backend and data platform, which are composed of the data platform core with the broker, database and data processing.
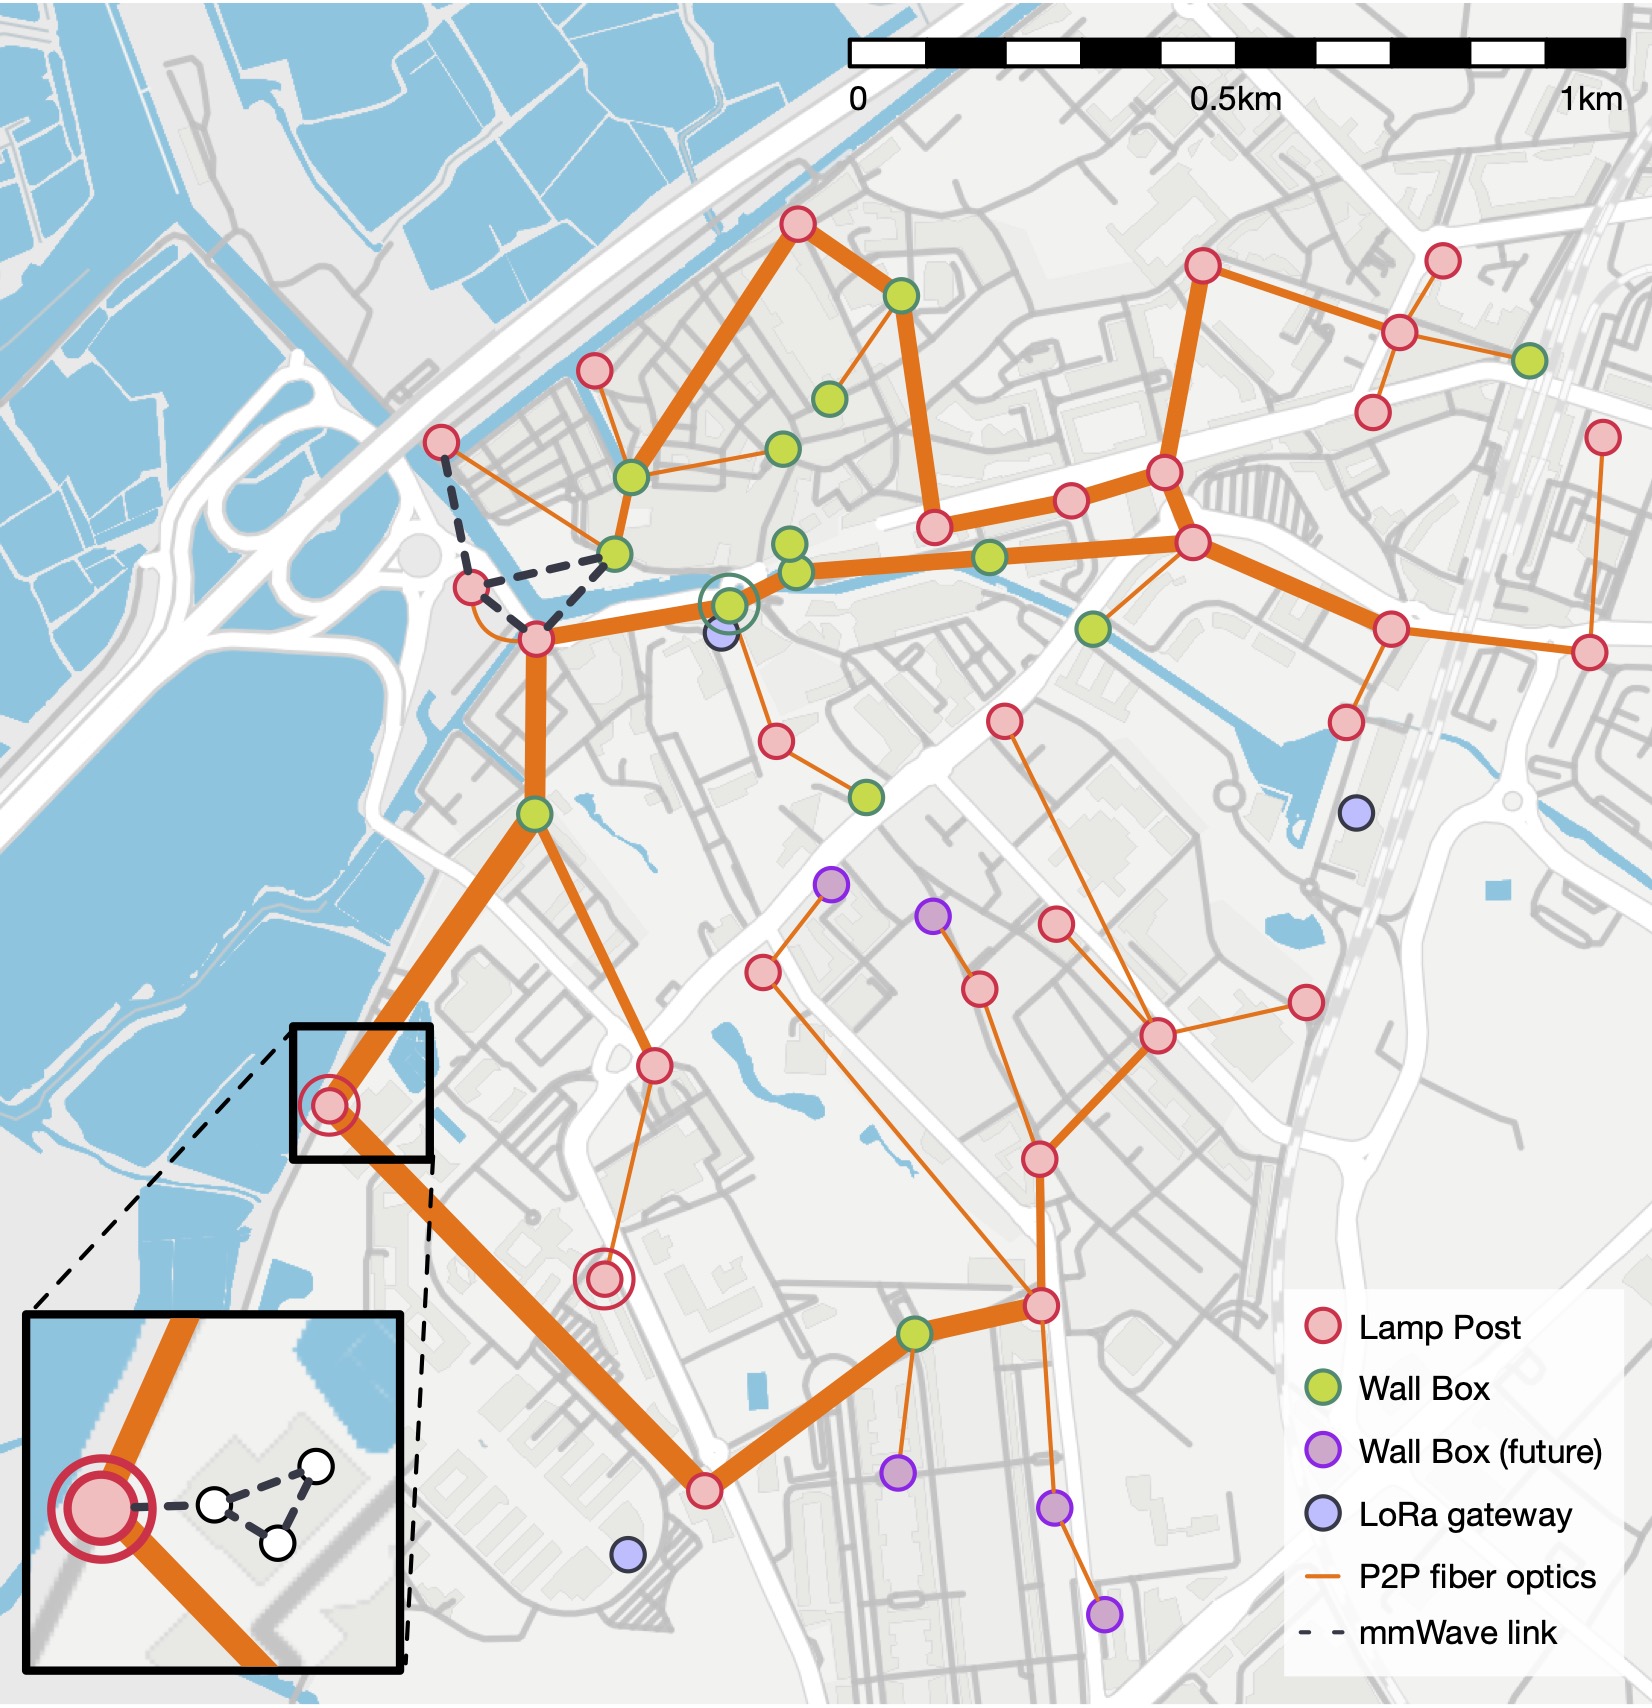
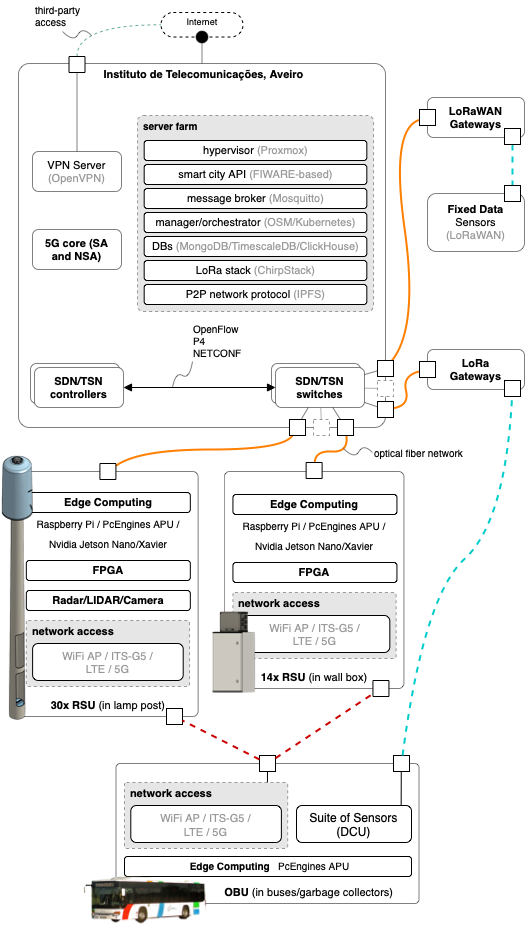
Figure 1 depicts the \acatcll in the map of Aveiro, its fiber connections and the different access points placed in strategic locations in the city. Figure 2 illustrates the high-level diagram of the infrastructure, architecture and services of the \acatcll. The next sections describe the several components of the \acatcll architecture.
III-A Access and Edge
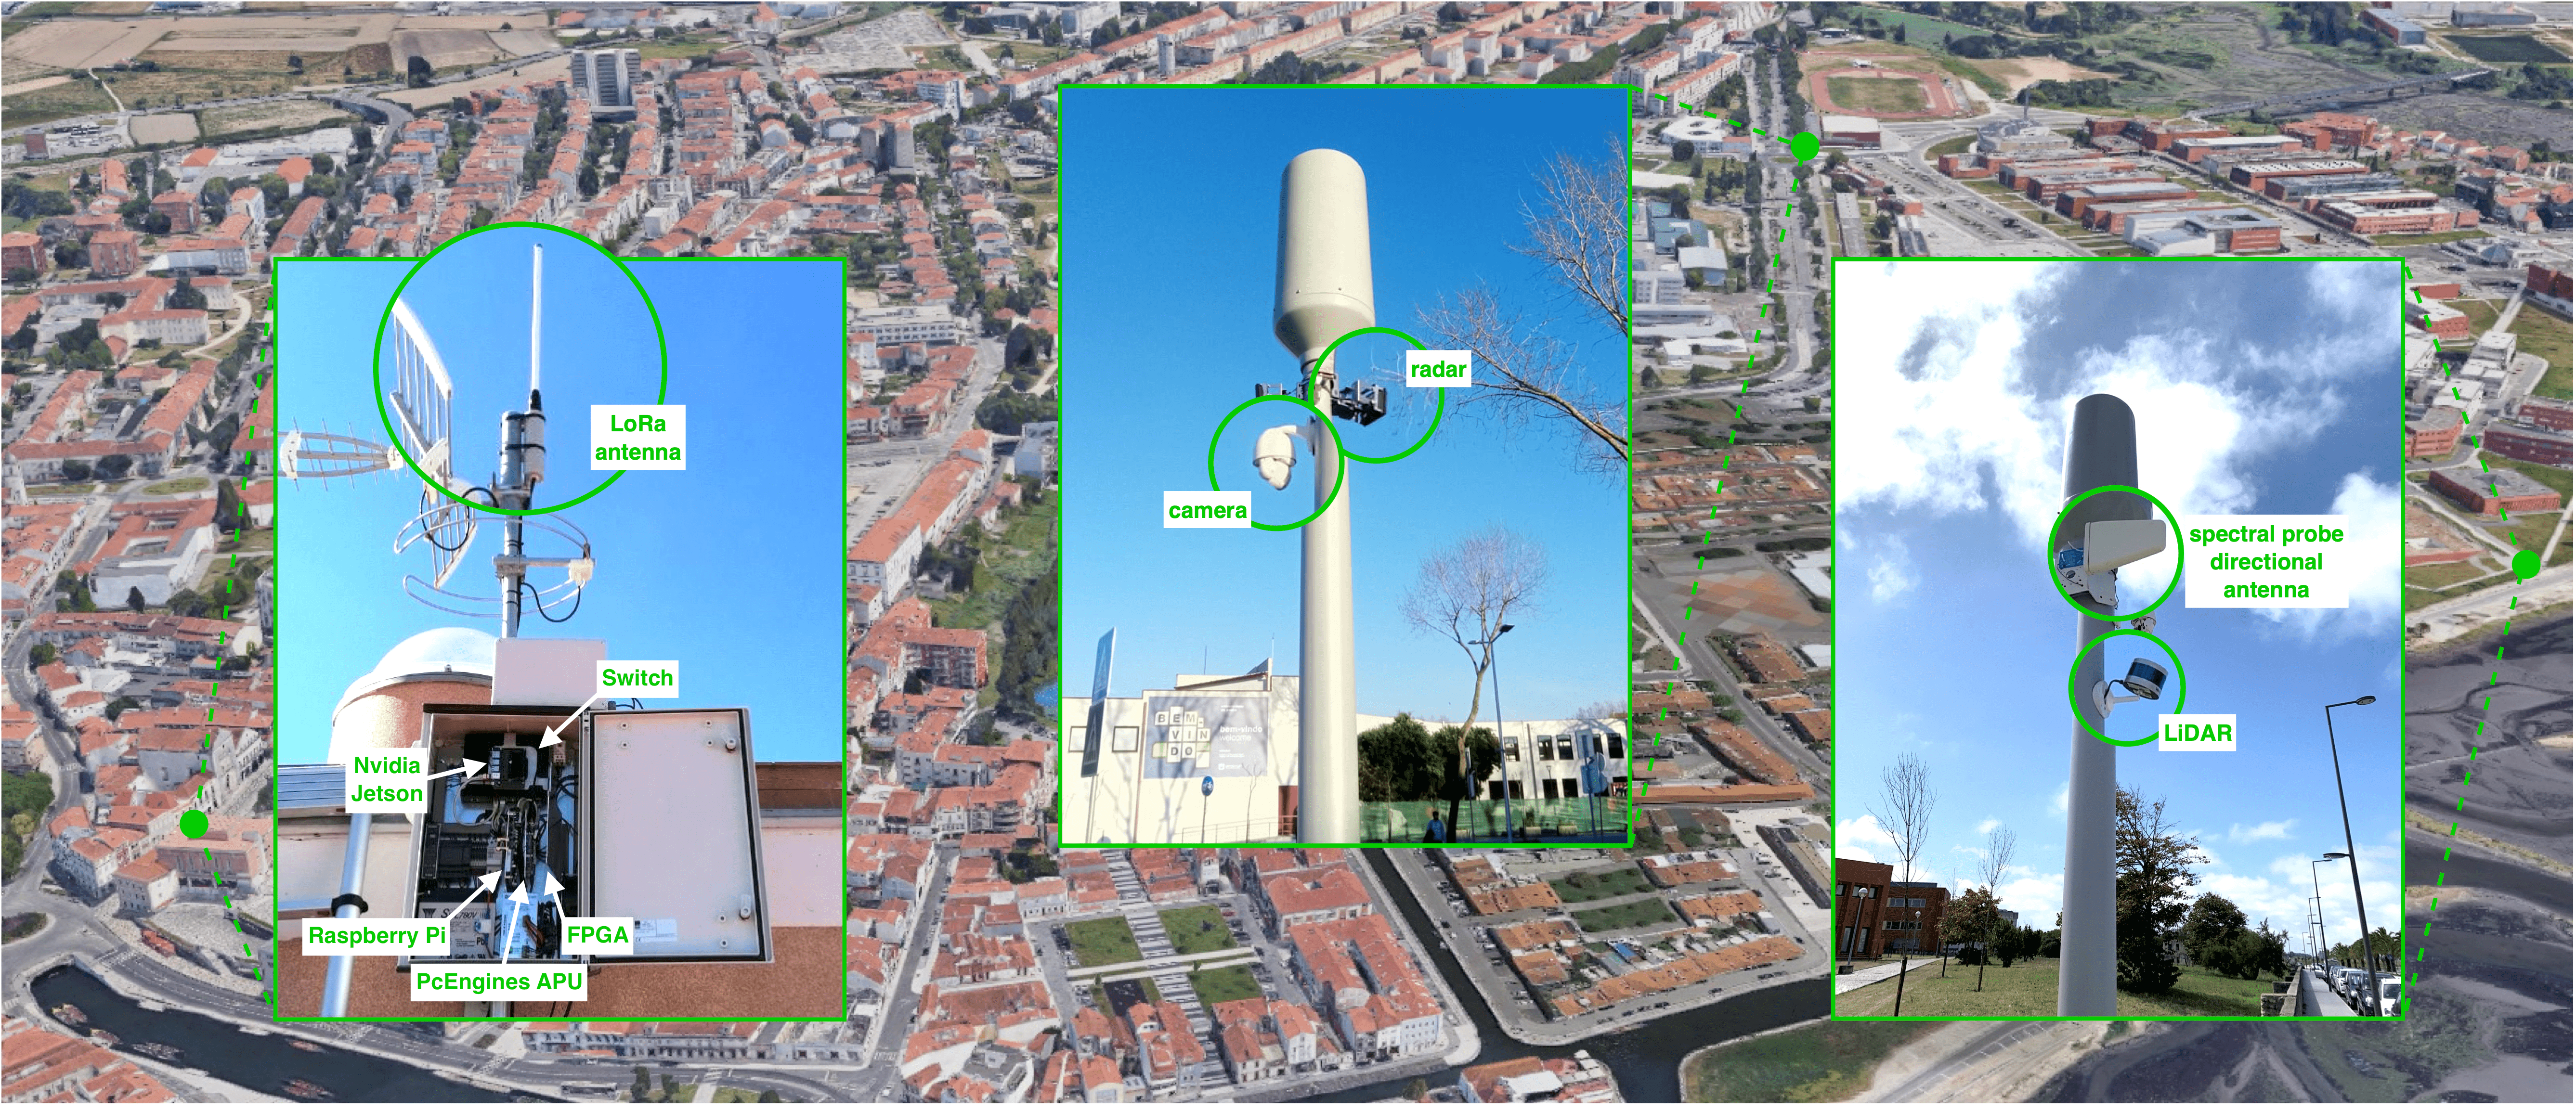
The access infrastructure is based on the \acsmf link technology (G.652), with 16 km of length, interconnecting the edge nodes with re-configurable radio units and 5G network services, in 44 strategic places covering the urban area of Aveiro. These points are deployed in the form of Smart Lamp Posts or wall boxes on building facades. Examples of Smart Lamp Posts and wall boxes are depicted in Figure 3.
The physical infrastructure of the access network is composed of one-to-one fiber links aggregated by a switch supporting 10 GbE connections, \acsdn functionality through \acovs444https://www.openvswitch.org/, and \actsn555https://1.ieee802.org/tsn/ features configured by NETCONF. The uplink to the core is completed with 40 GbE ports. Supporting \acsdn allows the control of the network by software, using open-source controllers such as Ryu666https://ryu-sdn.org/ and ONOS777https://opennetworking.org/onos/, and control plane protocols OpenFlow and P4 Runtime888https://opennetworking.org/p4/. In addition, network algorithms and machine learning techniques are also included to monitor and take action in the network. For instance, in the case of the mobility network, Internet connectivity and handovers in the mobile nodes are made possible by the algorithms running through the \acsdn controller [15].
Regarding the edge points, they combine different equipment for several purposes in each Smart Lamp Post/wall box: communication access points, \acmec and sensing devices. In terms of communication technologies, there are two main devices providing wireless access: FPGA-based \acsdr units, with a wideband (300 MHz to 6 GHz) integrated \acrf frontend, to provide cellular access (4G, 5G and beyond) and a PC Engines APU999https://www.pcengines.ch/apu.htm. The PC Engines APU combines two wireless modules: WiFi and ITS-G5, and some with \accv2x). Some of the APUs also integrate 5G modules that work with a 5G experimental network in Aveiro provided by Altice MEO Operator101010https://www.meo.pt/, and some of the edge points also integrate LoRa and/or LoRaWAN gateways. Regarding \acmec, every point has available a set of Nvidia Jetson Nano or Jetson Xavier with a powerful GPU for graphic-intensive processing, and a Raspberry Pi 4 aimed for the deployment of lightweight services. Finally, in terms of sensing devices there are spectral probes, traffic radars, LiDARs and video cameras.
III-B Sensing
As referred previously, the \acatcll contains static sensors in the edge nodes of the infrastructure such as spectral probes, traffic radars, LiDARs, and video cameras (as seen in Figure 3). Information coming from these devices is aggregated and correlated to give insights on the people’s flow, providing concrete elements for new solutions on public transportation, safety-critical and autonomous driving systems, and to identify problems and optimize the mobility in the city. The spectral probe is a passive radar system consisting of an antenna array comprising three dipoles forming a 360º antenna and a low-cost commercial \acsdr (ADALM-PLUTO) connected to the Raspberry Pi for processing the collected data. The FPGA-based \acsdr units can also be individually reconfigured to implement wideband, high-performance and real-time distributed spectral probes, with centralized processing of the acquired signals that can be stored and used as rich data sets for different purposes. The other sensors are described in more detail in subsection V-C. A set of \acpuav equipped with video cameras and sensors are also considered as mobile sensing units to gather data from the city and to give support to patrolling and traffic management.
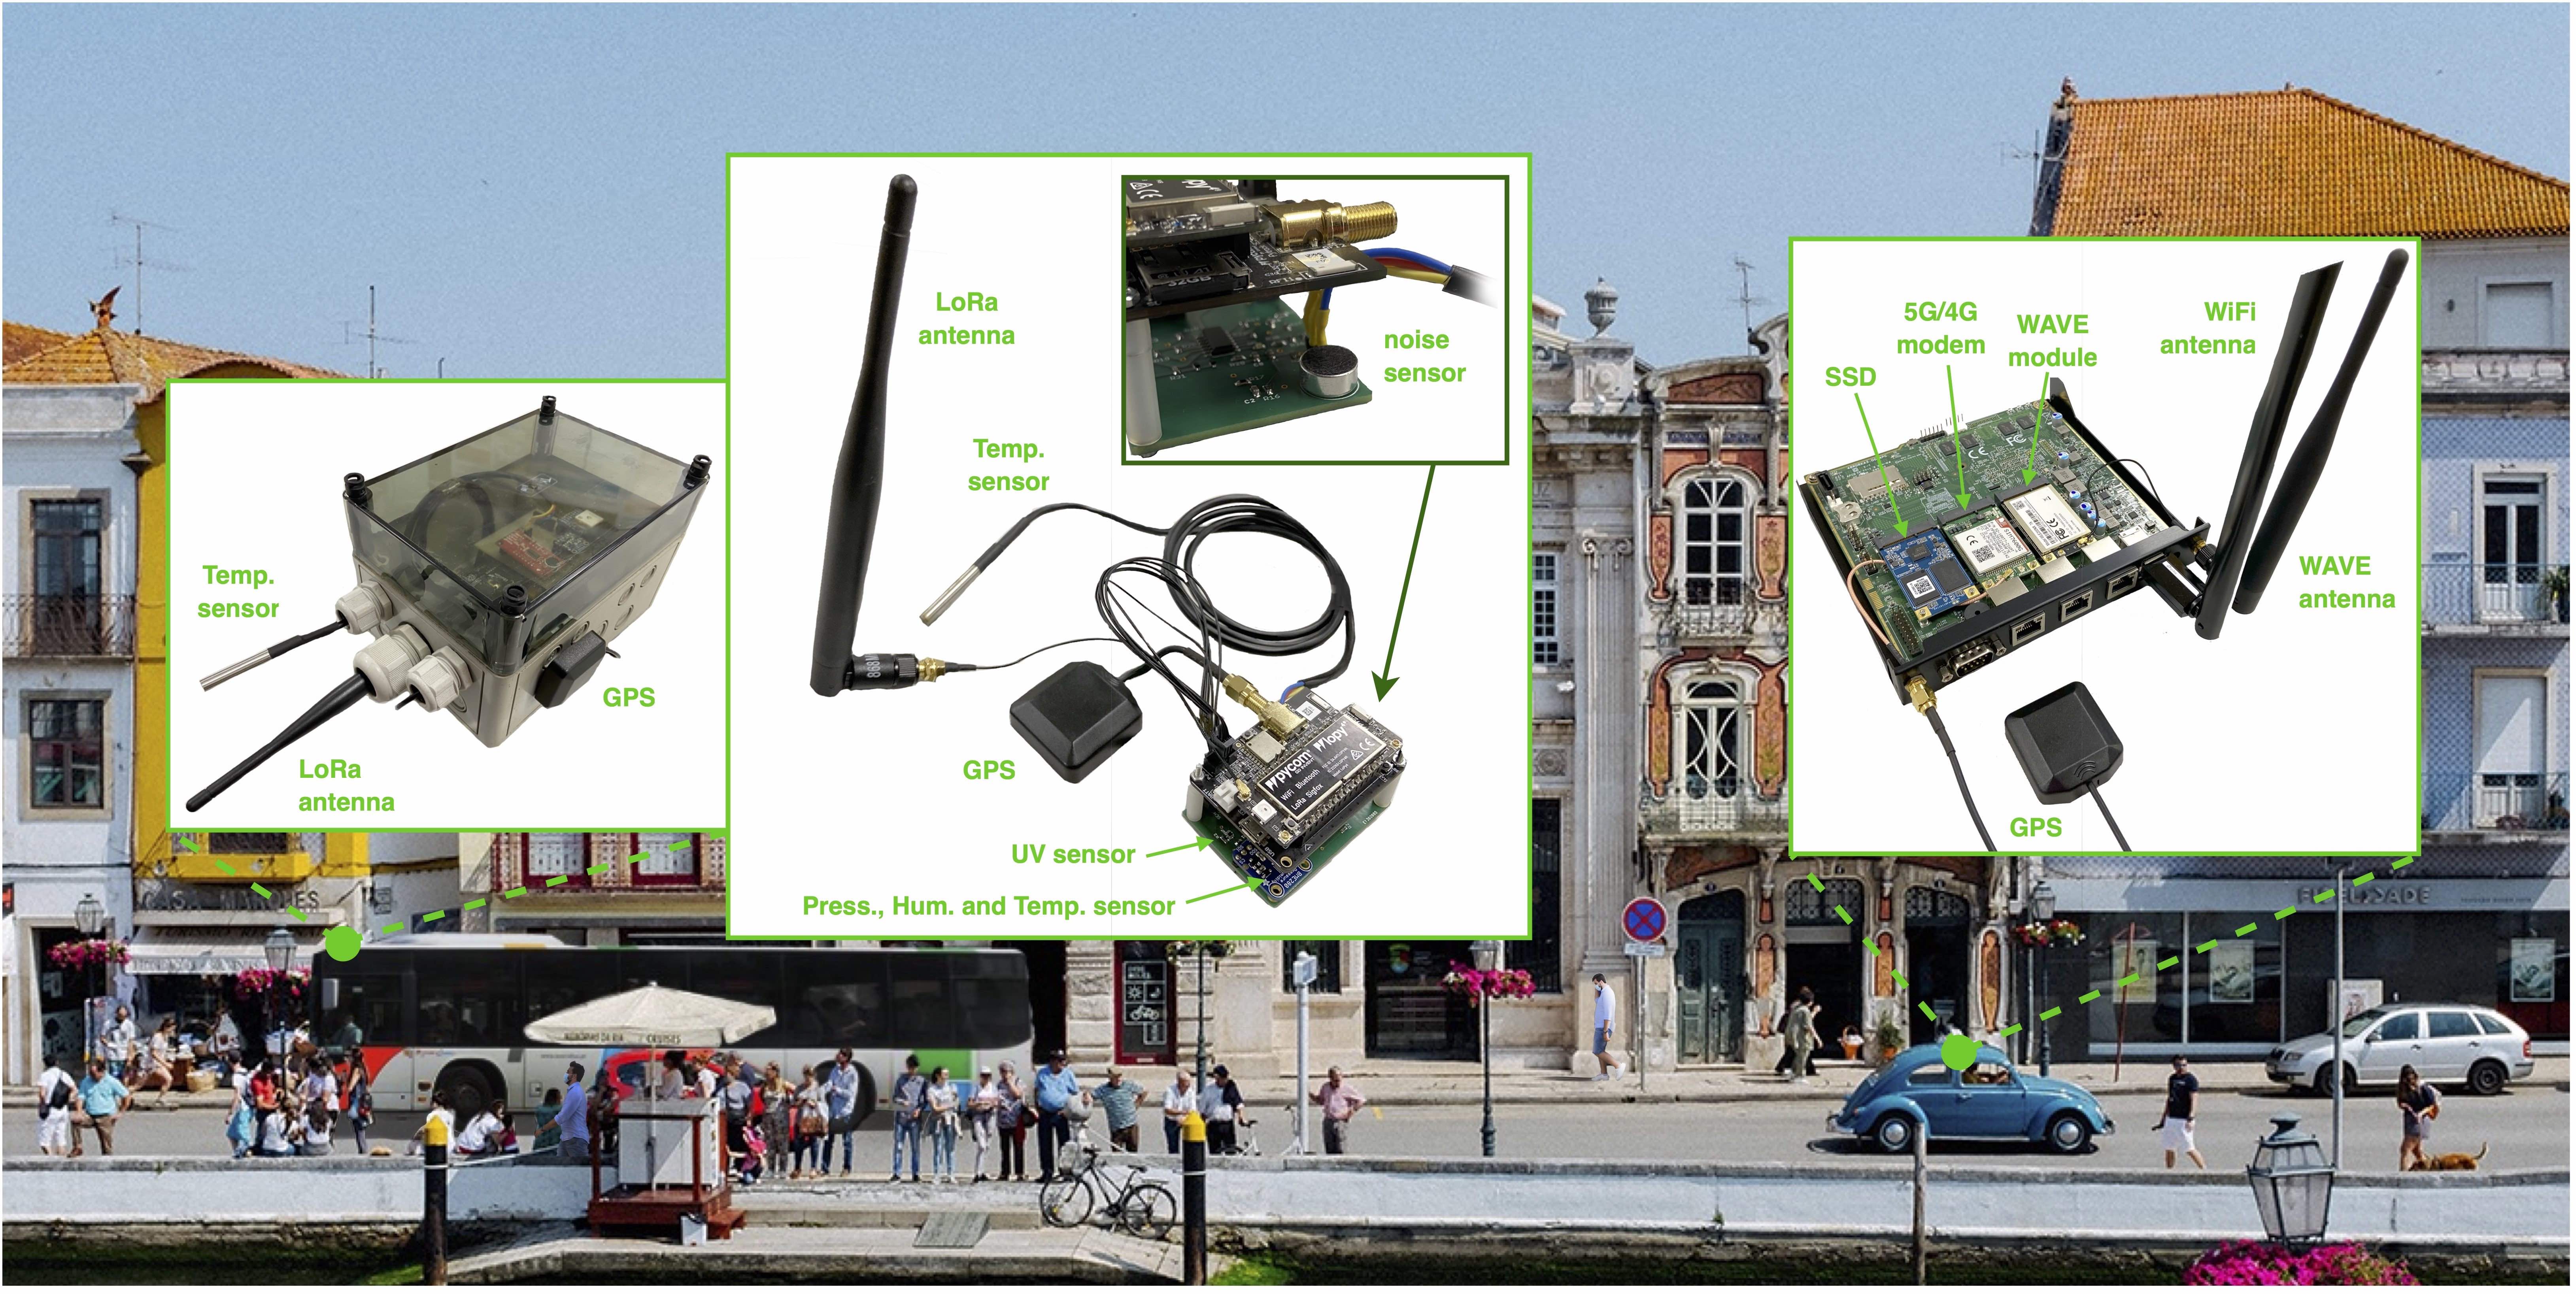
The \acatcll also contains mobile sensing devices and other geolocation sensors installed on vehicles (buses and garbage collection vehicles) and local boats (moliceiros). The available mobile sensing information comprises GPS location, speed and heading, temperature, humidity and air pressure, which enables the complete mobility map of the city. Communication equipment is also installed in the vehicles and local boats to transmit mobility and environment data through the static access points, making a complete live map of these parameters in the city, and providing the required data for environment sensing, traffic monitoring and safe driving systems. The mobile equipment is composed of a \acdcu (Figure 4) which integrates WiFi and LoRa communication. The vehicles also include an \acfobu (Figure 4) with WiFi, ITS-G5 and cellular communication (currently some units already integrate both 4G and 5G modules) to establish the connection with the \acfprsu and with other vehicles. Currently, 10 public buses are working as connected vehicles with \acobus, and an extension to 30 buses is being performed. Cars with integrated OBUs from the start are also detected and communicate with our \acrsus. The WiFi access points, both in the static access points and in mobile on board units in the vehicles, are also gathering data from people’s smartphones through their connectivity in the city.
III-C Backhaul and Core
The infrastructure is complemented with a network and data processing center located at the premises of Instituto de Telecomunicações, in Aveiro. The datacenter is composed of multiple servers managed by Proxmox VE111111https://www.proxmox.com/en/proxmox-ve, which deploy all virtual machines with the services, data platform, apps, 5G core and network functions running in the cloud, such as Kubernetes121212https://kubernetes.io/, OSM131313https://osm.etsi.org/, ChirpStack141414https://www.chirpstack.io/, among others. The \acsdn controllers are also deployed in the core of the network, defining the structure of access and mobility networks, and reacting dynamically to possible changes in the demand and conditions of the network. An important feature of the infrastructure is the possibility to give access to the sensors, network devices or services to third-parties, which is allowed by an OpenVPN server.
III-D Backend and Data Platform
The management of the data collected through the ATCLL sensing devices is performed by the Core Data Platform, as depicted in Figure 5. This platform is capable of receiving, storing, and processing information from several different domains, while exposing it in a secure and efficient manner via various different interfaces. This section provides an overall overview of this platform. Further details are available in [16].
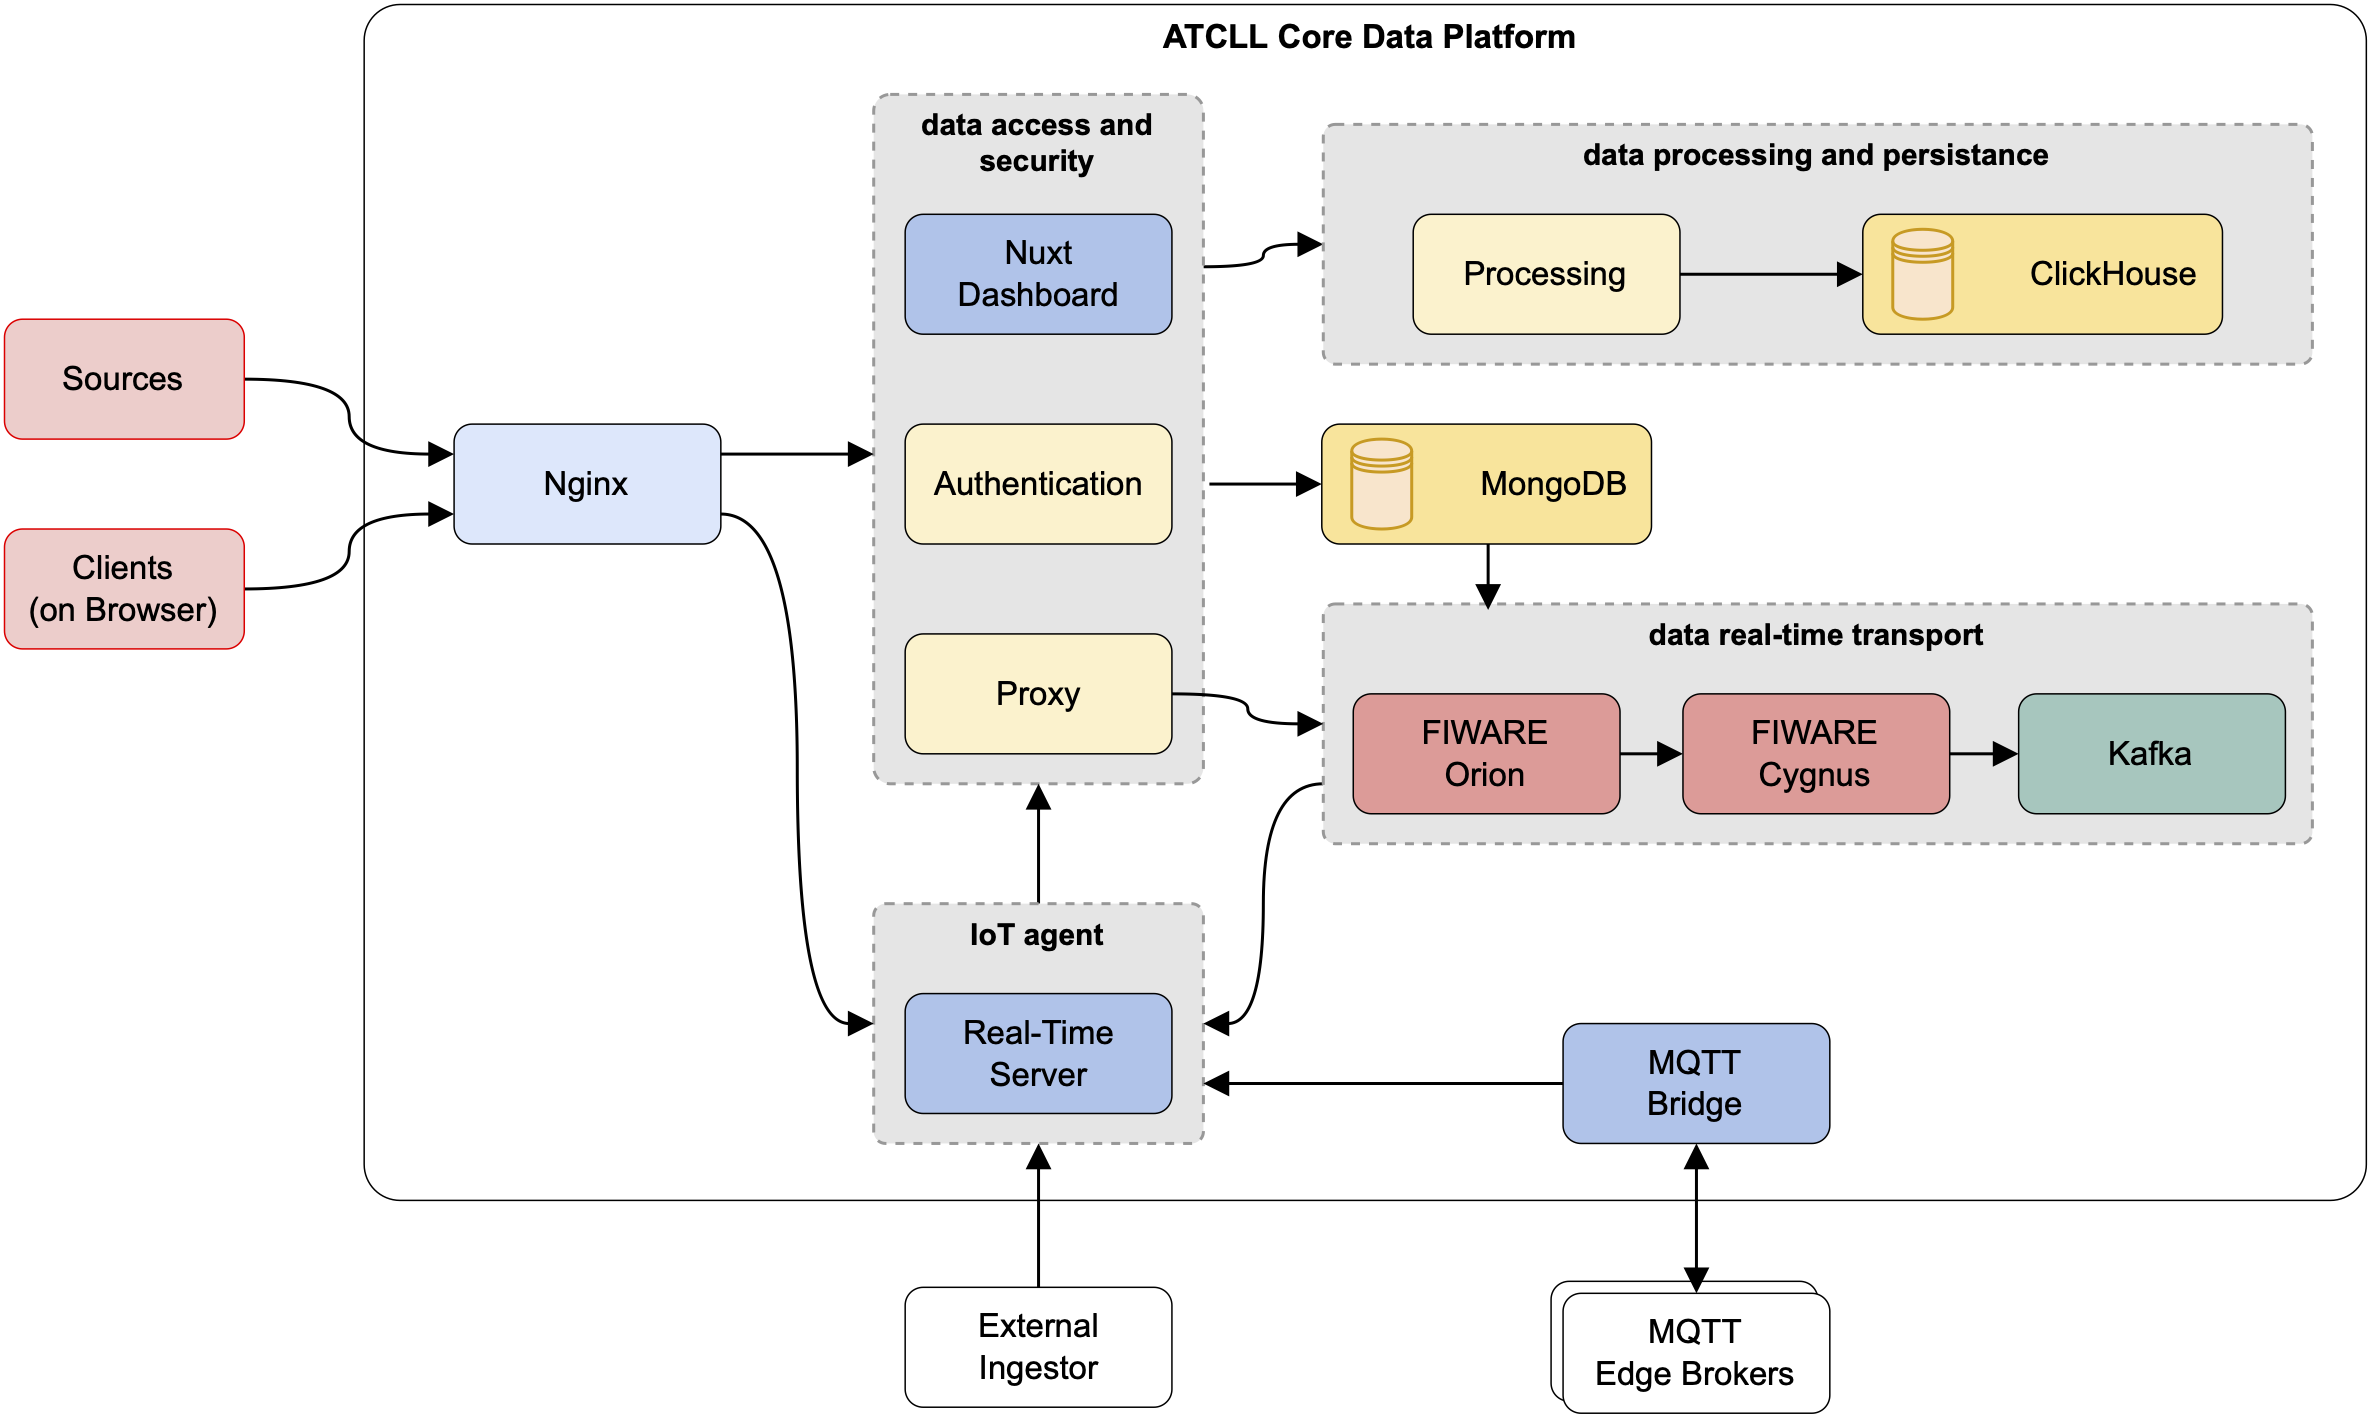
As shown in Figure 5, the data platform can be divided in four main modules: the data access and authentication, data persistence, data real-time transport, and the \aciot-agents. The platform was designed on top of the multi-tenant model of FIWARE’s Orion Context Broker151515https://fiware-orion.readthedocs.io/en/master/, the core of the real-time transport module and the point of access of the \acatcll platform. This broker follows a publisher-subscriber model that allows the creation and update of entities and subscriptions, logically separated by the value present at the FIWARE-Service header of the requests, hence the multi-tenant model. The data platform extends this model and also uses the FIWARE-Service header to perform authentication, persistence, and access to the information separated by tenants/domains. The Orion Broker also supports hierarchical scopes, with the FIWARE-ServicePath header, that can be freely used with the Orion instance to divide entities and subscriptions of a FIWARE-Service by different paths. On the entrance of the platform, there is an Nginx161616https://www.nginx.com instance working as a reverse proxy while also managing the SSL certificates, offloading the deciphering process from the servers.
The dashboard allows the visualization of current and historical data. It is possible to visualize data collected by the sensors, static or placed in mobile elements such as buses and garbage trucks. The dashboard communicates directly with the Nginx server, forwarding the requests to the respective service. The data is obtained through the Processing server APIs and the ClickHouse171717https://clickhouse.com/ database.
Furthermore, all new communications received from mobile or static sensors are registered in a centralized monitoring and alerting platform (Zabbix181818www.zabbix.com and Grafana191919https://grafana.com/), allowing the examination of the health status (time since last seen) of a given end-device and, therefore, of the system as a whole at any given time.
The data gathered from all smart city elements provides the required conditions to support services and applications, such as Internet access for all citizens, environmental sensing, mobility and emergency services, content distribution, assisted driving, among others.
IV Communication Approach
This section details the communication approach between the mobile and static elements, and how the mobile and sensing nodes are able to be seamlessly connected between themselves and to the infrastructure.
IV-A Communication Technologies
One of the main novelties of this platform is its multi-technology capability. It contains short-, medium- and long-range technologies that are used between their different elements. Through these radio access technologies, the infrastructure integrates sensors, people, through their mobile phones, and vehicles that support ITS-G5 technology or 5G, such as buses, bicycles in the city and moliceiros in the Aveiro Lagoon.
For short-range communication, the infrastructure supports ITS-G5 and WiFi. The \acprsu for ITS-G5 and WiFi access points are located in all 44 city nodes represented in Figure 1. Additionally, 2 nodes contain also Cellular Vehicular-to-Everything (C-V2X). The \acprsu and \acpobu are implemented using a \acsbc produced by PC Engines202020http://pcengines.ch, which is equipped with an IEEE 802.11a/b/g/n mini-PCIe wireless card. This mini-PCIe wireless card is used for ITS-G5 \acv2x communications. Additionally, the \acrsu contains a second wireless card for the WiFi \acap, and the \acobu contains an LTE CAT-1 mini-PCIe module or 5G m.2 module and an external USB dual-band wireless adapter (Figure 4). In order to use the wireless card compatible with a ITS-G5 standard, it requires patching the Linux kernel, to permit operating in the desired 5.9 GHz band and including the \acsocb mode support212121https://ctu-iig.github.io/802.11p-linux/ (meaning \aclocb) to the ath9k driver. The LTE (4G) module is used for cellular connectivity and GPS location, since GNSS technology is included in this module. For the 5G module to work properly, the ModemManager from freedesktop.org222222https://www.freedesktop.org/wiki/Software/ModemManager/ was used. This module supports \acnsa and \acsa operation modes depending on additional configurations. The cellular link allows to have connectivity in the surroundings of the city and in non-covered urban areas with the \acprsu’ ITS-G5 connection. The external wireless adapter serves as an access point for passengers inside the vehicle and for the \acdcu that sends all the gathered data via WiFi to the \acobu, to forward it to its final destination through the \acv2i communication (ITS-G5 or 5G).
In terms of medium-range communication, apart from the deployment of the \acpobu (with cellular modems) as \acpue, the infrastructure includes \acran deployments, where the \acpru or small cells are placed inside the Smart Lamp Posts and the wall boxes on building facades. The main \acran deployment is a 5G O-RAN demonstrator with 20+ \acpru built on FPGA-based \acsdr boards. This distributed topology of \acpru takes advantage of the fiber network linking the city nodes to the core for the fronthaul communication. Other nodes include small cells of third-party vendors. With both approaches, the \acatcll offers the possibility to have private 5G network deployments for testing and development of use cases requiring cellular access. Moreover, with the integration of \acsdr hardware, the infrastructure is also evolving into a testbed of beyond-5G and 6G technologies.
Finally, regarding long-range communication, the infrastructure supports LoRa communication using our custom protocol [17] and LoRaWAN protocol, both in the end devices (\aclpdcu) and in the gateways. The LoRa with custom protocol implementation hardware consists, in \acpdcu and gateways, of a Raspberry Pi model 3B+ \acsbc with a multi-protocol radio shield that attaches a Libelium SX1272 module and an 868MHz antenna. To maximize the range while maintaining a sensible data rate, the SX1272 module is used in mode 3, which entails a spreading factor of 10 and a coding rate of .
For the LoRaWAN protocol, the \acpdcu are based on LoPy4232323https://pycom.io/product/lopy4/ (Figure 4), and the gateways are LORIX One242424https://www.lorixone.io/ or an extension to the APU board with a mPCIe card. End devices join the network via \acotaa and transmit, in most cases, using a spreading factor of 9 and a coding rate of . At the time of writing of this article, there are two LORIX One outdoor gateways placed in strategic locations in the city (Figure 3), with more gateways to be deployed in the near future.
IV-B Sensing to Infrastructure Communication
Data generated from the various sensing modules is acquired using different technologies depending on the data source (Figure 6). The data originating from \acdcu equipment installed on the vehicles can be sent to the \acobu via a wireless WiFi network through an open \acstcp socket. The information is then persisted in a \aclifo queue kept on the filesystem252525www.pypi.org/project/persist-queue, which aggregates all the data points produced by the different sensors and services active on the bus. Keeping the queue in the filesystem preserves it in the event the bus powers off before communication with the infrastructure is possible.
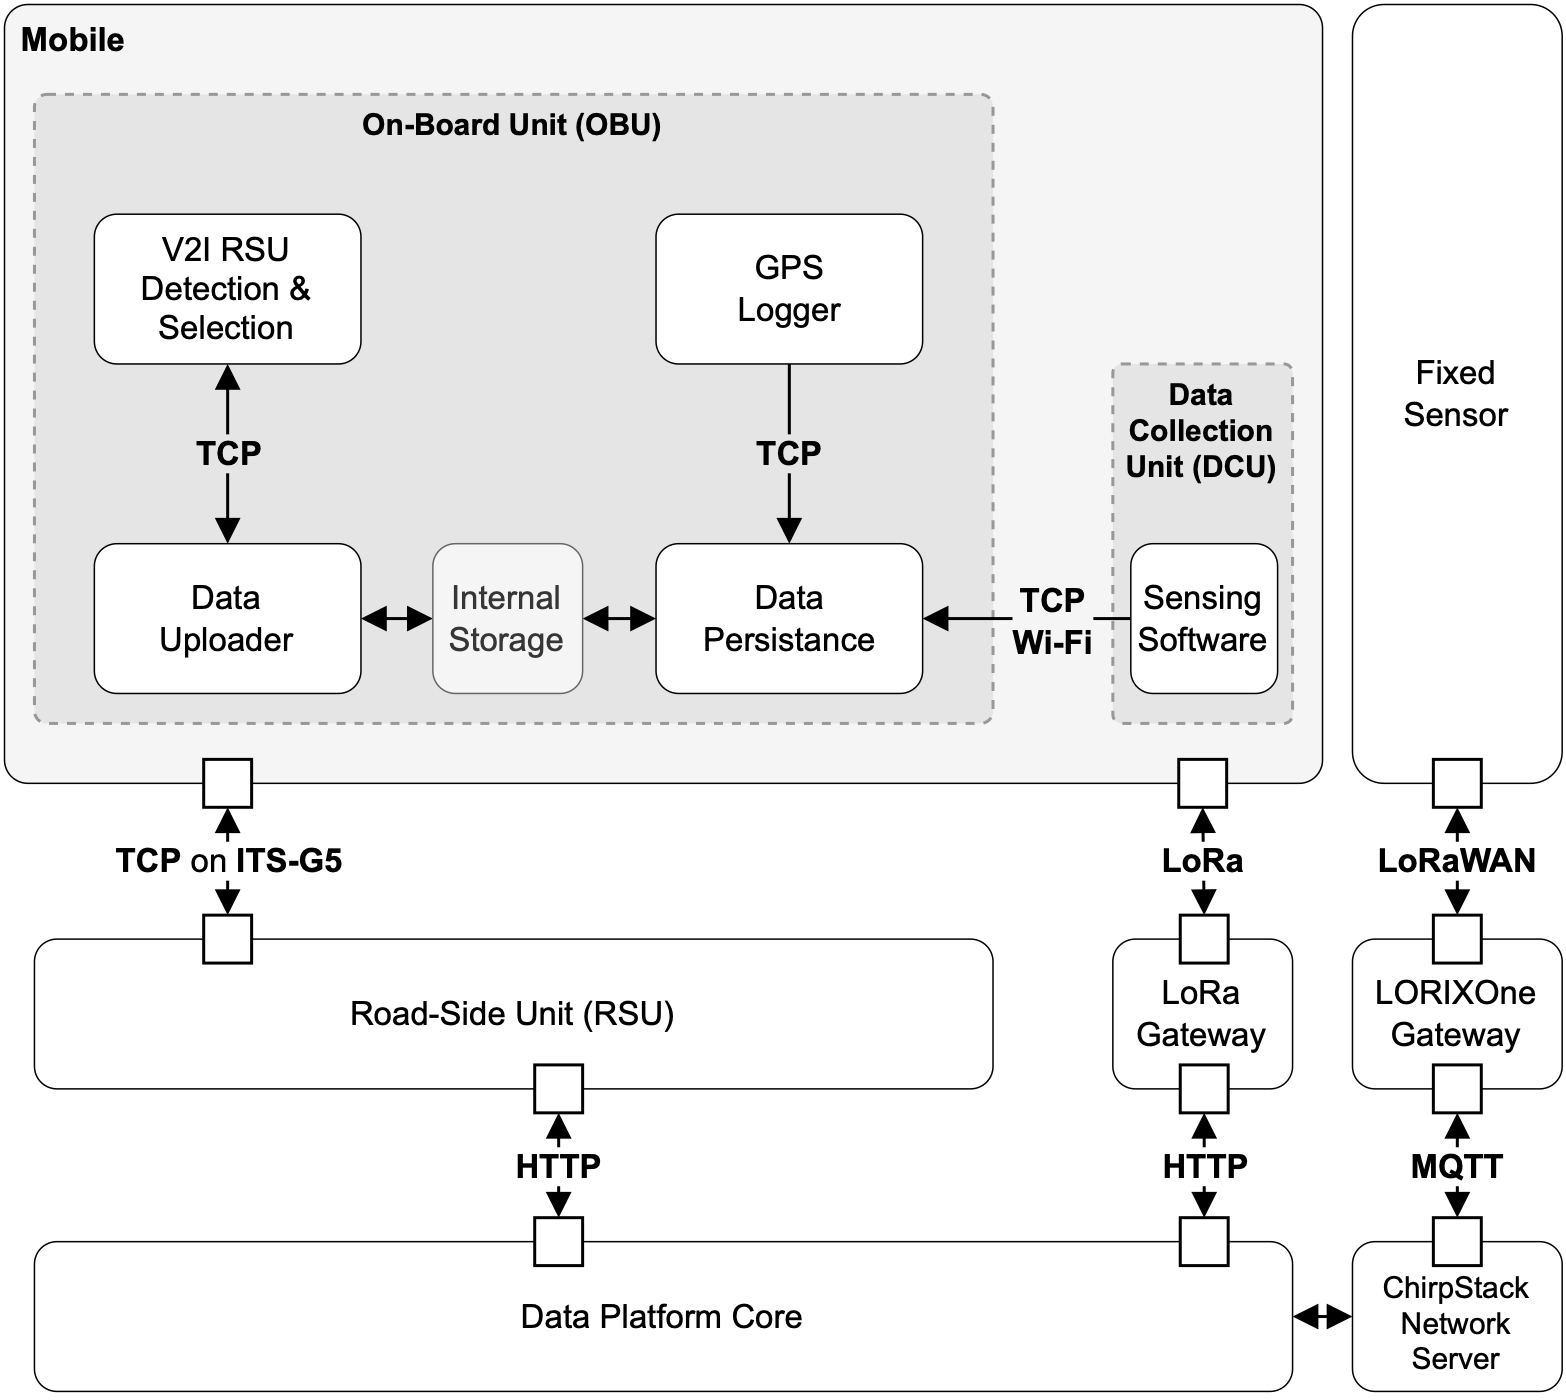
The \acdcu is constantly connected to the aforementioned WiFi network and transmits new data points every seconds (this is configured and is set at 3 secs). Additionally, the \acobu itself regularly generates GPS location information and various relevant event logs, which are also queued to be sent to the infrastructure.
v2i micro services present in the \acv2i network are continuously polled until a suitable known \acrsu is detected within range, at which point the data queue is compressed, encrypted with \acpgp, and sent via \acstcp through the ITS-G5 or 5G interface. It is then deleted from the \acobu upon acknowledgement of successful integrity verification at the destination (MD5 hashsum).
Once in the \acrsu, the elements in the queue are processed by a multi-threaded pool of consumers that decode the information and, when applicable, build a standard FIWARE NGSI-LD262626www.fiware-datamodels.readthedocs.io/en/latest/ngsi-ld-howto JSON payload that is then sent to the data platform. This software stack supports the collection of several types of data, from multiple sources, and at any desired measurement frequency, thus allowing for future integration with other sensors and different use cases.
Concurrently, the \acdcu modules also make use of their LoRa capabilities to communicate directly with the infrastructure and transmit sensing data to the LoRa gateways installed in the city. These transmissions include the latest measurement information encoded in a custom payload, and occur approximately every 2 minutes and 20 seconds, so as to comply with duty cycle restrictions referring to the use of LoRa frequency bands in the EU. This approach introduces a degree of communication redundancy, and is especially useful to collect up-to-date data in routes with low \acrsu coverage (as opposed to obtaining the stored data later, when a \acrsu is encountered), and in deployments where the \acdcu is the only equipment installed in the vehicles (this is the case of garbage collection vehicles in the city). Once received by a gateway, LoRa frames are decoded and sent to the data platform in the form of NGSI-LD objects, as previously described.
For the sensors using LoRaWAN, the end devices join the network via \acotaa, and communications (both uplink and downlink) are managed by the ChirpStack272727www.chirpstack.io Open-Source LoRaWAN Network Server Stack hosted in the ATCLL core. Uplink frames are provided via the HTTP integration to a NodeJS microservice that forwards them to the cloud, which decodes them and returns the measurements for inclusion in the data platform. Downlink payloads are received by another NodeJS microservice that performs the necessary Network Server API interactions to enqueue them.
IV-C Vehicle-to-Vehicle and Vehicle-to-Infrastructure
One approach for \acv2v and \acv2i communication is performed using IEEE 802.11p (WAVE), supporting the ITS-G5 communication standard. This implementation uses PC Engines APUs running a standard Linux distribution; therefore, we developed an additional kernel patch to allow these entities to access necessary \acsocb features, making it possible to communicate correctly in the desired frequency range following the ITS-G5 communication standard. Notice that 5G communication is also used, and that, additionally, 2 nodes already communicate through C-V2X.
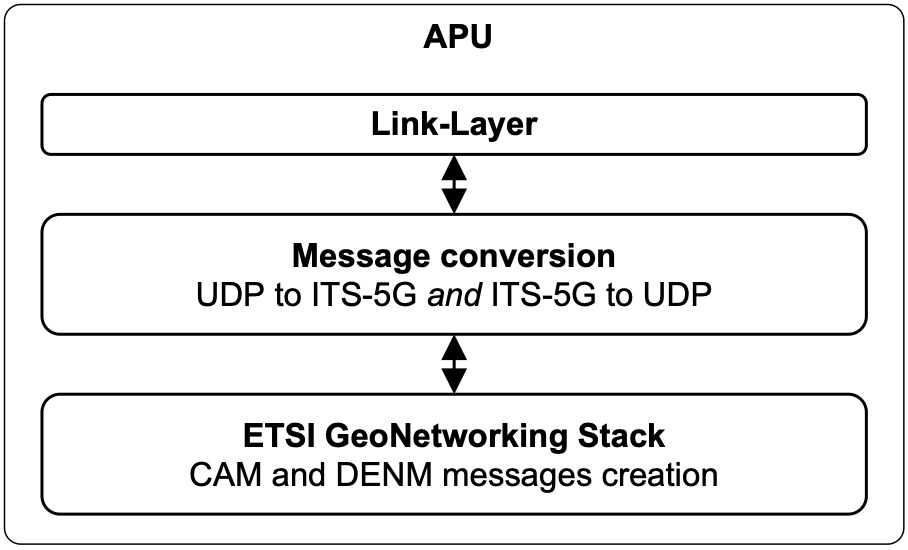
In order to have information about the surroundings of each node and current network topology, both \acpobu and \acprsu need to announce themselves in the correct frequency channel. This announcement is made with \acpcam sent in broadcast to every neighboring station. These messages are periodic and contain information related to the position, speed, heading, and status of the sender entity. When an application detects relevant traffic events (e.g. accidents, dangerous end of the queue, emergency vehicle approaching), it can send \acpdenm. The event can be characterized by an event type, a position, a detection time, and a time duration. The main goal of \acdenm transmission is to alert road users about that event.
The creation of these messages is performed in layer 2 and is done using a GeoNetworking library [18] that also includes an ASN.1 UPER encoder. An additional link-layer entity was developed, transforming simple messages (UDP) to standardized messages (ITS-G5), and performing also the opposite message transformation, as shown in Figure 7.
In order to provide Internet to the users using the WiFi \acap in the \acpobu, a connection manager is responsible for choosing in real-time the best ITS-G5 \acpoa to assure IP connectivity between the \acobu and the infrastructure. Thus, it needs to determine if there is any ITS-G5 \acpoa available to decide if it should be used or a cellular technology instead (4G or 5G). In the case of one or multiple ITS-G5 \acppoa in its communication range, it needs to determine which one should be used.
Several network connection management solutions have been proposed in the literature. However, most of them do not consider high-mobility scenarios. In [19] it was proposed a \acvcm, which can operate in high-mobility, making the best decision possible for the connection selection based on different metrics such as speed, location, \acrssi, and the expected contact time. Based on this work, the authors in [20] presented an upgraded approach. Besides taking into account the same base metrics as the previous work, which only chooses the best network available at a specific instant, this new approach proposes a predictive connection manager that can decide, in advance, the best network and technology for the attachment.
A straightforward implementation of the connection manager is to establish a connection to the \acpoa that presents the best \acrssi, and settle some thresholds to determine when it should consider changing to another \acpoa with a better \acrssi level or not. A more efficient version from the previous mechanism is to add the GPS position and heading from the vehicle. This avoids connecting to an \acrsu that, besides having the best \acrssi currently, is located on the other side of the road, so the \acrssi would decrease rapidly while driving in the opposite direction. Such solution is the one that is currently implemented in the \acatcll network, with the addition that it is capable of changing between an ITS-G5 and 5G connection when there are no \acprsu in the surroundings of the vehicle. Current work addresses the improvement of this mechanism, considering other metrics and \acsdn capabilities in the network.
IV-D Software Defined Vehicular Network
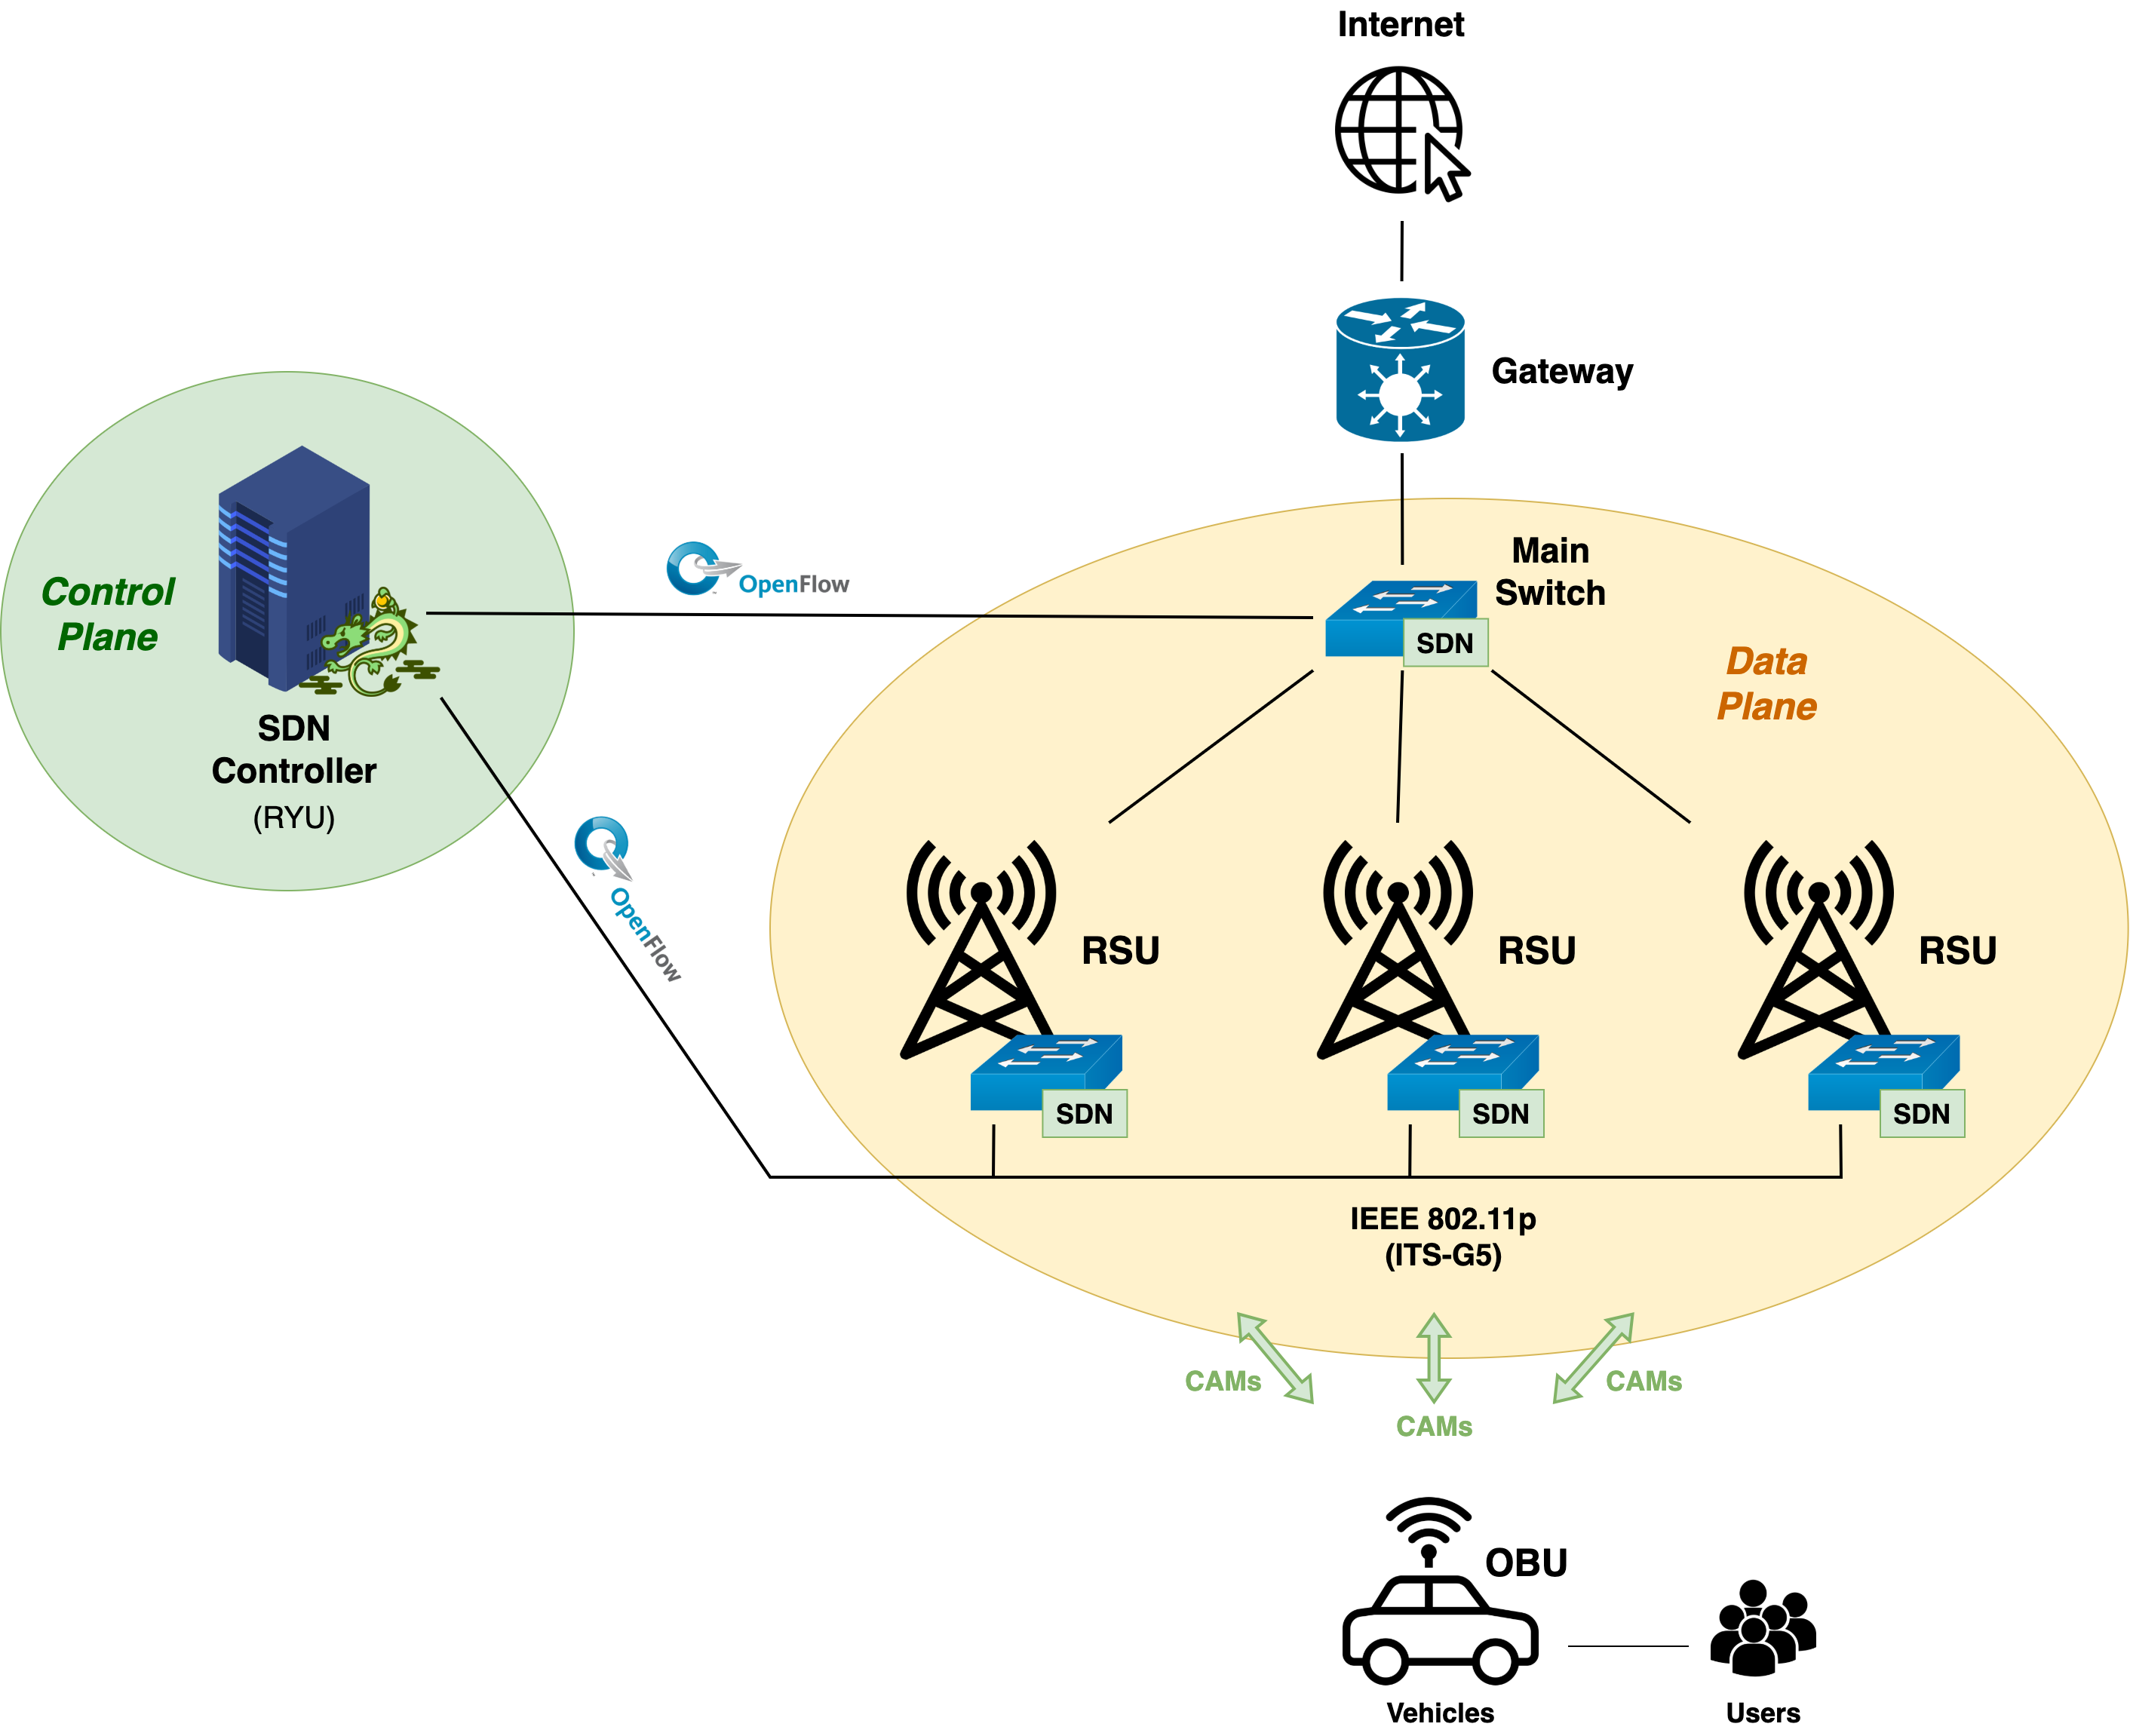
The \acsdn solution implementing the vehicular network is based on an architecture with proactive mobility detection, where the handover is detected before it happens, even if there is no traffic. For this purpose, the \acprsu themselves are part of the \acsdn topology by also being \acsdn switches. This way \acprsu can communicate to the controller signalling information concerning the nearby moving elements.
To offer proactiveness in the handover process, the most suitable class of messages are \acpcam because they carry signalling information such as location, heading, speed and type of vehicle. This information is very relevant in the controller because it allows it to have an idea of the movement of the \acpobu, thus allowing the prediction of handovers even before they happen. Figure 8 depicts the architecture [21].
A custom protocol (OBUInfo) was introduced whose ethertype number is 0xBBBB (which is not assigned by the IEEE 802 standard). The protocol was developed to be able to differentiate between custom OBUInfo messages (containing the contents of \accam messages plus the \acrssi forwarded by the \acprsu), which represents control traffic, from IP packets that represent data traffic. Therefore, the controller can separate both, so there is no need to send control messages within data traffic. The algorithm running in the controller which selects the preferable \acrsu to communicate with the \acobu is based on the same conditions used in the connection manager described in the previous subsection.
IV-E People-to-Infrastructure
p2p and \acp2i communication is performed using an ITS station supporting communication technologies, such as WiFi or cellular technologies, including LTE and 5G. This implementation uses smartphones. The choice of the smartphone is motivated by its ubiquity, high programmability, and reduced cost compared to other solutions. We developed an additional application to allow the \acpvru to communicate with the infrastructure, making it possible for \acpvru to communicate information about them and receive notifications from the infrastructure about potentially dangerous situations (e.g., potential crashes).
The information obtained from the ITS station allows the announcement of the necessary awareness information about \acvru — location, altitude, heading and speed, but also orientation, direction, size and weight class and \acvru profile. To obtain this information set, the information from the smartphone from inertial sensors (accelerometer, gyroscope, magnetometer, and orientation sensors), from the cellular signal strength and WiFi, Bluetooth information and GNSS/GPS sensor is fused using the Fused Sensor Provider API from Google282828https://developers.google.com/location-context/fused-location-provider. The announcement of this awareness information is made with \acpvam sent by the smartphones. Similar to \acpcam, the creation of these messages is done using an ASN.1 UPER encoder, and they are transmitted to the infrastructure through access technologies, namely WiFi, LTE and 5G.
The developed application integrated with the sensors makes the smartphone an ITS station capable of similar basic functionalities of an \acobu. By obtaining and processing the necessary information to generate periodic messages to make the vehicular network aware of the vehicle and its essential information — such as location — the smartphone can act as a low-cost \acobu. The developed application predicts this situation by changing the station type of the produced message to a vehicle if it detects that the speed of the smartphone is not compatible with a \acvru walking.
Finally, the infrastructure is capable of delivering Internet access to people throughout the city. The \acprsu also have a WiFi link that behaves like a typical \acap providing internet access to the users directly connected to them.
V Computing/Edge Approach
This section presents the edge approach for data computation and the multi-sensor data fusion and detection.
V-A Edge support
Every edge point has available, apart from the communication equipment, an Nvidia Jetson Nano or Jetson Xavier with a powerful GPU for graphic-intensive processing, and a Raspberry Pi 4 for the deployment of lightweight services. This edge computing capacity is leveraged to maintain several data collection and processing services running on the different \acpsbc installed at each edge node. Some examples include:
-
•
Decoding and parsing of the traffic radar message protocol;
-
•
Real-time CUDA-assisted object detection in a video stream (detection of different vehicles, people and objects visualized through video cameras);
-
•
Decoding and parsing of ETSI ITS information in \accam and \acdenm messages, and interactions with kernel subsystems to ascertain the respective \acrssi;
-
•
Periodic calculation of vehicle counts and velocity averages for different types of vehicles within specified time frames (separate process for traffic radar, video cameras and \accam data);
-
•
Data fusion processing using traffic radar, video cameras CAM data.
Current resource utilization metrics and load averages show that there is sufficient headroom for plentiful future additions. Given that some services must consume the data produced by others in order to work, a comprehensive solution for publishing and accessing data is crucial to ensure the effectiveness of the edge computing architecture, while minimizing resource consumption overhead and latency for timing-sensitive workloads.
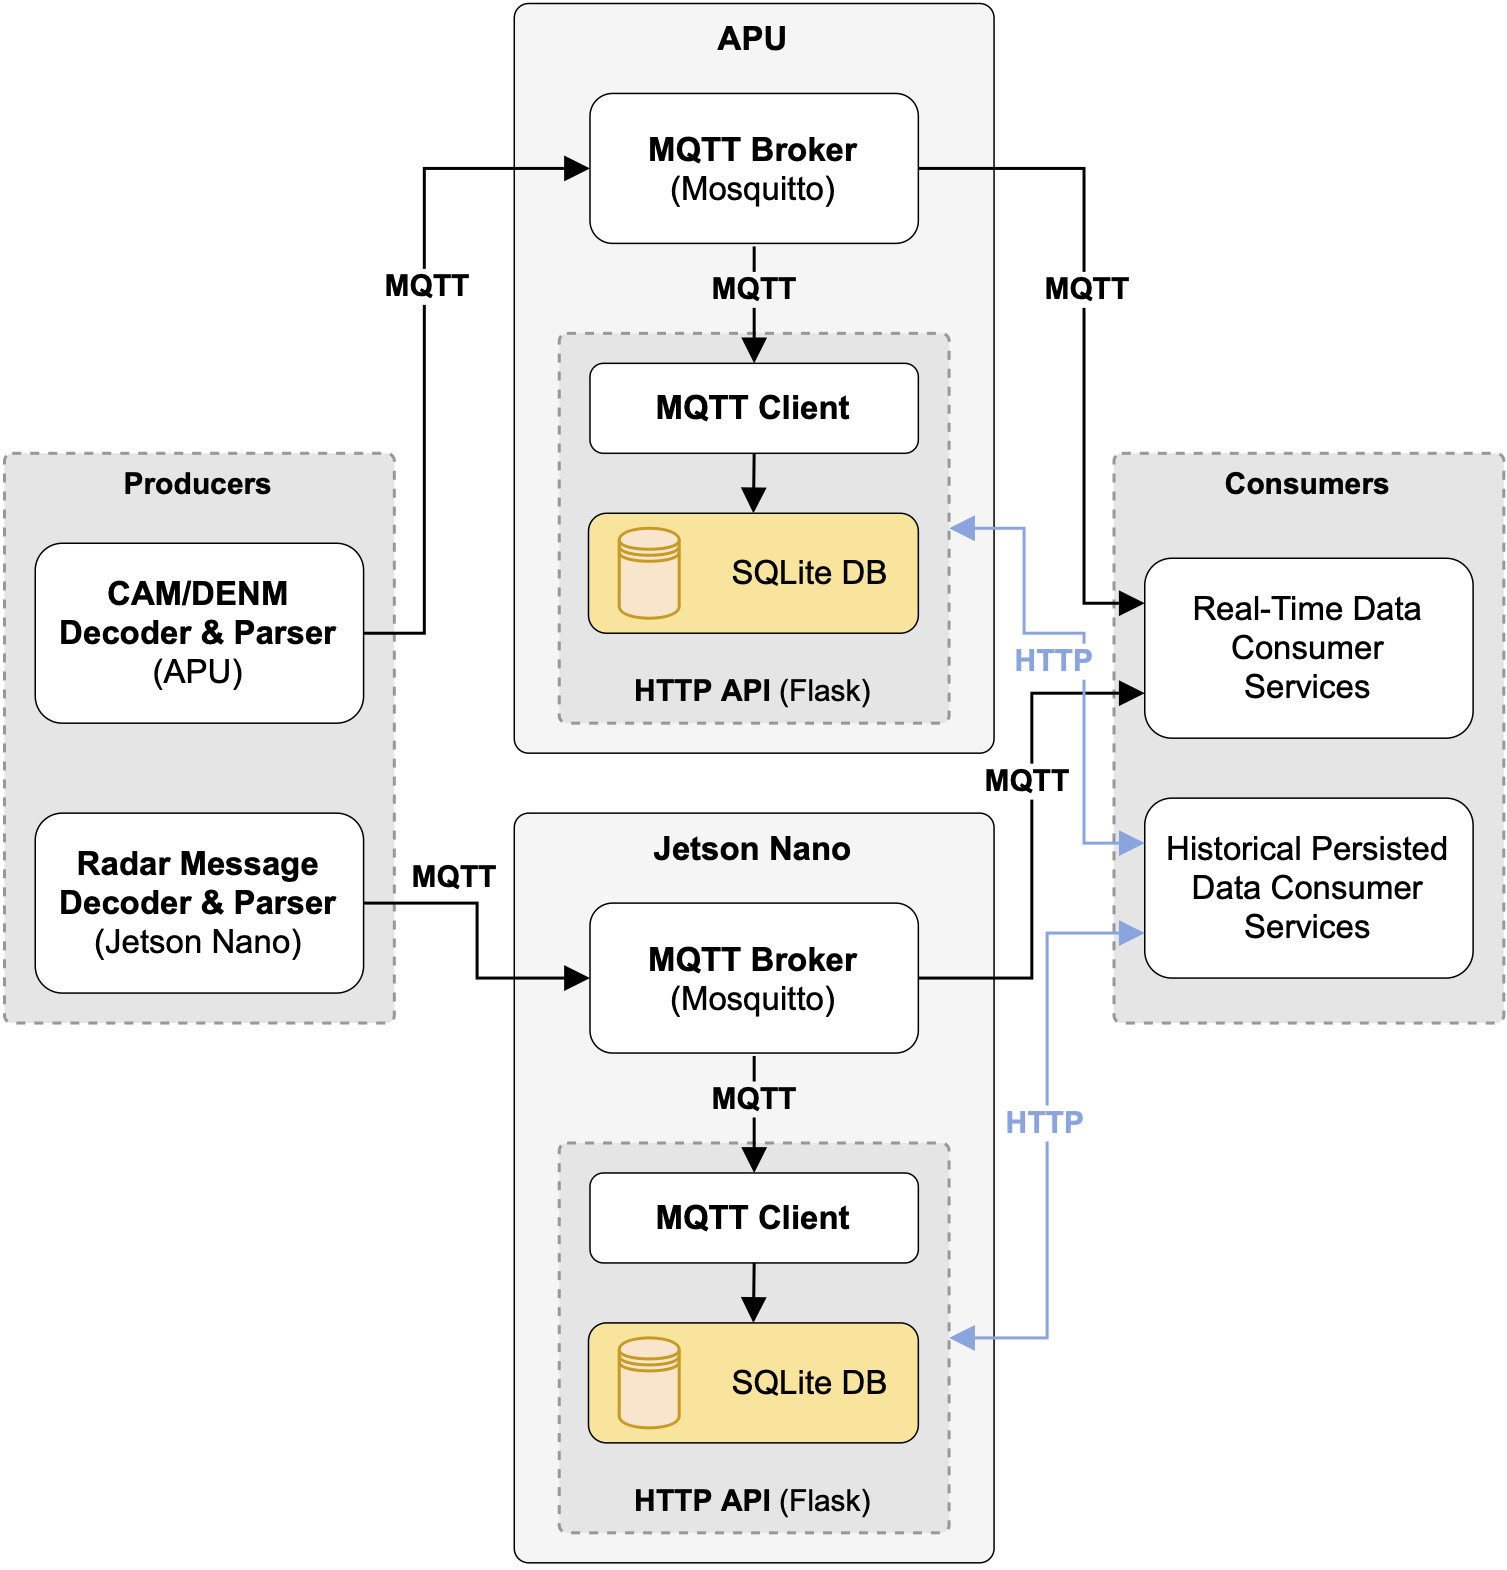
Two separate types of data access are supported (the edge strategy for data access is depicted in Figure 9):
-
•
Real-time information stream - Each edge node hosts a Mosquitto \acmqtt broker to be used by all the equipment and services installed on that particular node. As such, a publisher/subscriber model is used, where producers publish new data points to specified topics, and consumers subscribe to the relevant topics and process each new message;
-
•
Persisted historical information - Each edge node also hosts an SQLite database configured to persist the real-time data published to a specified list of \acmqtt topics for a short time period (with a default value of 24 hours). This functionality is aimed for data processing services which require complex queries and a complete history of relevant data-points, such as data fusion algorithms. Access to the persisted information is achieved through the use of a REST API developed for this purpose, since SQLite does not natively support multiple concurrent connections. The choice of SQLite as \acdbms over other more feature-rich alternatives is focused on limiting excessive resource overhead. Several \acsdbms-specific optimizations were configured in order to greatly reduce read and write times.
Additionally, a separate centralized \acmqtt broker instance running in the cloud serves as an \acmqtt bridge between the individual edge node brokers and any cloud services, dashboards, and frontend UIs that also require access to real-time edge data (albeit with slightly increased latency when compared with edge consumers closer to their respective data sources). This is depicted in Figure 10.
V-B Automated Deployment
Deploying applications to an infrastructure of this size and complexity presents a number of challenges relating to automation and dependency management, among others. These types of deployments can become increasingly harder to manage and maintain, given the high number of nodes and the fact that they are heterogeneous in terms of system architecture, operating system version, and other factors. Moreover, dependency version incompatibilities may occur between services that run on the same compute node.
To address these issues, applications are deployed as Docker containers, which package the application code with all of its dependencies and isolate them from the rest of the system. Using this approach, applications can be easily deployed on any Docker-enabled machine in either the cloud or the edge, while maintaining low levels of virtualisation overhead. This also greatly simplifies the deployment process for any third-party services that use the infrastructure.
Alternatively, in cases where a transition to a containerised environment has not yet been completed or has been found to be unfeasible, applications can also be deployed as more traditional services. This type of deployment uses Ansible playbooks to ensure a reliable, automated process which includes the installation of the required dependencies, and can be run concurrently on multiple target nodes.
Additionally, the project also leverages CI/CD methodologies and the Gitlab platform in order to automatically deploy updated versions of an application to the respective compute nodes each time a new commit is published to specified production branches. This process includes the automated building of Docker image variants for each CPU architecture (x64, armv8, armhf) using Docker BuildX and QEMU.
Current work addresses the possible integration of this infrastructure with a more advanced service orchestration framework such as Kubernetes.
V-C Multi-sensor fusion and detection
Vehicles, bicycles, boats, people and other objects can be detected by multiple sources. The usage of several data sources improves the reliability by eliminating the dependency on just one type of sensor.
Information about vehicles can come from vehicles OBUs, while information about people can come from their smartphones. In addition, both vehicles and people, and also bicycles, boats and other objects can be detected through video-cameras, traffic radars, LiDAR and the analysis of the electromagnetic spectrum.
Video-cameras are scattered throughout the city. Using a video camera and a Nvidia Jetson, a detection process of objects can be implemented. It starts by creating a \acrtsp stream, established to transmit the most recent frame, with the camera integrated in the Smart Lamp Posts. During this process, in order to detect the pedestrians effectively, each time the Jetson device is not already busy processing a frame, it fetches the most recent frame from an internal queue, and then applies a set of object detection functions based on a deep learning approach — by using a pre-trained YoloV3 Model292929https://pjreddie.com/darknet/yolo/ or the Nvidia DeepStream SDK Object Detector303030https://developer.nvidia.com/deepstream-sdk. Both models are optimized to the Nvidia Jetson hardware — the DeepStream SDK being created specifically for the Jetson device, and the YOLOv3 with the usage of the module TensorRT313131https://developer.nvidia.com/tensorrt, also from Nvidia. Then, at the end of each cycle, the result is published in the edge \acmqtt broker, indicating the presence of at least one object, such as pedestrians, vehicles, bicycles, etc.
As mentioned, Smart Lamp Posts contain traffic radars323232https://www.smartmicro.com/ that detect and track objects. This type of radar gives information about position, direction, speed and type of vehicle (classification in light vehicles, heavy vehicles and motorcycles/bicycles) of each detected vehicle. All this information is sent to the Nvidia Jetson that receives, decodes and publishes the data on a \acmqtt broker, following the edge data strategy described in the previous subsection. With this information it is possible, in real time, to display the traffic situation, send messages to neighbouring \acprsu with traffic information, and make statistic reports: at what time there are peaks of traffic, what are the types of vehicles that circulate in this area, and what is the average velocity and acceleration of those vehicles.
The level of accuracy of the traffic radar to detect the type of vehicle is around 80%, and its intrinsic restriction of not being able to differentiate smaller objects (people, bicycles, and motorcycles), limit the applicability of this sensor for some use cases. In order to cover such type of detection, the \acatcll infrastructure also has LiDAR sensors attached to the Smart Lamp Posts. LiDAR has a much higher resolution, allowing to obtain better results in terms of location and classification of vehicles. However, the amount of data produced by the sensor, due to the creation of point clouds, means that the output data rate is much higher in comparison to the traffic radar (around 6500 times higher). The usage of the LiDAR for this application is one more example of the importance of the edge processing. By processing the point clouds closer to the sensor avoids a large occupation of the network channel, in comparison to if the data would be processed exclusively in the core. Instead, the core consumes the output metadata of the edge processing, also following the edge data strategy described in the previous subsection.
Another alternative for the detection of objects, more specifically the detection of flows of people, is through smartphones and their connectivity - using a technique known as WiFi probing. The WiFi \acpap present in the Smart Lamp Posts and buildings can be turned into monitoring mode to be able to detect the different WiFi terminals around and infer the number of devices connected to WiFi. With this inference, it is possible to detect people carrying their own smartphones or other equivalent devices.
VI Data persistence, processing and sharing
VI-A Data persistence and processing
The main services used to manage and persist the data are the Processing server and the ClickHouse database. The Processing server is responsible for a preliminary processing before the data reaches Orion, more specifically finding the road segment of each received point, and then persisting it on the respective table, depending on the FIWARE-Service attribute and on the data type. For the persistence of the data collected through the sensors and communication devices in the infrastructure, \acatcll implements a \acdbms, ClickHouse. This database has native compression capabilities that can greatly decrease the databases’ size, while speeding up the analytical queries. The distributed configuration of ClickHouse is also considered straightforward. It is composed of clusters that have a configurable number of shards, independent groups of replicas that store and operate on a part of the stored data. In the current form of the data platform, a single ClickHouse shard is used. However, a cluster configuration is still deployed in order to achieve a greater availability and redundancy that can be obtained with replicas. Expanding the infrastructure and thus increasing the amount of data, the cluster size can be increased, adding a new shard with the same number of replicas.
VI-B Data sharing
The Orion Context Broker is accessible from the outside, which is highly configurable and of high performance. It allows both the reception of data into the platform, and also the distribution to the consumers in real time. Using a token-based security layer on top of the broker, managed by the Authentication server, the information is kept on the platform as consistent as possible, while only giving access to authorized entities.
On top of the real-time information being transported through the \acatcll platform, the Processing server has also available several public APIs intended to make the data available for the dashboard, as well as a historical API, secured by the token authentication method, that can be used to obtain persisted data from any service and type of any time interval.
Besides the public Orion broker, to keep the connection with the outside, we use two additional brokers on the platform. Firstly, we use Kafka333333https://kafka.apache.org/ to distribute all the real-time data that goes through the public broker inside the network. All the services inside the network that need to have the data in real time should use this Kafka broker in order to lighten the Orion load. The other one is a \acmqtt broker that serves as a bridge to all the edge devices, making available all the edge computing data in one internal place only, allowing central computing and cloud data persistence (Figure 10).
VII Results
This section presents two main types of results: (i) examples of data collected from the sensing and communication devices of the \acatcll infrastructure, (ii) and performance results.
VII-A Examples of data collected
The \acatcll dashboard is a key piece of the platform which enables the visualization of the collected data (in real-time and from historical records), geographically, and in plots for representation over time.
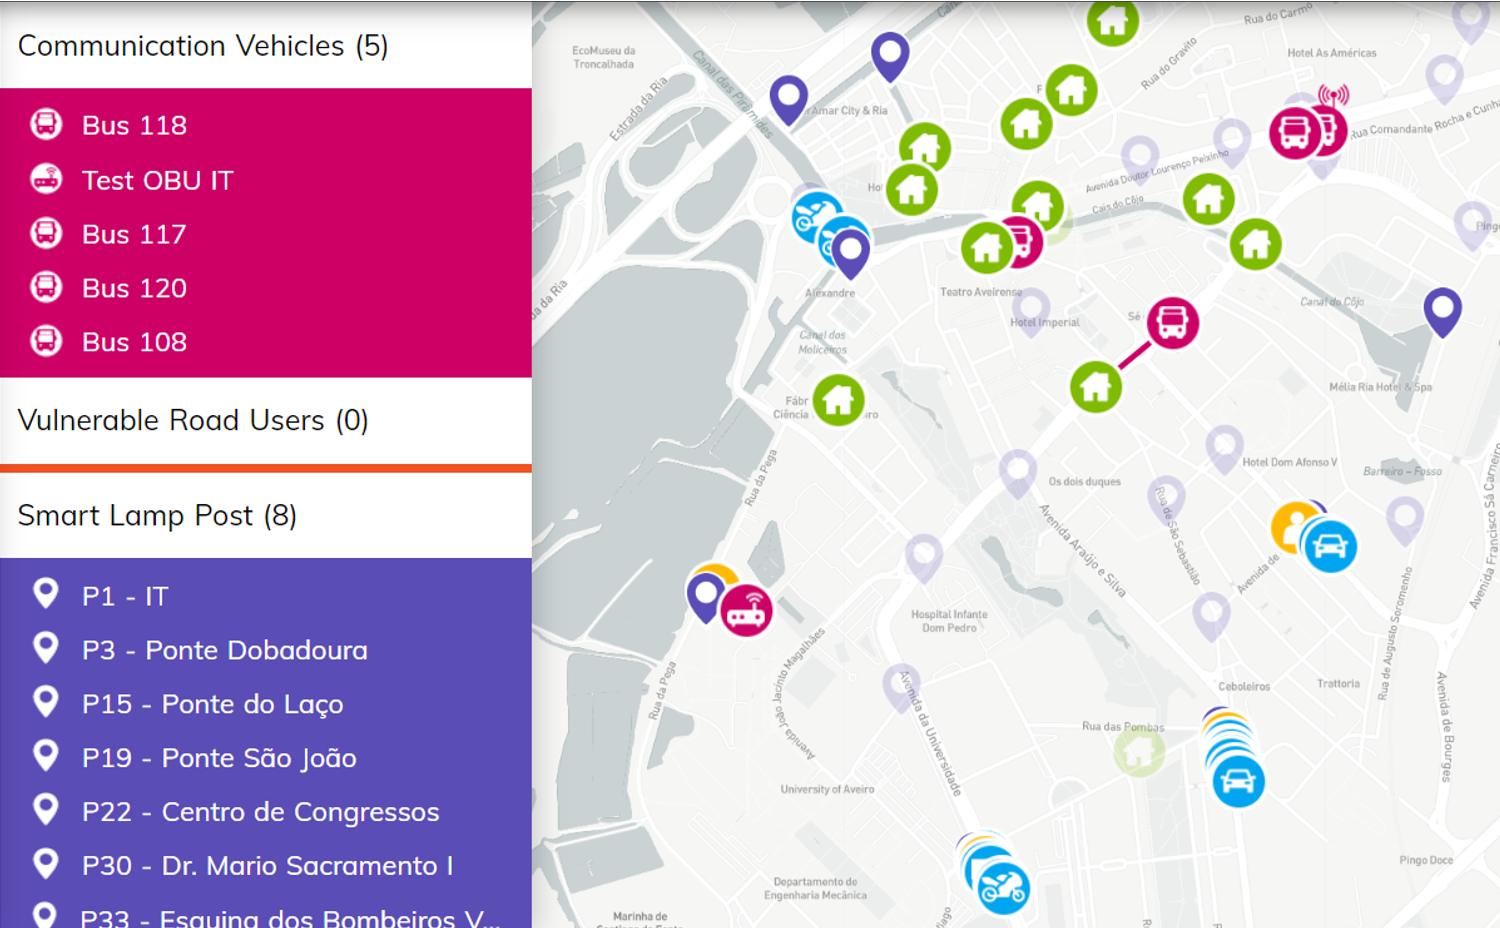
An example of the visualization of real-time data is depicted in Figure 11: the nodes in blue are vehicles detected by the traffic radar, which is able to distinguish three classes of objects as of light vehicles, heavy vehicles, and others including pedestrians and two-wheelers. The nodes in pink are detected by connectivity (\acv2x or cellular), where pink lines represent the active \acv2i connection between the vehicle and the respective \acprsu. In such an example, as depicted, it is possible to observe that various \acprsu were able to receive \acpcam transmitted by the same vehicle. Moreover, the yellow icons represent the detection of objects performed by a video camera, whose target can be of several types: pedestrians (as seen depicted in the figure), bicycles, motorbikes, cars, trucks, among others.
In the dashboard, the user is also able to choose the time ranges to visualize historical data. For instance, to visualize the data related to the number of vehicles that crossed a certain area in a period of time, the user may choose the traffic radar data.
VII-A1 Traffic radar
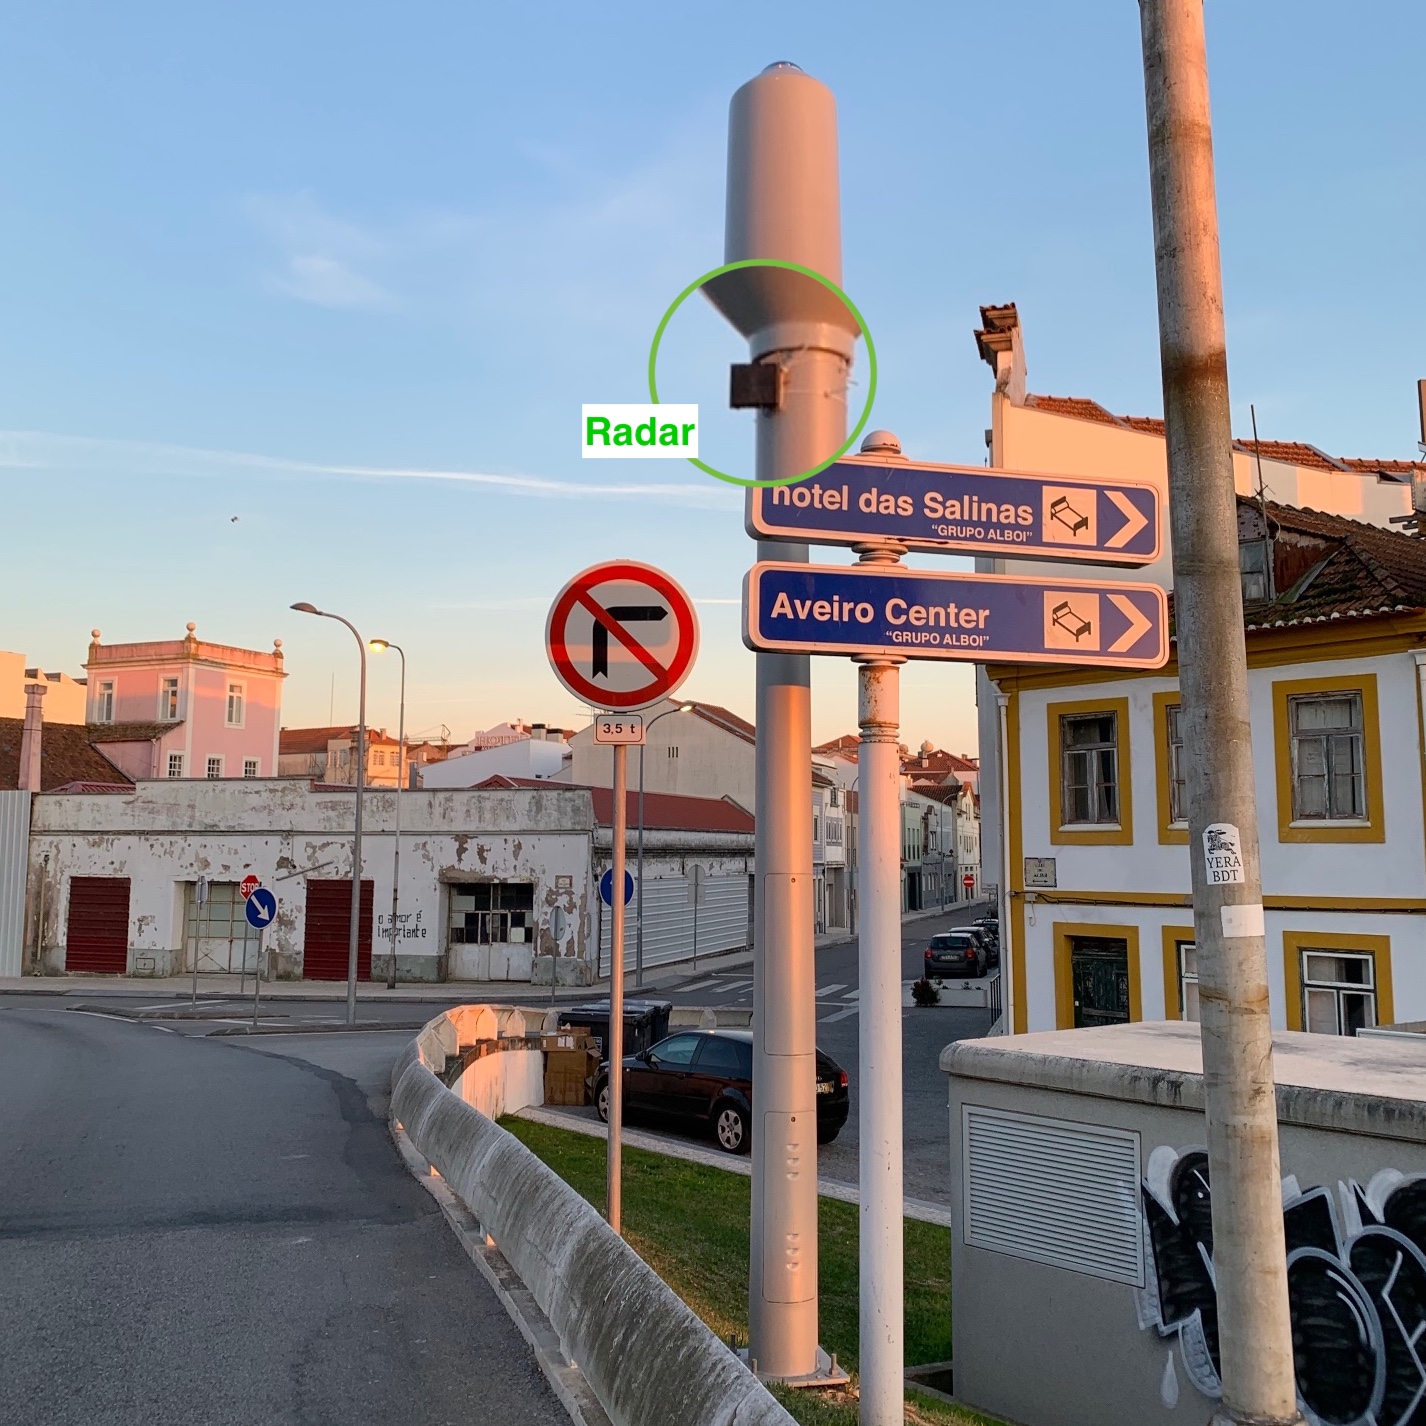
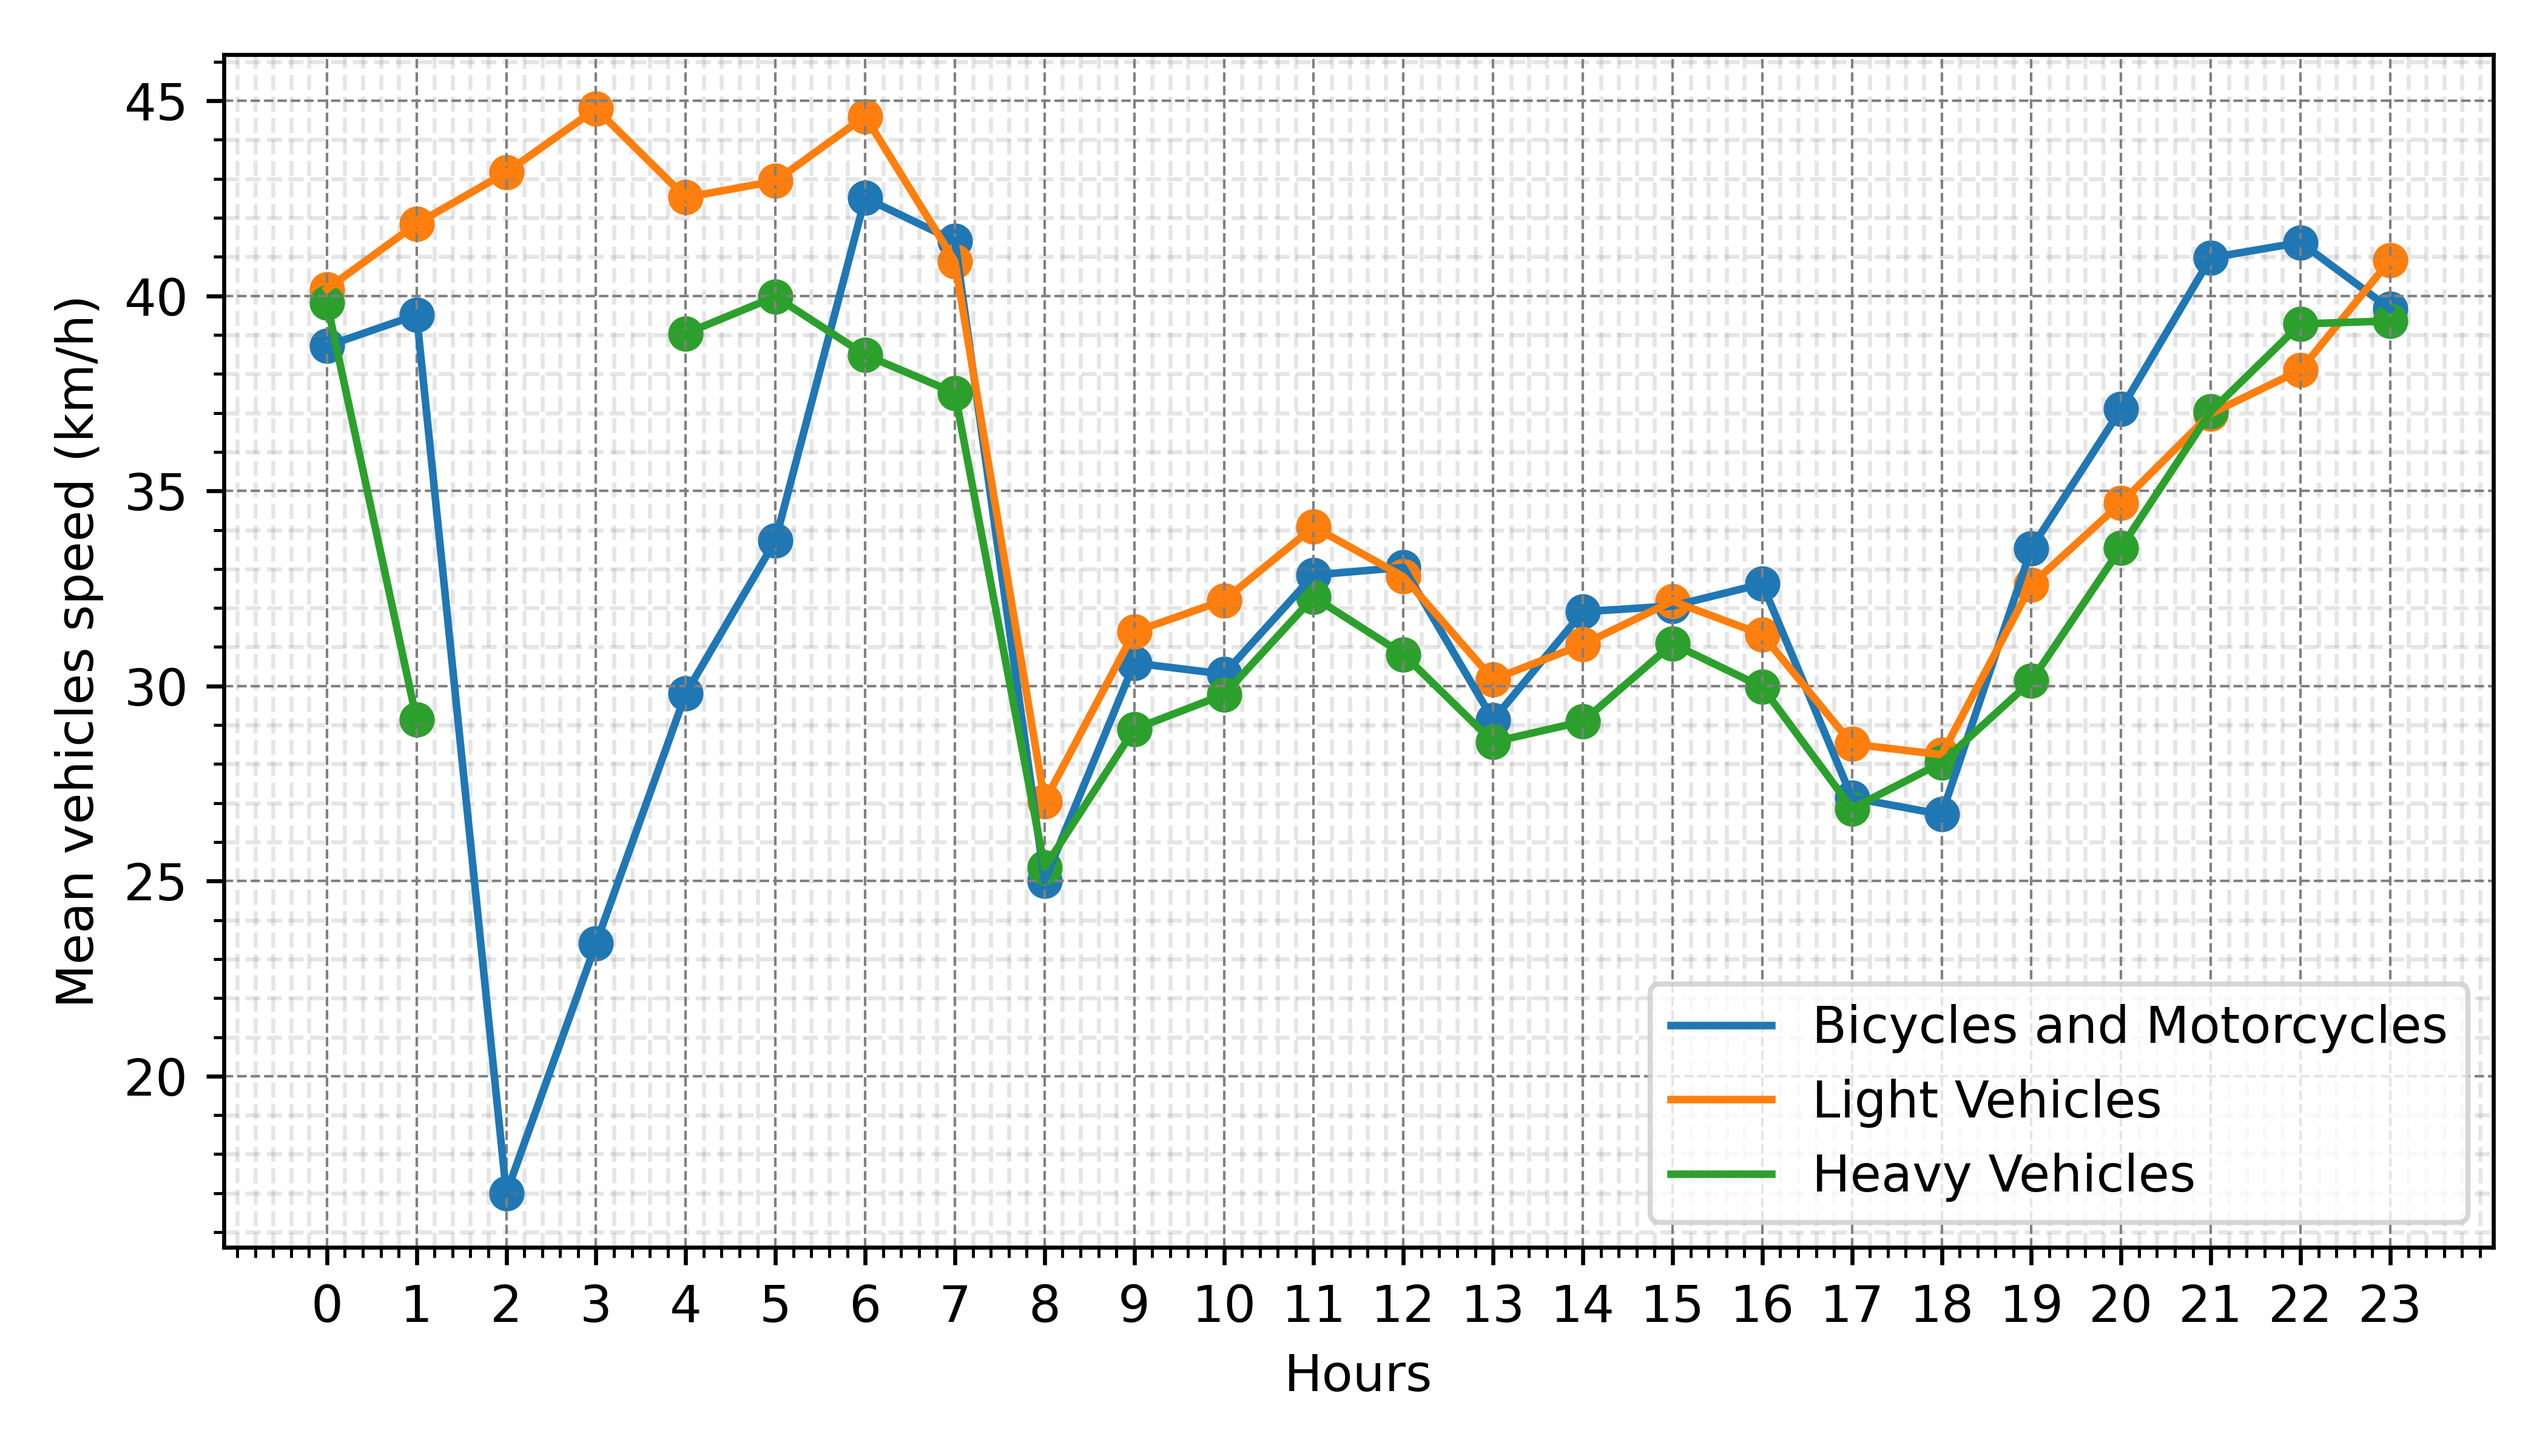
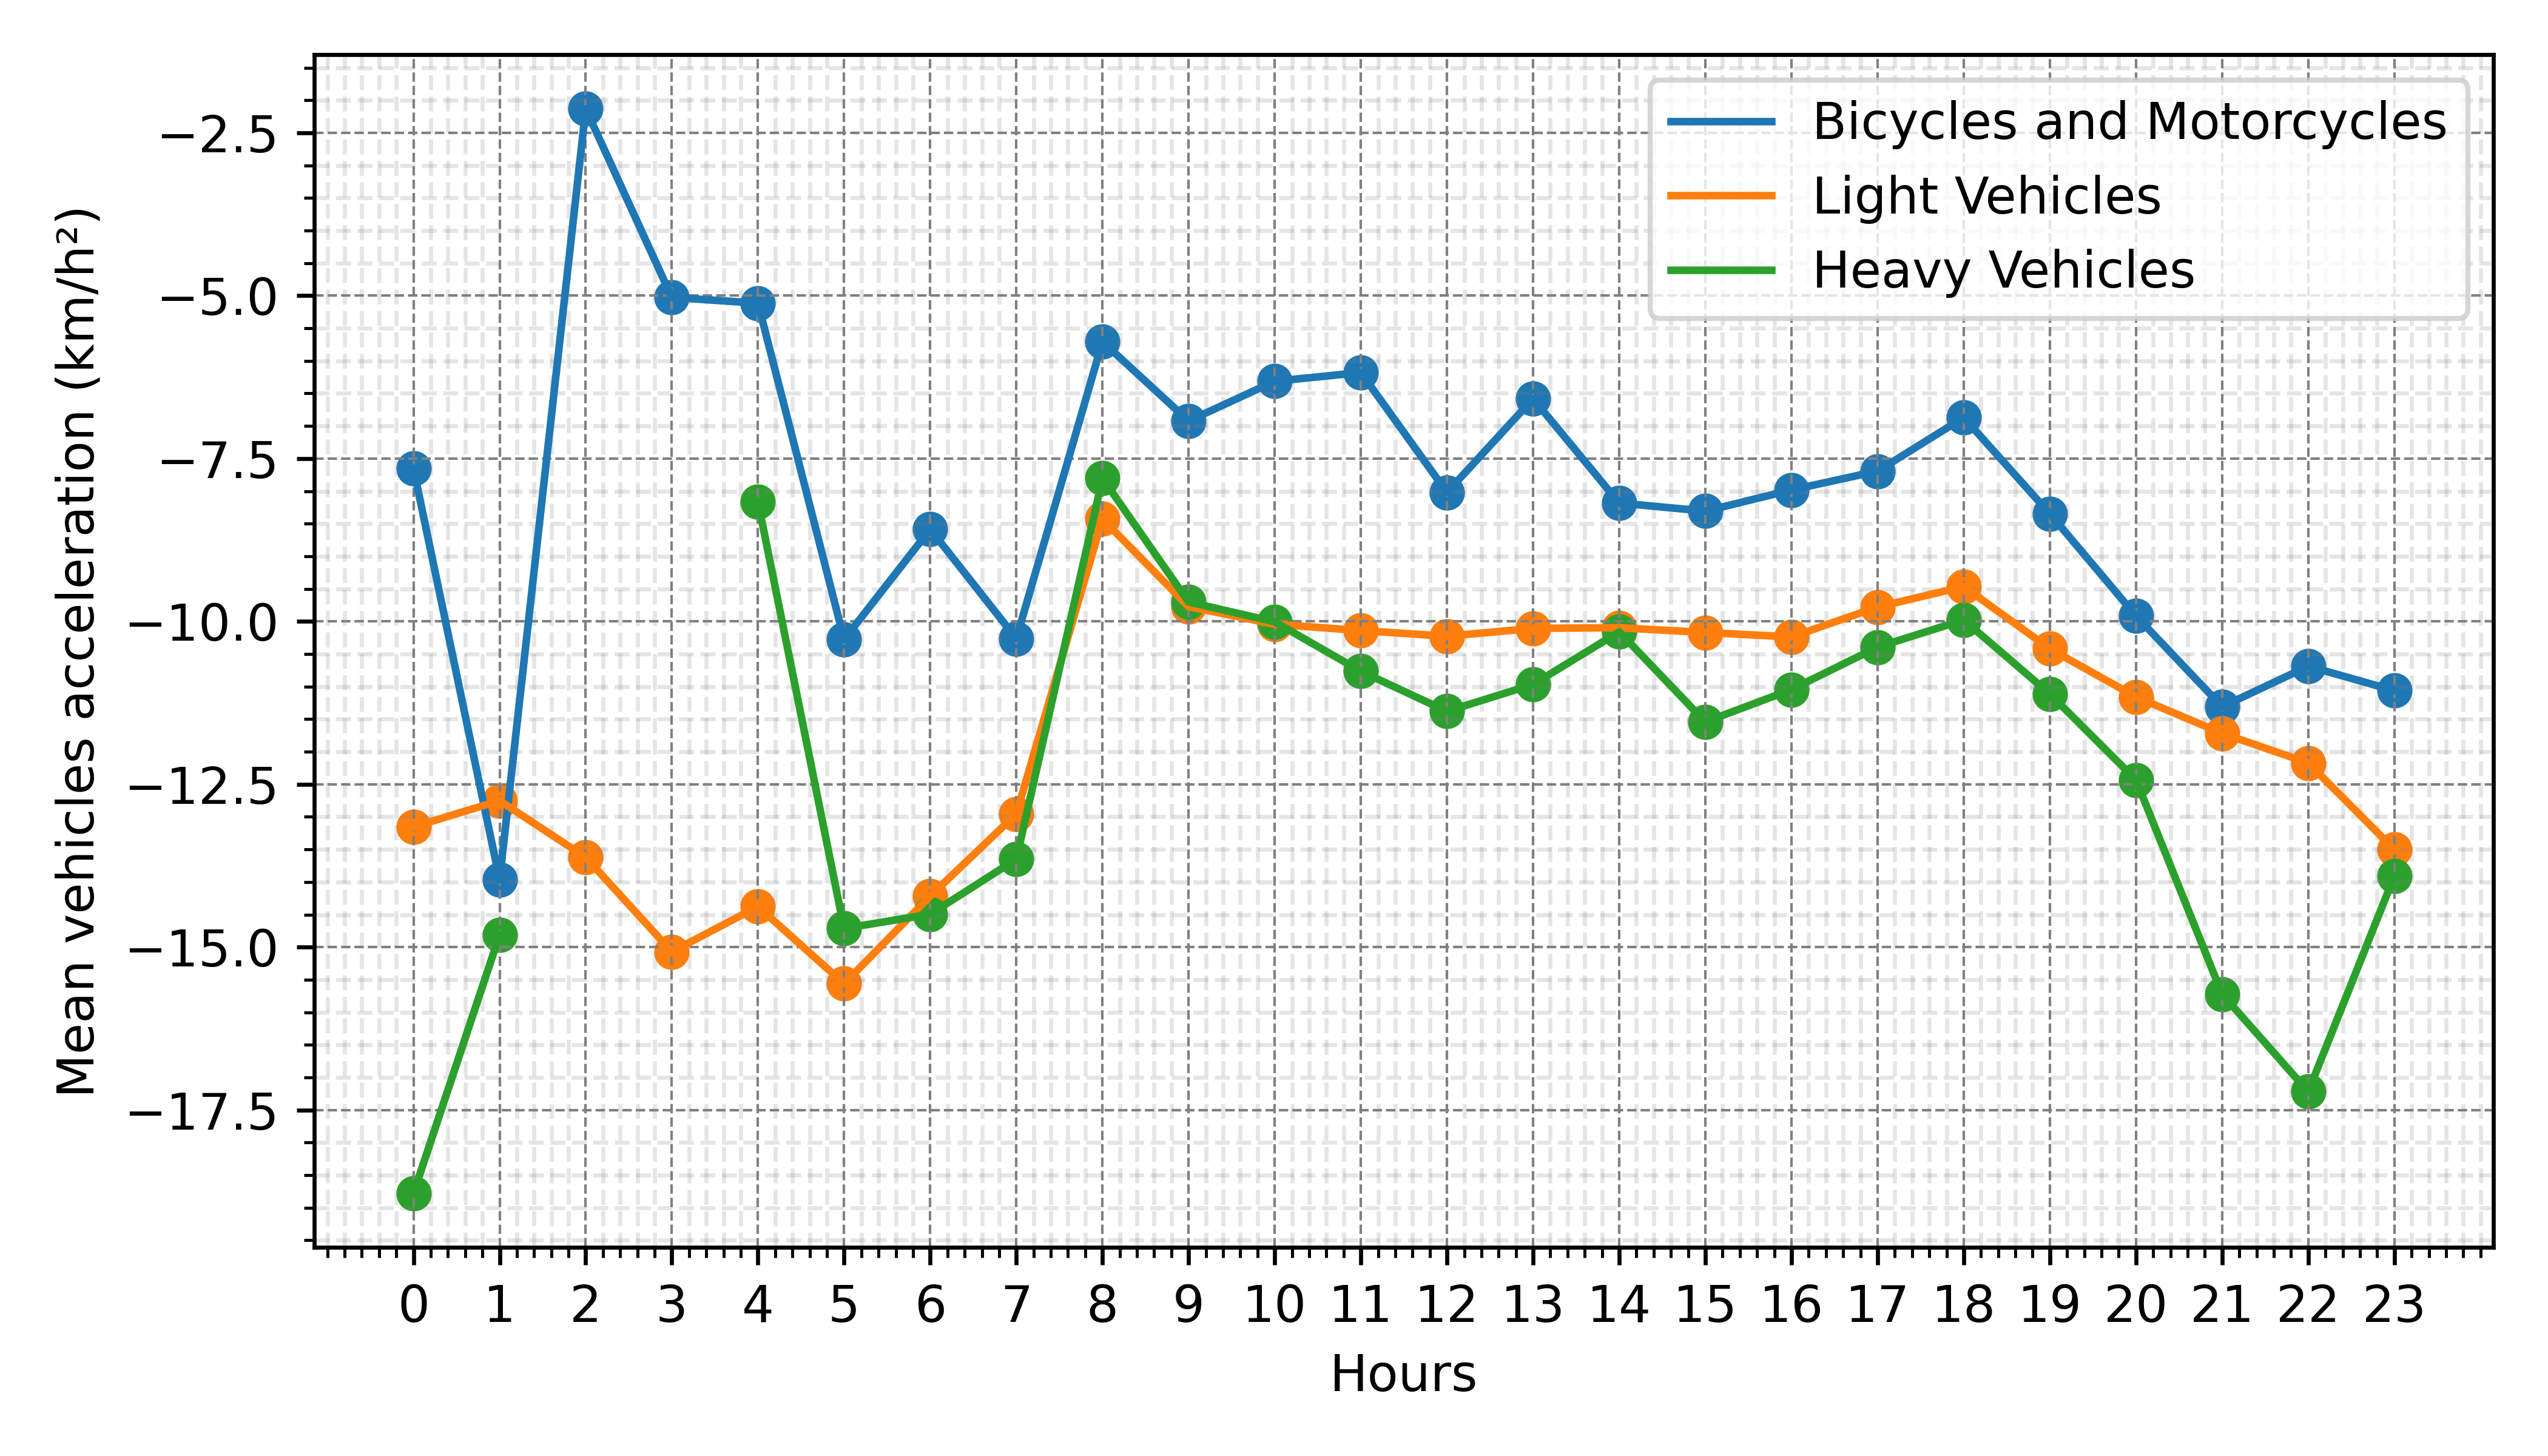
Traffic radars provide the information of the number and types of vehicles per time that cross a certain area, as well as their velocity and acceleration. Examples of radars are the ones installed in Dobadoura bridge (Figure 12) and in ISCA-UA (Figure 3). Figures 13 and 14 show the average number of vehicles that, in each hour, have crossed Dobadoura bridge and ISCA-UA, on the week between February 7th and February 11th, 2022. Figures 15 and 16 show the average speed and acceleration of vehicles which entered the city at ISCA-UA on the same time period.

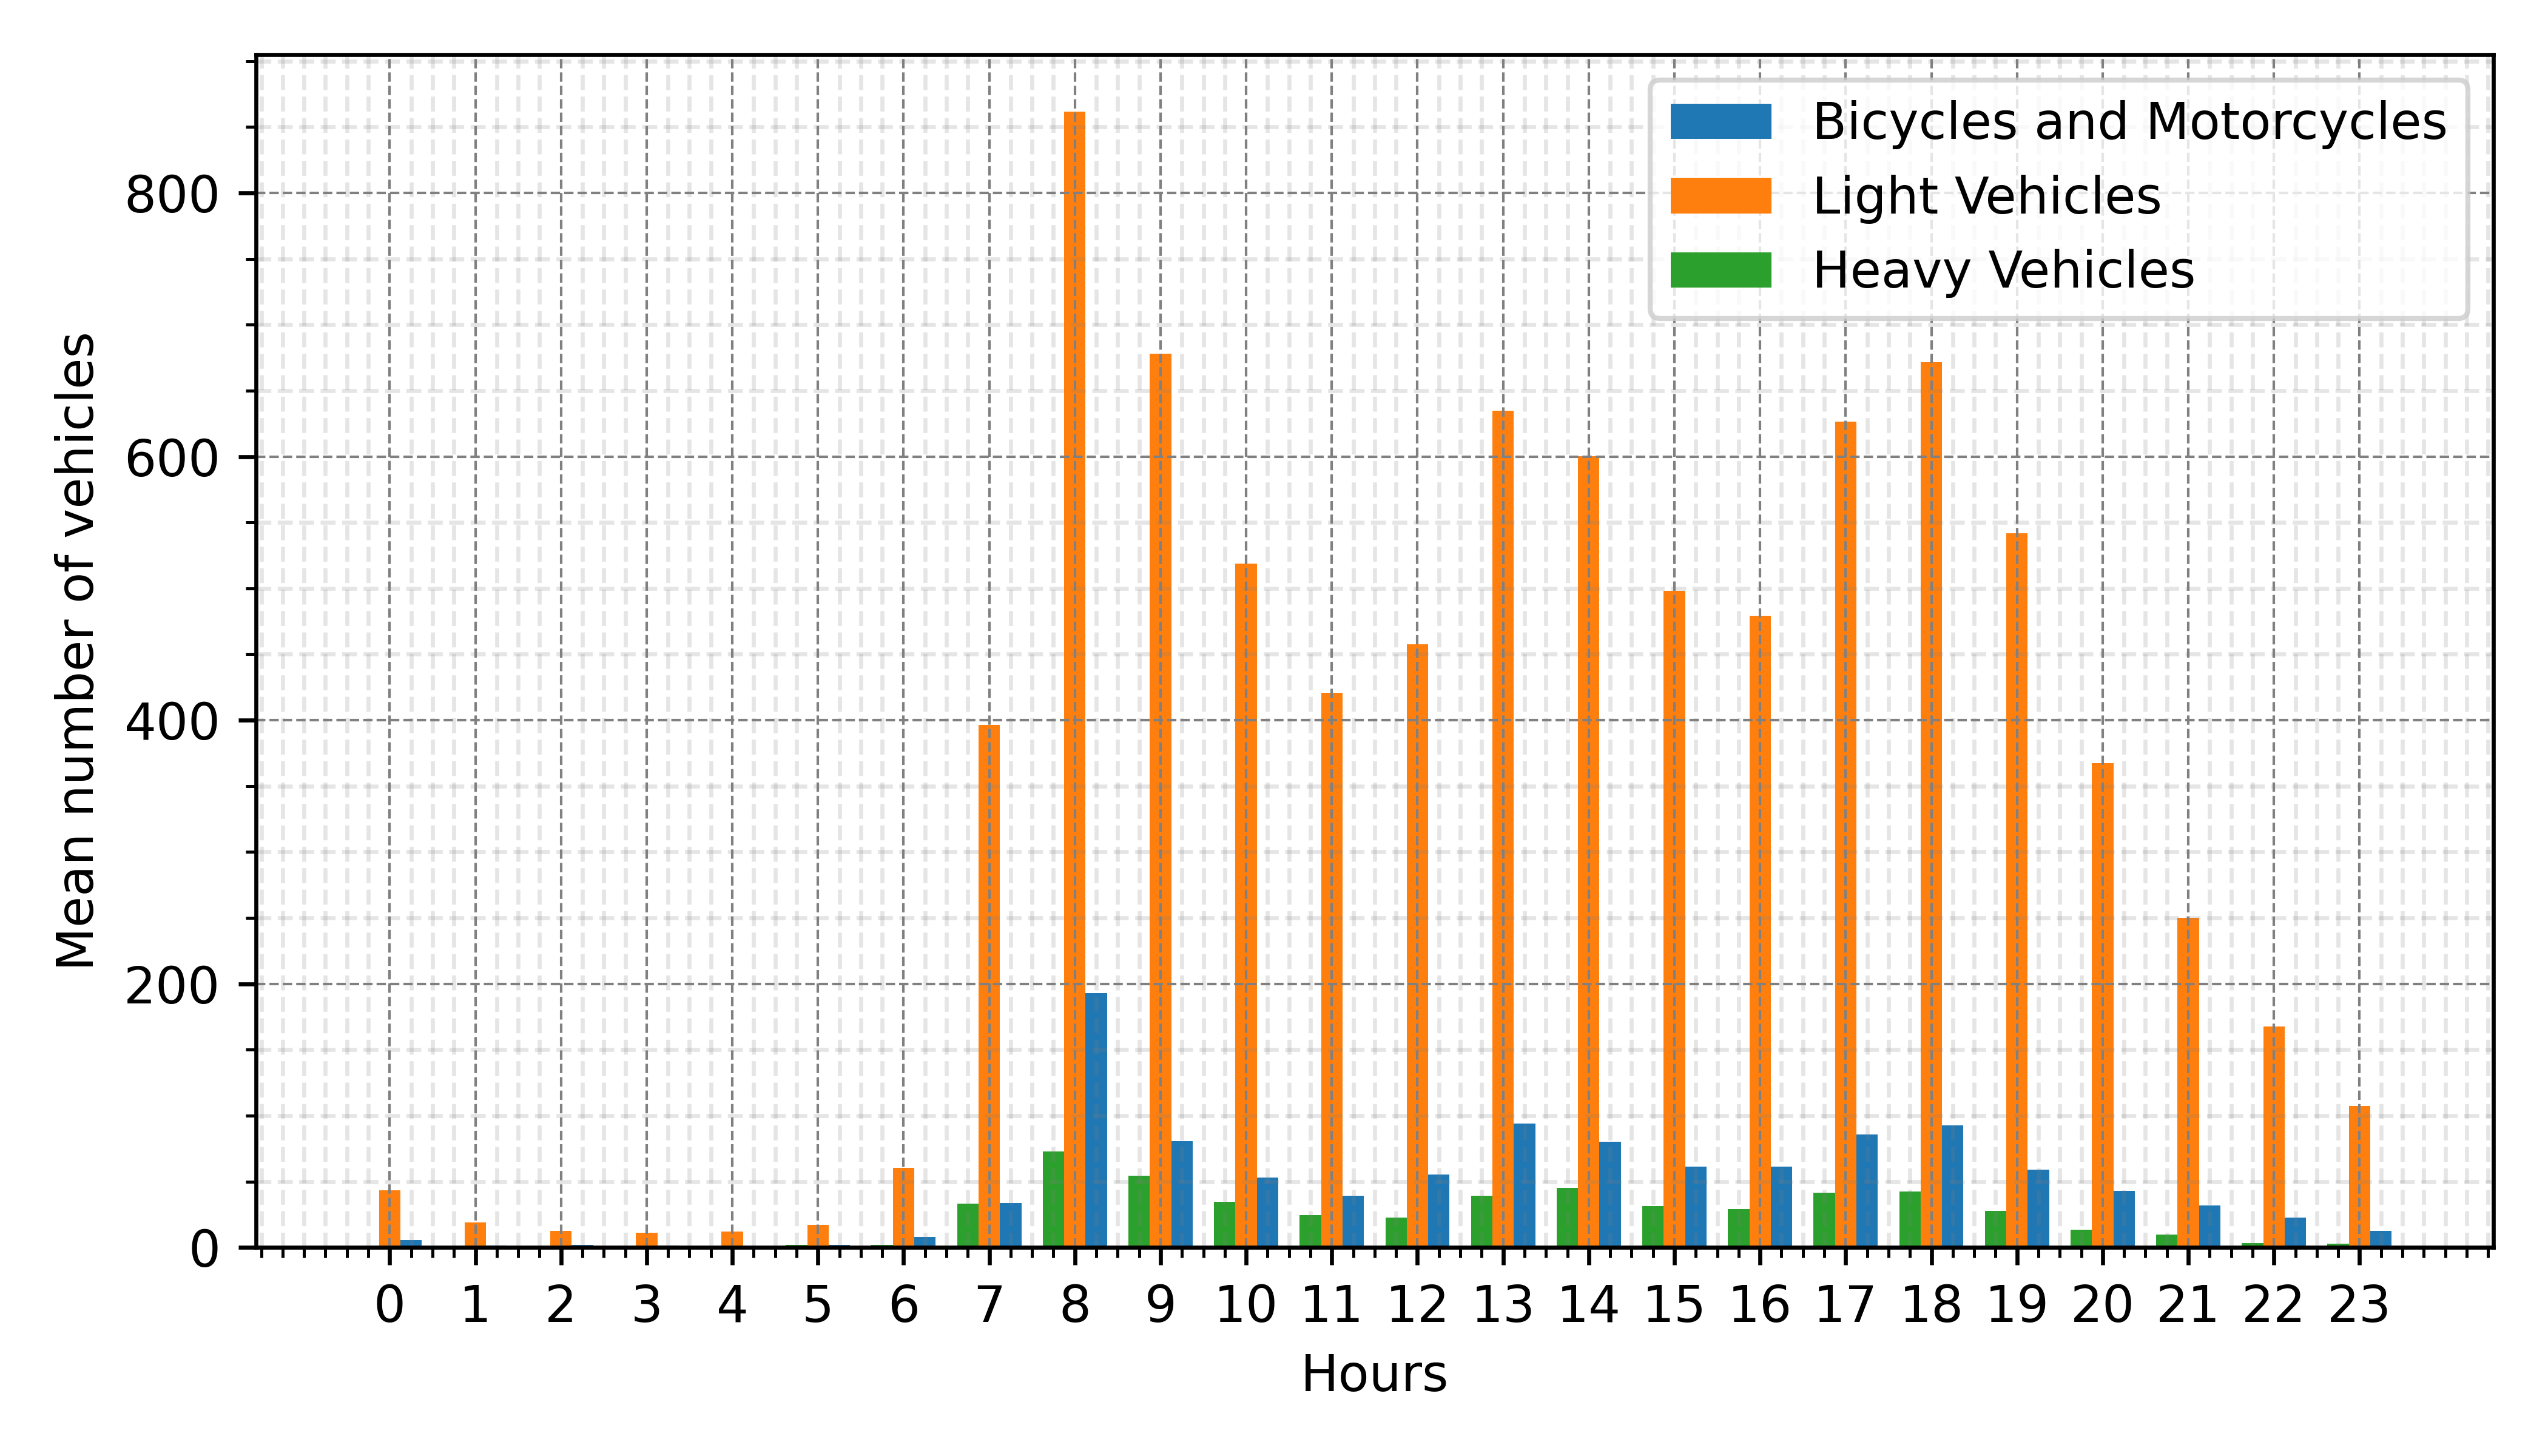
From this data, we can infer several aspects related to the city mobility. Comparing the number of light vehicles entering the city in Dobadoura bridge and ISCA-UA, we observe almost the double number of vehicles entering using the ISCA-UA access. Moreover, we see that the traffic peak time occurs at the same time for both locations, around 8am. Finally, it is possible to correlate the number of vehicles and their speed/acceleration: during daylight periods, as traffic congestion increases, one can observe a reduction in speed values, and a near-constant acceleration in arriving vehicles; on the other hand, in the night periods, no traffic congestion is noticed, leading to a higher variance of speed values, consequently causing oscillating acceleration values.
VII-A2 Camera
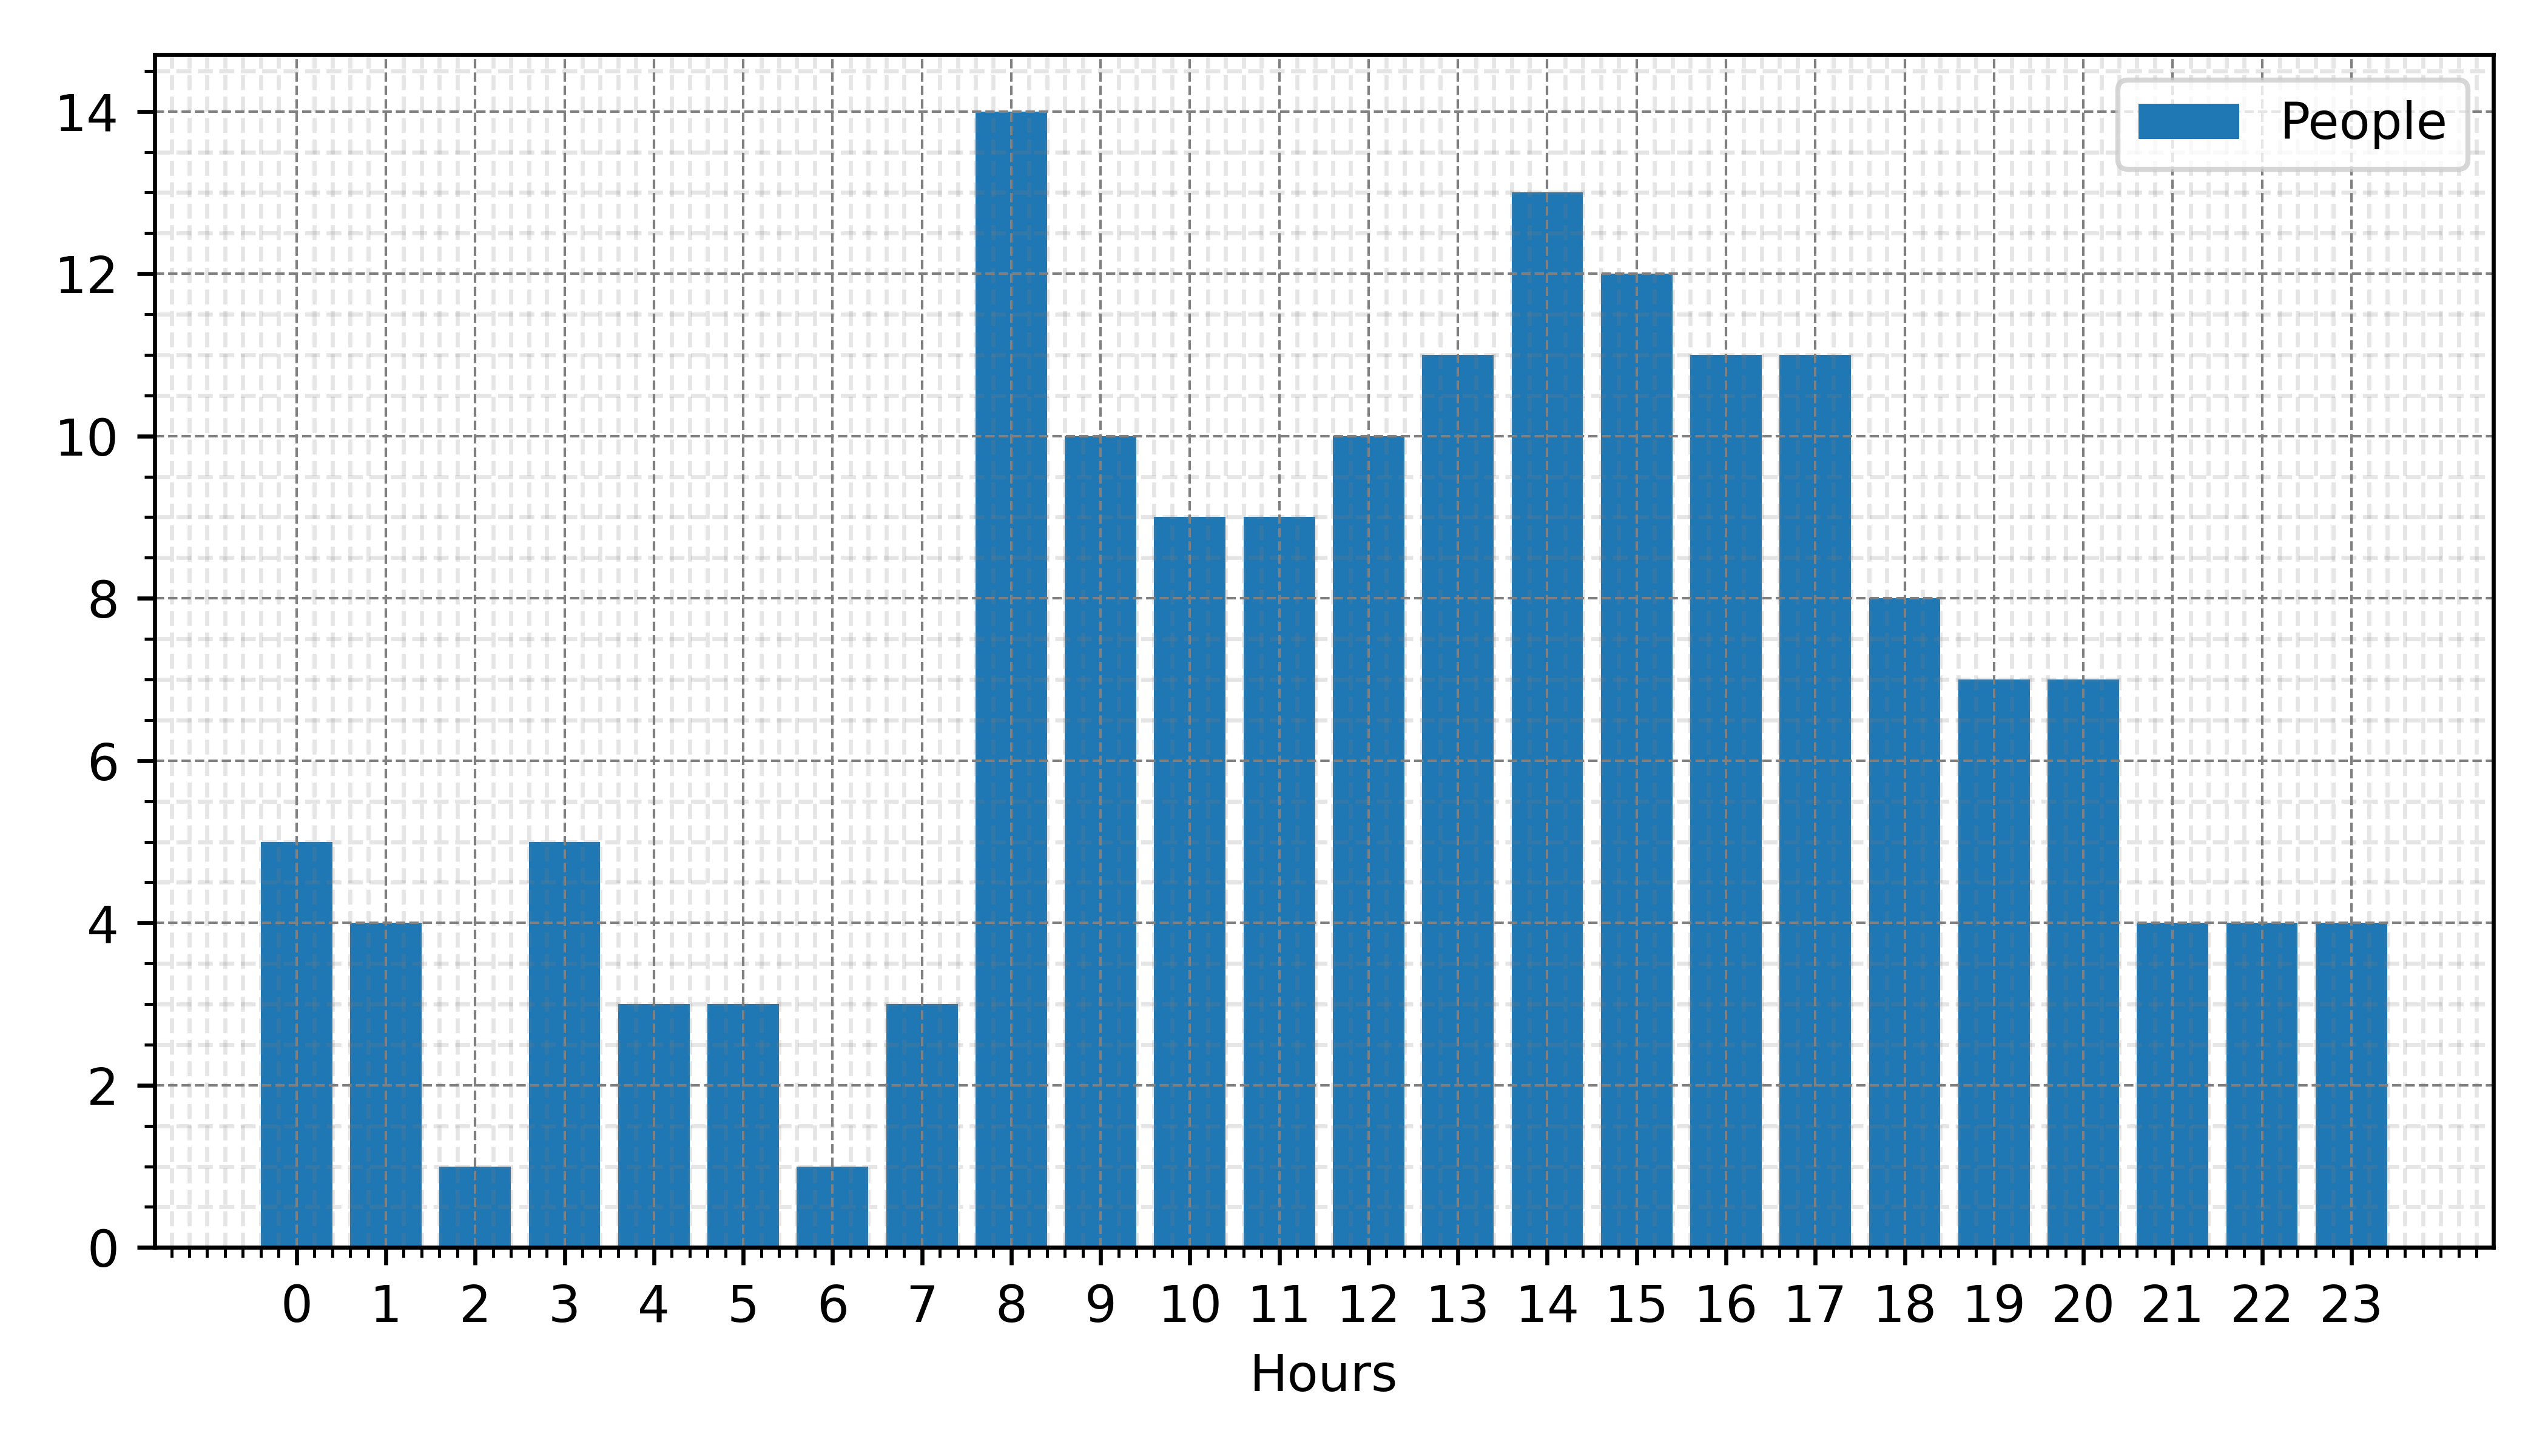
Another type of data available in the dashboard for the user is the video camera detection. Through the vision framework running in the edge, already described in Subsection V-C, the platform is able to accumulate data regarding the detection of objects from different classes. The results presented in this article focus on the flow of pedestrians in the areas where cameras are located.
In the Smart Lamp Post of ISCA-UA, there is a video camera (Figure 3) capturing a crosswalk located at the end of the road being sensed by the traffic radar. Figure 17 depicts statistics on the detection of pedestrians using that crosswalk. At each instant of the detection, the number of distinct people is counted and the maximum of these values, per hour, is plotted. With this data it is possible to analyze some correlation between Figures 14 and 17. When more people are detected, for instance at 8am, the vehicles’ average speed is lower. There are some studies already in place by the municipality of Aveiro regarding this intersection, to evaluate the impact of the crosswalk occupation in the vehicles traffic exploring the information collected by the radar and the video camera.
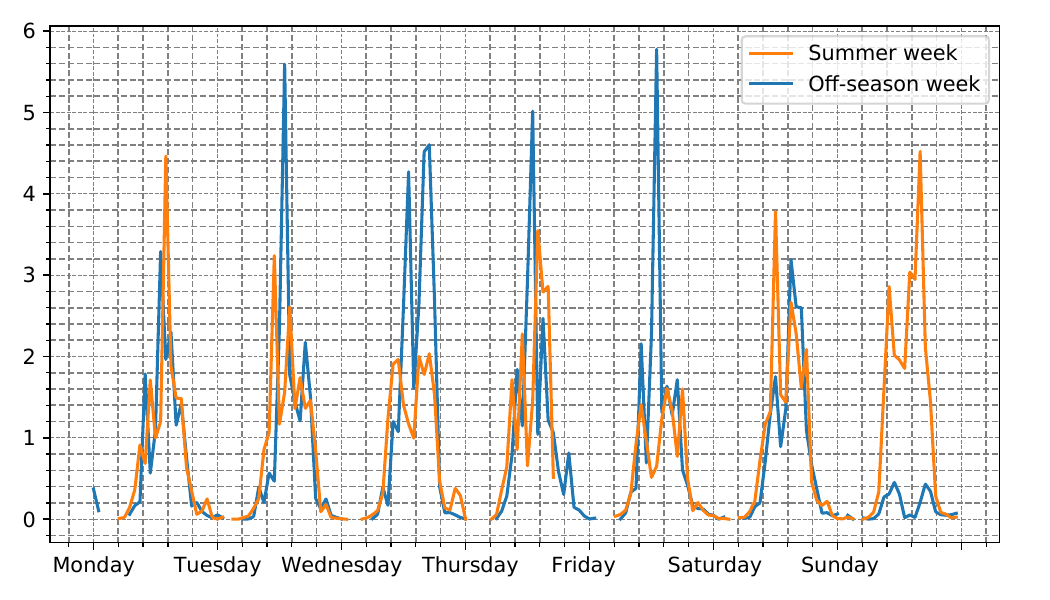
Another video camera is located in the Smart Lamp Post close to the city hall, pointed to a city leisure park. Figure 18 depicts the hourly average number of people detected, for a span of one week. The idea was to compare two weeks - one from Summer (starting in 2021/08/23) and another off-season (starting in 2022/02/07). The most notorious difference lies on Sundays where, during the Summer, the number of people in the park is higher for the entire day when compared to the Winter season.
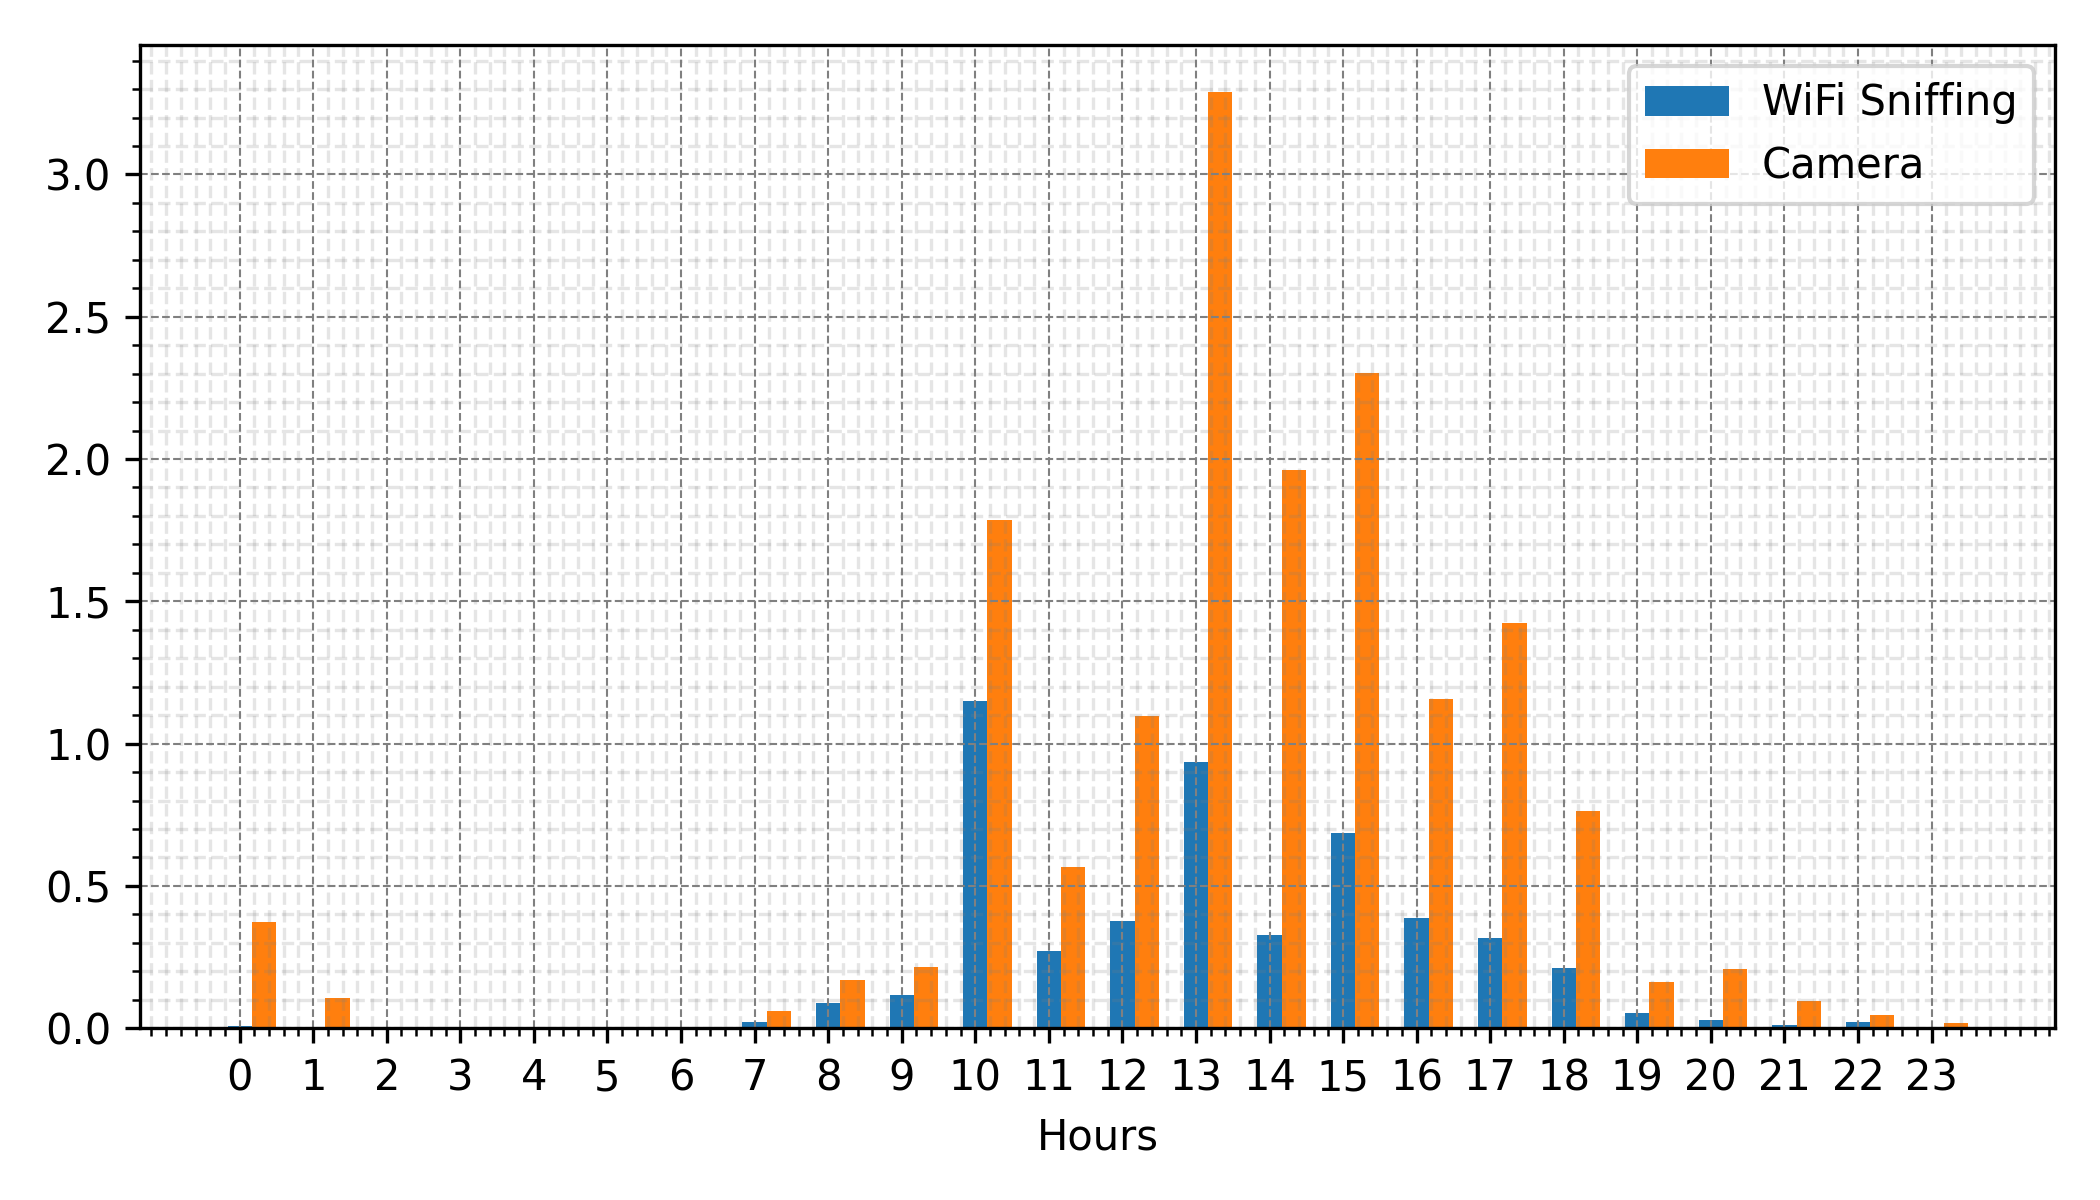
VII-A3 WiFi sniffing
The WiFi sniffing service uses one of the \acrsu’s wireless network adapter, set in monitor mode, so that it can capture probe requests emitted by the devices that pass near the posts. Assuming that most people carries at least one device with WiFi capabilities, the collected data allows to understand which are the hours when more people are passing by the monitored areas. It is also possible to correlate this data with the detection of the video camera. Figure 19 plots the results for the WiFi sniffing of devices and video camera detection of pedestrians in the Smart Lamp Post close to the city hall. It is important to note the following differences between these two types of detection: the WiFi sniffing can capture more than one device per person emitting packets trying to join an WiFi \acap, and it does the detection in an omnidirectional coverage; alternatively, the camera identifies each person, but in a range-defined area. Thus, despite different absolute values, it is still possible to correlate the trend of the amount of people in different hours throughout the day.
VII-B Performance Results
The second set of results are related to the performance of the vehicular network and the edge computing.
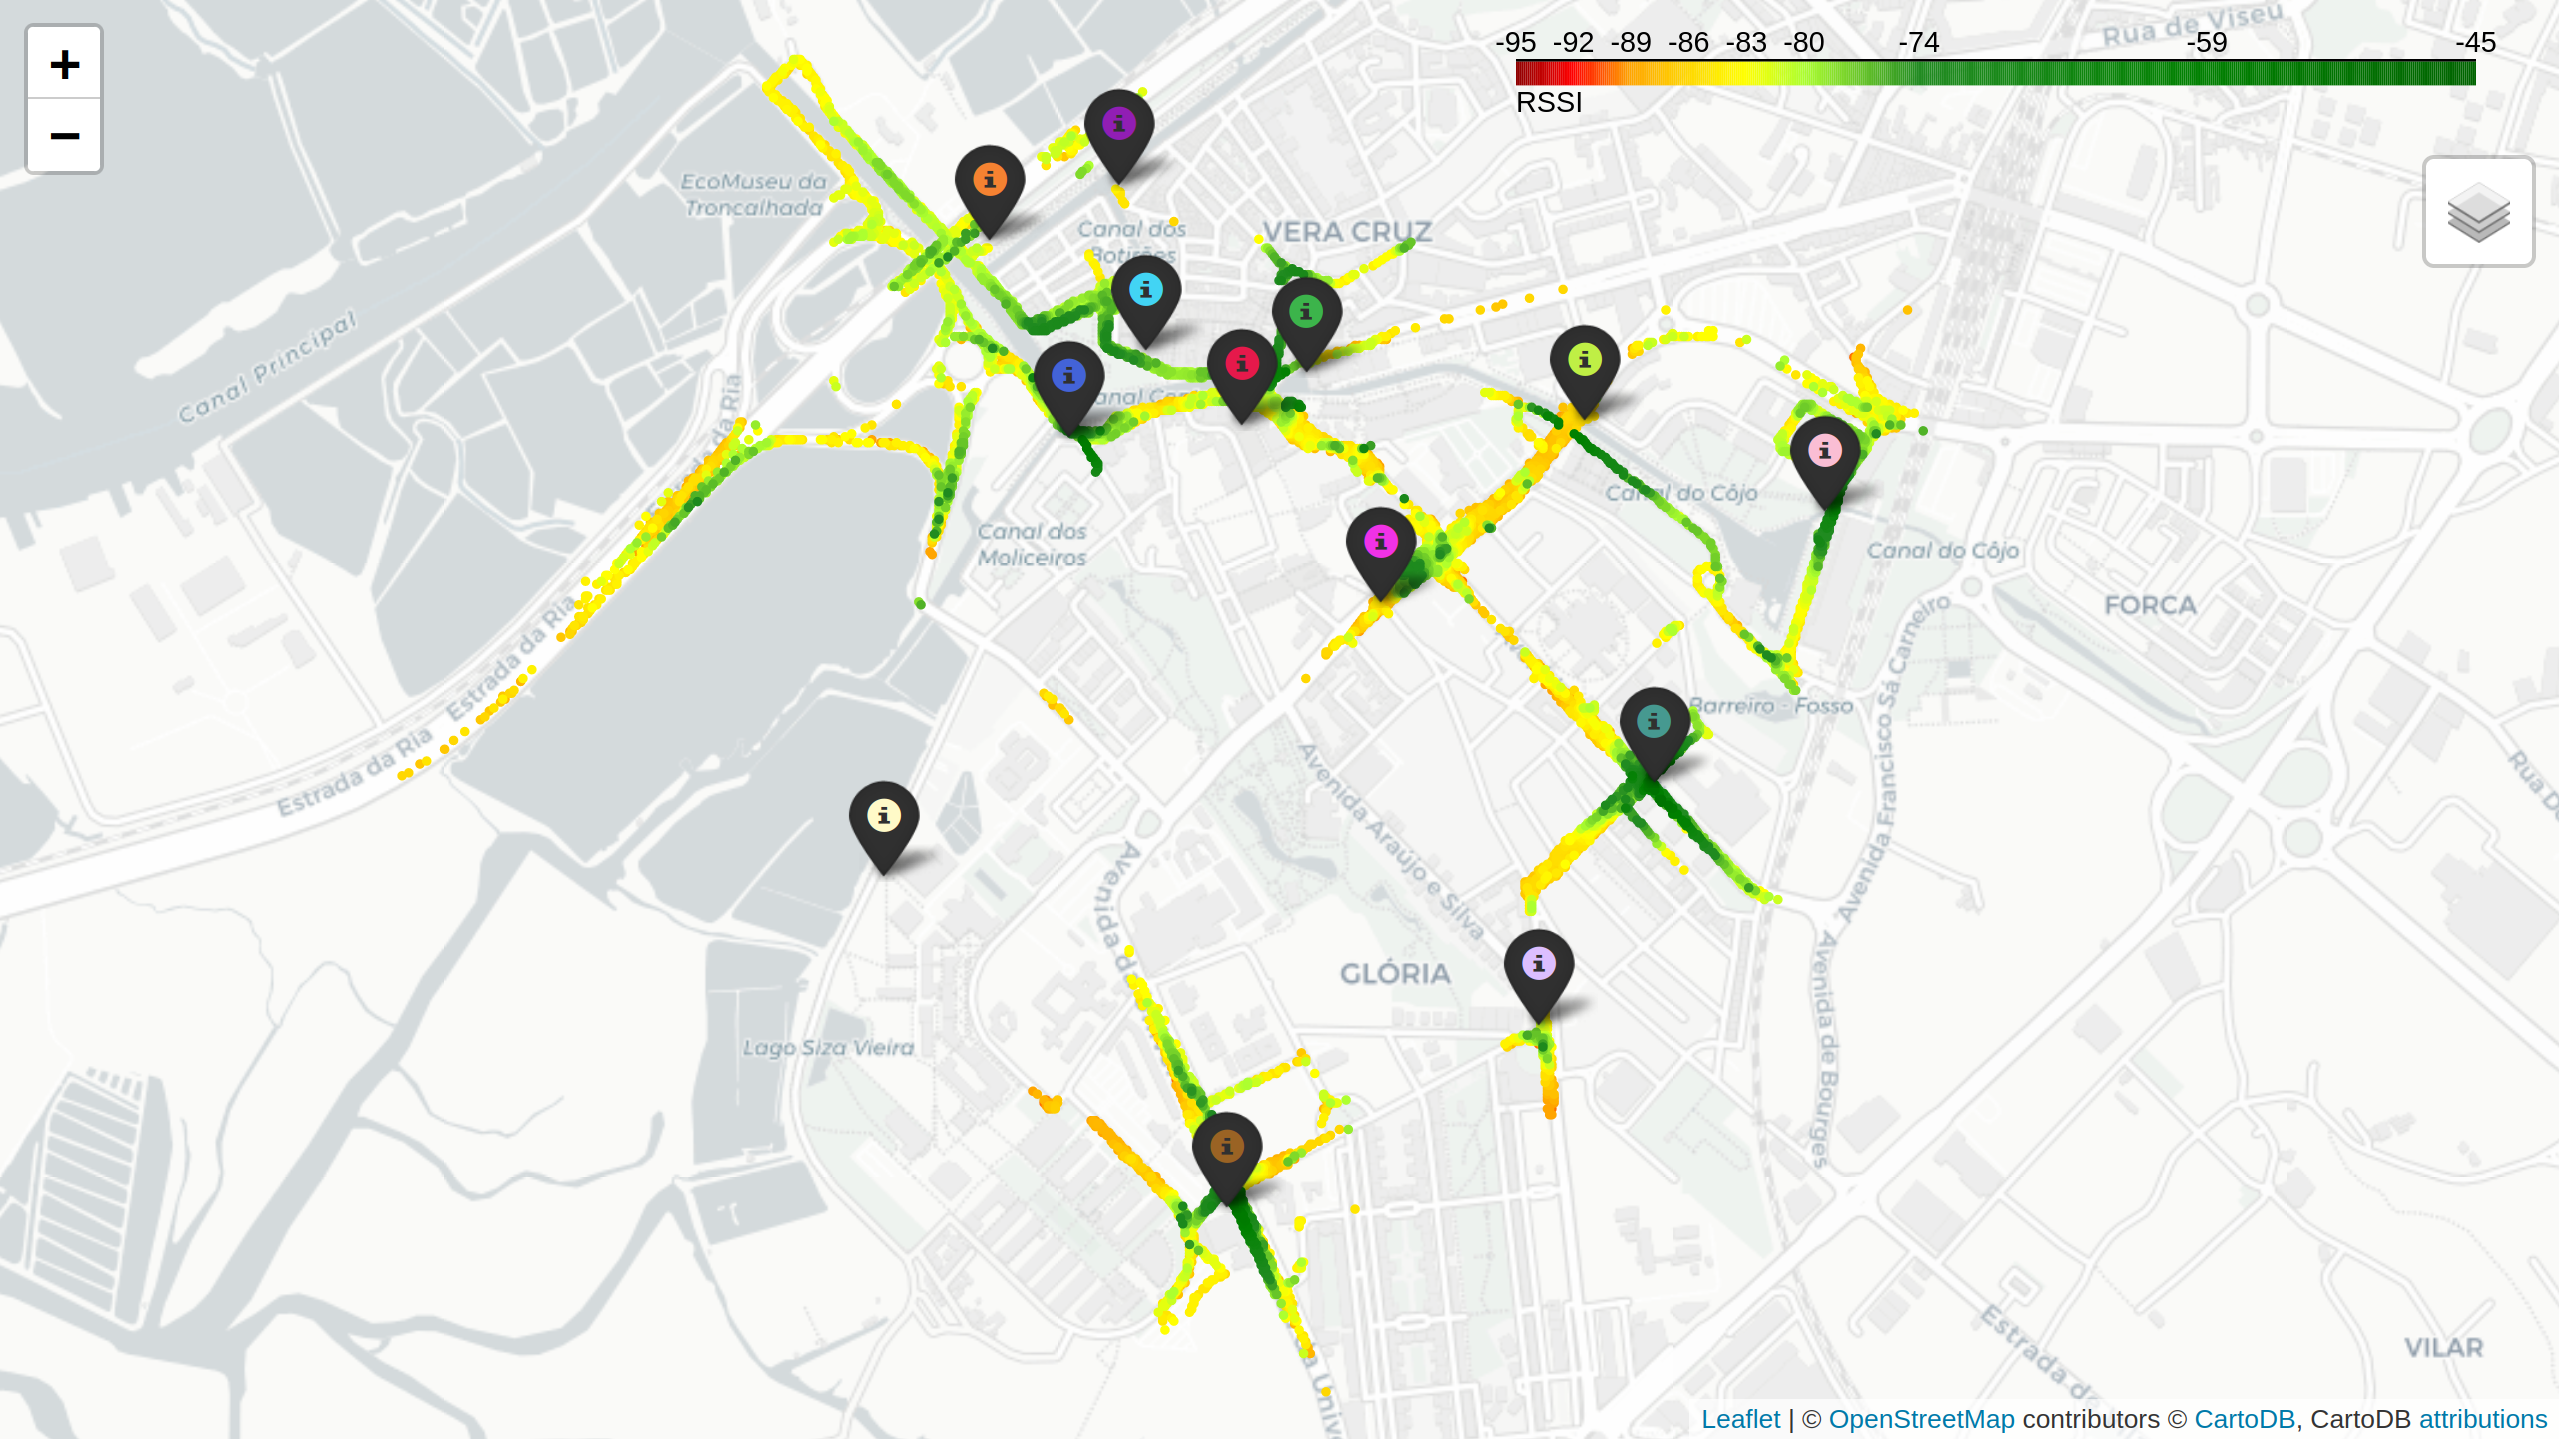
VII-B1 Vehicular connectivity
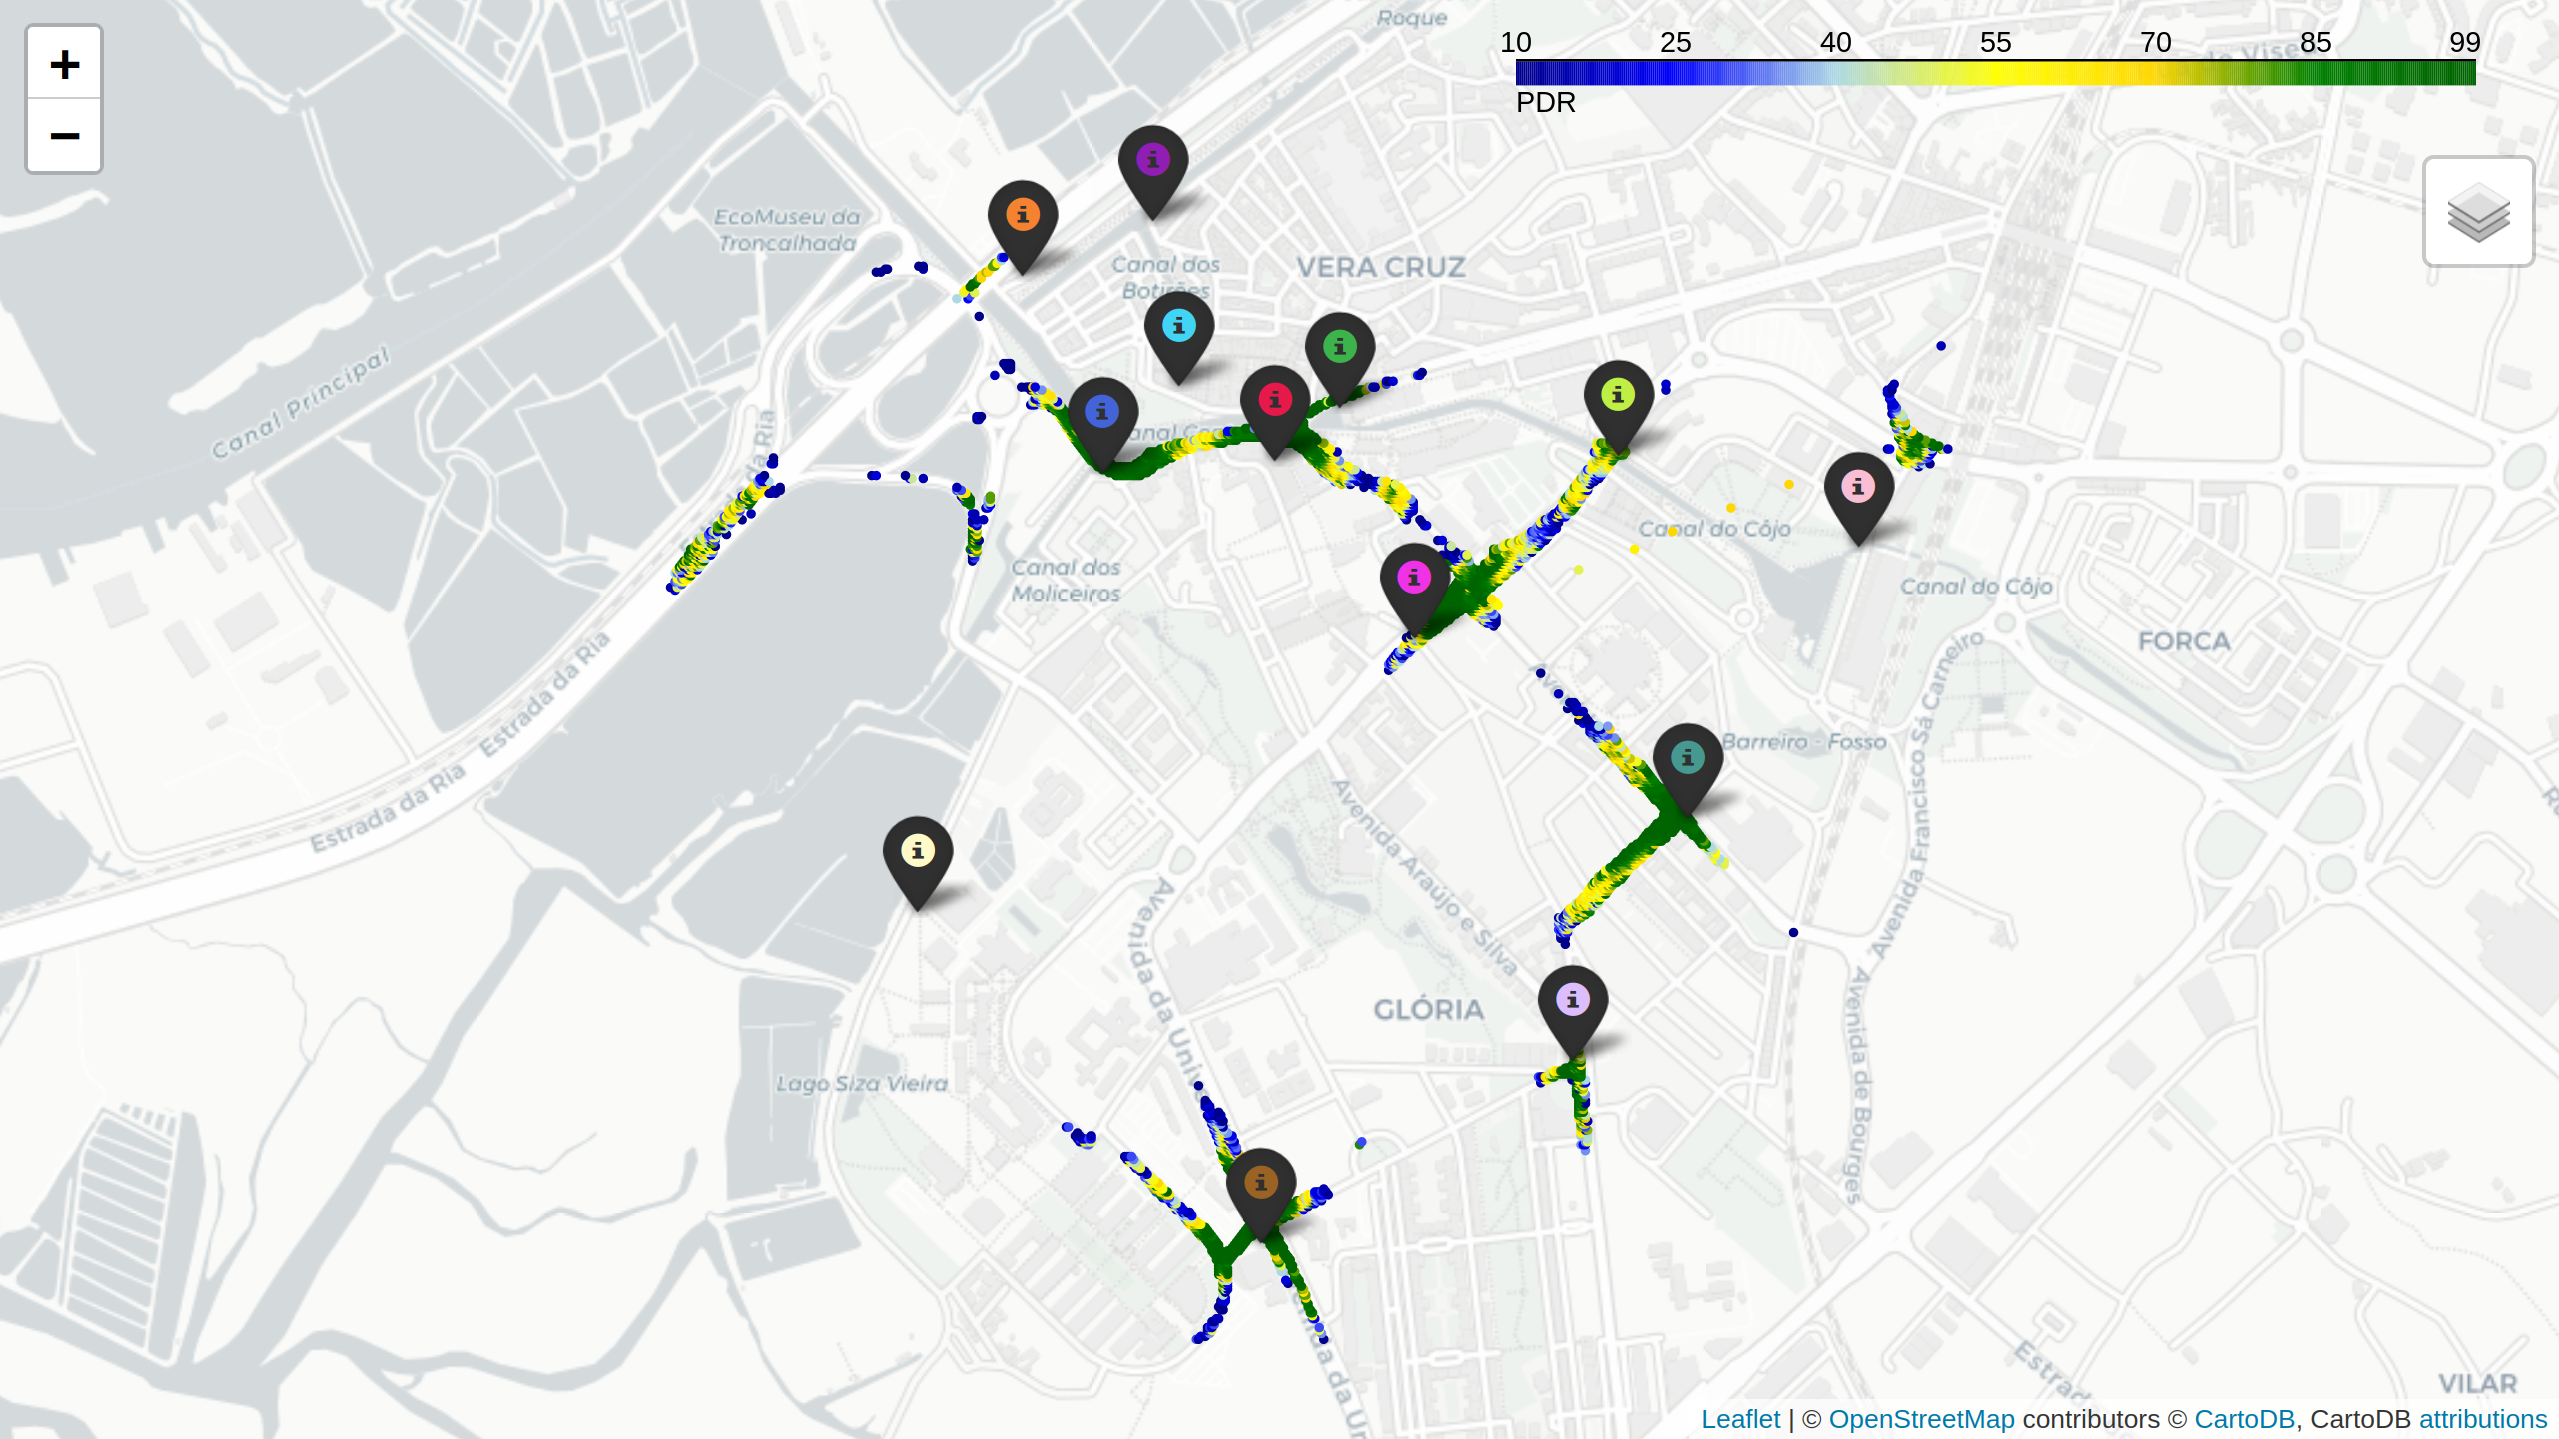
In order to obtain initial results on both levels of ITS-G5 coverage and signal quality, maps with results of \acrssi and \acpdr were generated based on \acpcam collected during working days (on the week of 2021/04/12). Figure 20 plots the average \acrssi measured on the \acprsu. For these results, all received \acpcam are considered, including those transmitted by the buses with \acatcll’s \acpobu, and conventional vehicles supporting ITS-G5. We can observe a good coverage nearby the \acprsu, in particular in the city center where the density of nodes is higher. Regarding the \acpdr results, the measurements are shown in Figure 21. Here, third-party \acpcam were discarded in favour of messages originating only from buses with \acatcll \acpobu, since the \accam’s transmission rate is pre-known. For this reason, the measurements are plotted in a smaller amount of roads. Once again it is possible to observe a high \acpdr nearby the \acprsu and in the city center, with more density of nodes.
In order to evaluate the performance of the initial version of the \acsdn-based mobility network, measurements were performed in the following manner: an iPerf3343434https://iperf.fr server is running in each \acatcll \acobu of the city buses, and an iPerf3 client deployed in a virtual machine, in the cloud platform, is continuously trying an UDP connection to all \acpobu. Upon a successful connection, traffic is generated from the \acobu at packet level, accurately replicating appropriate stochastic processes. The tests were performed with a duration of 1 second per test, with tests being carried out with a frequency of 1 Hz. The \acpobu carrying the testing platform circulated through \acprsu numbered P3, P5, P6, P9, P15, P19, P22, and P26, as depicted in Figure 22. \acprsu P3, P15, P19, and P22 are located in Smart Lamp Posts and \acprsu P5, P6, P9, and P26 are located in wall boxes. Figure 23(a) depicts the boxplots of the throughput received by each \acrsu, and Figure 23(b) depicts the loss percentage of packets for those transmissions. With such results, we can observe that the \acrsu P9 receives less data than other \acprsu. This result can be explained by the fact that \acrsu P9 is positioned under a bridge, providing less coverage than the other wall boxes placed on top of buildings.
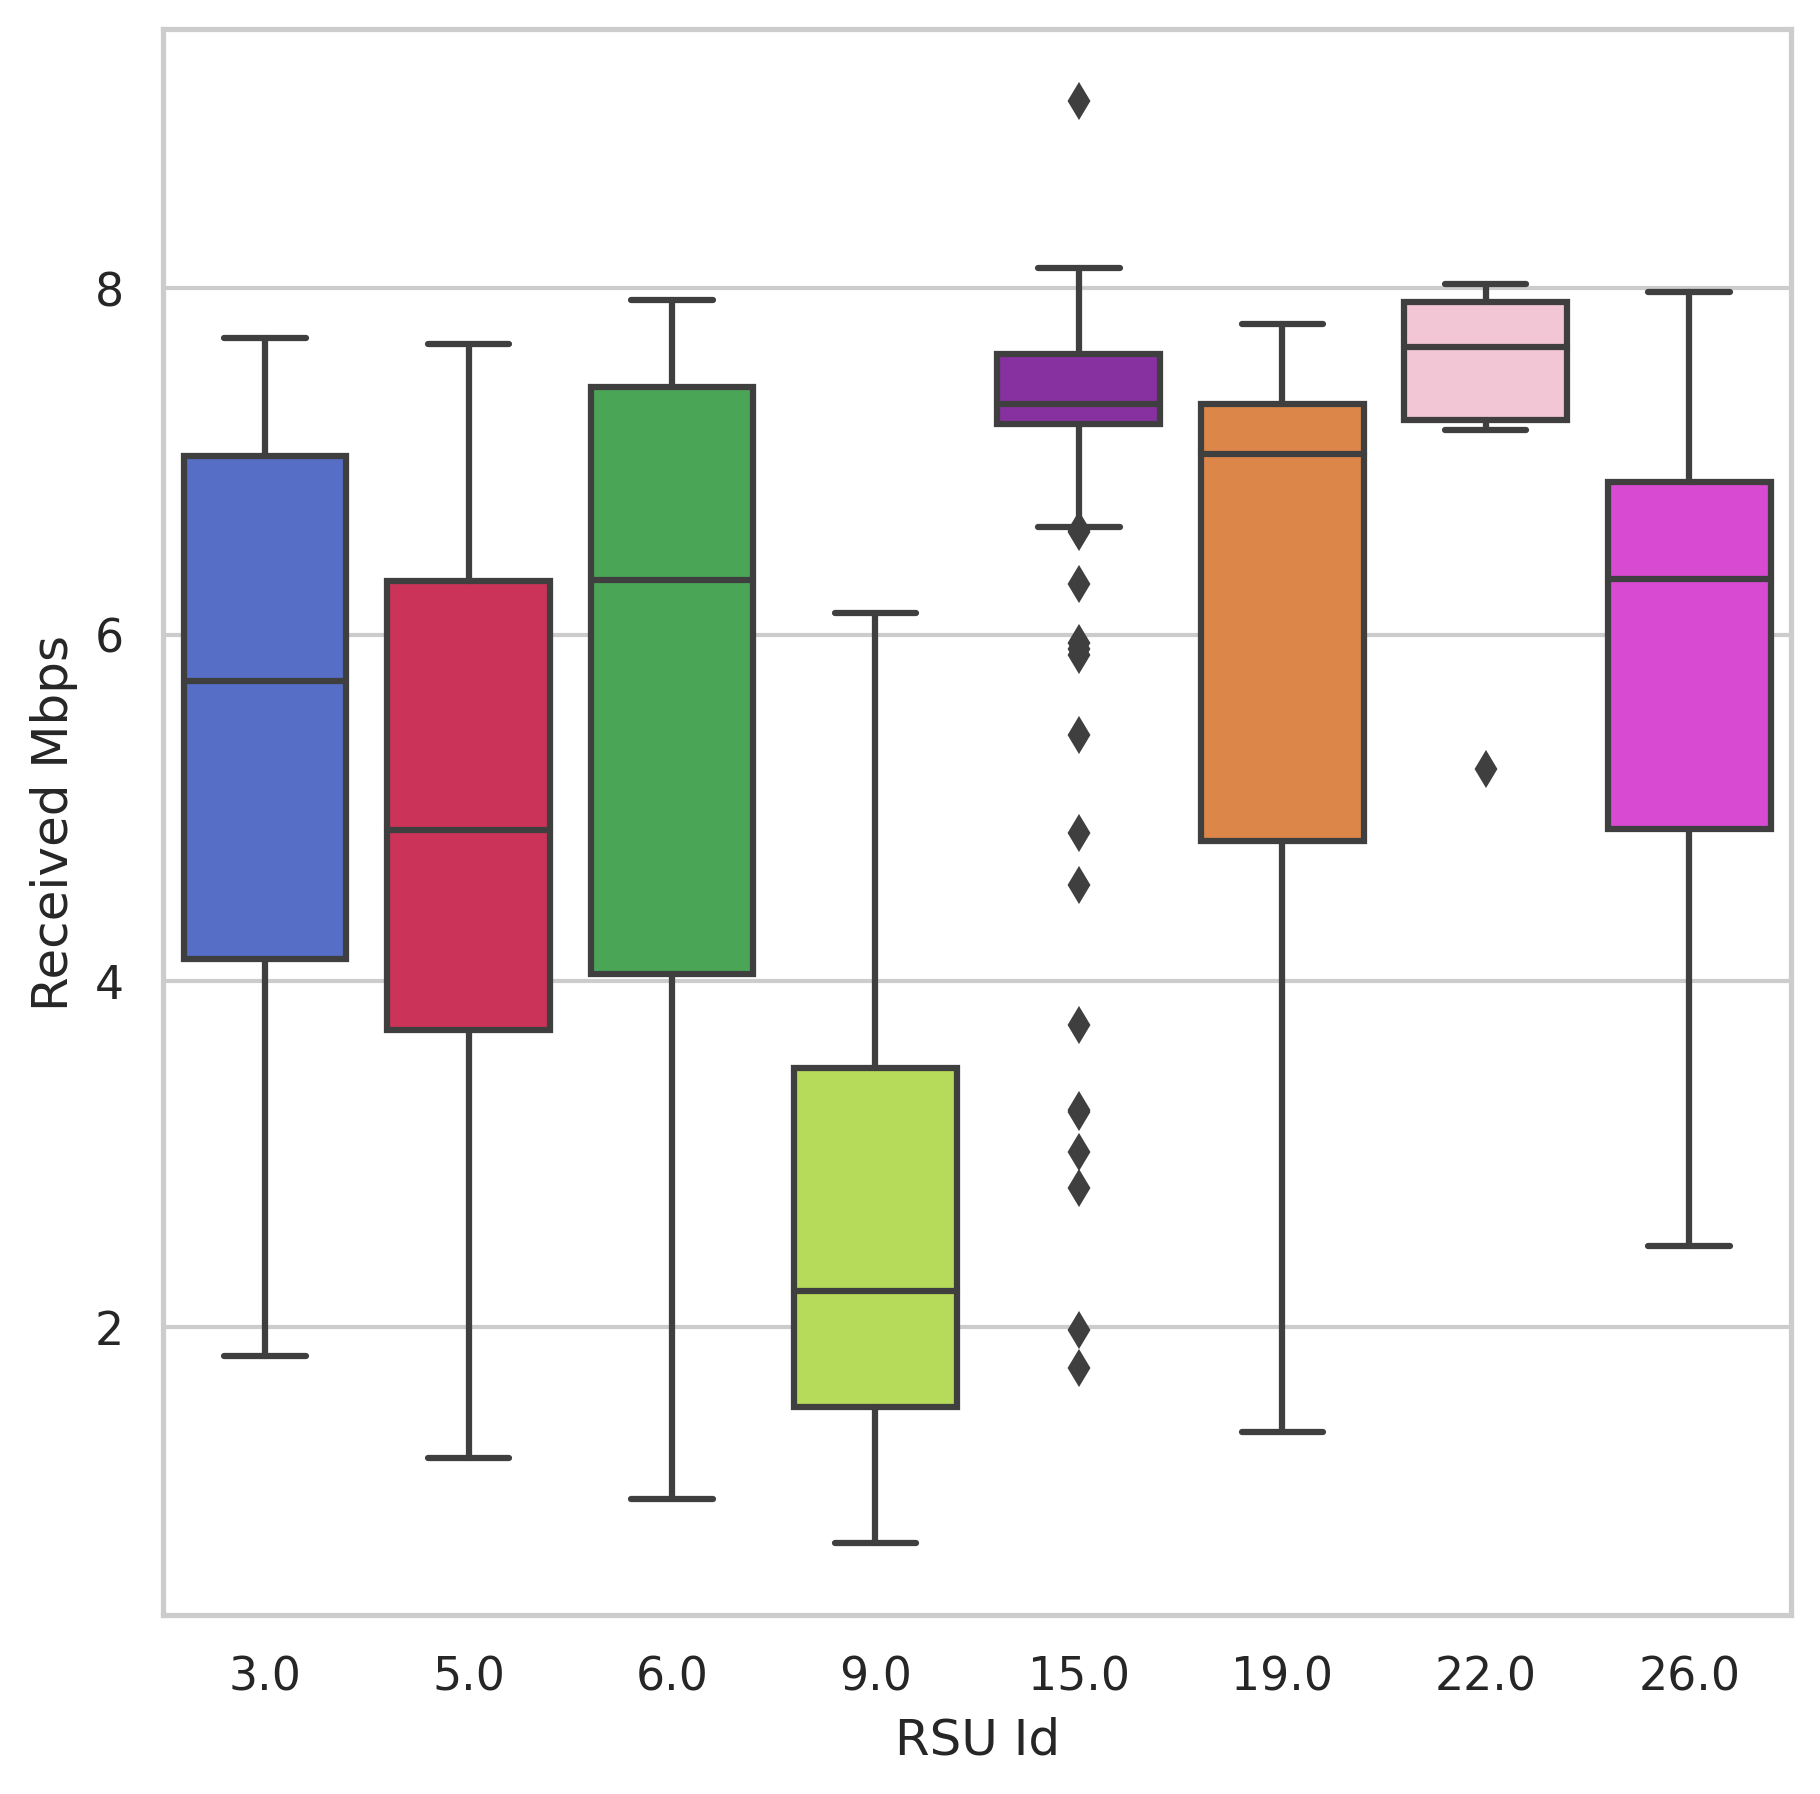
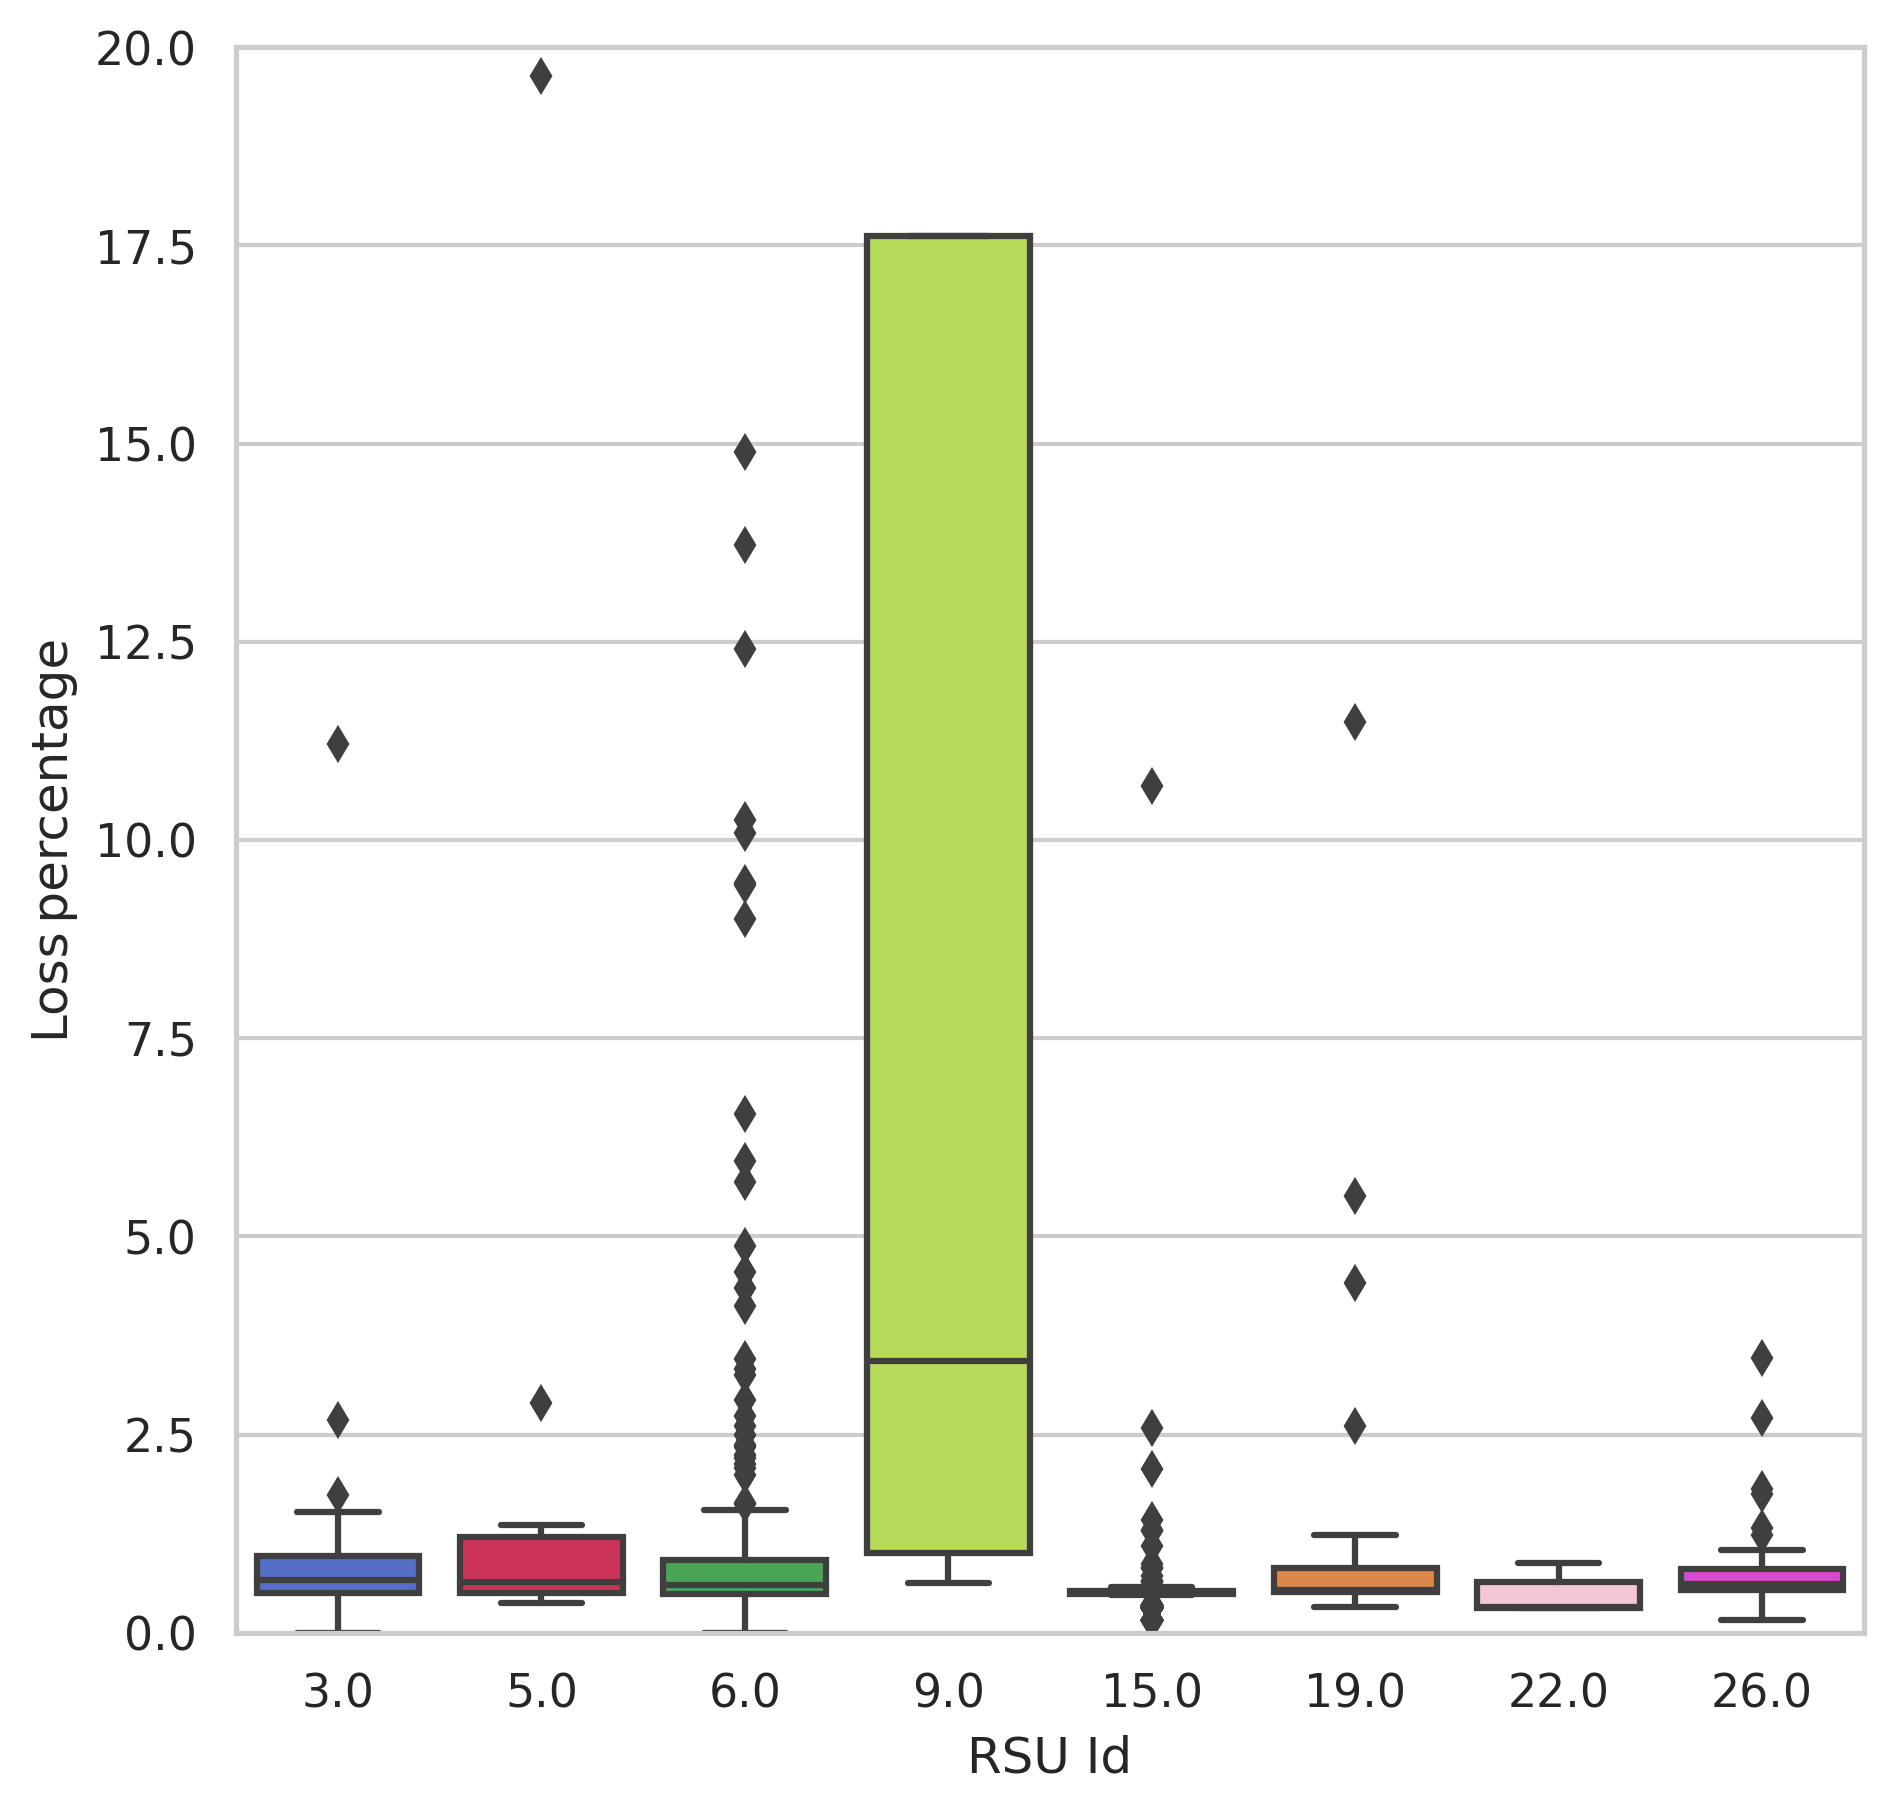
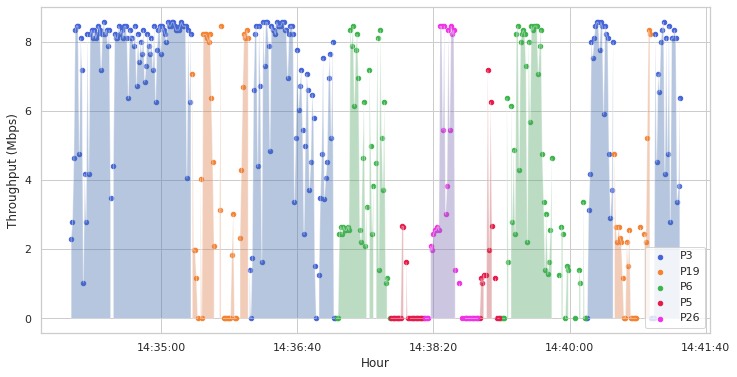

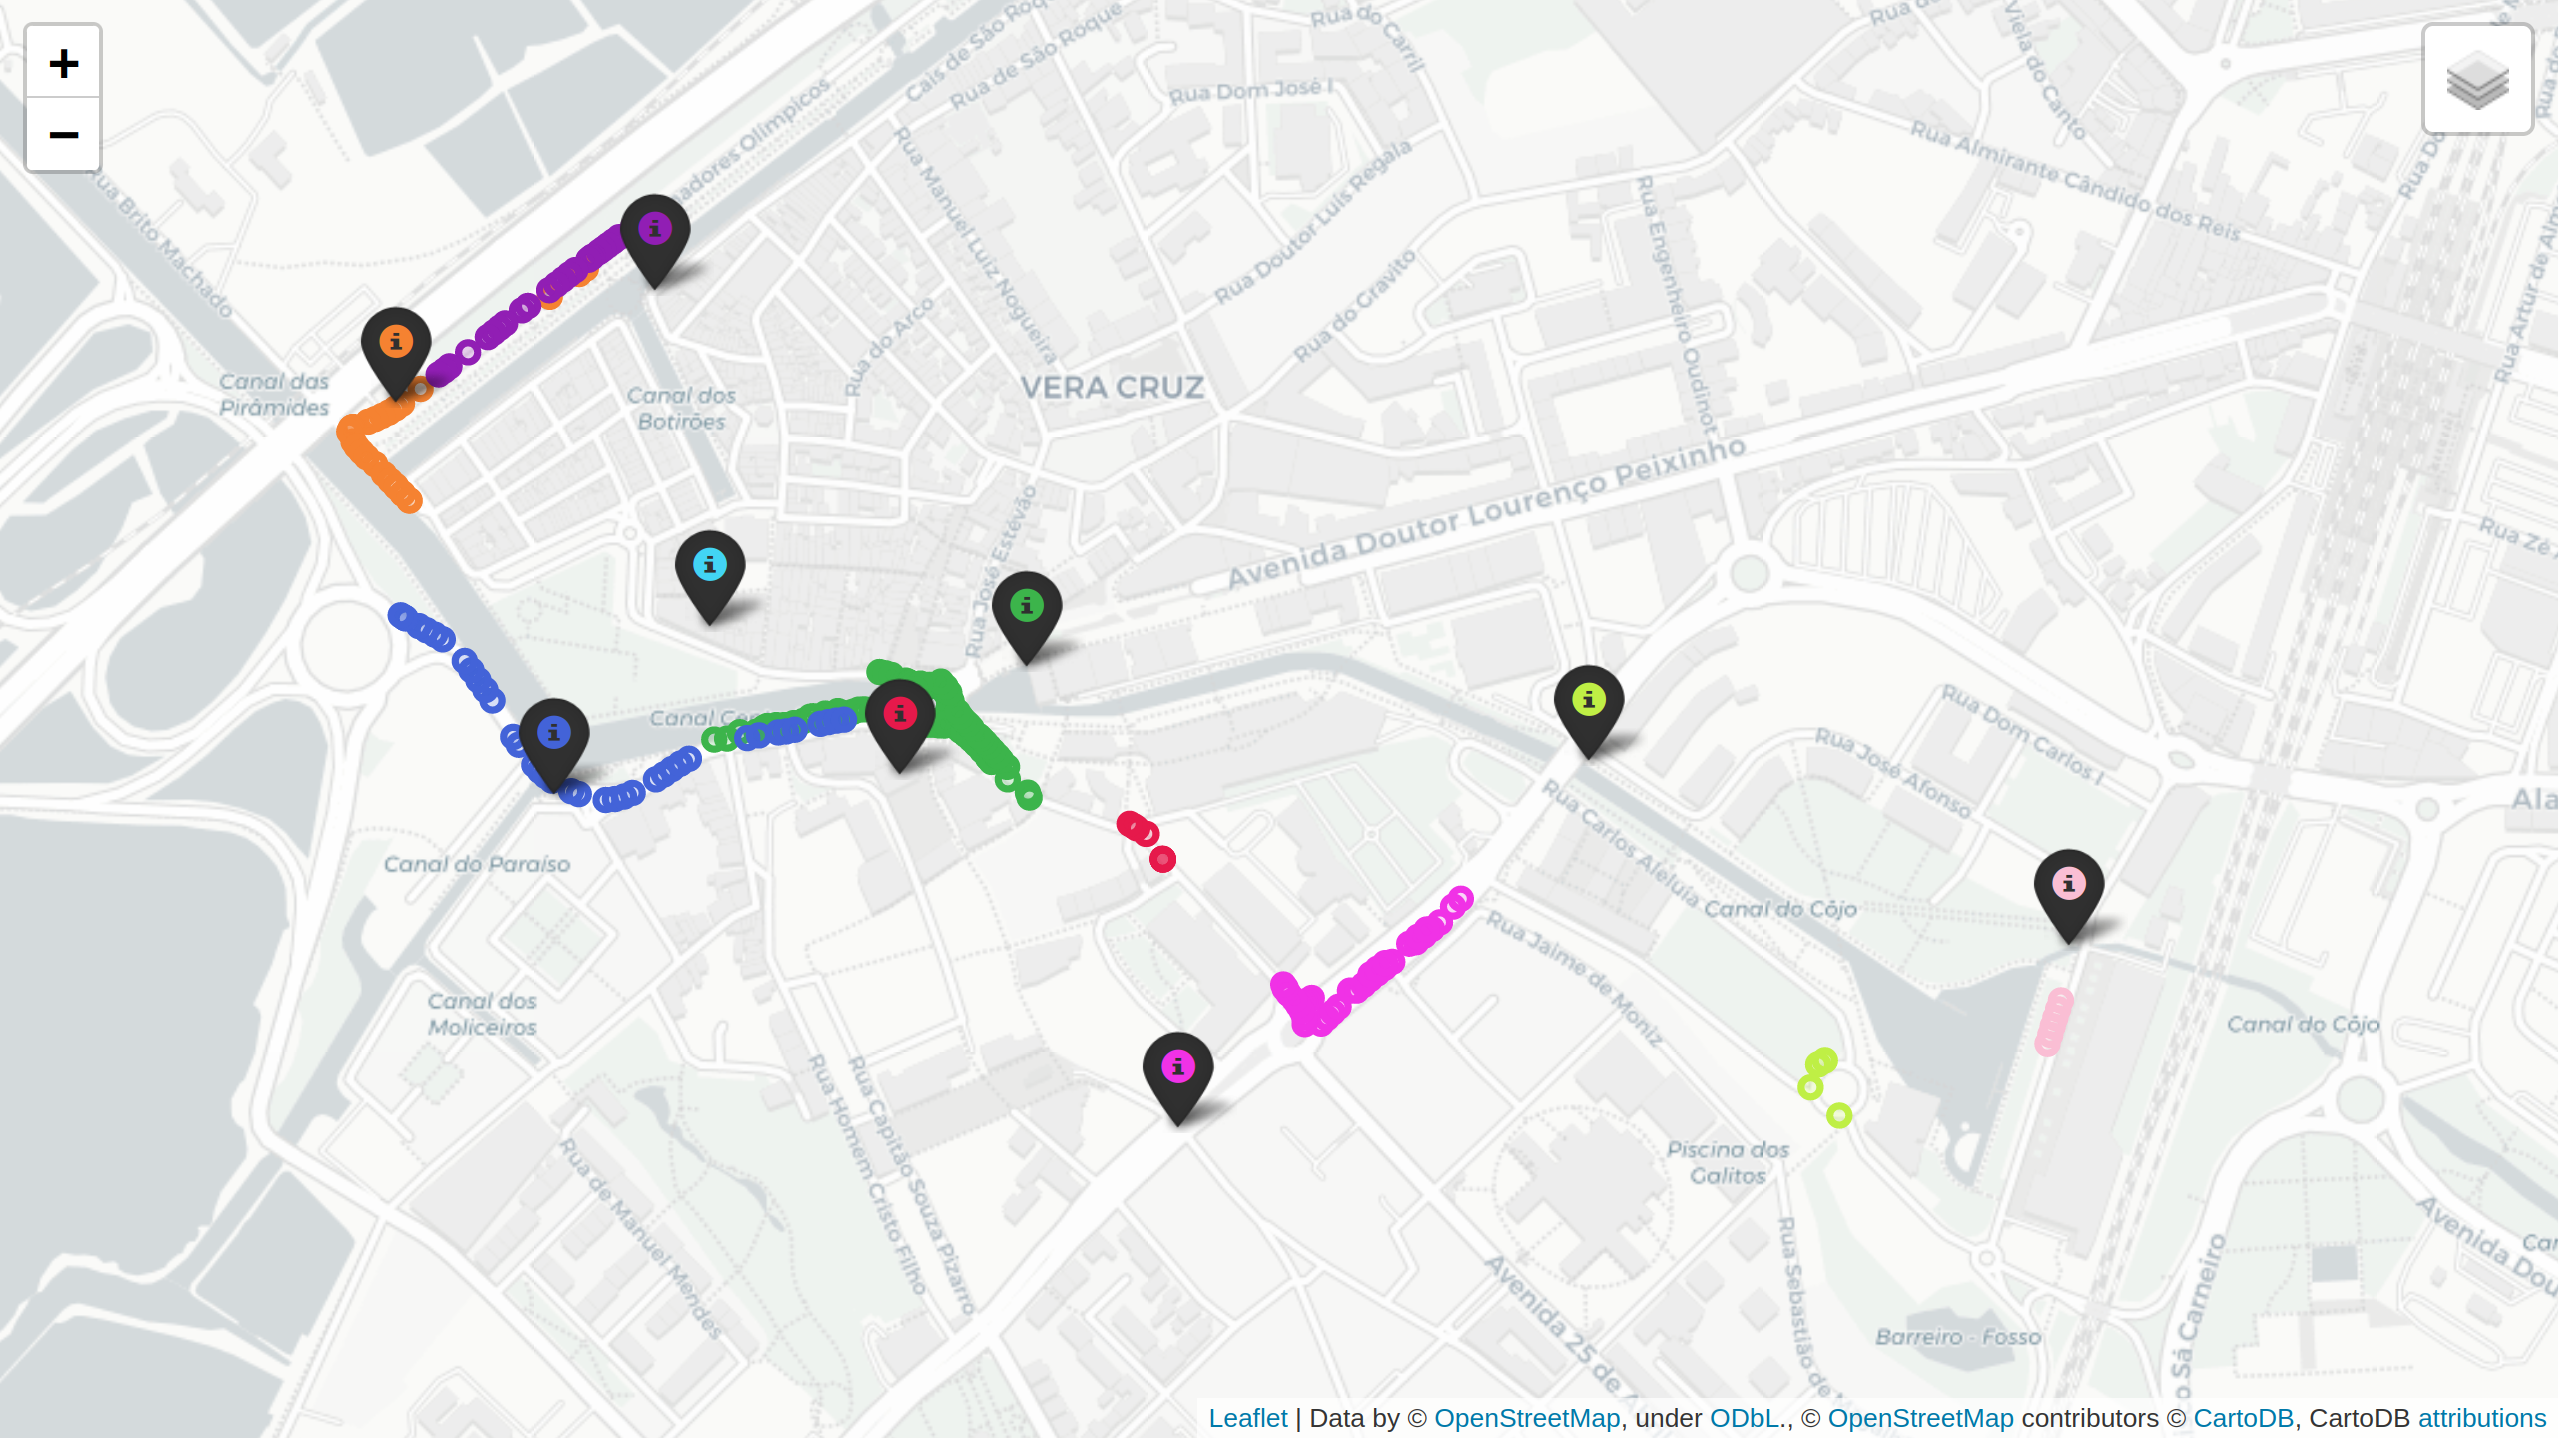
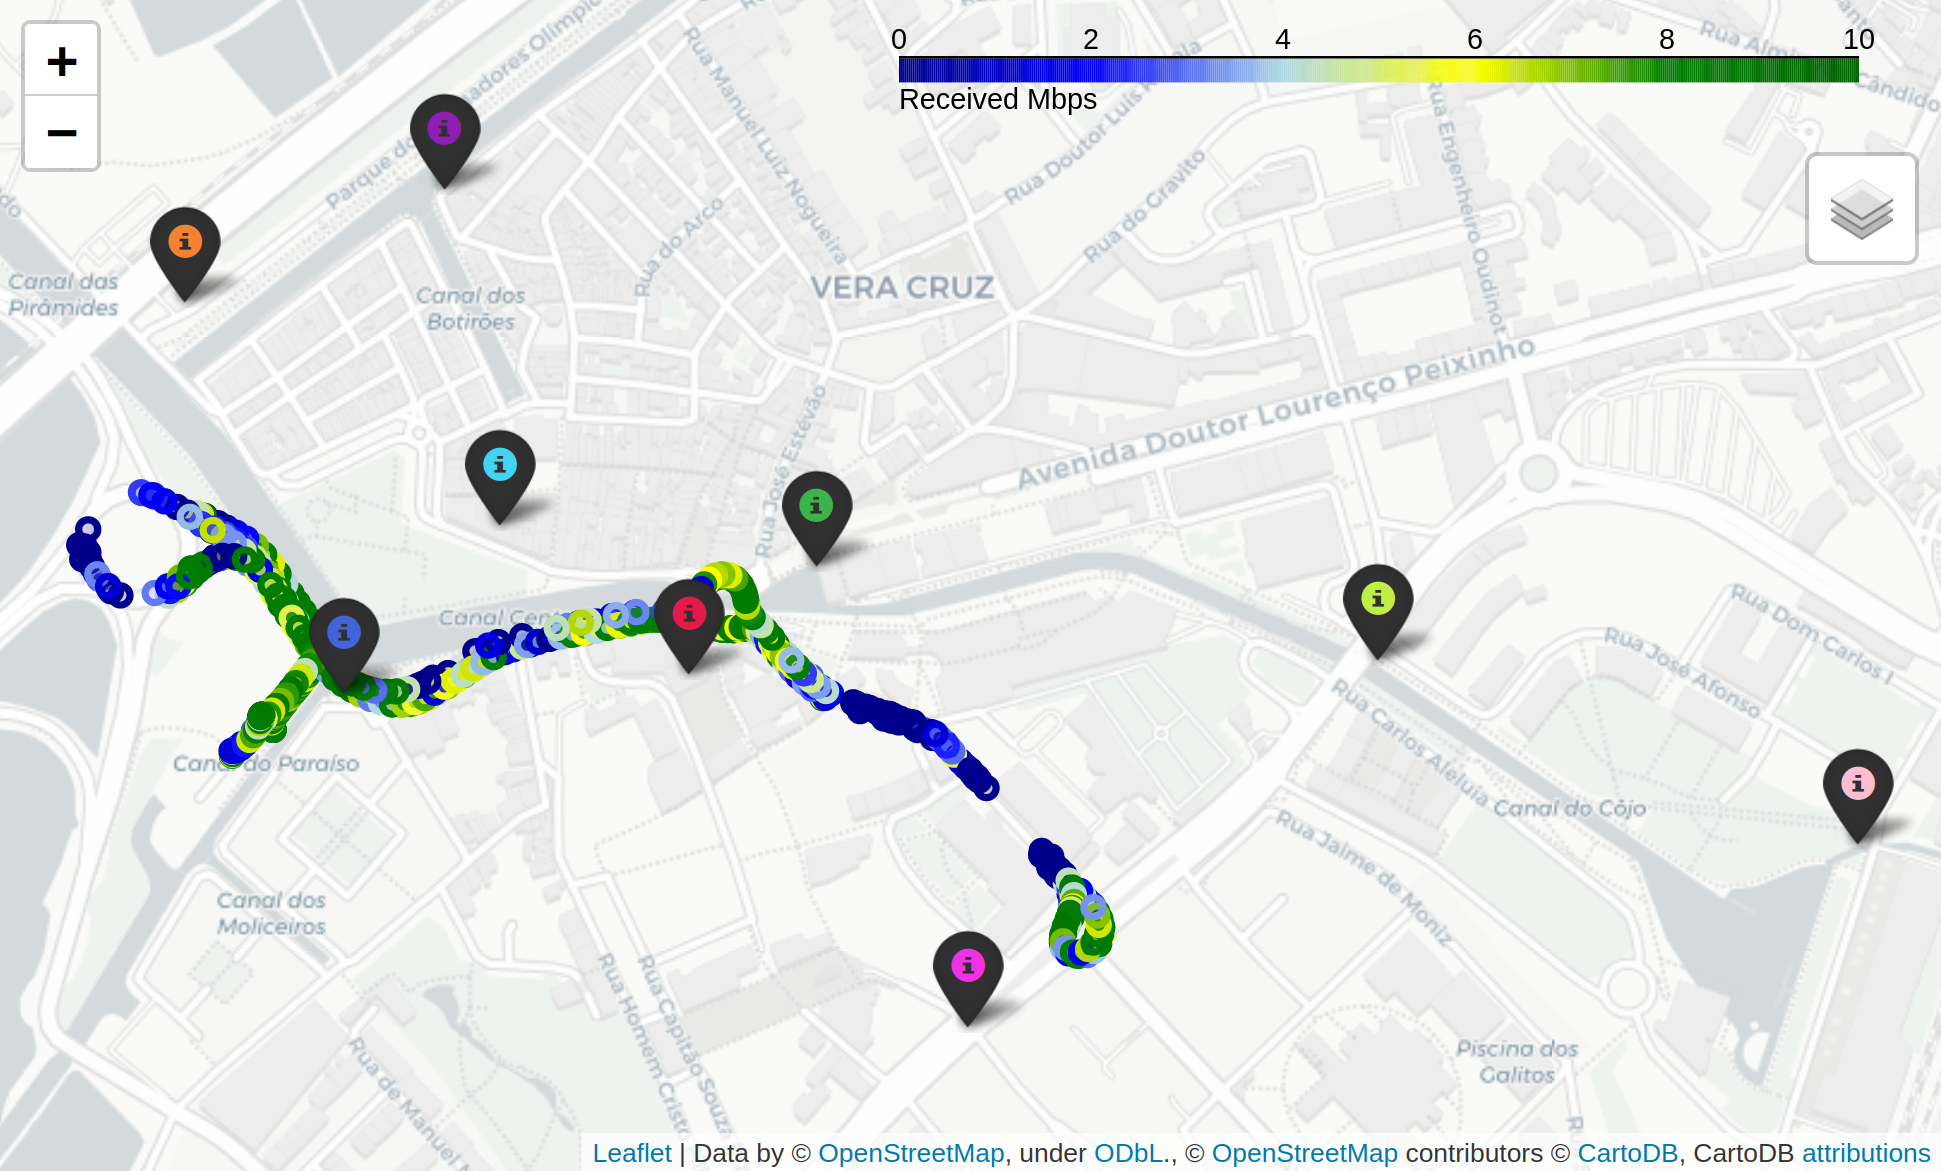
Figure 24 shows the results of throughput over time and distance traveled in one trip done by a vehicle, passing by several \acprsu (P3, P5, P6, P19, and P26). As corroborated by the results, the current solution of connectivity between \acpobu and infrastructure performs well in long periods of connectivity, frequently achieving a peak throughput of, at least, 8 Mbps. These results are also plotted in the map of Figure 25, demonstrating city locations where the communication level was sufficient to establish connectivity for the UDP tests, with data on the reception rate (in Mbps) for each position.
VII-B2 ITS-G5 vs cellular coverage
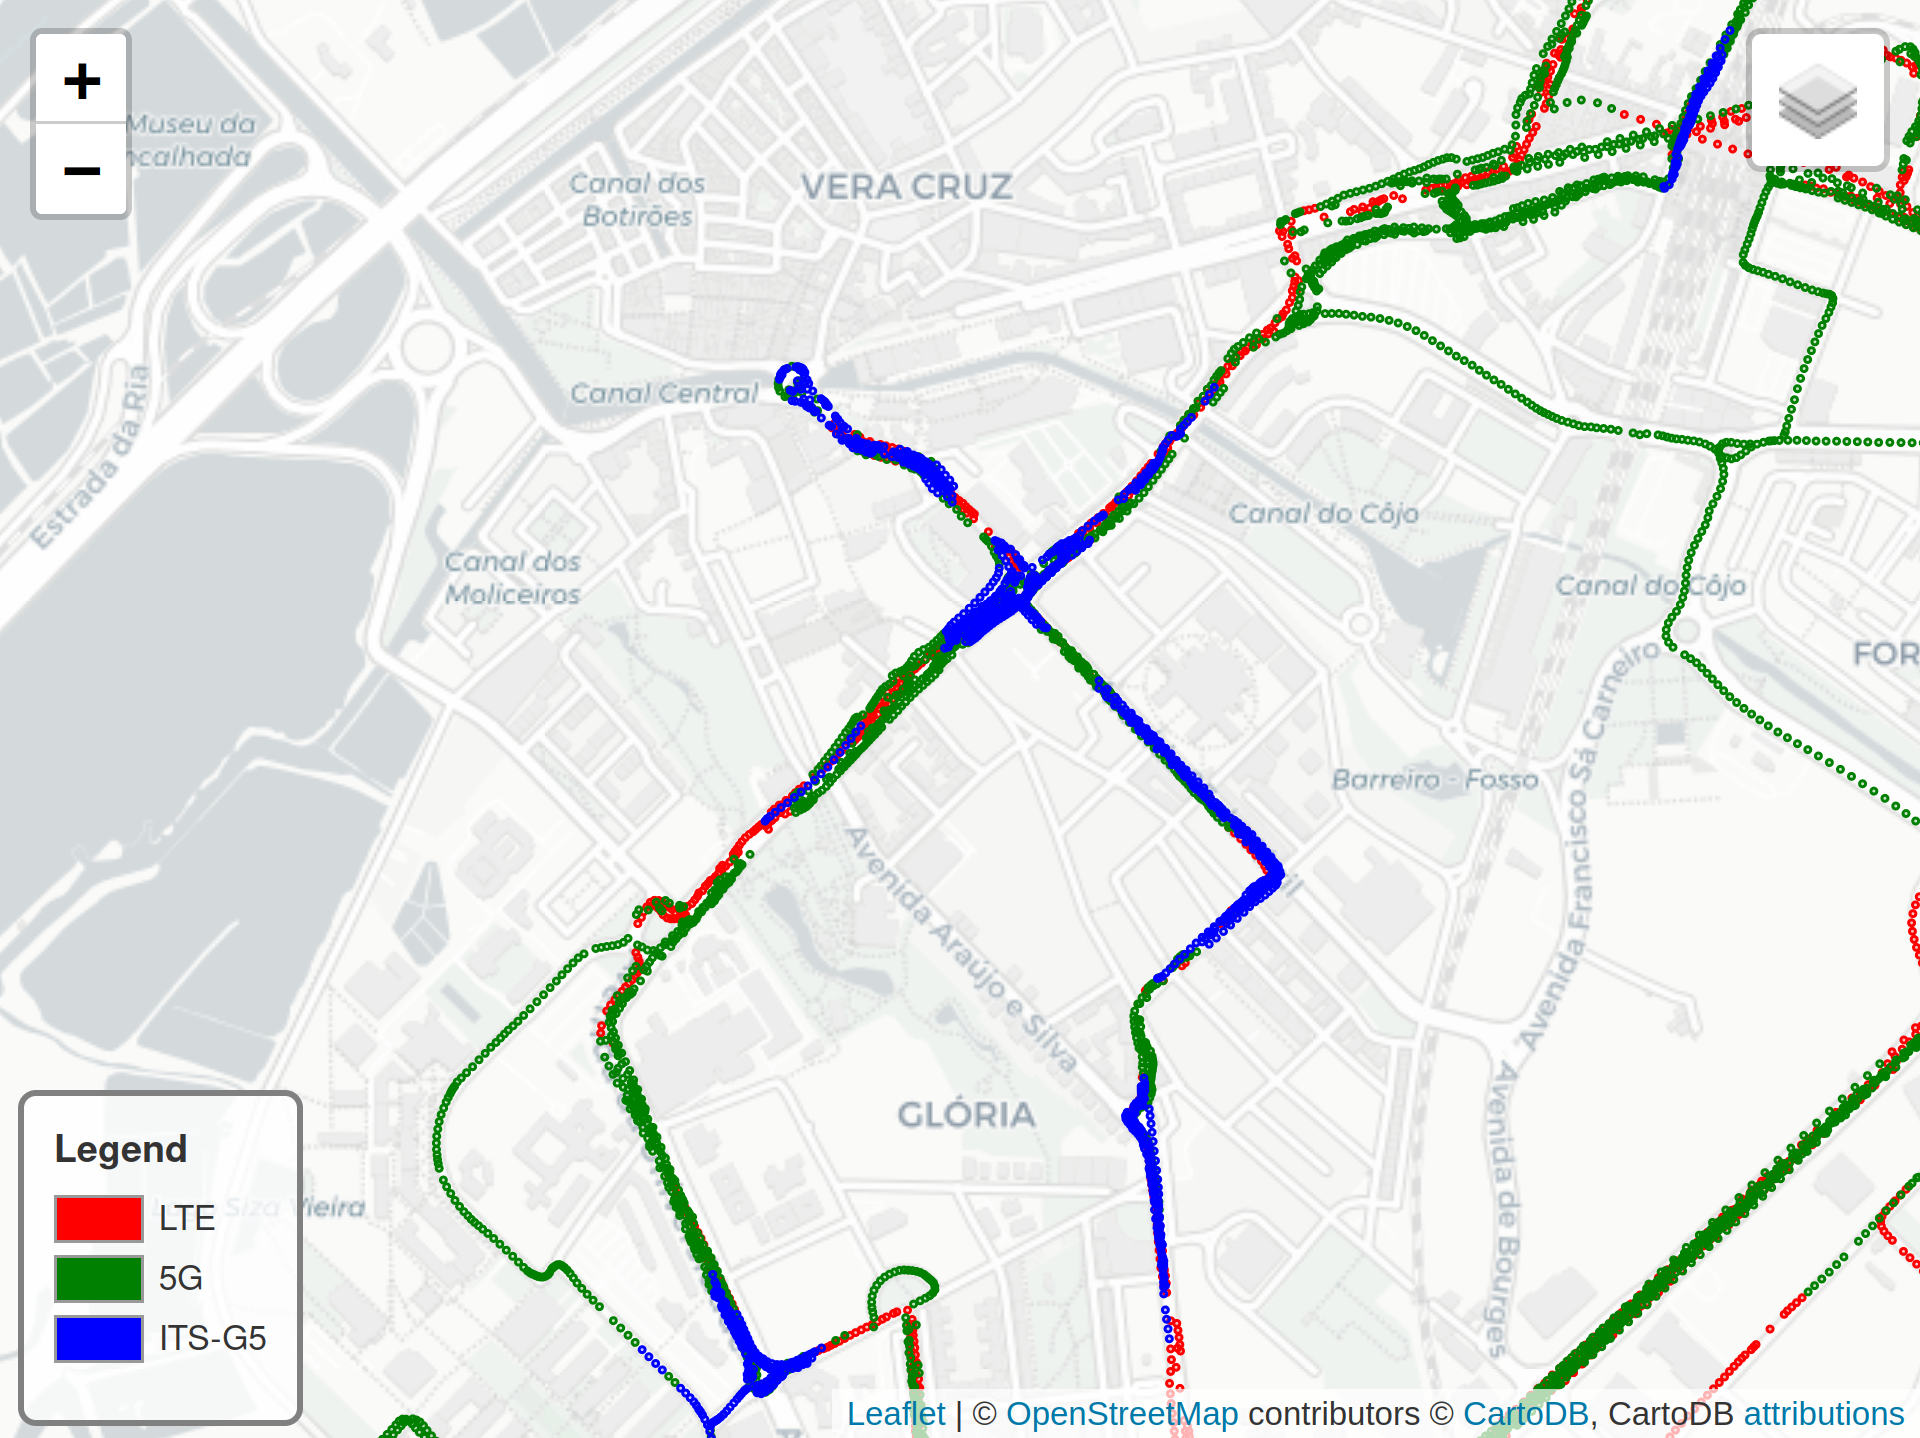
Using a bus with an \acobu supporting both ITS-G5 and cellular (LTE/5G) connectivity, it was possible to plot results of coverage of the different technologies throughout the city. Figure 26 depicts, in different colors, which technology the \acobu used in different areas of the road map of the city. The \acobu was able to use ITS-G5 (in blue) when travelling close to an \acrsu, and changing to 5G (in green) mostly in the other areas. LTE (in red) was used only when the other technologies were not available. The cellular network used in this evaluation was a non-standalone pre-commercial 5G deployment of the mobile network operator Altice MEO (n77 frequency band).
VII-B3 Edge and Cloud approach
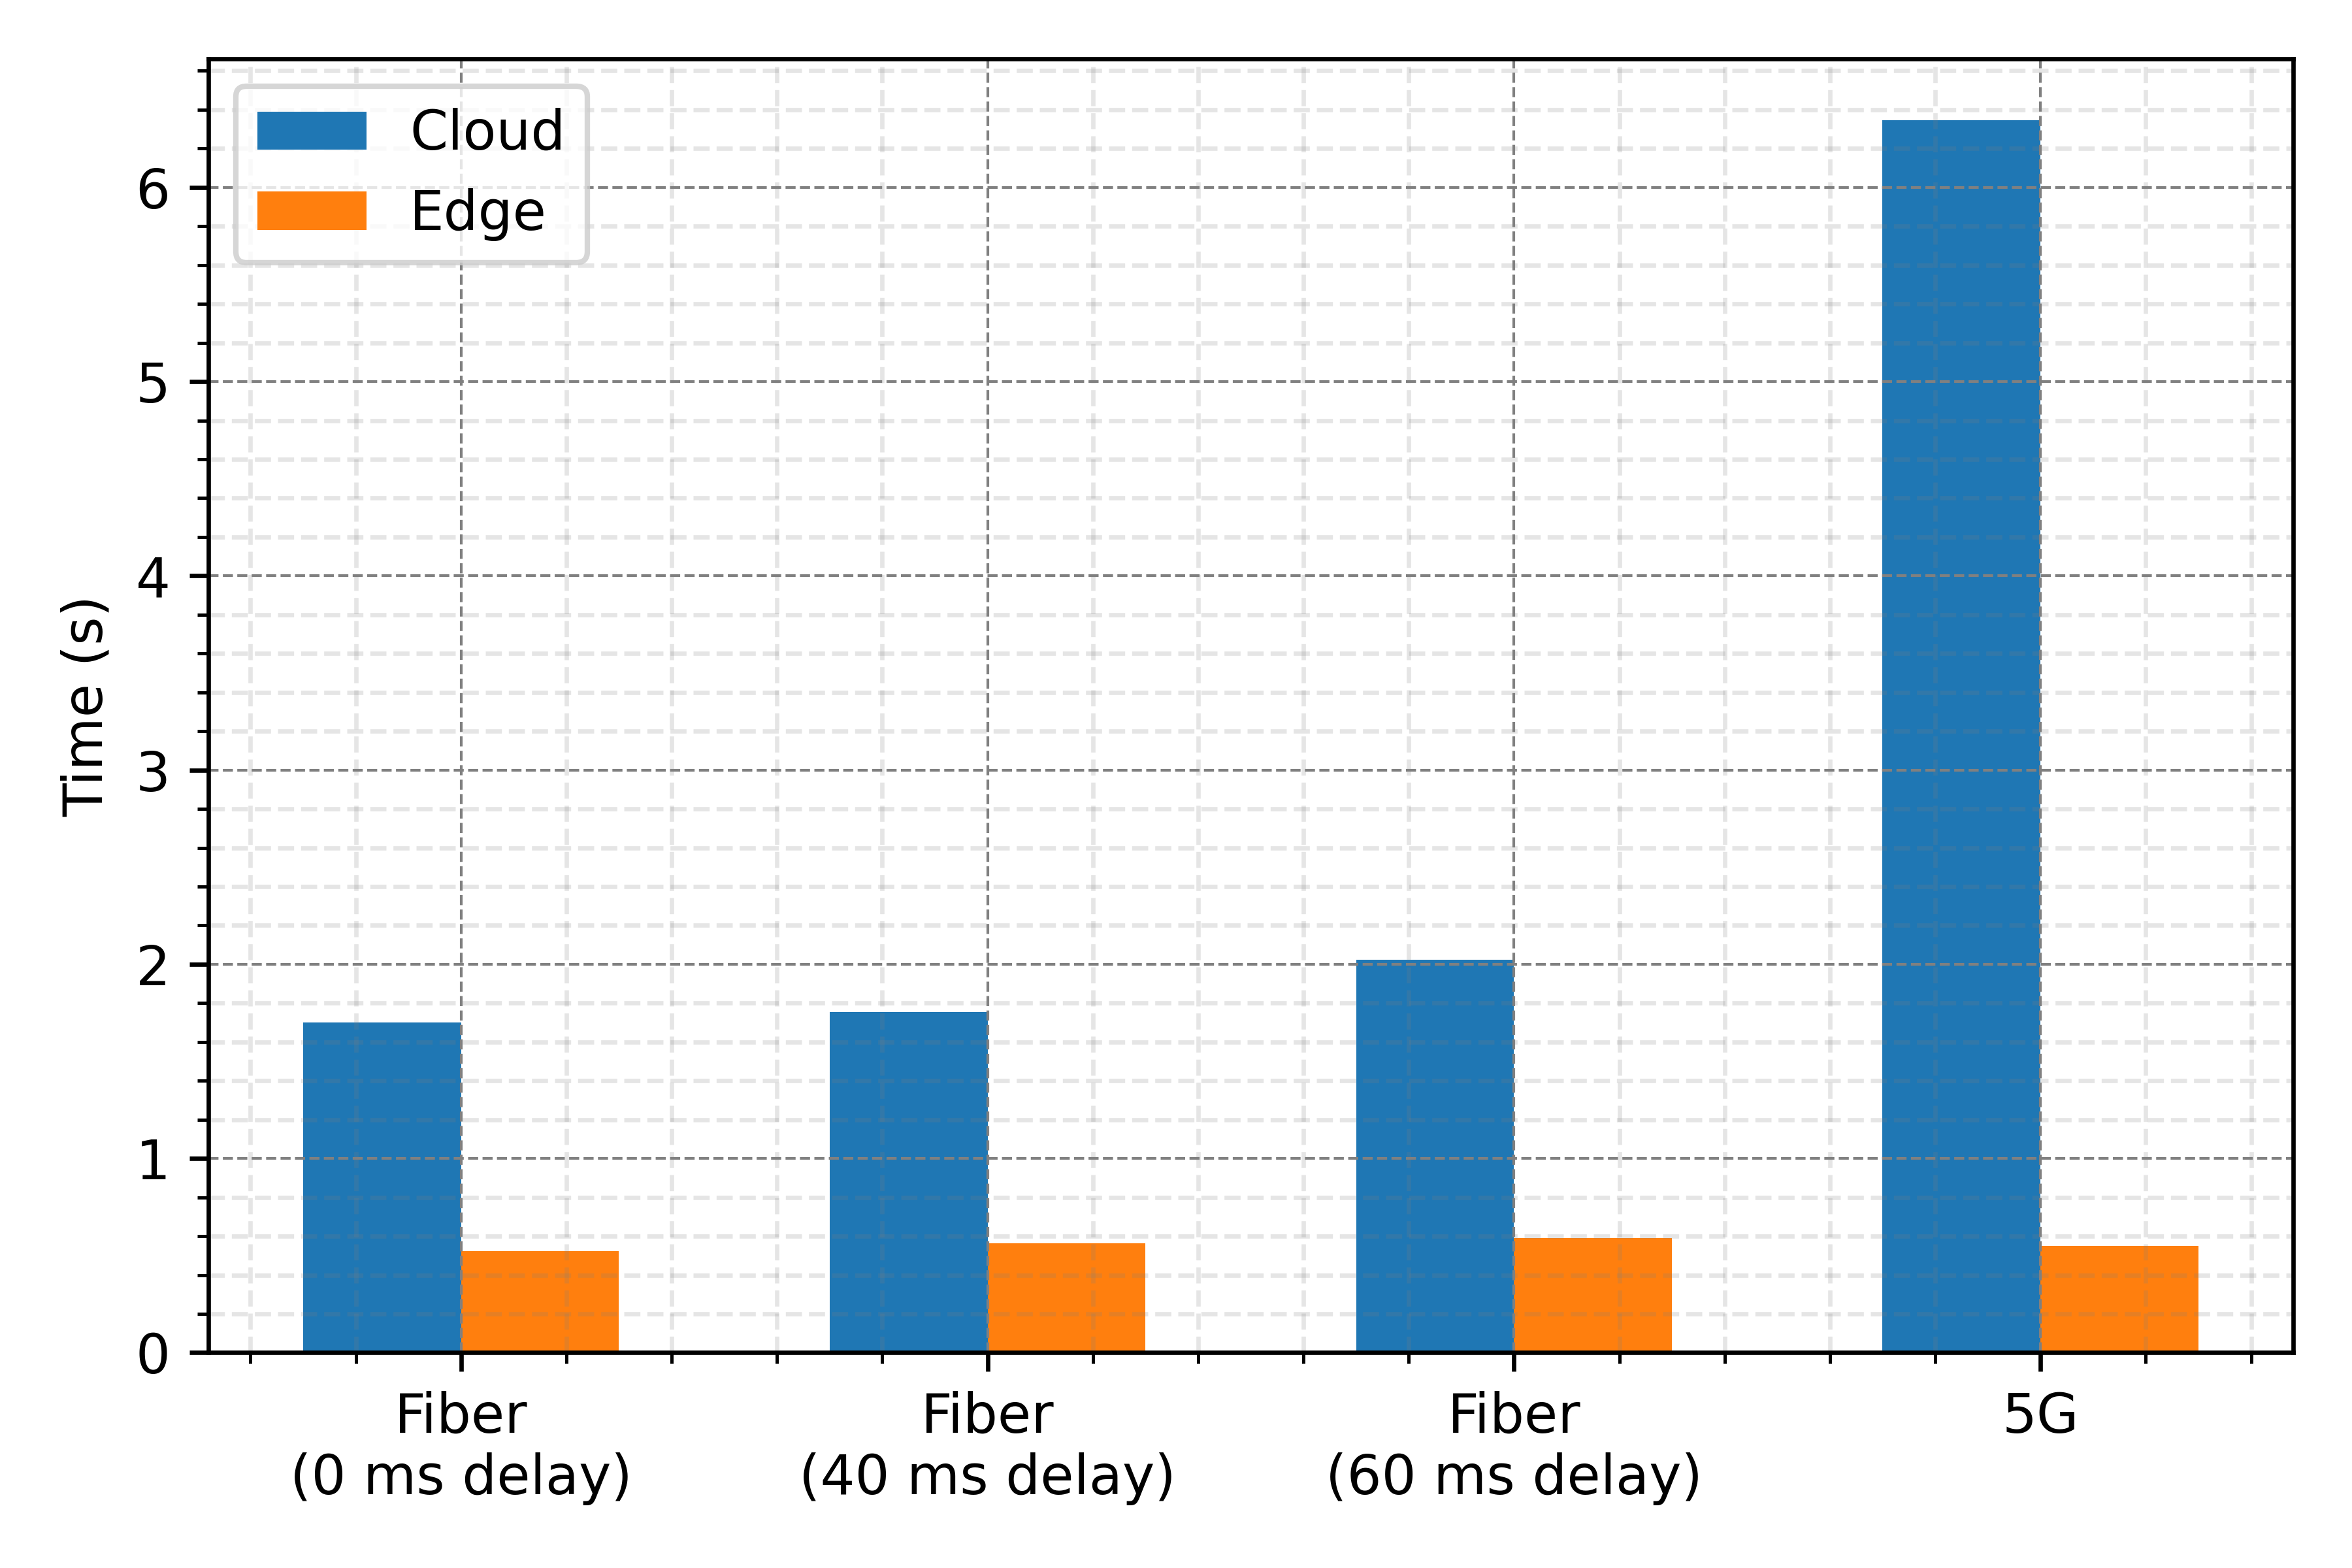
In order to demonstrate the performance of running services in the edge or in the cloud of the infrastructure, we performed a specific scenario of people detection in the road through video cameras [22]. Figure 27 depicts the architecture of this scenario: a person (hereby considered as a \acvru) is approaching a crosswalk; next to the \acvru there is a Smart Lamp Post equipped with a video camera, capturing images from that area. The connectivity between the Smart Lamp Post and the Internet is assured by two ways. Following a traditional approach, the Smart Lamp Post is connected to the Internet through dark fiber. Alternatively, to consider some situations where the installation of dark fiber is too expensive, we assume that a 5G network connects the lamp post to the Internet. We evaluated this architecture in a real scenario with real users and vehicles in the area. The 5G technology is the same pre-commercial network as before.
Figure 28 compares the detection being processed in the edge and in the cloud with TCP packets. For each bar, the results were obtained by adding the delays of each of the steps that make up the solution flow: the capture delay from the camera becoming available at the Nvidia Jetson; the detection module delay; and also the communication delay between the edge and the cloud. The difference between the results on the edge and the cloud is noticeable, with both the processing and the communication times showing up a strong reduction in the edge-based variant. In this edge approach, only a notification with the detection results (with a length of 41 data bytes) is sent to the cloud. In this case, comparing the performance of the 5G network with the usage of fiber, these delays are now very close. This result is relevant if the 5G option is used preferably due to the stronger flexibility on the positioning of the video camera throughout the city.
VIII Use Cases
To demonstrate the potential of the communication, computation and sensing platform presented in the ATCLL, we demonstrate a set of different use cases, targeting different verticals ranging from mobility characterization up to collision avoidance and safety of VRUs, including also the assessment of new communication technologies (mmWave) and communication paradigms (such as Informaction Centric Networks - ICNs).
Use-case 1: Mobility characterization
Managing traffic can be a difficult task. Traffic jams and parking difficulties are some of the problems that citizens can face in an urban scenario. To help city managers to improve urban mobility, the visualization of vehicle data on the map is critical.
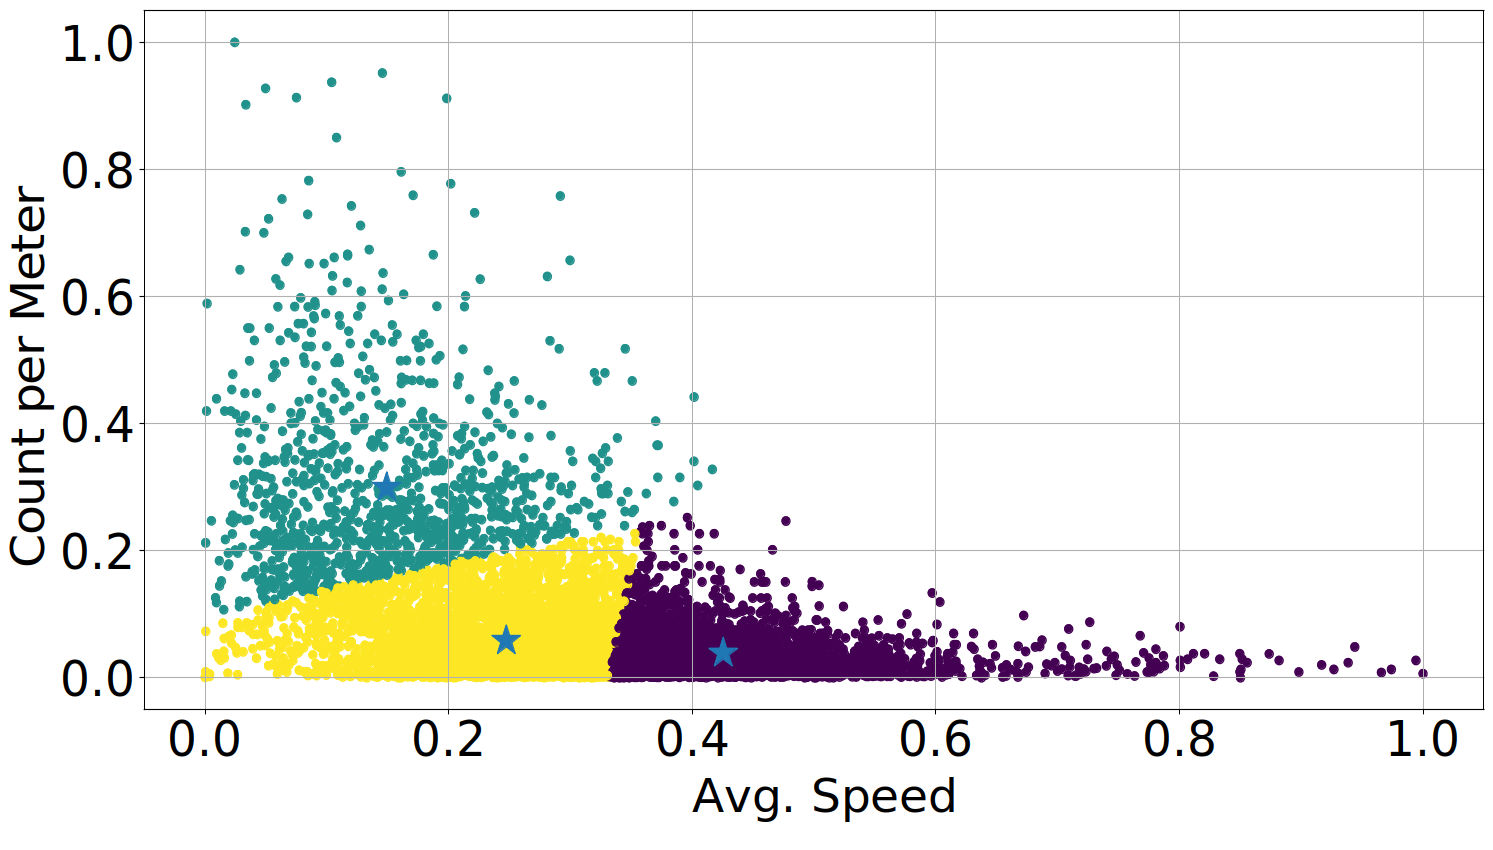
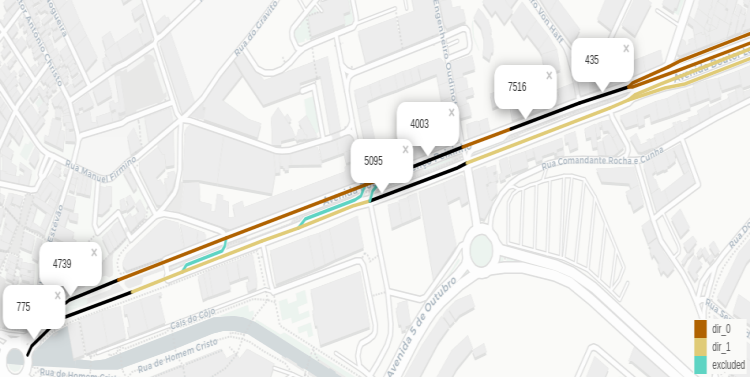
To study traffic congestion, we created a model based on the speed and the count of vehicles per meter [23]. This information is given by the CAM messages information from the connected buses. Using clustering techniques we detect different levels of congestion as depicted in Figure 29(a). The cluster with a higher level of congestion has the highest count per meter values and lower speeds. We mapped this information into road segments, as shown in Figure 29(b). The highest level congestion zones are the identified segments. Thus, it is possible to understand traffic congestion, and identify temporal and spatial patterns.

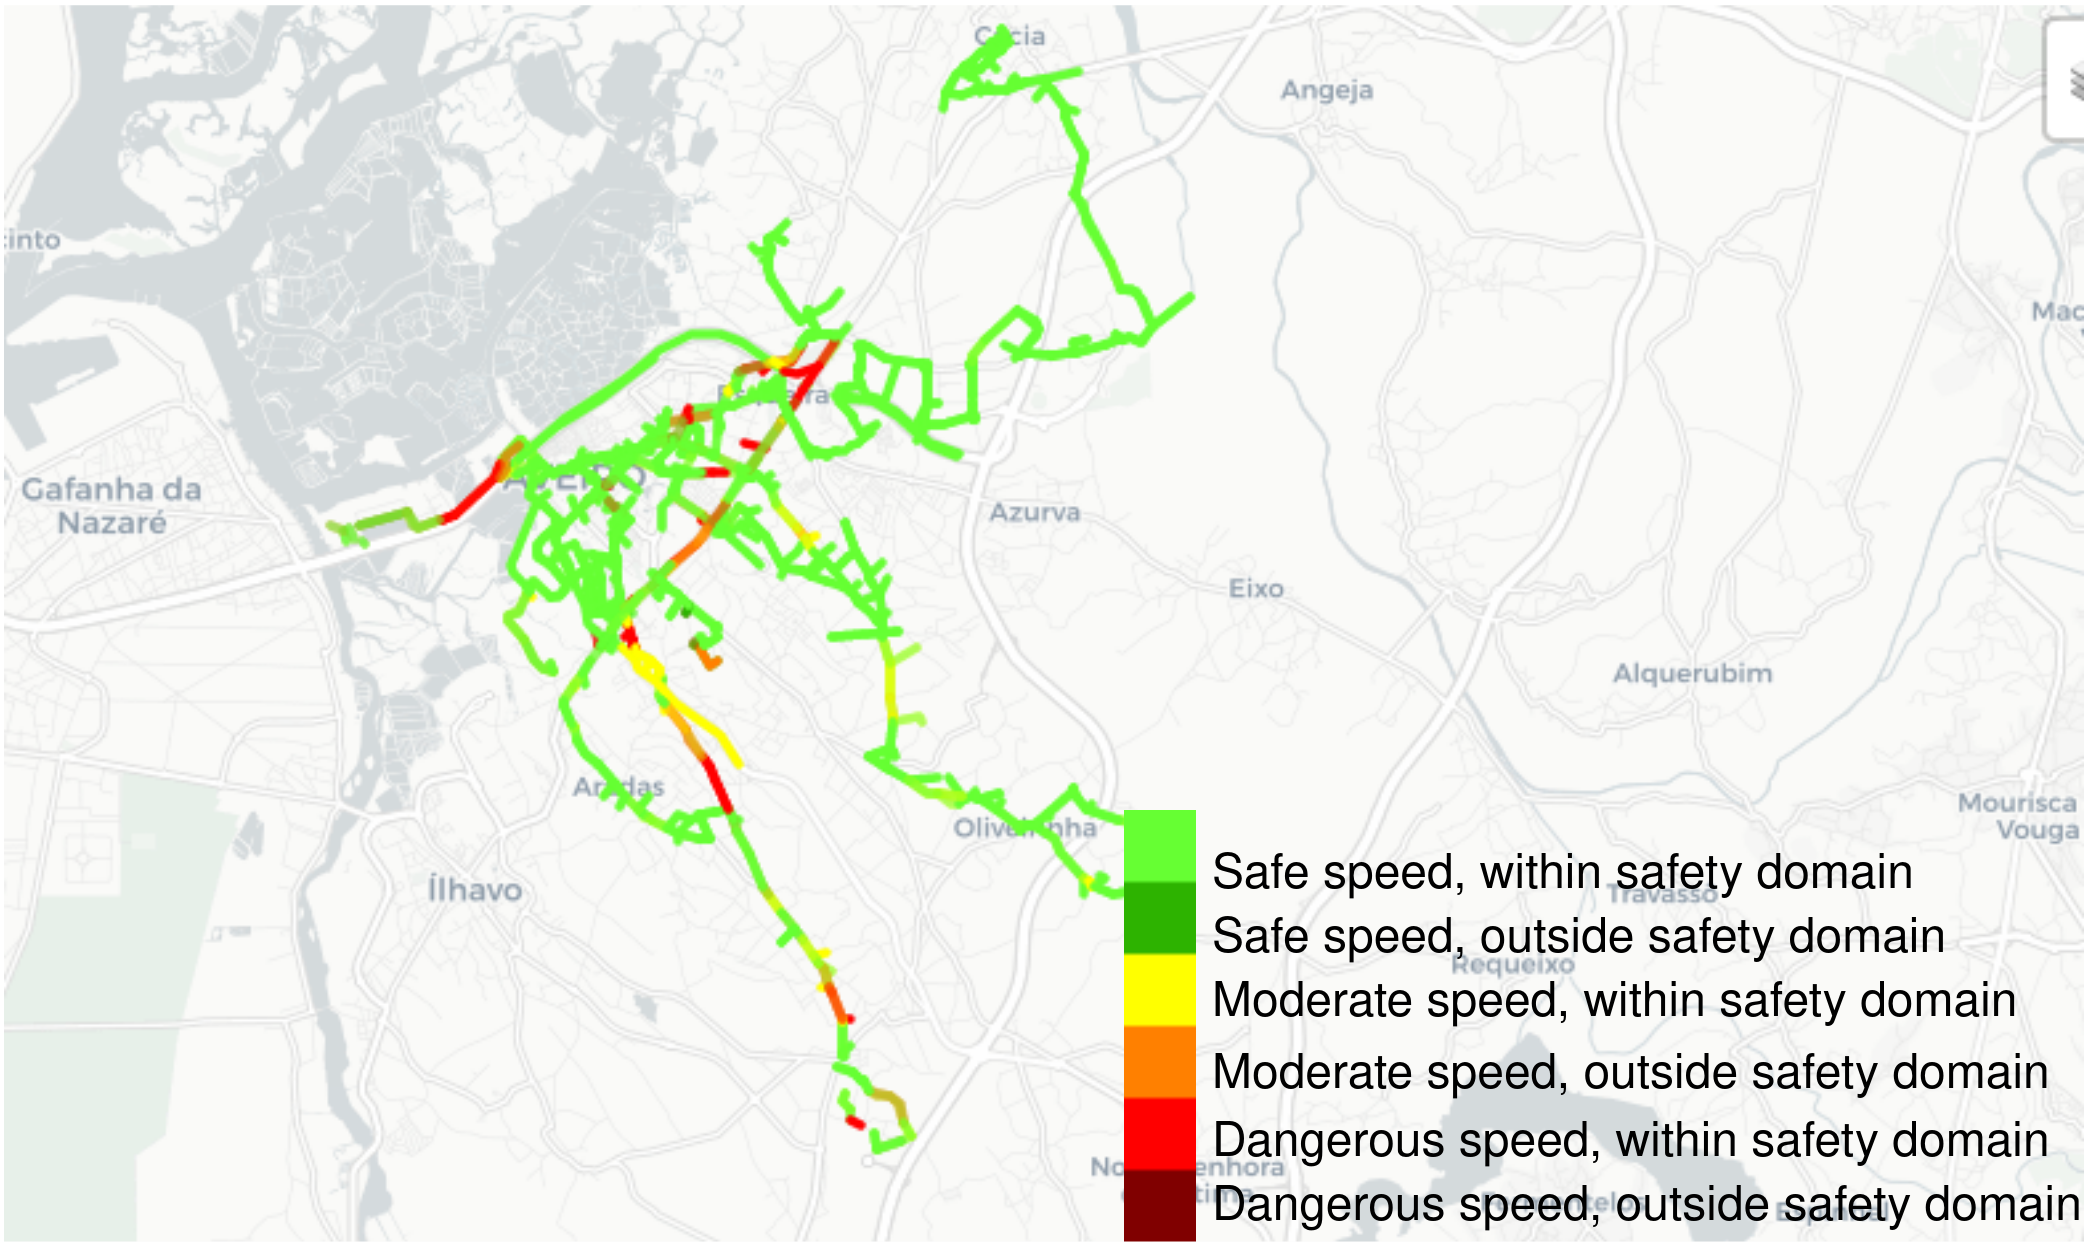
Unsafe driving behavior can lead to road accidents. The identification of problematic road segments and zones becomes essential to help city managers to improve road safety. Through the mobility data, we proposed a model to classify the driving behavior [24], taking into account the speed of the vehicle, the speed limit, the acceleration, and the road friction. Figure 30 contains the six created categories: the speed indicates if the legal speed limits are respected; regarding safety, stating ”within safety domain” means that no sudden changes in the acceleration were measured, in opposition to ”outside the safety domain”, meaning sudden accelerations or decelerations were performed.
Use-case 2: Collision avoidance with vulnerable road users
vru are particularly susceptible to accidents with vehicles. To minimize potential collisions, a system capable of detecting potential accidents was developed [25]. Figure 31 shows the scenario where a vehicle and a pedestrian are in a situation of a potential collision. The pedestrian (\acvru) is an \acits-s through the smartphone and can be notified about an imminent accident. The vehicle is also notified through its \acobu. Thus, they can adopt strategies to solve the situation (either slowing down, braking, changing direction, among other actions). To improve accuracy, the system was developed considering the data fusion from several edge nodes — traffic radar, camera detection, vehicles, and the \acpvru own smartphones.
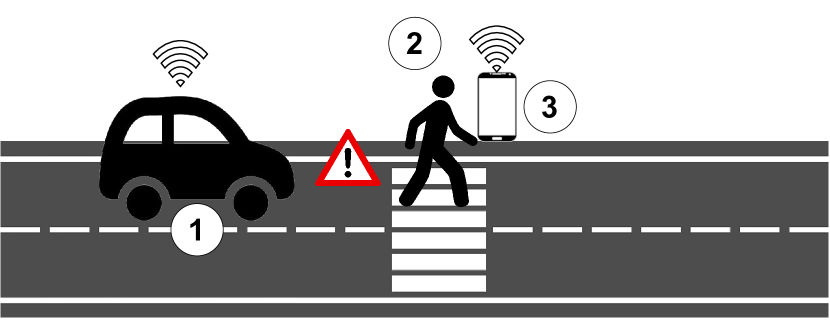
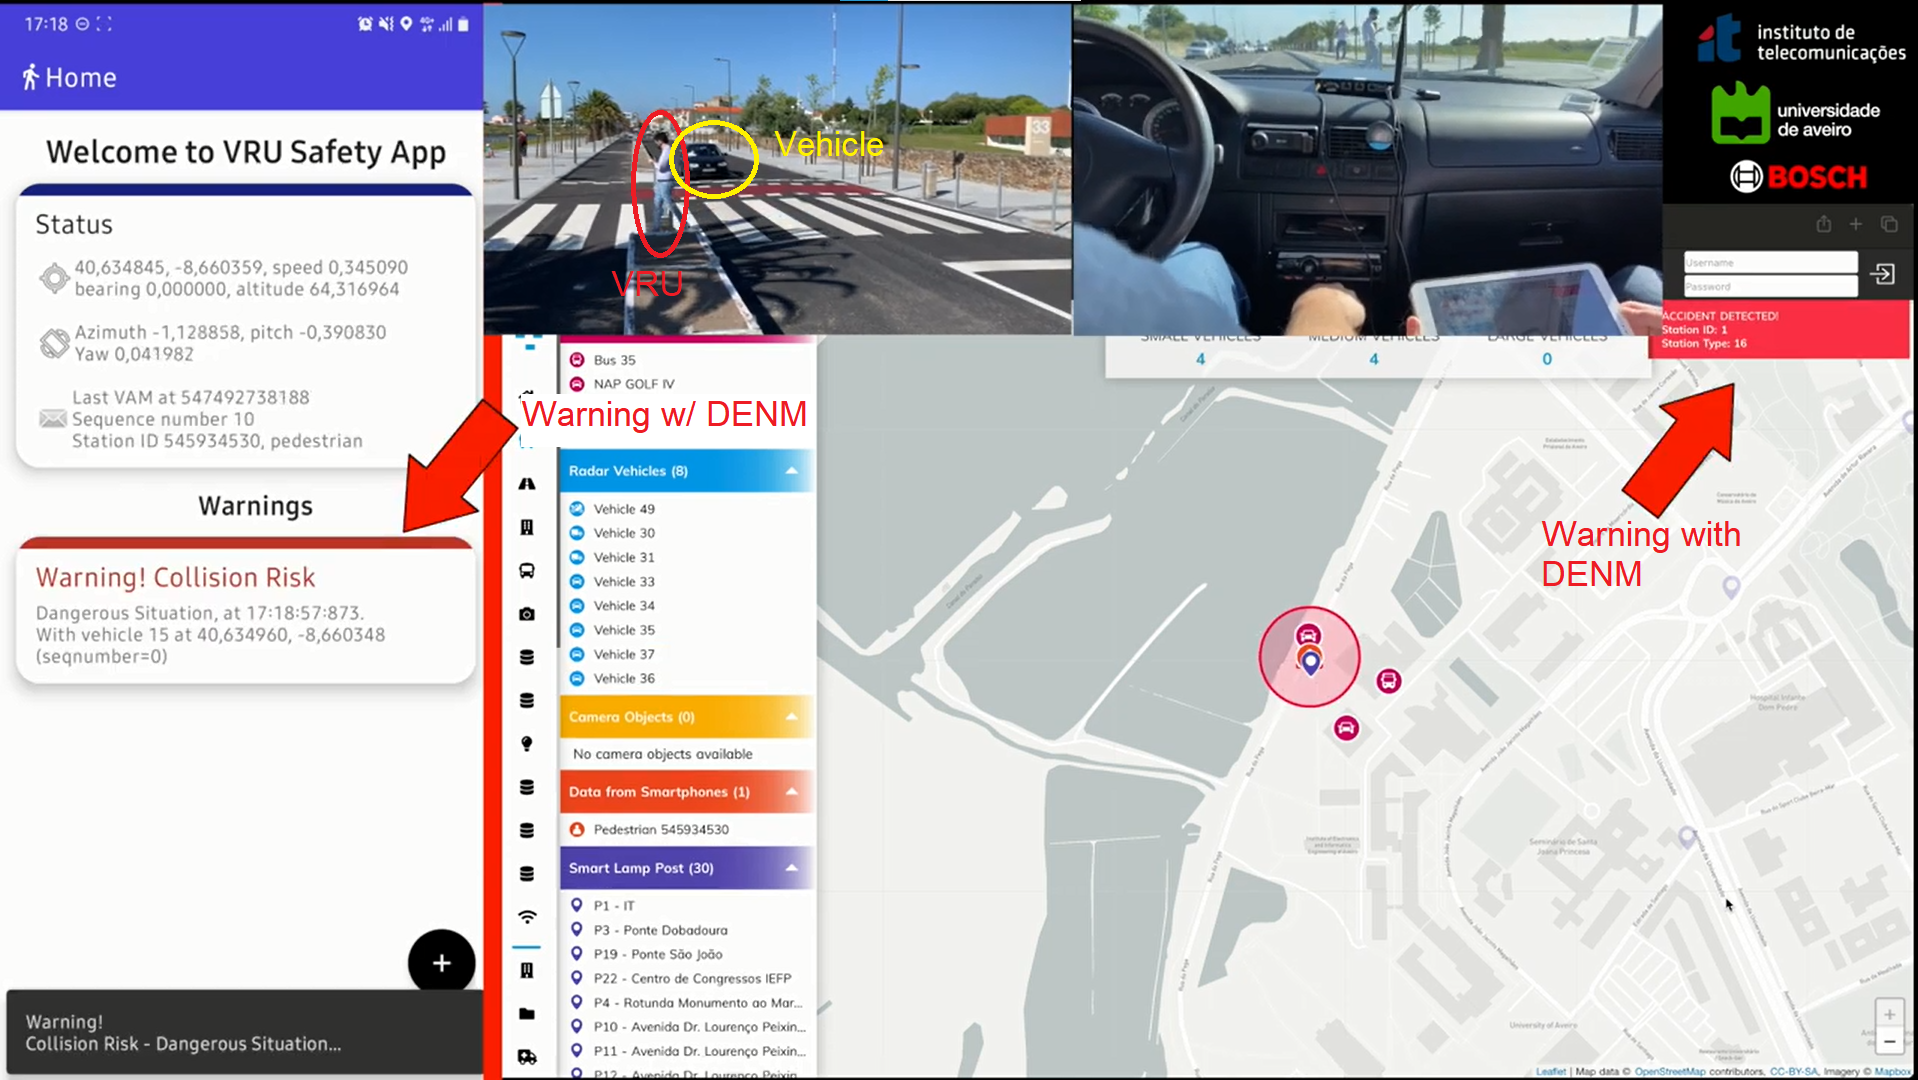
Figure 32 presents results of a real test, showing the overall end-to-end operation of the system, and that the system is capable of detecting the potential collisions, and warn both the \acvru and vehicle, through the \acvru \acits-s smartphone application and the \acatcll dashboard, respectively.
Use-case 3: Emergency Vehicles communication
Nowadays, when an \acev responds to an emergency, it alerts the road user of its presence through sound and light. However, road users can only detect its presence when the \acev is nearby, making it difficult to clear the road as quickly and safely as needed without interfering with the \acev course. To minimize the delay in the \acev route, a system that automatically alerts road users near an \acev through the dissemination of \acpdenm was developed. Figure 33 shows a set of messages sent to alert road users near an \acev.
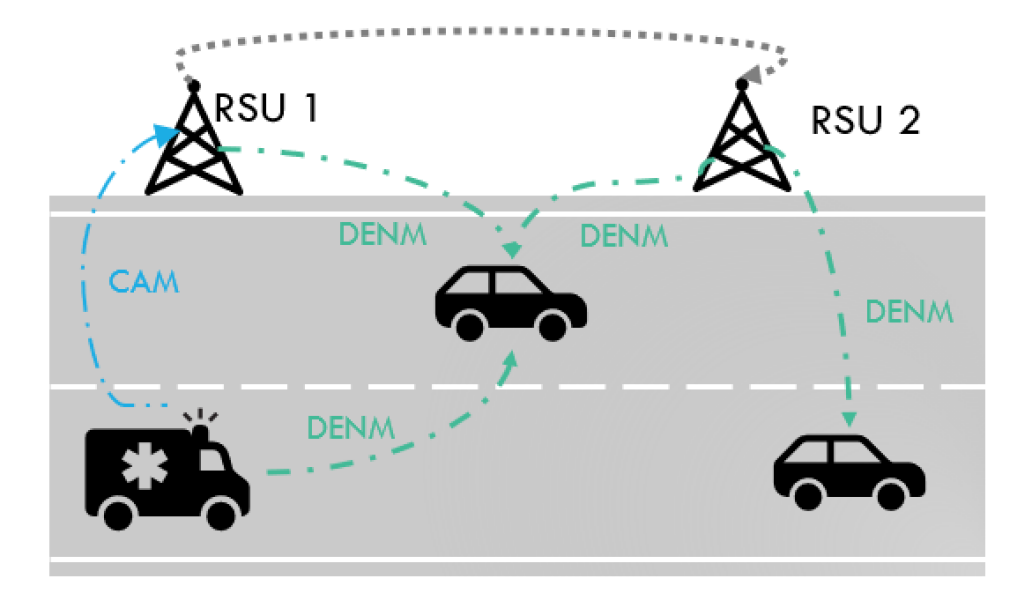
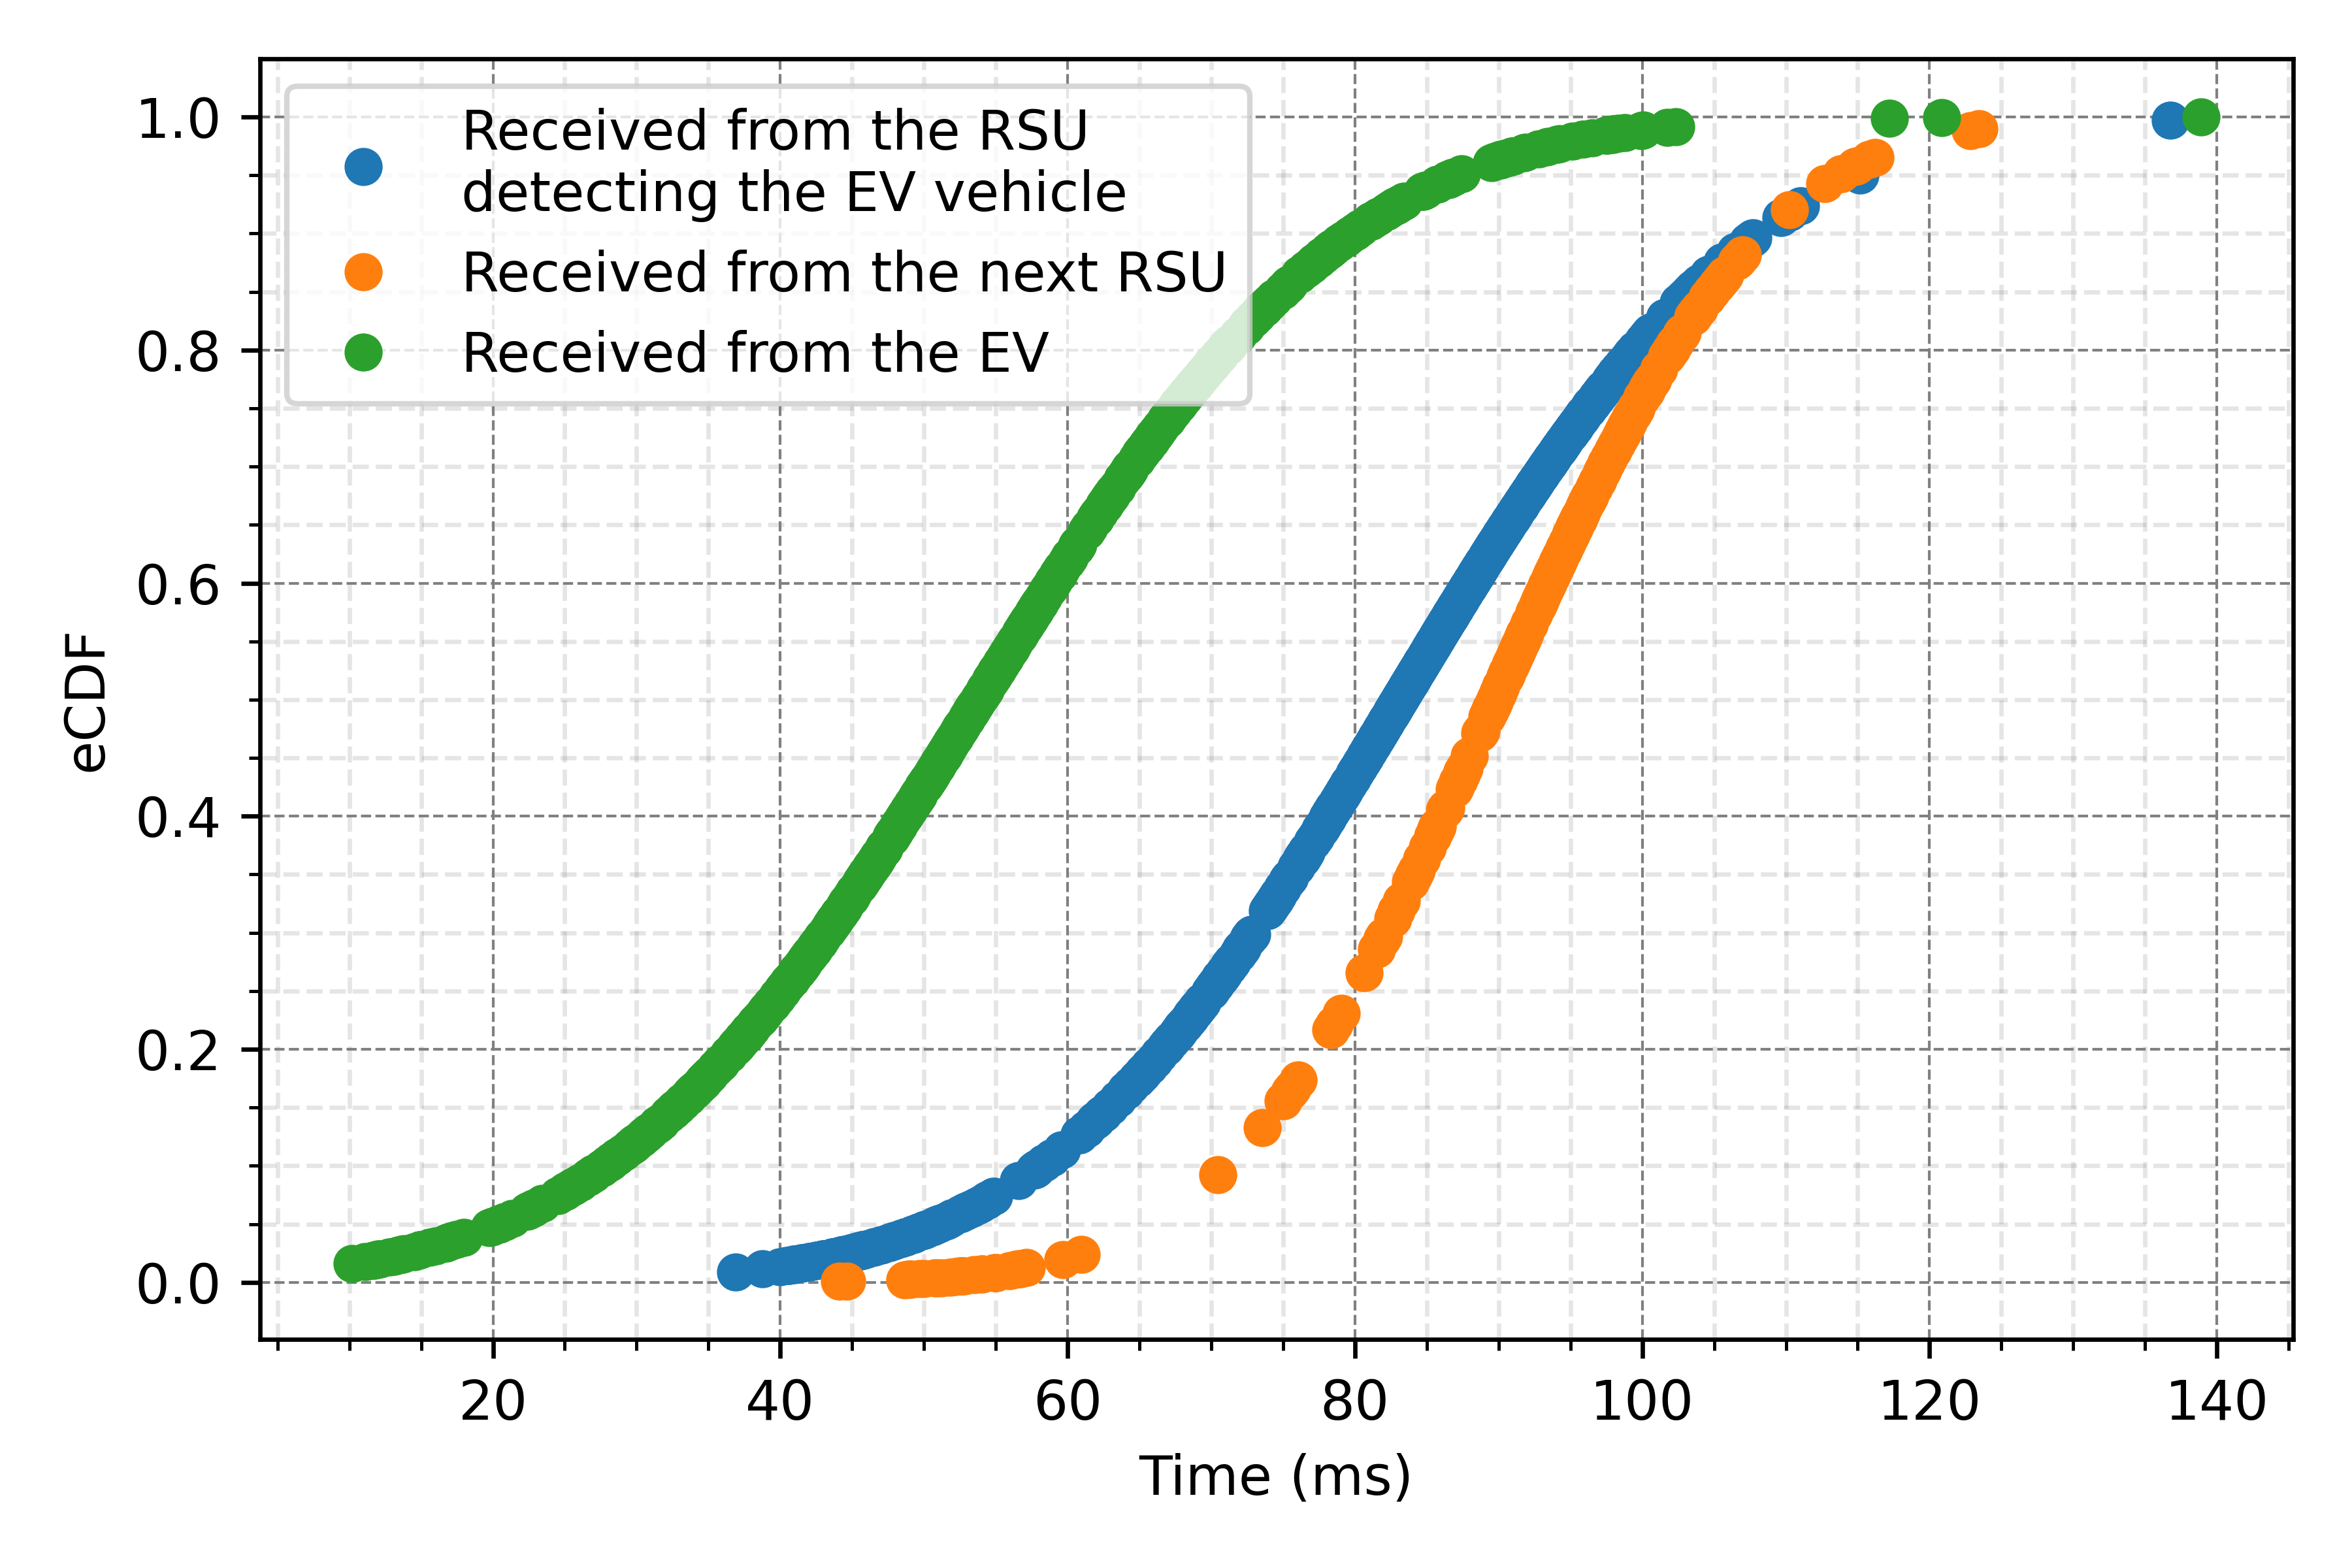
Tests in the ATCLL were performed to evaluate the system designed for this use case. One of the metrics evaluated in those tests was the delay time between the detection of an \acev and the reception of a \acdenm by other road users. Figure 34 represents the empirical cumulative distribution function of the system’s total delay time for three different \acdenm transmitters: the \acev, the \acrsu detecting the \acev (e.g. \acrsu 1 of Figure 33), and the upcoming \acrsu (e.g. \acrsu 2 of Figure 33).
When the \acev sends the \acdenm, it obtains the lowest delay of the three cases; however, it also obtains the smallest delivery range. On the other hand, for the case where the \acrsu is responsible for the \acdenm transmission, both the range and the delay time increase. In the worst case, i.e., when it is the upcoming \acrsu to send the \acdenm, it is received with a maximum delay of 108 ms (in 90% of the cases) and a median time of 89 ms.
In addition to warning messages sent to the road users, the \acev can also receive real-time information about highly congested areas from the infrastructure. This will allow the \aclpev to avoid congested areas, improving its response time.
In the future, we are hoping to expand this emergency use-case from a vehicle’s communication scale to a full-city-scale, where \actsn nodes [27] are also expected to allow latency- and jitter-strict emergency communications to happen, bringing the time concept towards our infrastructure.
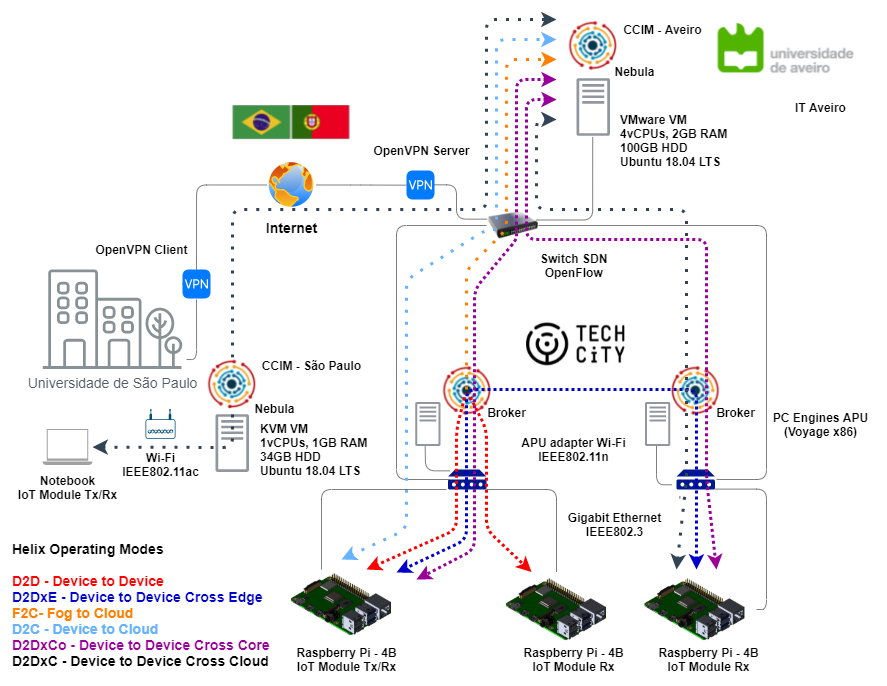
Use-case 4: Industrial Internet-of-Things to cloud continuum
The \aciiot is one of the most demanding \aciot applications. The integration of industries in the context of smart cities and other smart environments, allied with new communication technologies such as 5G, brings a new horizon of possibilities and new requirements. To attend this type of application, we studied the integration of the Helix Multi-layered \aciot platform and its operating modes into the \acatcll, showcasing a real-world deployment [28]. The Helix Multi-layered platform was deployed and evaluated in this city platform to identify its potential to support services and applications that require operation in an edge environment, as depicted in Figure 35.
Use-case 5: mmWave backhaul research
Millimeter-wave (mmWave) could be seen as an attractive option for the \aciab. Due to the capability to support multi-gigabit-per-second data rates, the technology allows the reduction of the deployment expenses of fiber optics, with the introduction of dense cell deployments. However, the use of higher frequencies (e.g., V-E Band) is not idle by chance, mmWave communications suffer from strong path loss, and rain atmospheric propagation absorption, making them only suitable for communication in short and \aclos communications. The advances with the introduction of small antenna arrays allow the use of high dimensional and directionally steerable beams, that are formed by sophisticated beamforming techniques. Such techniques allow to ameliorate the propagation characteristics, but with a high cost in complexity.
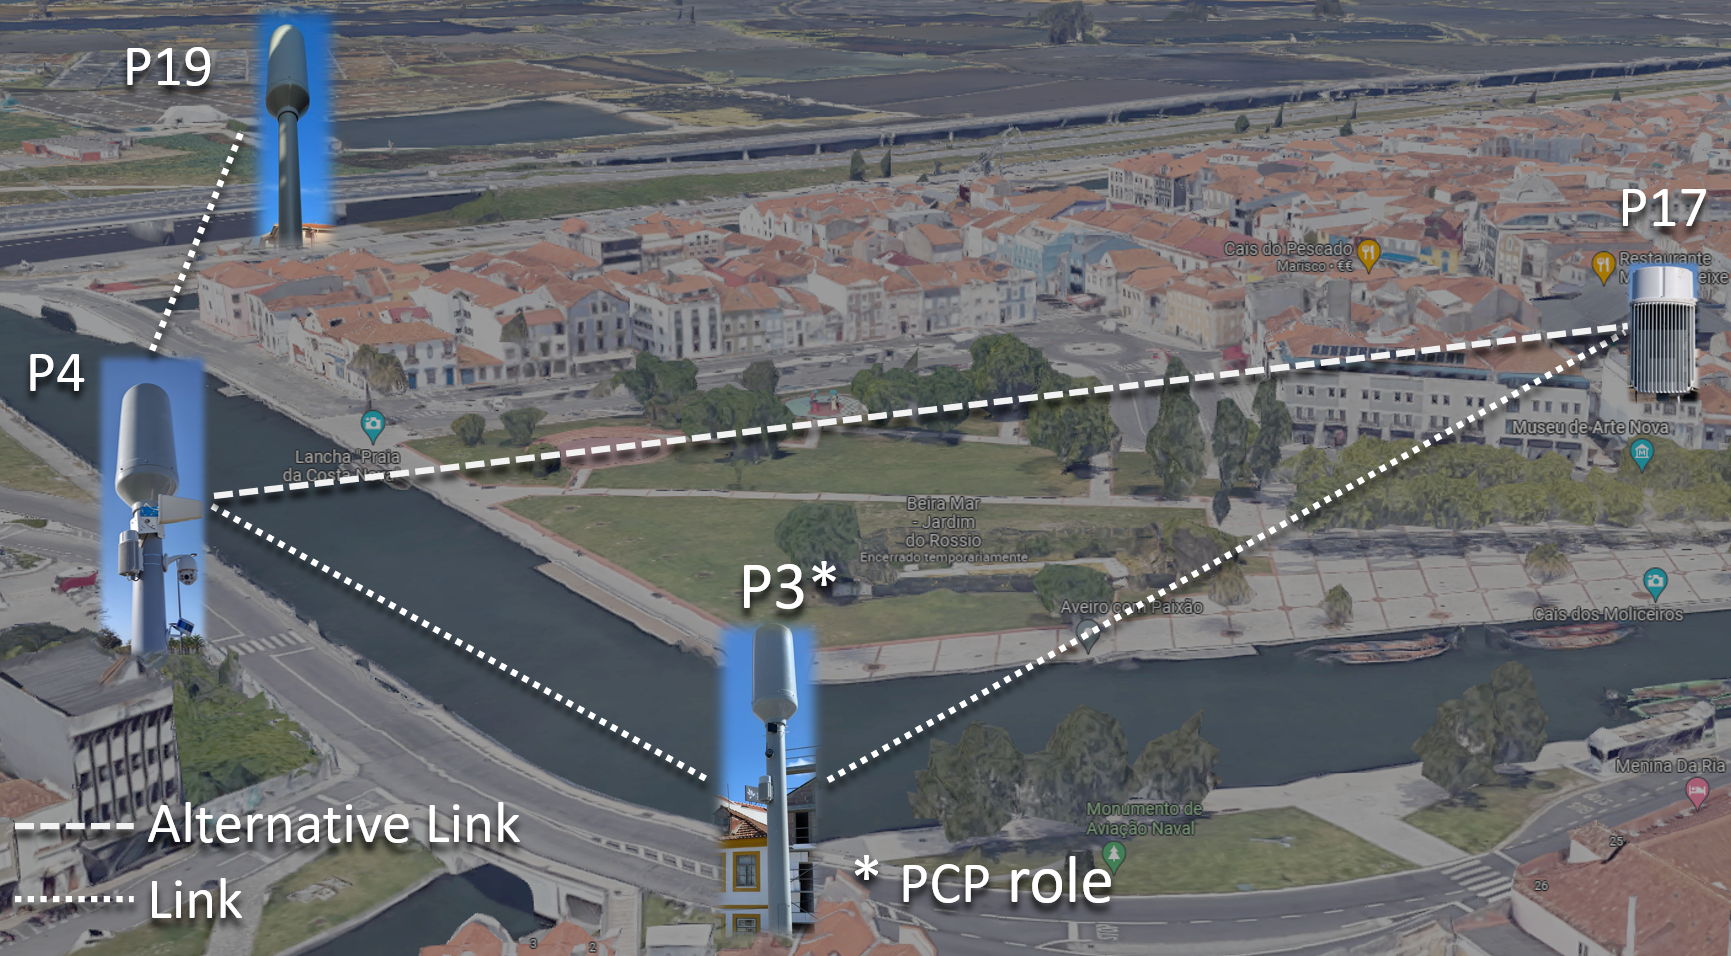
The challenges of the mmWave could be found at various levels of the protocol stack, and usually differ from other wireless technologies, because of their need for \aclos. Thus, in this context, the \acatcll presents an ideal research support platform to evaluate and propose new mechanisms capable to deal with the lossy nature introduced by the mmWave communications (e.g., link quality assessment, rate adaptation and bufferbloat in the transport layers). In this context, the mmWave deployed in the ATCLL (Figure 36) has contributed to the validation of several research proposals in collaboration with other research groups and companies. Regarding the modeling of blockage in the simulation environments, the work developed in [29] presents a new blockage model that allows the modeling of blockage scenarios in the IEEE802.11ad standard. In this research proposal, the city testbed was used to compare a real scenario with the blockage model, validating it in similar conditions. Another proposal is presented in [30], when \acac-rlnc techniques are used to improve the UDP protocol, to support \acllc and \acurllc services under the lossy links.
Use-case 6: ICN deployment
The \acicn paradigm is considered to be one of the most promising candidates to overcome the drawbacks of host-centric architectures whose main flaws are in large-scale mobile distributed wireless environments such as \aciot scenarios due to node mobility, dynamic topologies and intermittent connectivity [31]. Despite the touted virtues of the \acicn paradigm, and its several implementations, such as the \acndn, it is rare to find implementations or testbeds where the paradigm can be tested under the same conditions as networks based on Internet protocols. Even recent works such as [32, 33, 34] discuss experiments in controlled environments. Furthermore, as far as we know, there is no \acicn available on an extensive wireless communication infrastructure installed in a smart city.
In this way, we have made a deployment of an \acndn solution, designed for mobile IoT environments [35, 36], over the \acatcll communication infrastructure and assessed its performance in a content dissemination scenario. Two \acndn containers were installed on two network elements of the ATCLL, in a \acrsu and in an \acpobu, as illustrated in Figure 37.
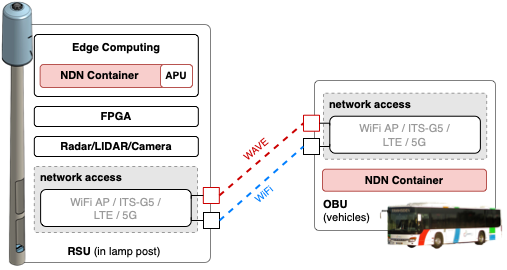
To demonstrate the testbed flexibility in hosting multiple protocols, we compared the transmission process, regarding the transmission delay and number of NDN packets, when sending a 6MB file (fragmented in 1403 \acndn chunks) using ITS-G5, WiFi, and both technologies simultaneously, always using the \acndn paradigm.
| Tech | Time (s) | outInts | inData |
|---|---|---|---|
| ITS-G5 | 25 | 1403 | 1403 |
| WiFi | 82 | 1403 | 1403 |
| Both | 42 (14/42) | 1422 (711/711) | 1422 (711/711) |
Table I shows that the simultaneous transmission by ITS-G5 (14s) and WiFi (42s) has its performance marked by the slower one. However, the option of the two technologies opens up a range of new heuristics to be applied in the \acndn forwarder module, the one responsible to select the outgoing interface of data chunks.
IX Conclusions
The large majority of existing contributions related to connectivity in different scenarios, including mobile scenarios with people, bicycles, and vehicles still rely on numerical computations and computer simulations, not addressing the impairments of real environments.
In this article we present a living lab platform that allows the support of research activities in a real environment with real users, making them a beneficial part of the research. ATCLL is a facility deployed as a city-scale testbed with a large number of Internet-of-Things devices, with communication, sensing and computing capabilities, built on fiber and mmWave links, integrating a communication network with radio terminals, multiprotocol, spread throughout the city. The ATCLL supports a wide range of services and applications: \aciot, intelligent transportation systems and assisted driving, environmental monitoring, emergency and safety, and more.
The data of the platform is gathered through edge computing and a datacenter where the services, data platform, apps, 5G core and network functions are deployed in virtual machines running in the cloud. The presented results demonstrate a dashboard with visibility of real-time data and examples of data collected (traffic radar, camera and WiFi sniffing). Performance results were also plotted, demonstrating the coverage of the communication technologies, the usage of edge computing and the implementation of the \acsdn-based vehicular network. Finally, several use cases were tested in the infrastructure, in particular mobility characterization, collision avoidance with \acpvru, emergency vehicles communication, a data platform for industrial internet-of-things to cloud continuum, mmWave backhaul research and an \acicn deployment.
This facility and platform will be further improved and enhanced by federating it, a process which is already taking part as current work.
Acknowledgements
We would like to thank André Mourato and Tomás Freitas for the involvement in the development of the mobility services; Ricardo Torres and João Milheiro for the deployment of the spectral probes and SDR units; Alexandre Figueiredo and Tânia Ferreira for the research activities described in Use-case 5; and Luis Gameiro and Gustavo Amaral for the experiments described in Use-case 6.
This work has been funded by the European Regional Development Fund – ERDF, included in the “Urban Innovative Actions” programme, through project Aveiro STEAM City (UIA03-084).
References
- [1] C. Harrison, B. Eckman, R. Hamilton, P. Hartswick, J. Kalagnanam, J. Paraszczak, and P. Williams, “Foundations for Smarter Cities,” IBM Journal of Research and Development, vol. 54, no. 4, pp. 1–16, 2010.
- [2] C. Veeckman, D. Schuurman, S. Leminen, and M. Westerlund, “Linking living lab characteristics and their outcomes: Towards a conceptual framework,” Technology Innovation Management Review, vol. 3, pp. 6–15, 12/2013 2013. [Online]. Available: http://timreview.ca/article/748
- [3] T. Ojala, “Open urban testbed for ubiquitous computing,” in 2010 International Conference on Communications and Mobile Computing, vol. 1, 2010, pp. 442–447.
- [4] L. Sanchez, L. Muñoz, J. A. Galache, P. Sotres, J. R. Santana, V. Gutierrez, R. Ramdhany, A. Gluhak, S. Krco, E. Theodoridis et al., “SmartSantander: IoT experimentation over a smart city testbed,” Computer Networks, vol. 61, pp. 217–238, 2014.
- [5] J. Lanza, L. Sánchez, L. Muñoz, J. A. Galache, P. Sotres, J. R. Santana, and V. Gutiérrez, “Large-scale mobile sensing enabled internet-of-things testbed for smart city services,” International Journal of Distributed Sensor Networks, vol. 2015, 2015.
- [6] S. Latre, P. Leroux, T. Coenen, B. Braem, P. Ballon, and P. Demeester, “City of things: An integrated and multi-technology testbed for IoT smart city experiments,” in Smart Cities Conference (ISC2), 2016 IEEE International. IEEE, 2016, pp. 1–8.
- [7] V. M. Larios, L. Gomez, O. B. Mora, R. Maciel, and N. Villanueva-Rosales, “Living labs for smart cities: A use case in guadalajara city to foster innovation and develop citizen-centered solutions,” in 2016 IEEE International Smart Cities Conference (ISC2), 2016, pp. 1–6.
- [8] I. Negreiros, A. C. C. Francisco, F. H. Fengler, G. Faria, L. G. P. Pinto, M. Tolotto, R. B. Rogoschewski, R. R. Romano, and R. S. Netto, “Smart campus® as a living lab on sustainability indicators monitoring,” in 2020 IEEE International Smart Cities Conference (ISC2), 2020, pp. 1–5.
- [9] B. Braem, S. Latre, P. Leroux, P. Demeester, T. Coenen, and P. Ballon, “Designing a smart city playground: Real-time air quality measurements and visualization in the city of things testbed,” in 2016 IEEE International Smart Cities Conference (ISC2), 2016, pp. 1–2.
- [10] C. Ameixieira, A. Cardote, F. Neves, R. Meireles, S. Sargento, L. Coelho, J. Afonso, B. Areias, E. Mota, R. Costa, R. Matos, and J. Barros, “Harbornet: a real-world testbed for vehicular networks,” IEEE Communications Magazine, vol. 52, no. 9, pp. 108–114, 2014.
- [11] P. M. Santos, J. G. P. Rodrigues, S. B. Cruz, T. Lourenço, P. M. d’Orey, Y. Luis, C. Rocha, S. Sousa, S. Crisóstomo, C. Queirós, S. Sargento, A. Aguiar, and J. Barros, “PortoLivingLab: An IoT-Based Sensing Platform for Smart Cities,” IEEE Internet of Things Journal, vol. 5, no. 2, pp. 523–532, 2018.
- [12] J. Ferreira, J. Fonseca, D. Gomes, J. Barraca, B. Fernandes, J. Rufino, J. Almeida, and R. Aguiar, “Pasmo: An open living lab for cooperative its and smart regions,” in 2017 International Smart Cities Conference (ISC2), 2017, pp. 1–6.
- [13] C. Antonelli, D. Cassioli, F. Franchi, F. Graziosi, A. Marotta, M. Pratesi, C. Rinaldi, and F. Santucci, “The city of l’aquila as a living lab: the incipict project and the 5g trial,” in 2018 IEEE 5G World Forum (5GWF), 2018, pp. 410–415.
- [14] I. Zajc, R. Sernec, G. Lenart, and A. Pucihar, “Autonomous mobility and user perception: A case of city as a lab in slovenia,” in 2020 43rd International Convention on Information, Communication and Electronic Technology (MIPRO), 2020, pp. 1843–1847.
- [15] M. Silva, P. Teixeira, C. Gomes, D. Dias, M. Luís, and S. Sargento, “Exploring software defined networks for seamless handovers in vehicular networks,” Vehicular Communications, vol. 31, p. 100372, 2021.
- [16] G. Vítor, P. Rito, and S. Sargento, “Smart city data platform for real-time processing and data sharing,” in 2021 IEEE Symposium on Computers and Communications (ISCC), 2021, pp. 1–7.
- [17] R. Oliveira, L. Guardalben, M. Luis, and S. Sargento, “Multi-technology data collection: Short and long range communications,” in 2017 IEEE 86th Vehicular Technology Conference (VTC-Fall), 2017, pp. 1–6.
- [18] A. Voronov, Zeverin, and D. Heuven, “geonetworking: Vehicle adapter (version v1.0.0),” 2016.
- [19] J. Dias, A. Cardote, F. Neves, S. Sargento, and A. Oliveira, “Seamless horizontal and vertical mobility in VANET,” in 2012 IEEE Vehicular Networking Conference (VNC), 2012, pp. 226–233.
- [20] J. Mendes, F. Neves, R. Matos, and S. Sargento, “Prediction-based connection manager for vehicular networks,” in 2015 IEEE Symposium on Computers and Communication (ISCC), 2015, pp. 353–358.
- [21] D. Dias, M. Luís, P. Rito, and S. Sargento, “A Software Defined Vehicular Network using Cooperative Intelligent Transport System Messages,” IEEE Transactions on Network and Service Management, 2022, submitted. [Online]. Available: https://www.dropbox.com/s/g6tob0lrg1m4dvq
- [22] G. Perna, R. Rosmaninho, H. Sampaio, P. Rito, M. Luís, and S. Sargento, “On the performance of 5g for cloud- and edge-based emergency services in smart cities,” in 2021 12th International Conference on Network of the Future (NoF), 2021, pp. 1–5.
- [23] A. Almeida, S. Brás, S. Sargento, and I. Oliveira, “Exploring bus tracking data to characterize urban traffic congestion,” Journal of Urban Mobility, 2022, submitted. [Online]. Available: https://www.dropbox.com/s/gl99b49pd0rqh6o
- [24] A. Almeida, S. Brás, S. Sargento, and I. Oliveira, “Using bus tracking data to detect potential hazard driving zones,” in Pattern Recognition and Image Analysis. Springer International Publishing, 2022, pp. 667–679. [Online]. Available: https://doi.org/10.1007%2F978-3-031-04881-4_53
- [25] P. Teixeira, S. Sargento, F. Castro, P. Rito, and M. Luís, “Awareness of Potentially Dangerous Situations for VRUs in a Smart City,” IEEE Transactions on Intelligent Transportation Systems, 2022, submitted. [Online]. Available: https://www.dropbox.com/s/962dsjgx39u0hrr
- [26] A. Figueiredo, P. Rito, M. Luís, and S. Sargento, “Mobility sensing and V2X communication for Emergency Services,” Mobile Networks and Applications, 2021, submitted. [Online]. Available: https://www.dropbox.com/s/ris89aec3p6xu4t
- [27] Y. Seol, D. Hyeon, J. Min, M. Kim, and J. Paek, “Timely survey of time-sensitive networking: Past and future directions,” IEEE Access, vol. 9, pp. 142 506–142 527, 2021.
- [28] F. H. Cabrini, F. V. Filho, P. Rito, A. B. Filho, S. Sargento, A. J. V. Neto, and S. T. Kofuji, “Enabling the industrial internet of things to cloud continuum in a real city environment,” Sensors, vol. 21, no. 22, p. 7707, 2021. [Online]. Available: https://doi.org/10.3390/s21227707
- [29] A. Figueiredo, T. Ferreira, D. Raposo, M. Luís, P. Rito, and S. Sargento, “On the Real Experimentation and Simulation Models for Millimeter-Wave,” IEEE Access, vol. 10, pp. 51 191–51 208, 2022.
- [30] E. Dias, D. Raposo, H. Esfahanizadeh, A. Cohen, T. Ferreira, M. Luís, S. Sargento, and M. Médard, “Millimeter-wave in milliseconds: Sliding window network coding outperforms rateless codes,” 2022. [Online]. Available: https://arxiv.org/abs/2205.00793
- [31] A. Djama, B. Djamaa, and M. R. Senouci, “Information-centric networking solutions for the internet of things: A systematic mapping review,” Computer Communications, vol. 159, pp. 37–59, 2020. [Online]. Available: https://www.sciencedirect.com/science/article/pii/S0140366419316901
- [32] A. Abane, M. Daoui, S. Bouzefrane, and P. Muhlethaler, “Ndn-over-zigbee: A zigbee support for named data networking,” Future Generation Computer Systems, vol. 93, pp. 792–798, 2019. [Online]. Available: https://www.sciencedirect.com/science/article/pii/S0167739X17303928
- [33] C. Papadopoulos, S. Shannigrahi, and A. Afanaseyv, In-Vehicle Networking with NDN. New York, NY, USA: Association for Computing Machinery, 2021, pp. 127–129. [Online]. Available: https://doi.org/10.1145/3460417.3483374
- [34] W. Yang, F. Wu, and K. Tian, High Performance Adaptive Video Streaming Using NDN WLAN Multicast. New York, NY, USA: Association for Computing Machinery, 2021, pp. 42–51. [Online]. Available: https://doi.org/10.1145/3460417.3482977
- [35] L. Gameiro, C. Senna, and M. Luís, “ndnIoT-FC: IoT Devices as First-Class Traffic in Name Data Networks,” Future Internet, vol. 12, no. 11, p. 207, Nov 2020.
- [36] D. Hernandez, L. Gameiro, C. Senna, M. Luís, and S. Sargento, “Handling Producer and Consumer Mobility in IoT Publish–Subscribe Named Data Networks,” IEEE Internet of Things Journal, vol. 9, no. 2, pp. 868–884, 2022.