A meta-analysis of the total economic impact of climate change
Abstract
Earlier meta-analyses of the economic impact of climate change are updated with more data, with three new results: (1) The central estimate of the economic impact of global warming is always negative. (2) The confidence interval about the estimates is much wider. (3) Elicitation methods are most pessimistic, econometric studies most optimistic. Two previous results remain: (4) The uncertainty about the impact is skewed towards negative surprises. (5) Poorer countries are much more vulnerable than richer ones. A meta-analysis of the impact of weather shocks reveals that studies, which relate economic growth to temperature levels, cannot agree on the sign of the impact whereas studies, which make economic growth a function of temperature change do agree on the sign but differ an order of magnitude in effect size. The former studies posit that climate change has a permanent effect on economic growth, the latter that the effect is transient. The impact on economic growth implied by studies of the impact of climate change is close to the growth impact estimated as a function of weather shocks. The social cost of carbon shows a similar pattern to the total impact estimates, but with more emphasis on the impacts of moderate warming in the near and medium term.
Keywords: climate change; weather shocks; economic growth; social cost of carbon
JEL codes: O44; Q54
url]http://www.ae-info.org/ae/Member/Tol_Richard
1 Introduction
Estimates of the total economic impact of climate change underpin the social cost of carbon, which determines the optimal rate of greenhouse gas emission reduction. The number of estimates of the total impact has risen rapidly in recent years, so that previous meta-analyses (Howard and Sterner, 2017, Nordhaus and Moffat, 2017, Tol, 2018) are now out of date. The literature comprises a wide range and seemingly incommensurate estimates of the effects of climate change and weather shocks. This paper reconciles different estimates and updates previous meta-analyses.
Studies of the economic impact of climate change use a range of methods—enumeration, elicitation, computable general equilibrium, econometrics—each with its pros and cons. Studies of the economic impact of weather are exclusively econometric but use two alternative specifications, one in which temperature affects economic growth and one in which temperature change affects growth. As shown below, the former is inconsistent with the climate literature. The latter is consistent in principle, conditional on a scenario and model.
This paper makes three contributions. First, I update my earlier meta-analysis of the economic impact of climate change (Tol, 2009, 2014, 2018), using the same methods as before. This confirms some earlier findings but overturns others. In contrast to Howard and Sterner (2017), I separately analyze weather and climate estimates. I use more estimates than they do, but skip some of their numbers. They appear to have misread some papers, included some estimates twice, and added estimates that are not. See A for details. Compared to Nordhaus and Moffat (2017), I add more estimates, avoid arbitrary weights, and include estimates of the impact of weather shocks. I use more estimates than Rose et al. (2022, see also ()), and separate the impacts of climate change and weather shocks.
As a second contribution, I present the first meta-analyses of the two literatures on the economic impact of weather shocks. Auffhammer (2018) and Kolstad and Moore (2020) discuss this literature but do not combine estimates. Third, I propose a method to reconcile one of the weather literatures with the climate literature.
The paper proceeds as follows. Section 2 discusses the literature on the estimated impacts of climate change. This section follows Tol (2021a), but with new numbers. Section 3 turns to the impacts of weather shocks. Section 4 reconciles these estimates where possible. Section 5 shows the implications for the social cost of carbon. Section 6 concludes.
2 Impacts of climate change
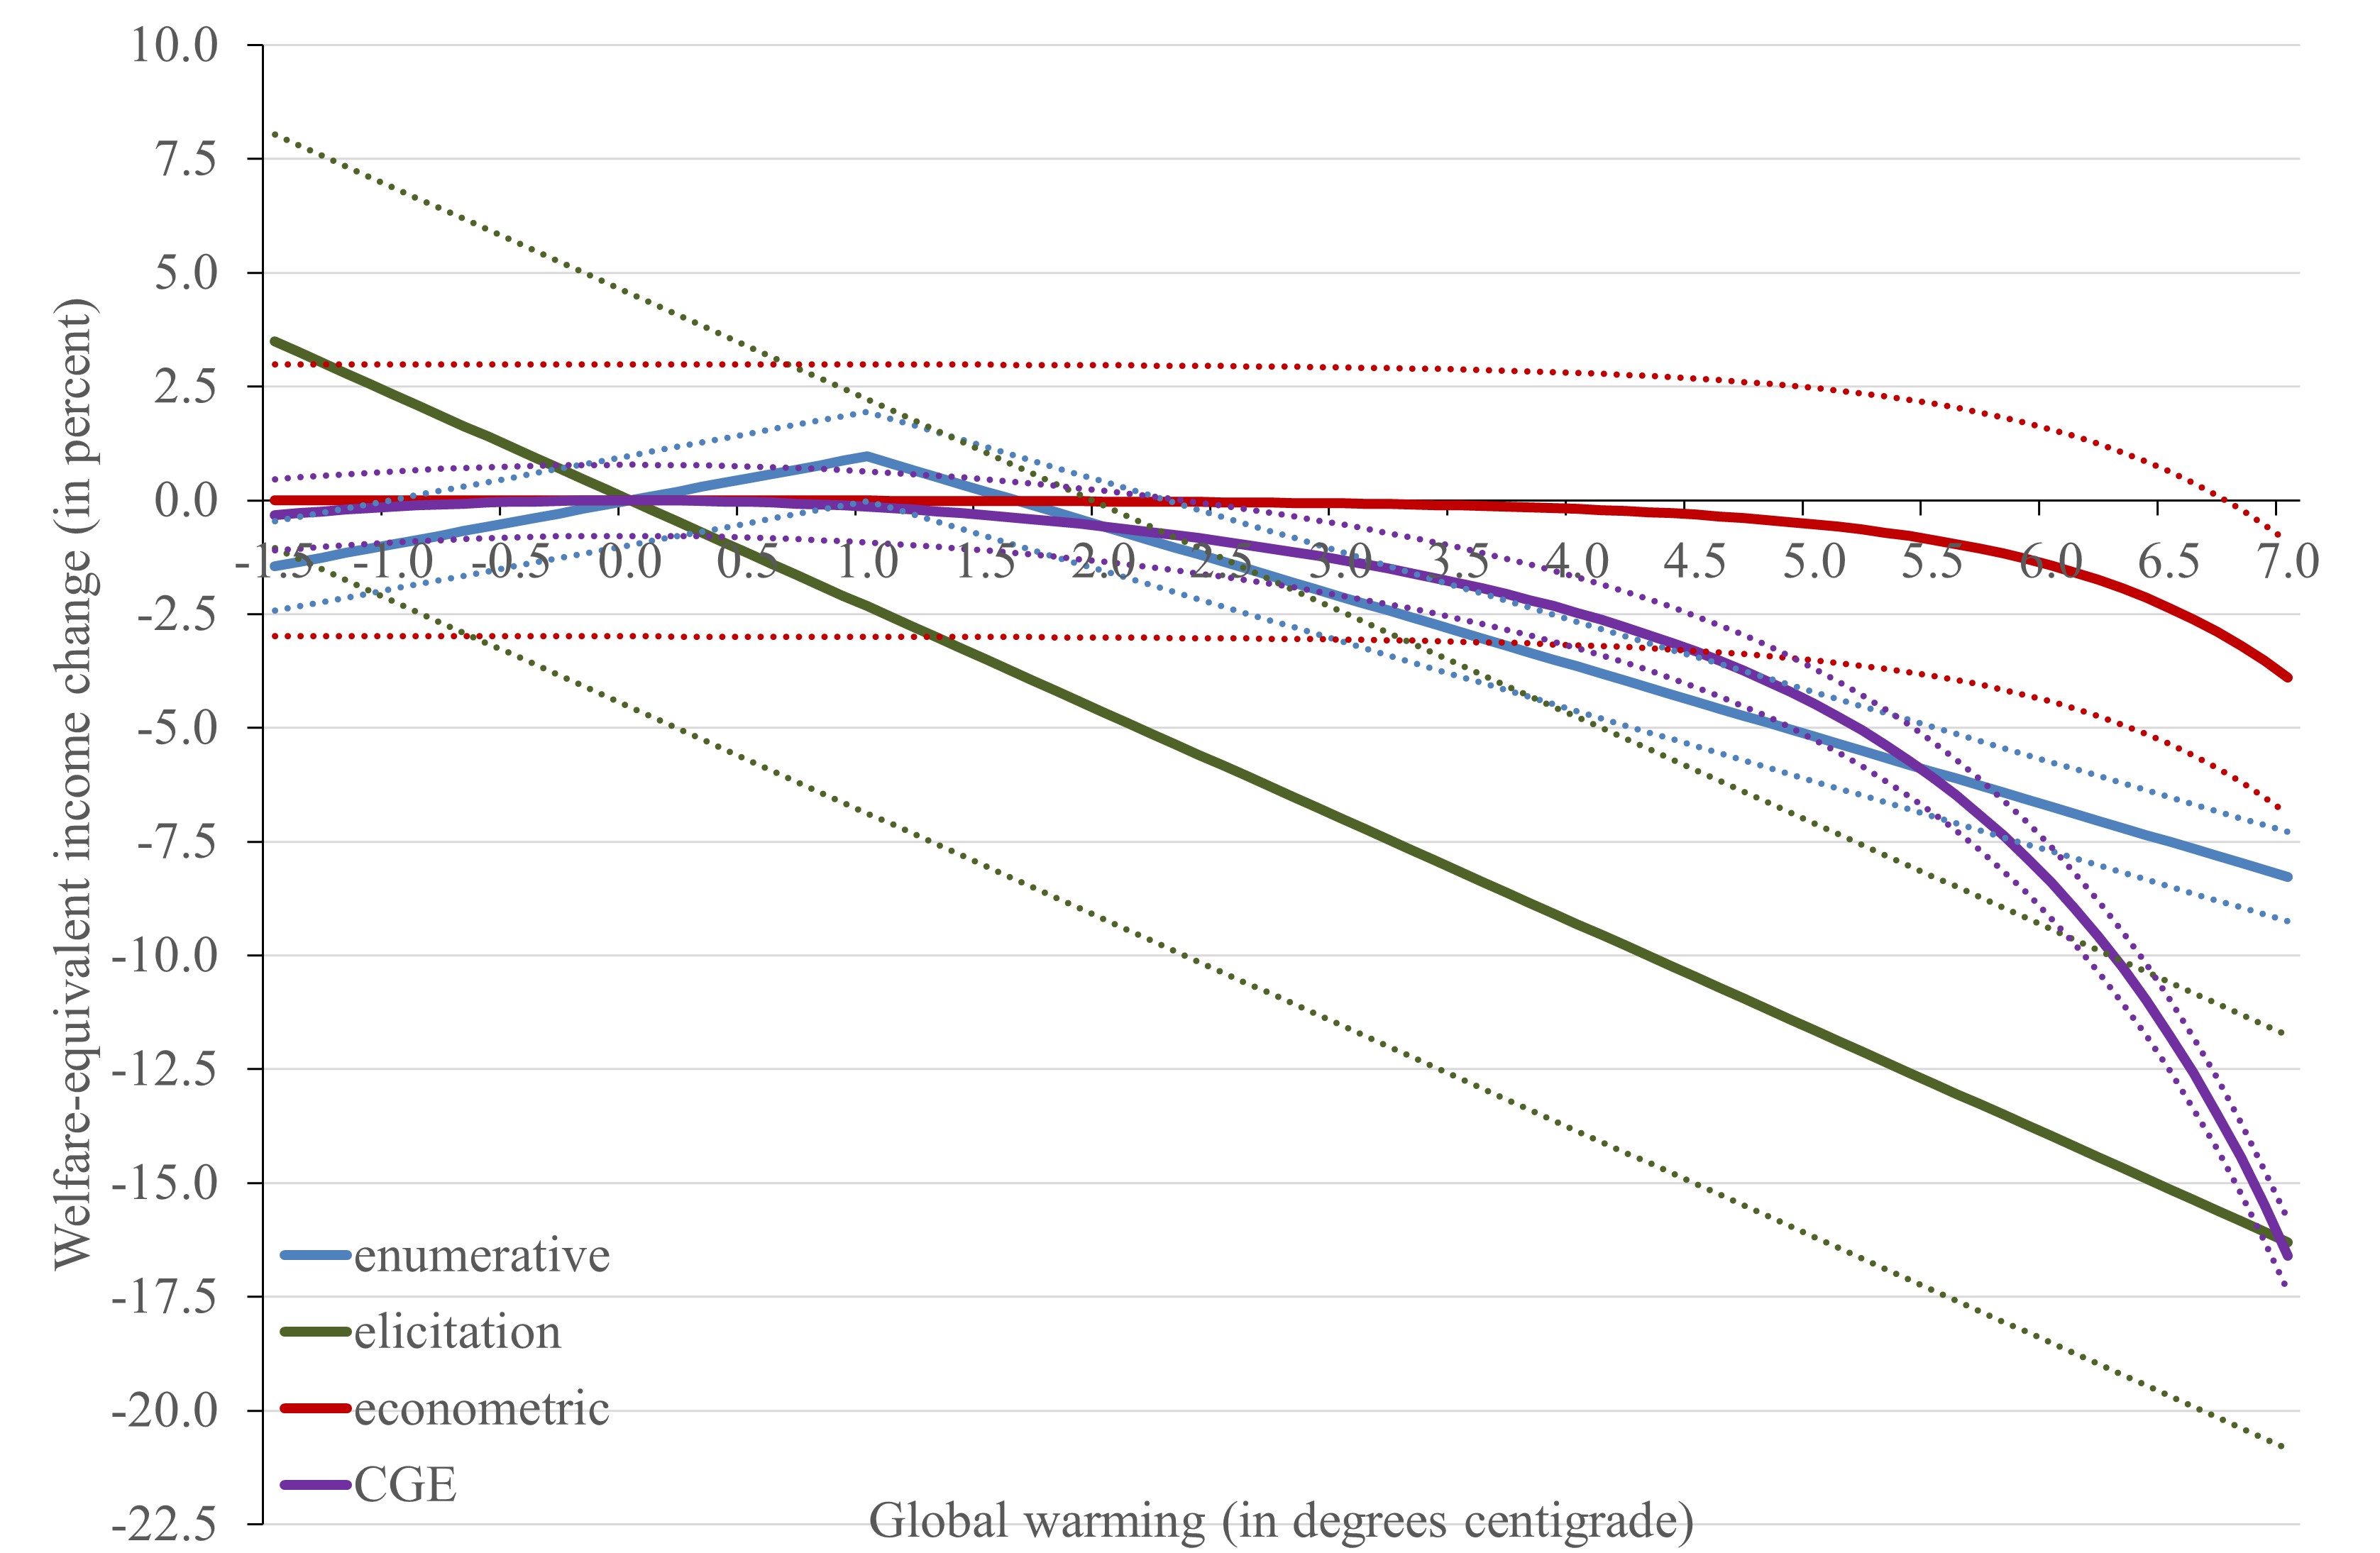
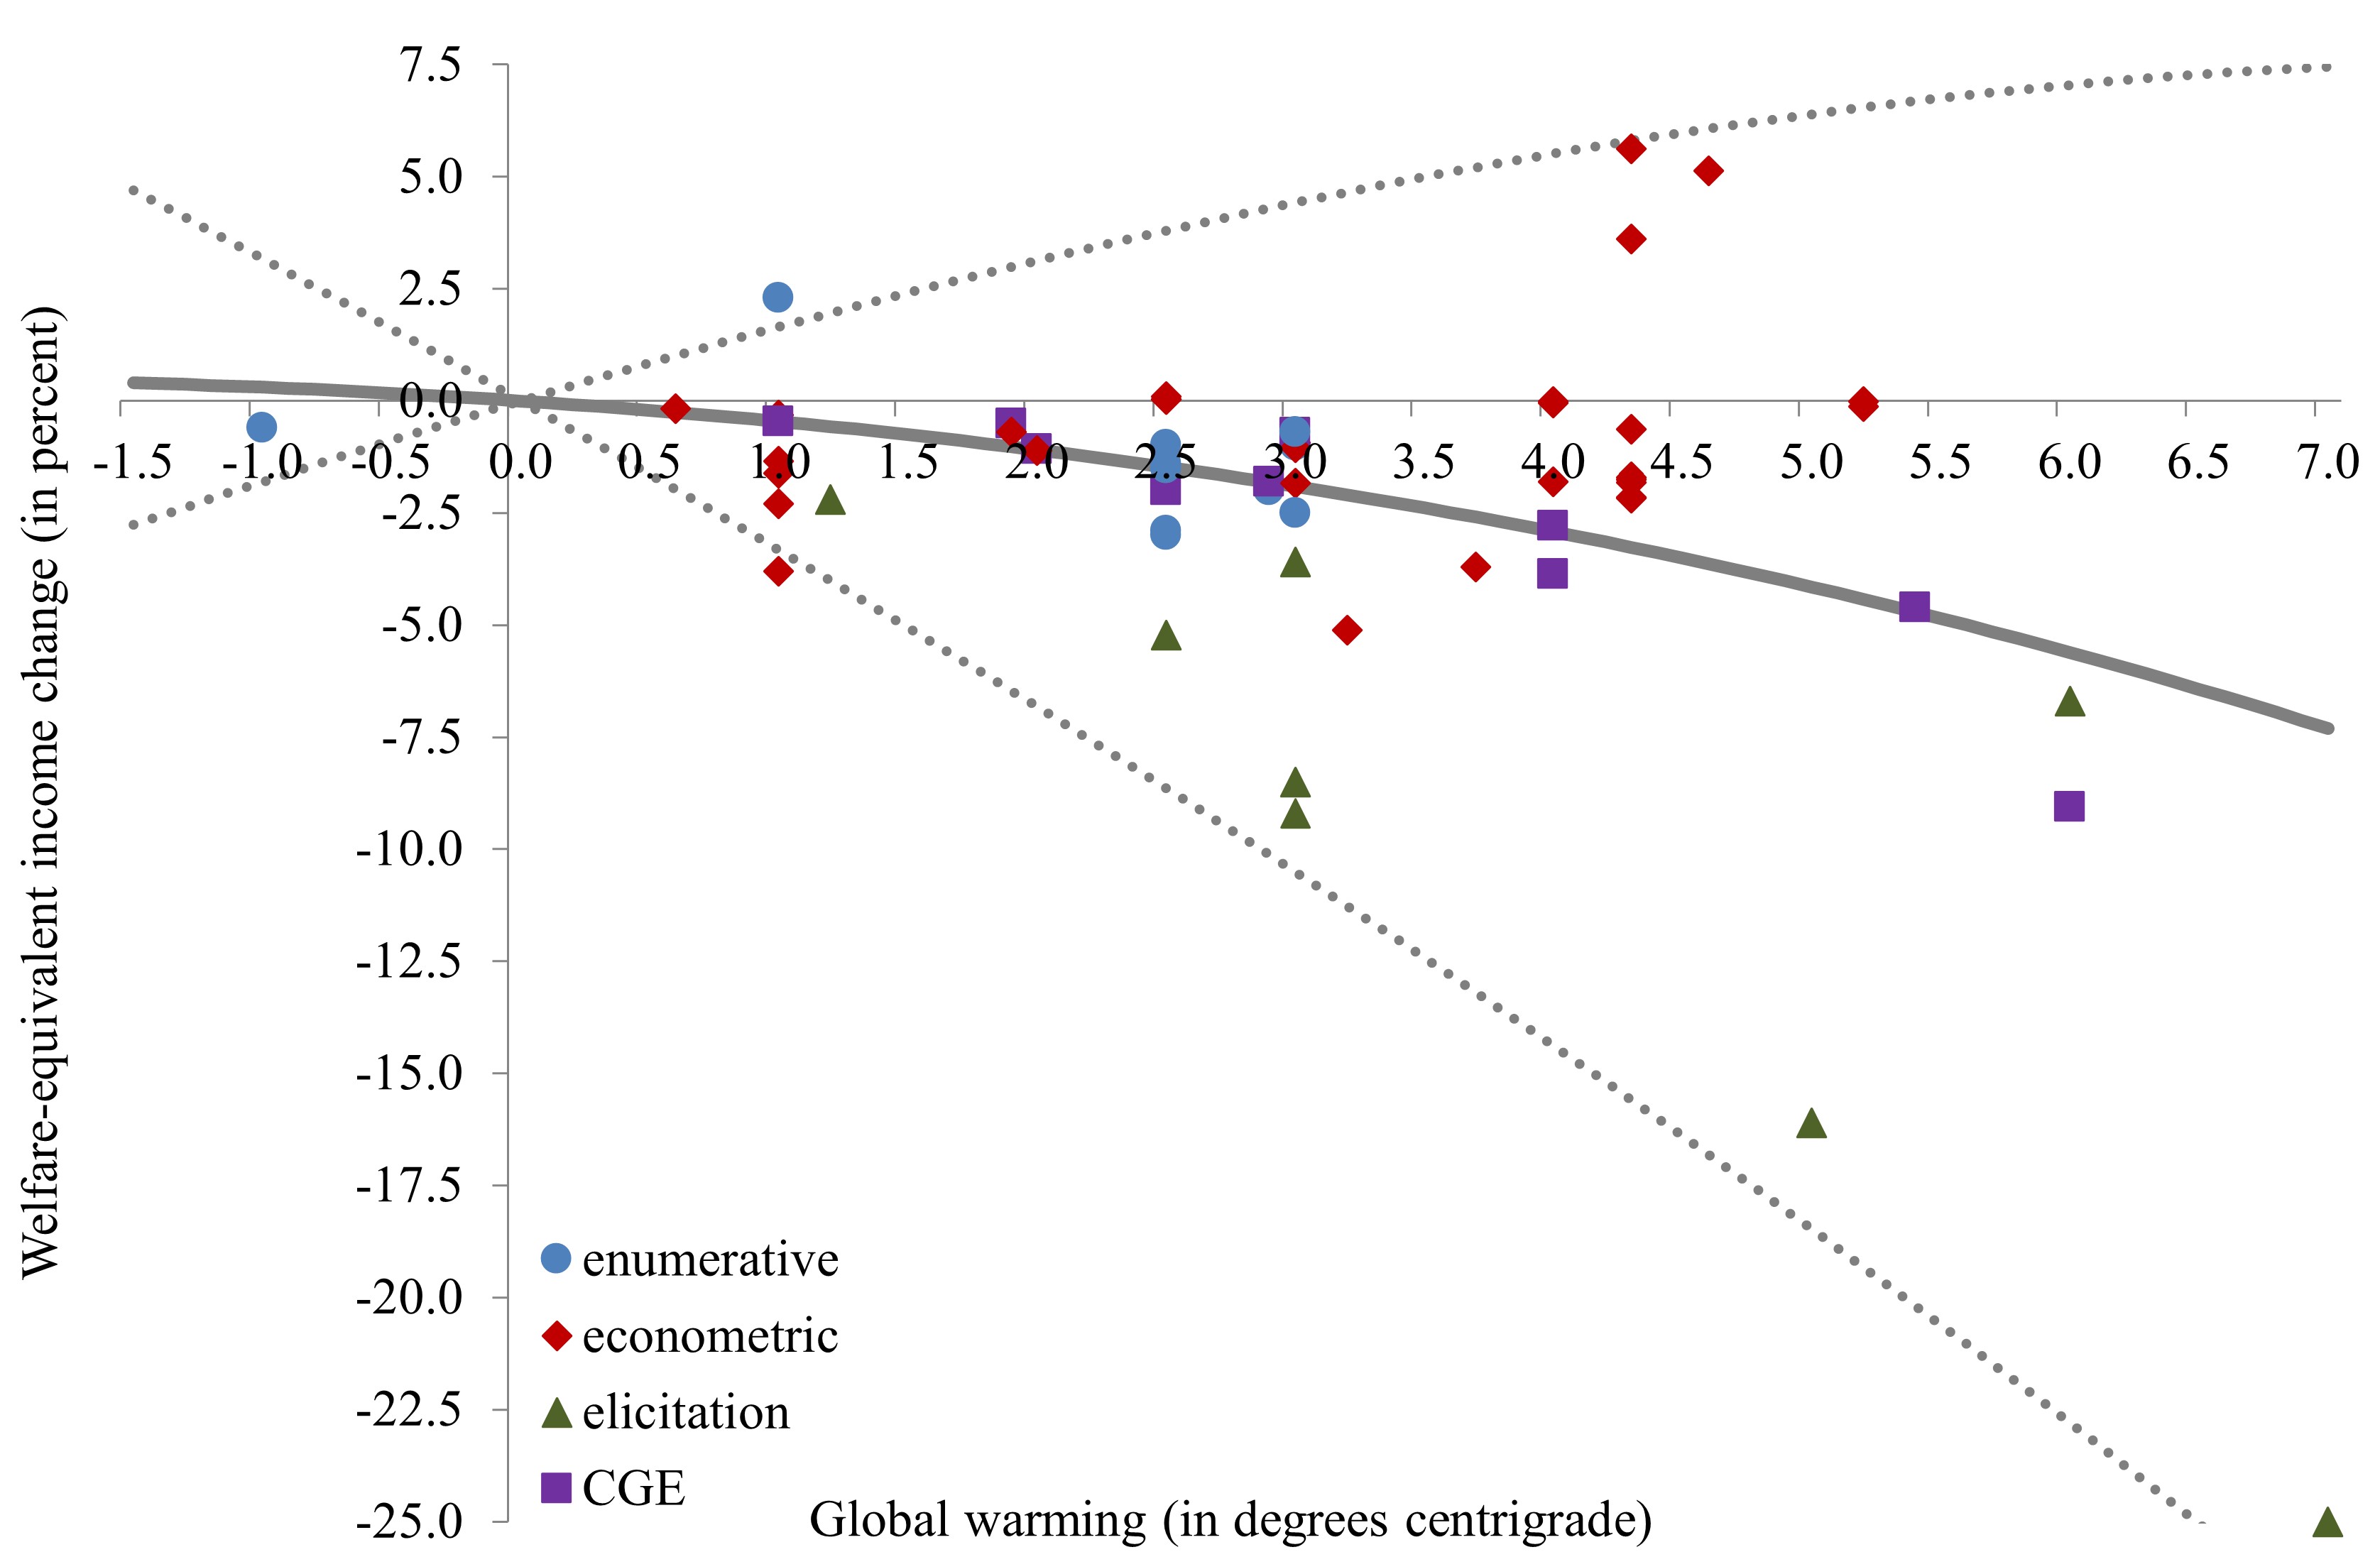
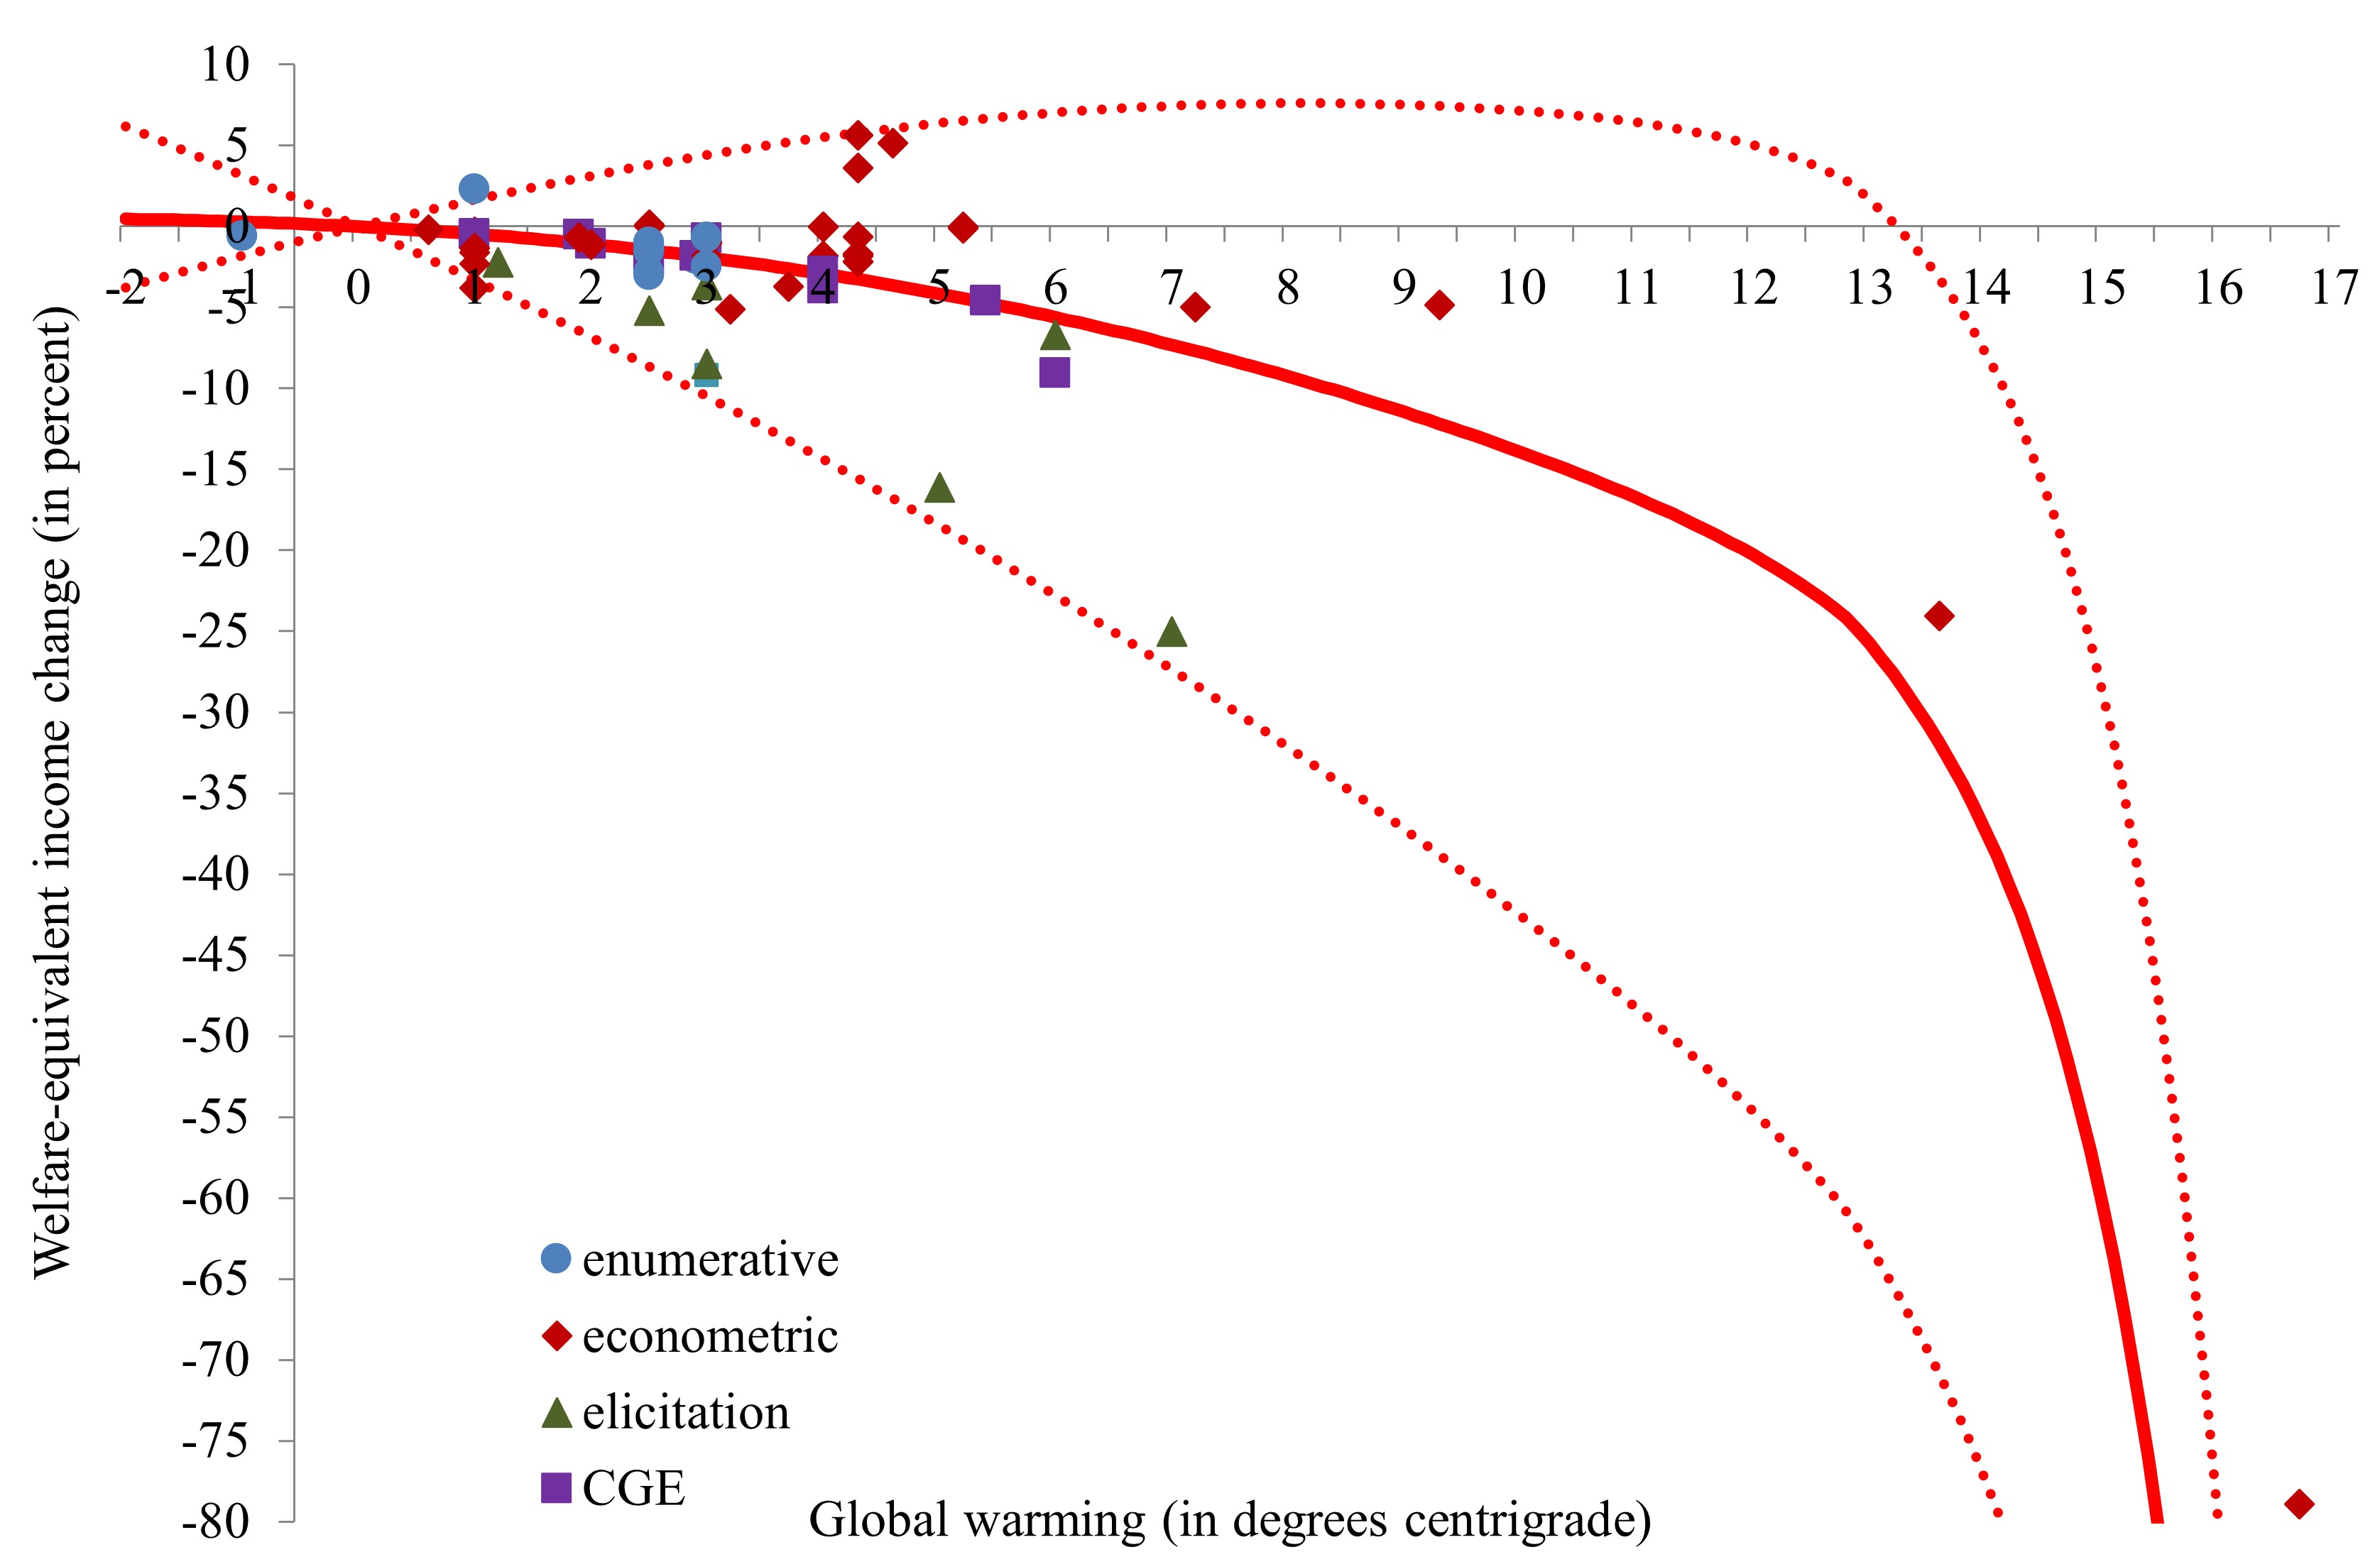
Table LABEL:tab:compstat shows 61 estimates, from 33 studies, of the total economic impact of climate change. These estimates are comparative static, comparing economies of the recent past with and without some future climate change. Figure 1 plots 58 of the estimates; Figure B1 plots them all, including 3 estimates for very large warming. The horizontal axis is the increase in the global annual mean surface air temperature. The vertical axis is the welfare-equivalent income change, some approximation of the Hicksian Equivalent Variation. These numbers should be read as follows: A global warming of 2.5 would make the average person feel as if she had lost 1.7% of her income. 1.7% is the average of the 13 dots at this level of warming.
2.1 Methods
As indicated in Figure 1 and Table LABEL:tab:compstat, these estimates use a range of methods. Older studies tend to rely on the enumerative method. Estimates of the impacts (after assumed adaptation) of climate change in their natural units are multiplied with estimates of their values and added up. This is a direct cost, a poor approximation of the change in welfare. The enumerative approach omits price changes and interactions between sectors, such as changes in water resources affecting agriculture.
Price changes and market interactions between sectors are included in estimates that use a computable general equilibrium model (CGE). This method has become more popular over the years. These studies report the Hicksian Equivalent Variation but, as they are based on the national accounts, omit direct welfare impacts on health and nature.111One CGE study (Takakura et al., 2019) uses the value of a statistical life to assess health impacts. CGE models allow for adaptation in the production function—for example, a drop in the productivity of land would be partially compensated by an increase in the application of fertilizer and labour—and through shifts in supply and demand.222If adaptation is implied in the assumed shock, then there is no adaptation in production. For example, many CGEs take their impact of climate change on labour productivity, one of the largest impacts, from Kjellstrom et al. (2009), but as temperature is not an input factor, air conditioning is kept constant just as it is in Kjellstrom.
Econometric studies have also become more numerous over time. Differences in prices, expenditures, self-reported happiness or total output are ascribed to variations in climate. A key advantage of this method is that adaptation is observed rather than assumed, but identification comes from the cross-section and projected impacts from substituting time for space.
Four studies elicit expert views. Two of these studies were done before anyone could reasonably claim expertise on the economic impacts of climate change, the later ones use a mix of people who have and have not published on the subject. Views were expressed about the impact of climate change on global output, which can be interpreted as a measure of economic activity (but not welfare) as well as a measure of income (and thus welfare).
2.2 Combining estimates
Figure 1 shows a curve, based on the method of Tol (2019b). Seven alternative impact functions, proposed in the literature, were fitted to the data. See Table LABEL:tab:compstat.333I dropped the double-exponential model of Golosov et al. (2014), as its fit to the data is so poorly, and replaced it with the hyperbolic sine. I minimized the weighted sum of squared differences between the model and the primary estimate, weighting all estimates from a single study equally and attaching a total weight of 1 per study. The curve shown is the Bayesian model average, that is, the seven impact functions are weighted according to their fit to the primary estimates.
The 90% confidence interval shown is based on the uncertainty reported in 14 of the primary estimates, following Tol (2018, see also ()). The lower and upper bound is estimated separately as a linear function of the temperature increase, using weighted least squares as above.
2.3 Results
Compared to my previous meta-analysis based on the same methods (Tol, 2019a), Figure 1 shows a very different picture. The number of estimates has more than doubled. The number of estimates beyond 3.2 of warming has increased tenfold. As there is a non-negligible chance of large warming, the previous paucity of evidence allowed for speculation about the expected impact of climate change (Weitzman, 2009, Anthoff and Tol, 2022).
The central estimate of the impact of global warming is always negative, but the confidence interval is too wide to put much confidence in that. The wider confidence interval, compared to Tol (2019a), is mostly due to the range of uncertainties reported by Howard and Sylvan (2020-09, 2021-07). The central estimate is higher because of the positive impacts reported by Desmet and Rossi-Hansberg (2015) and Newell et al. (2021) for substantial global warming. Enumerative studies report positive impacts of climate change due to reduced costs of heating in winter, lower cold-related mortality, and carbon dioxide fertilization. In Desmet and Rossi-Hansberg (2015), the positive impacts are in manufacturing.444The ”into Siberia” series of papers (Desmet and Rossi-Hansberg, 2015, Conte et al., 2021, Cruz and Rossi-Hansberg, 2021) assume mobility of capital and labour. There is no sectoral breakdown in Newell et al. (2021); the positive impacts are in specifications that relate economic growth to the temperature level (see below).
Researchers disagree on the sign of the net impact, but agree on the order of magnitude: The welfare loss (or gain) caused by climate change is equivalent to the welfare loss caused by an income drop of at most ten percent—a century of climate change is not worse than losing a decade of economic growth.
The uncertainty is large and right-skewed. For every degree warming, the positive standard deviation increases by 1.02% GDP while the negative standard deviation increases by 1.43% GDP. That is, negative surprises are larger than positive surprises of equal probability.
Figure 1 suggests that different methods yield different results. Figure B2 shows the curve fitted separately by method used for the primary impact estimate. Instead of using the Bayesian average, the curve with the best fit is shown because there are not enough observations to estimate so many parameters if the sample is split into four. The elicitation studies are most pessimistic, the econometric studies most optimistic about the impacts of climate change. The enumerative and general equilibrium papers lie in between, with the former more pessimistic for moderate warming and less pessimistic for more profound warming. Although the central estimates are different, the uncertainty is so large that differences do not become statistically significant from zero before 4 of warming.
2.4 Sectoral impacts and omission bias
Eight studies show sectoral impacts in tabular format.555Takakura et al. (2019) show sectoral impacts in hard-to-read graphs. The results are shown in Table 3 for 2.5 global warming. The estimates by Sartori and Roson (2016) and Kompas et al. (2018) are scaled using the function shown in Figure 1.
The different studies have different sectoral cover, which I mapped to the sectors shown in Table 3. Following Tol (2019c), where a particular study omits a certain sector, I impute its value with the average of the studies that do include this impact.
The following results emerge. “Other markets” is the biggest impact. Although recorded in an obscure way, this is primarily the impact of heat on labour productivity. Health impacts come second, followed by amenity, extreme weather, and agriculture. Only the impact of climate change on time use is positive. Overall, market impacts make up 55% of the total, while the remaining 45% directly affect welfare.
2.5 Distribution of impacts
Figure 1 shows the global average impact of climate change. 18 of the 33 studies include estimates of the regional impacts of climate change or national impact estimates. Following Tol2021, I regress the estimated regional impact on per capita income and average annual temperature, with dummies for the studies. This yields
| (1) |
where is the impact in country (in %GDP), is its average income (in 2010 market exchange dollars per person per year), and is the average annual temperature (in degrees Celsius); the bracketed numbers are standard errors. Hotter countries have more negative impacts. Richer countries have relatively less negative impacts.666Sterner and Persson (2008) and Van Den Bremer and Van Der Ploeg (2021) assume the opposite, empirical support to the contrary notwithstanding (e.g. Botzen et al., 2021, Gandhi et al., 2022). For each of the studies, this equation is used to impute national impacts, making sure that the regional or global totals match those in the original estimates. The function shown in Figure 1 is then used to shift all impacts to 2.5warming.777Note that I use the global function to shift the imputed national impacts. (Tol, 2019a) shows that this is more robust than estimating national impact functions. For each country, the average and standard deviation across studies is taken.
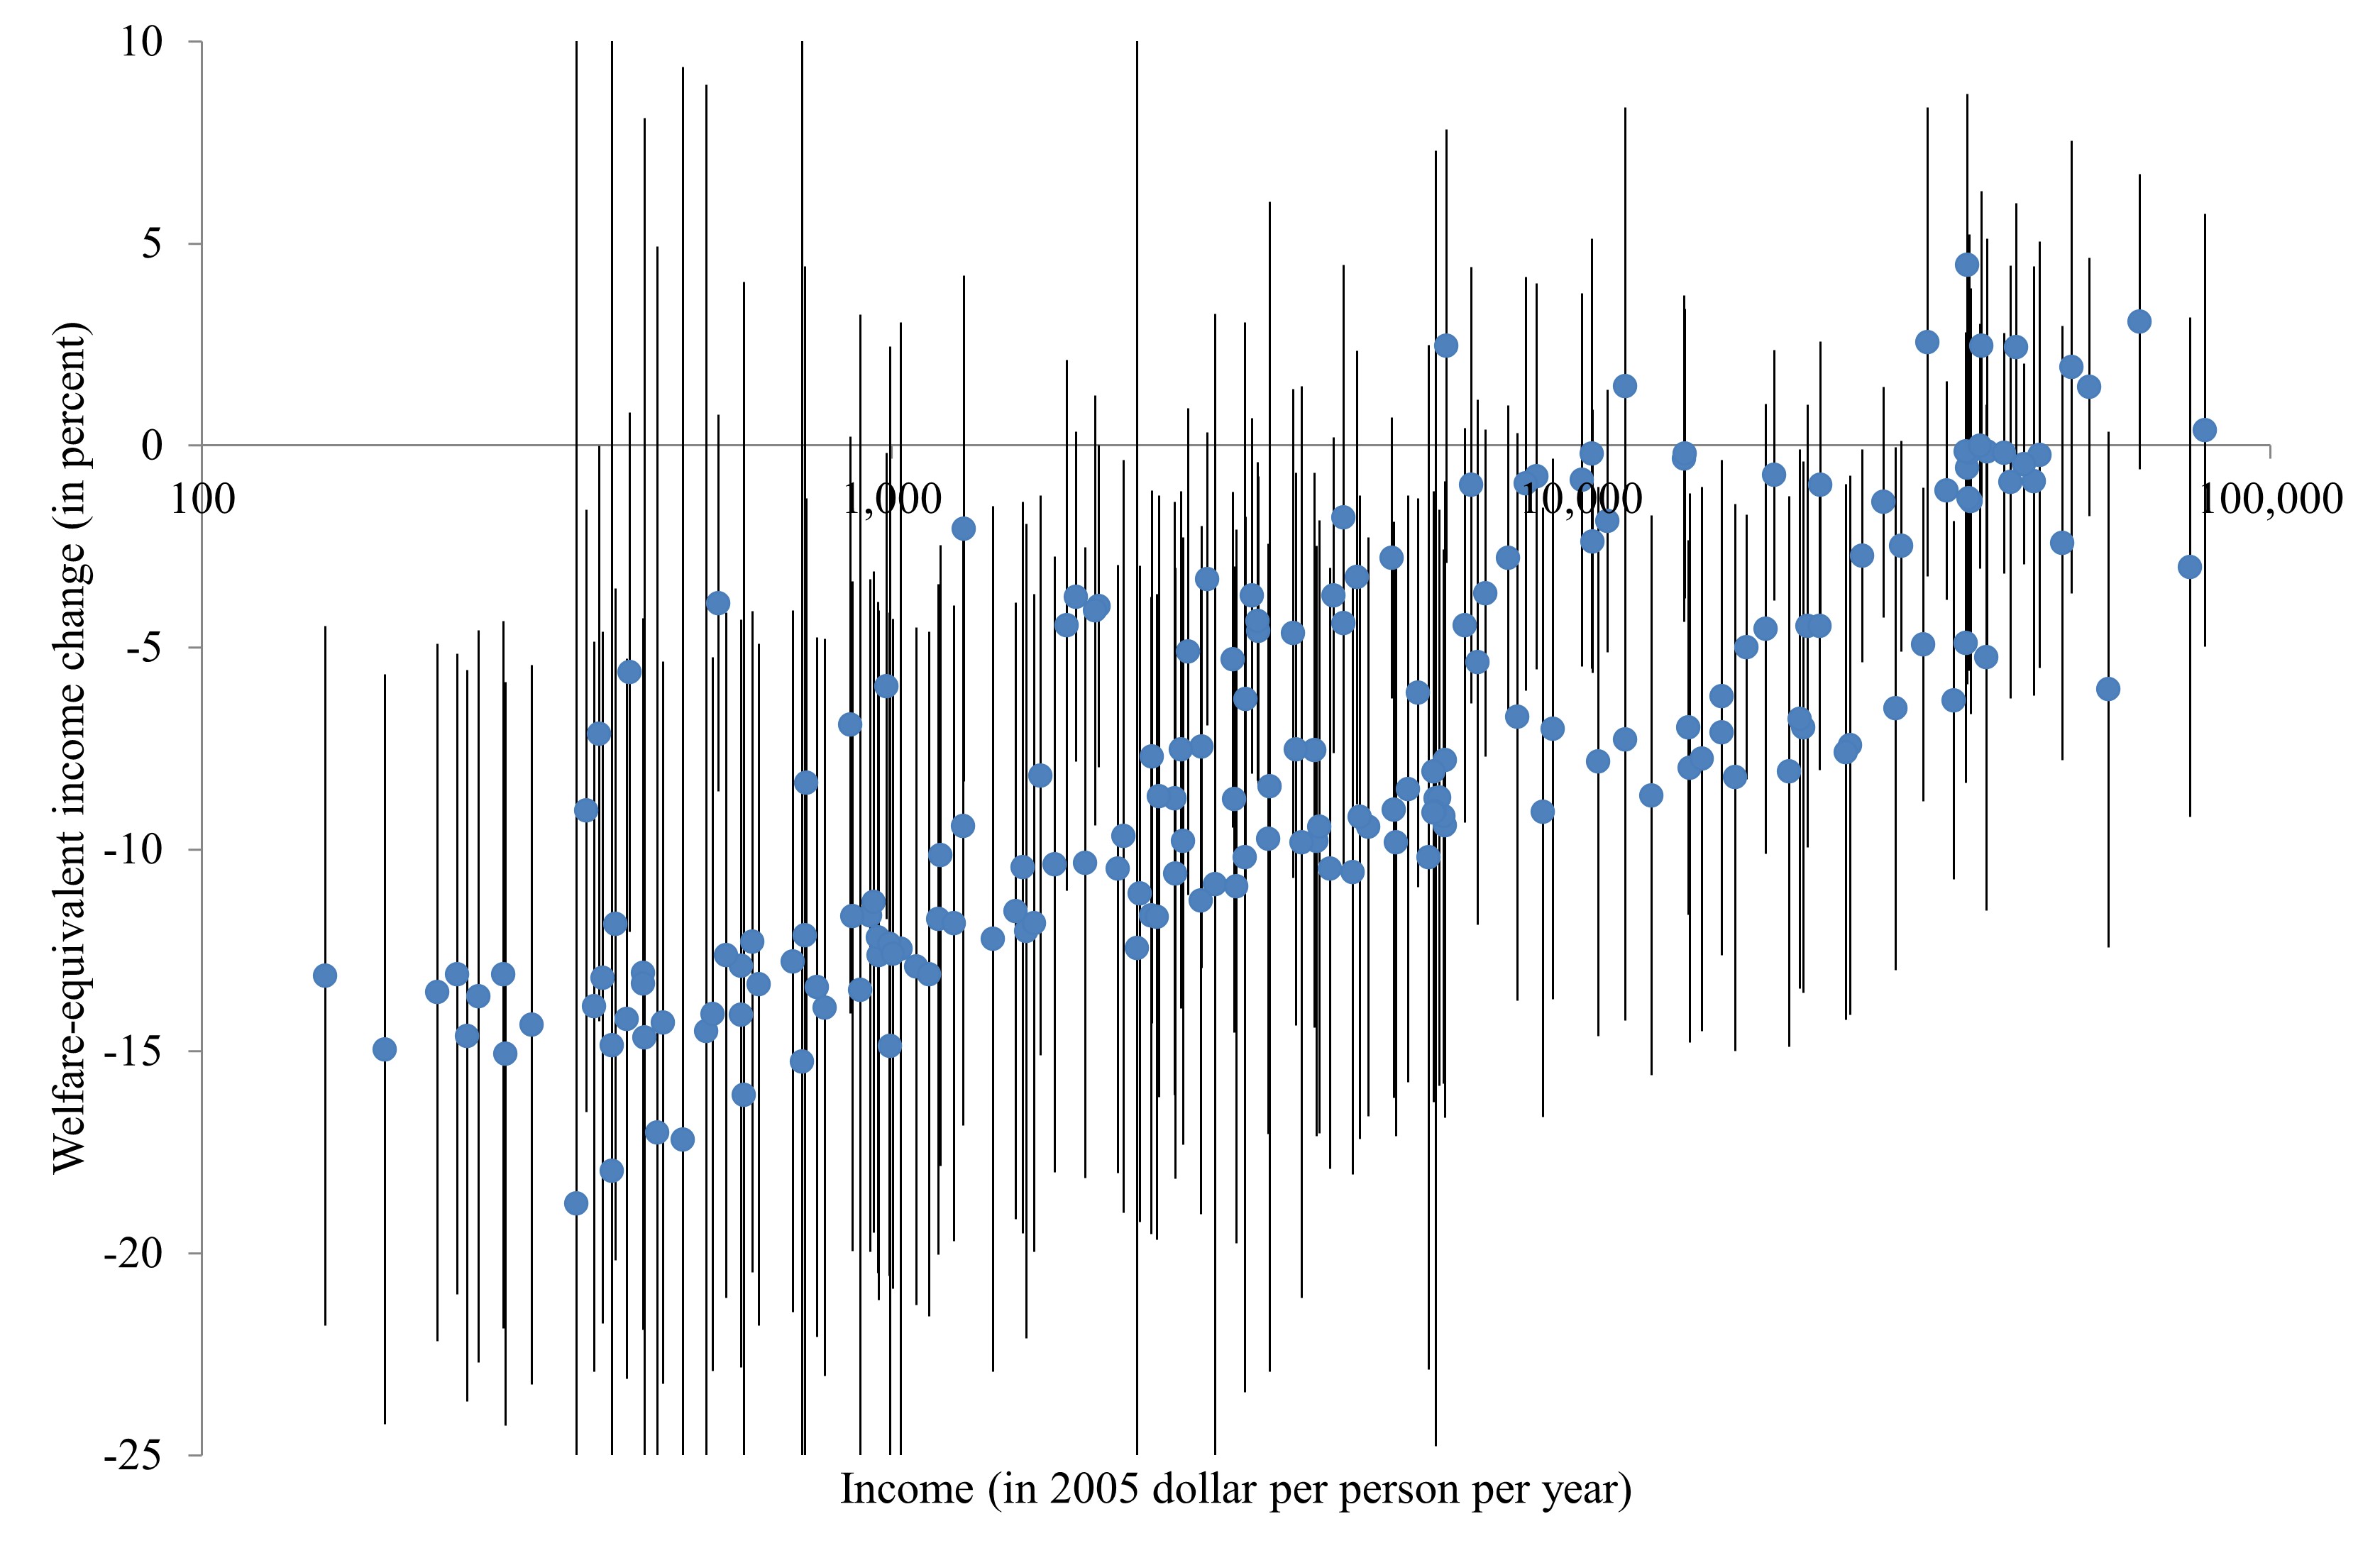
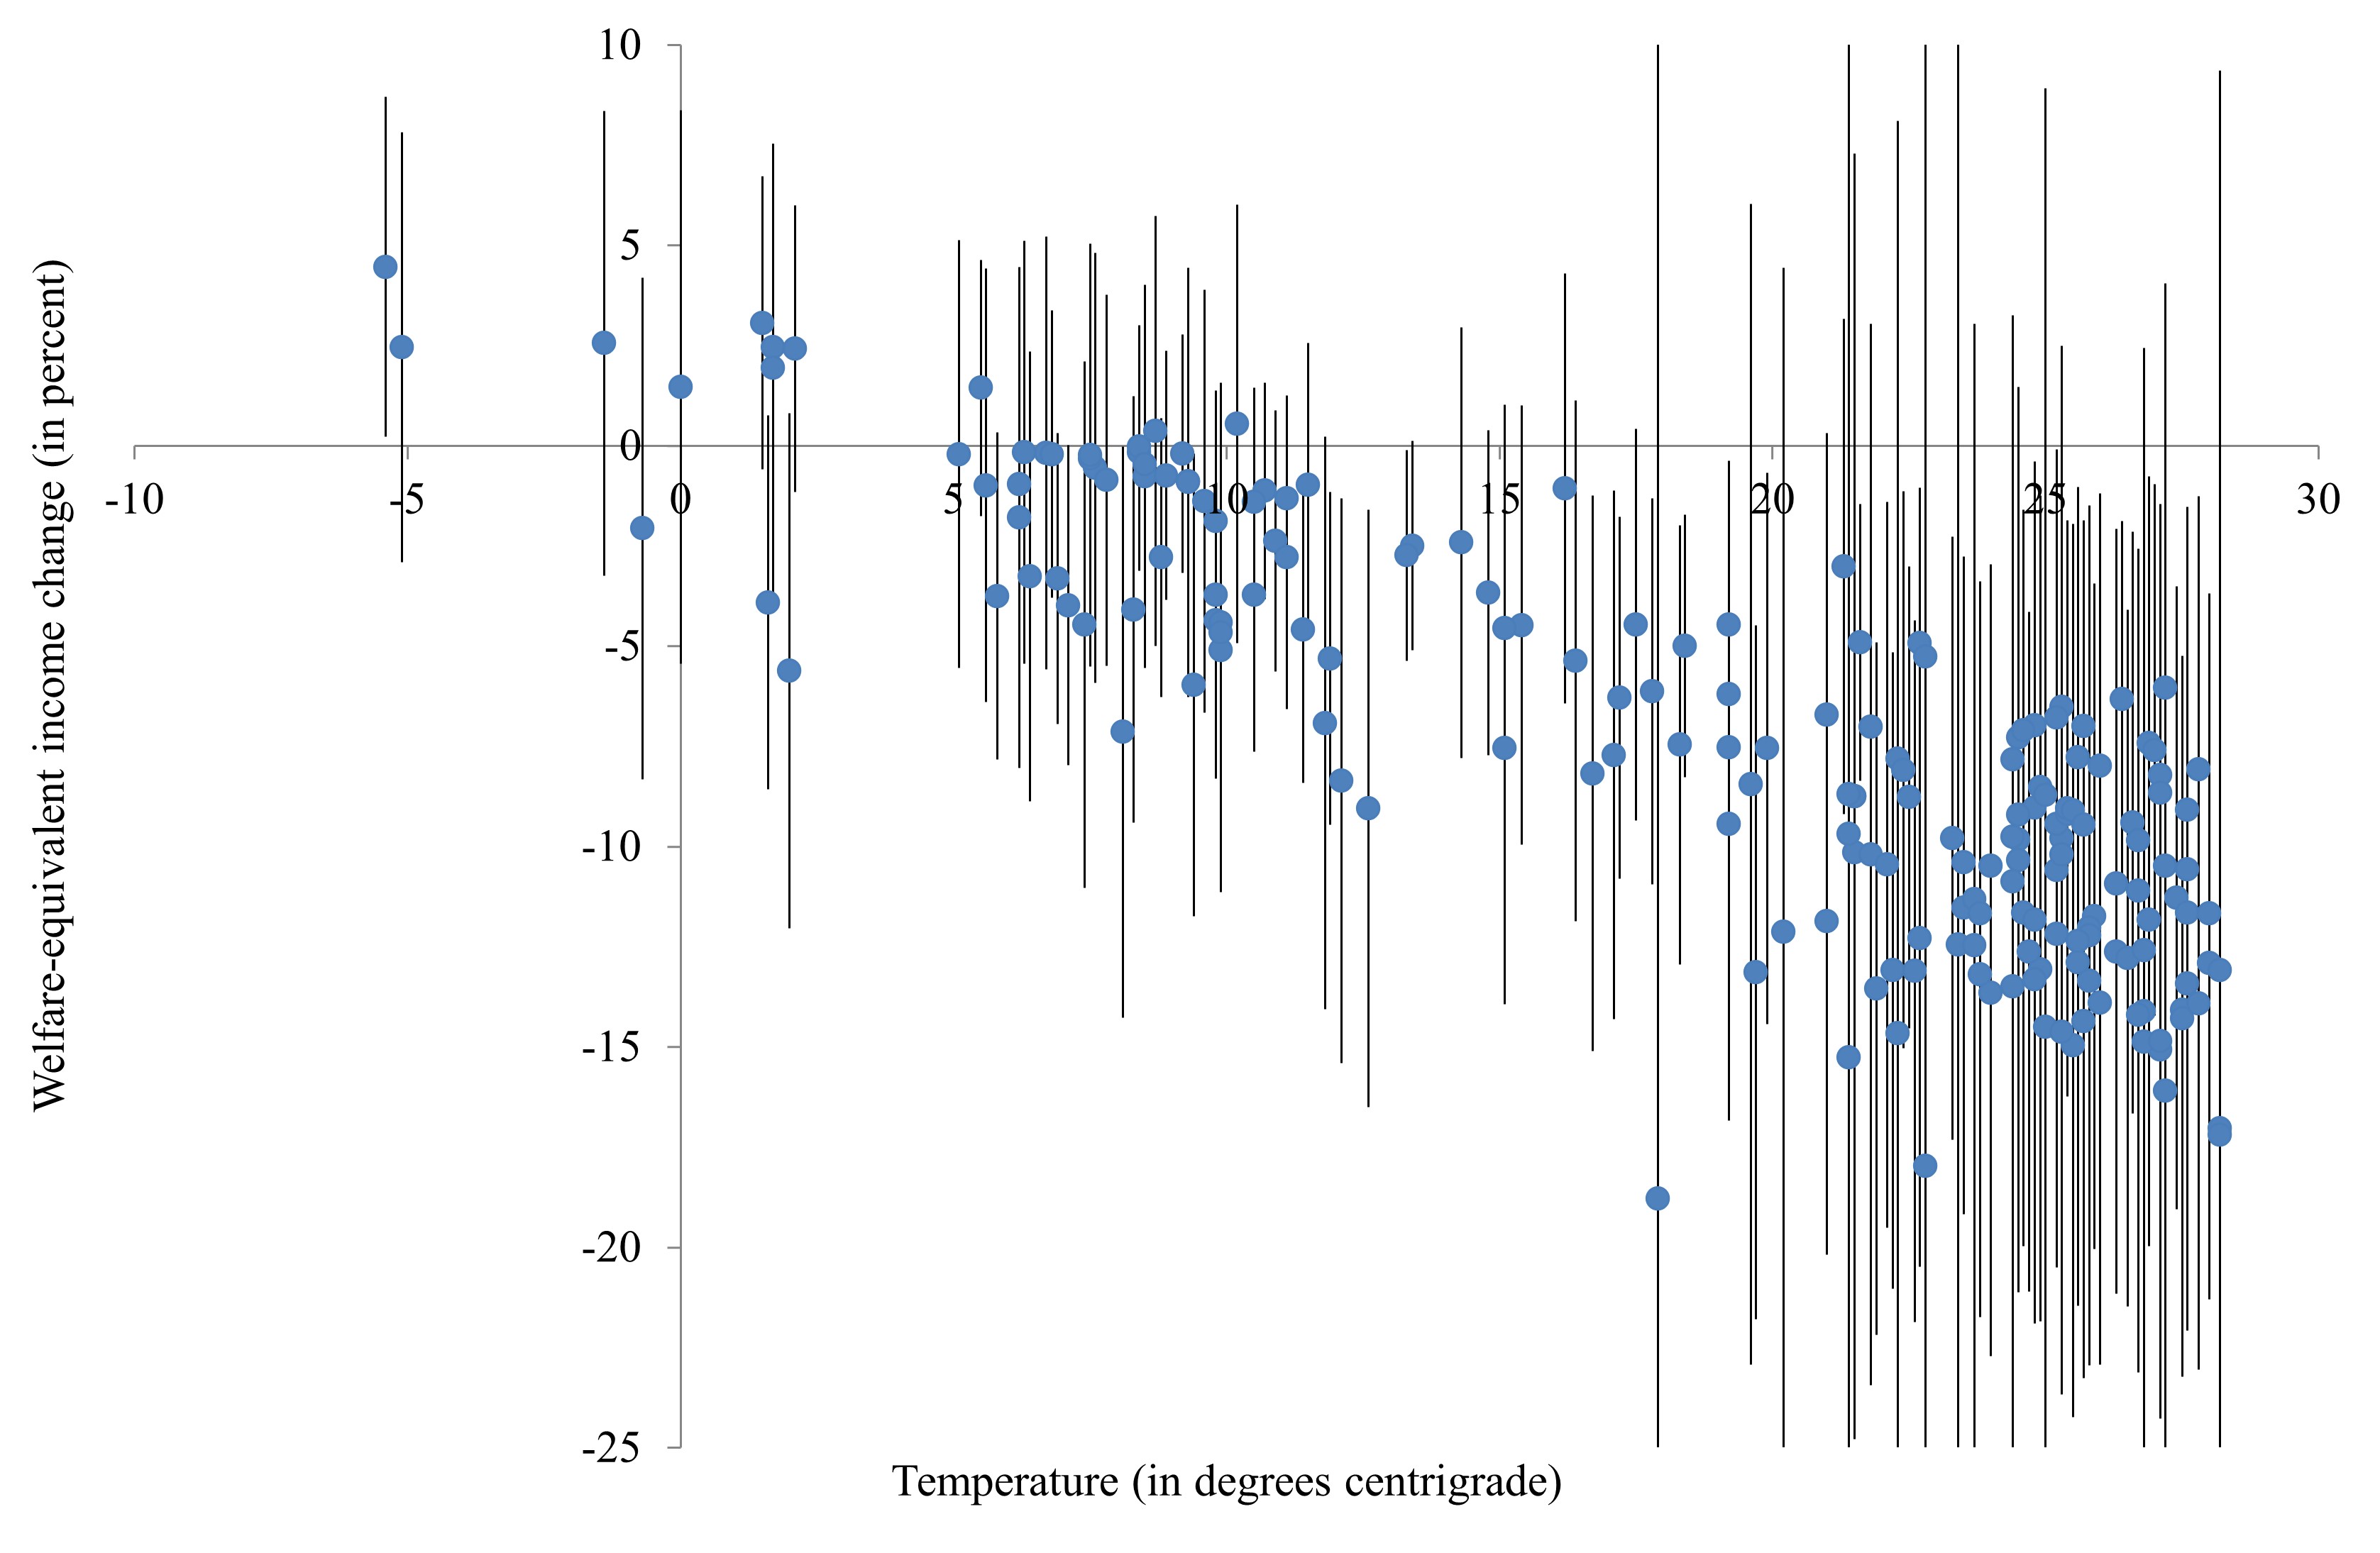
Figure 5 shows results for individual countries for 2.5 warming. Hotter countries, poorer countries see more negative impacts. In fact, the majority of countries show a larger damage than the global average of 1.7%. This is because the world economy is concentrated in a few, rich countries. The world average economic impact counts dollars, rather than countries, let alone people.
Poorer countries are more vulnerable to climate change for three reasons. First, poorer countries have a higher share of their economic activity in sectors, such as agriculture, that are directly exposed to the vagaries of weather. Second, poorer countries tend to be in hotter places. This makes adaptation more difficult as there are no analogues for human behaviour and technology. Cities in temperate climates need to look at subtropical cities to discover how to cope in a warmer climate, and subtropical cities at tropical ones. The hottest cities will need to invent, from scratch, how to deal with greater heat. Third, poorer countries tend to have a limited adaptive capacity (Adger, 2006, Yohe and Tol, 2002). Adaptive capacity depends on a range of factors, such as the availability of technology, the ability to pay for those technologies, the political will to mobilize resources for the public good, and the government’s competence in raising funds and delivering projects. All these factors are worse in developing countries.
3 Impacts of weather shocks
Climate, the thirty-year average of weather, varies only slowly over time and has not varied much over the period for which data are good. In the econometric studies discussed above, the impact of climate is identified from cross-sectional variation. Many other things vary over space too. Panel data help, but some confounders do not change much over time. Therefore, some researchers have estimated the impacts of weather on a range of economic activities. From an economic perspective, weather is random and its impact therefore properly identified. Unfortunately, the impact of a weather shock is not the same as the impact of climate change (Dell et al., 2014). Particularly, weather studies estimate the short-run response of the economy, whereas the interest is in the long-run response, with adjustments in capital, behaviour and technology. Deryugina and Hsiang (2017) derive the rather restrictive conditions under which weather variability is informative about climate change. These conditions are roughly the same as for a market equilibrium to be a Pareto optimum. These conditions are not met. Food markets are distorted by subsidies and import tariffs. Coastal protection is a public good. Infectious disease is an externality. Irrigation is a lumpy investment. Lemoine (2018) notes that economic agents would need to have rational expectations of future weather for investments in adaptation to be optimal. There is little evidence to support that. Extrapolating the impact of weather shocks therefore does not lead to credible estimates of the impact of climate change.
These caveats notwithstanding, there are a number of papers that estimate the economic impact of weather shocks. I restrict the attention to studies of the impact of temperature shocks on economic growth. Different studies use different specifications, but there are two broad clusters. The first, older cluster regresses the growth rate of economic output on temperature levels. The second, younger cluster regresses the economic growth rate on the change in temperature.888Rainfall is typically included too, but is often found to be insignificant, except in Kotz et al. (2022). I separately discuss these clusters.
3.1 Temperature levels and economic growth
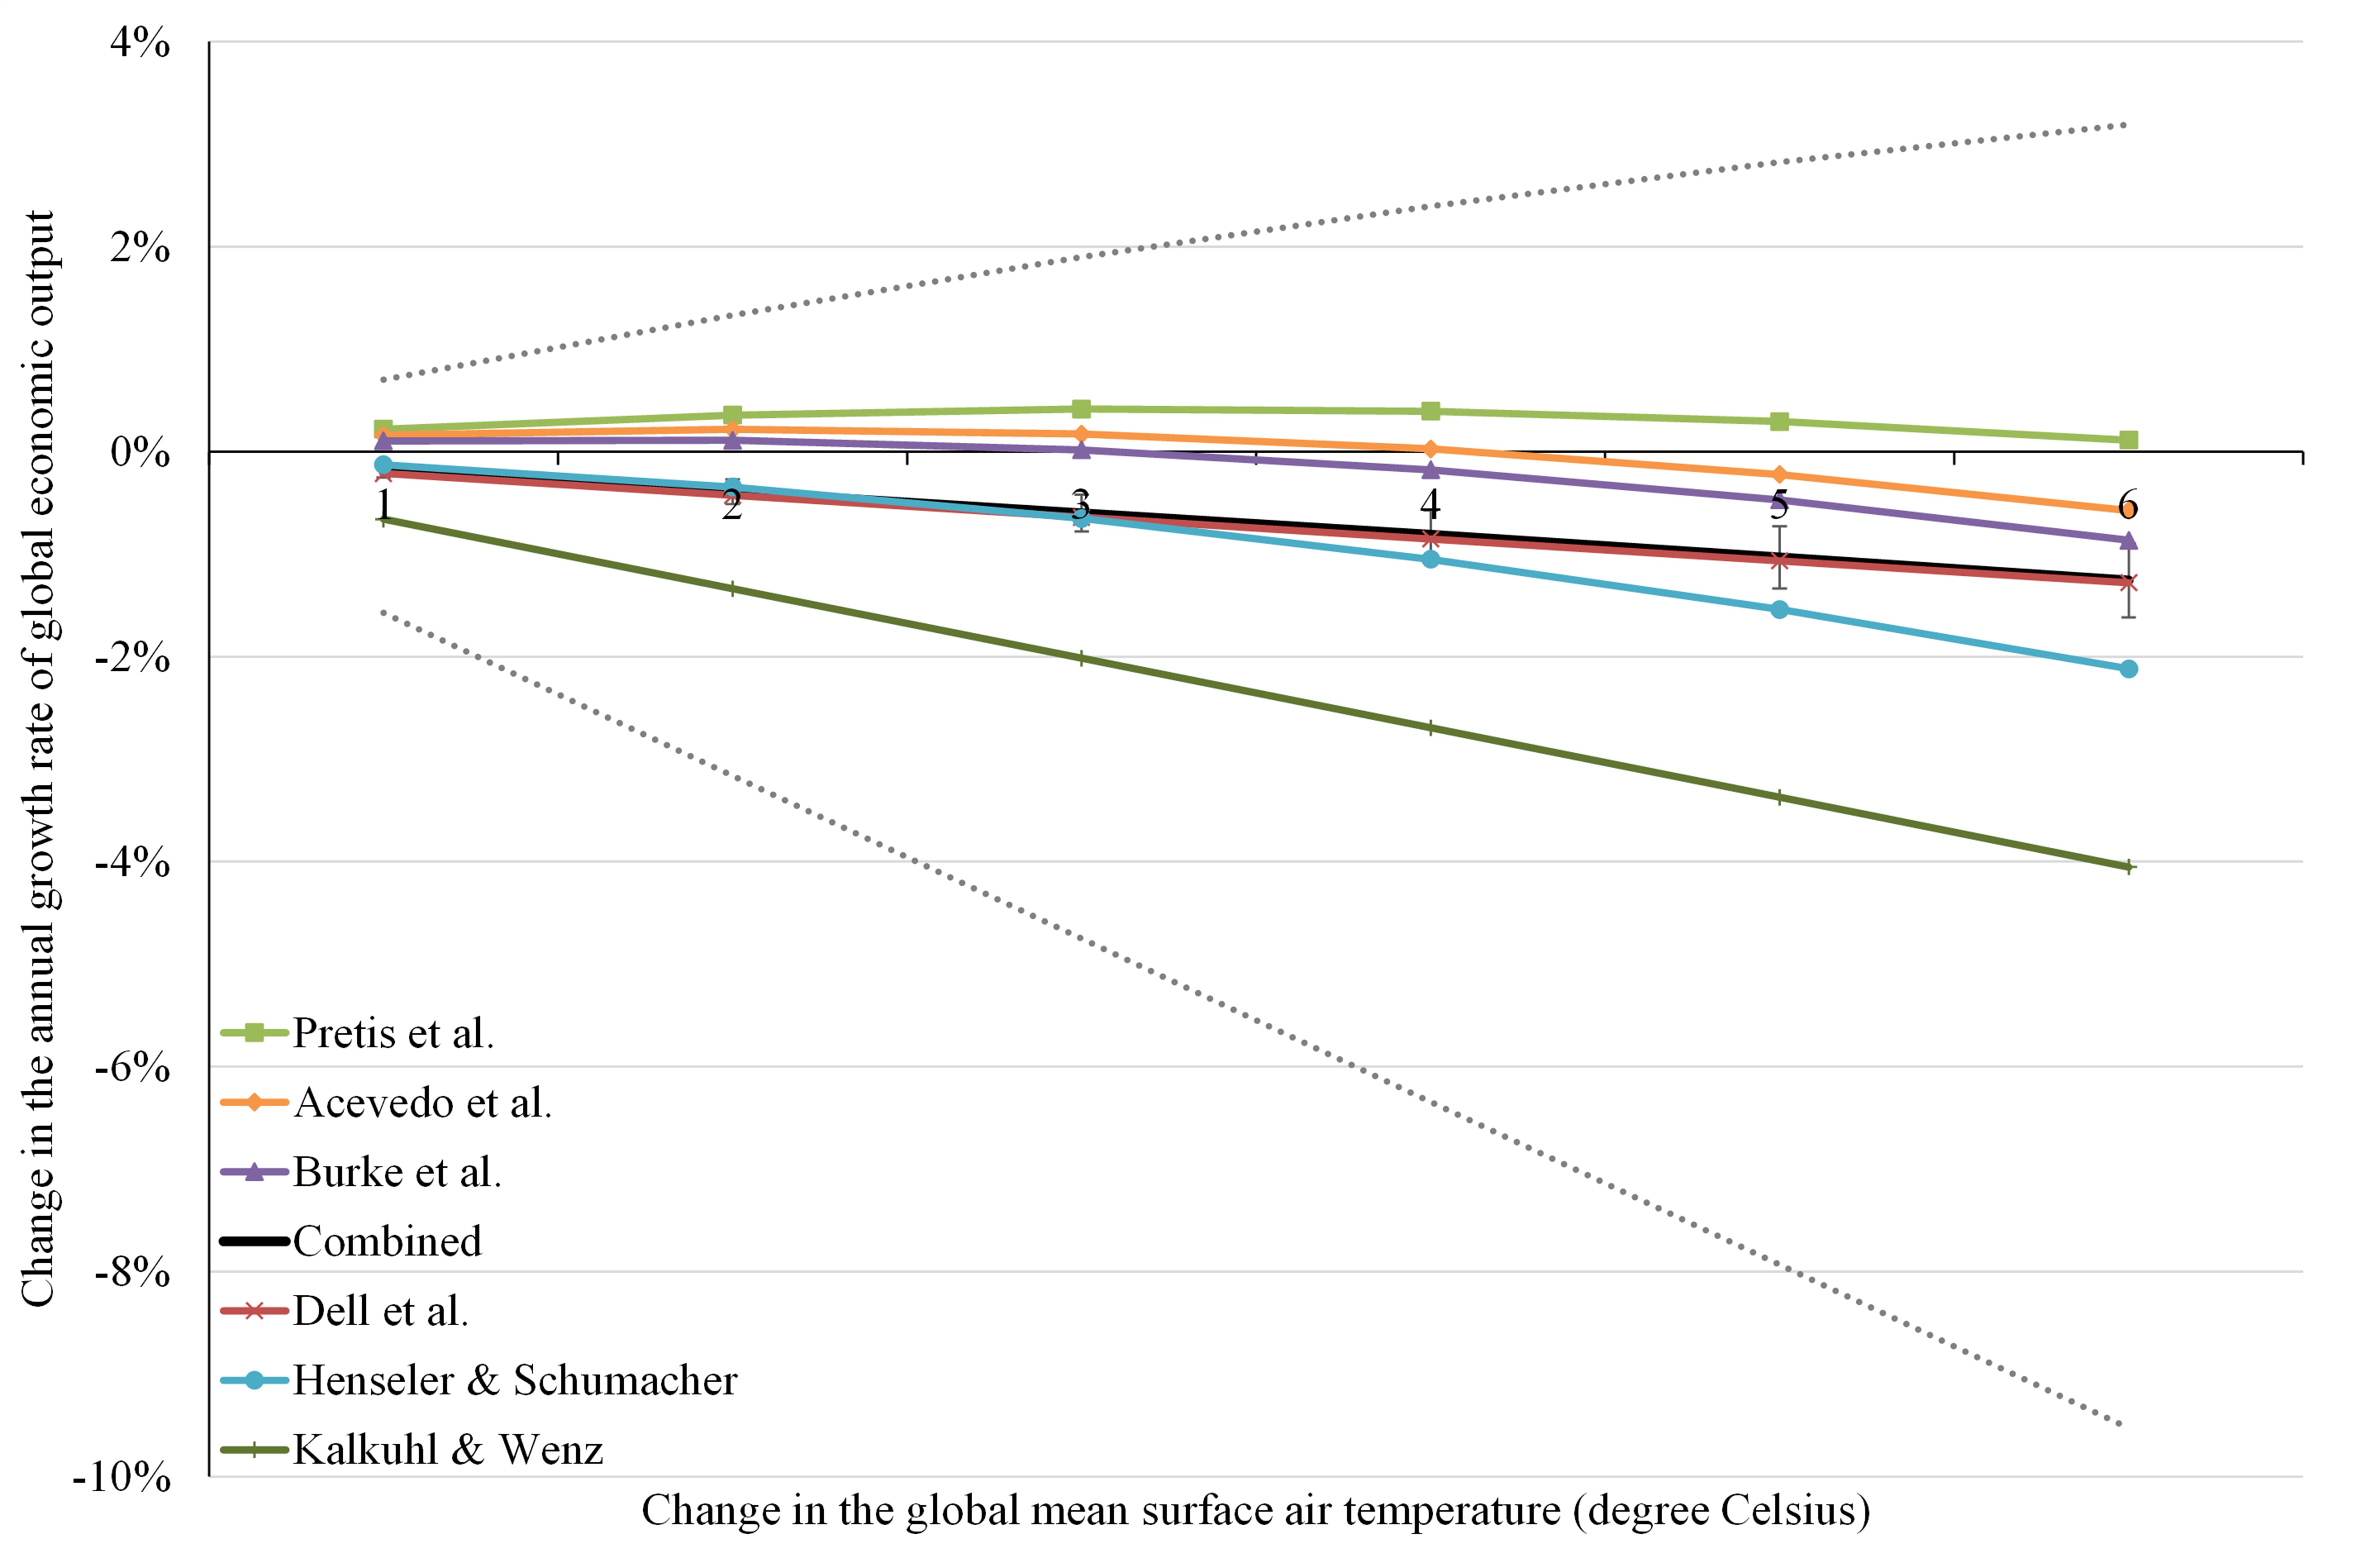
Six studies estimate the impact of temperature levels on economic growth: Dell et al. (2012), Burke et al. (2015), Pretis et al. (2018), Henseler and Schumacher (2019), Acevedo et al. (2020) and Kikstra et al. (2021).999A seventh study does not report parameter estimates (Callahan and Mankin, 2022). The impact of temperature levels on economic growth numerically dominates the impact of temperature changes in Kalkuhl and Wenz (2020).
Note that all these papers use country fixed effects, nullifying a systematic effect of climate on economic growth rates in sample. However, in this specification, the impact of climate change on economic growth will last forever.
Temperature has a linear impact on economic growth in the preferred specifications of Dell et al. (2012) and Kalkuhl and Wenz (2020), but in the former study the impact is significant only in poorer countries. In the other four papers, there is a parabolic relationship between temperature and growth.
Figure 2 shows the effect sizes. The functions are shifted so that, for each country, pre-industrial temperatures have no effect on growth. The global effect is the weighted average of the national effects, using 2015 GDP as weights. Global effect sizes vary between small positive (in three of six studies for moderate warming) and large negative impacts—Newell et al. (2021) find that only models with positive impacts are supported by cross-validation tests. According to the most pessimistic study (Kalkuhl and Wenz, 2020), 3 warming would end economic growth.
Figure 2 also shows the impact of all six studies together, shrunk to their average.101010Alternatively, use Dell as the prior and update this with the other five studies to find the posterior. The combined impact is very close to that of the first study (Dell et al., 2012). The confidence interval is narrow. Shrinkage tends to lead to overconfidence and may be inappropriate in this case as these studies use much the same data—the different effect sizes are therefore all the more striking. Figure 2 also shows the most optimistic estimate plus its standard error and the more pessimistic one minus its standard error. The resulting interval is wide. This is appropriate as the differences between the central estimates are large too.
3.2 Temperature change and economic growth
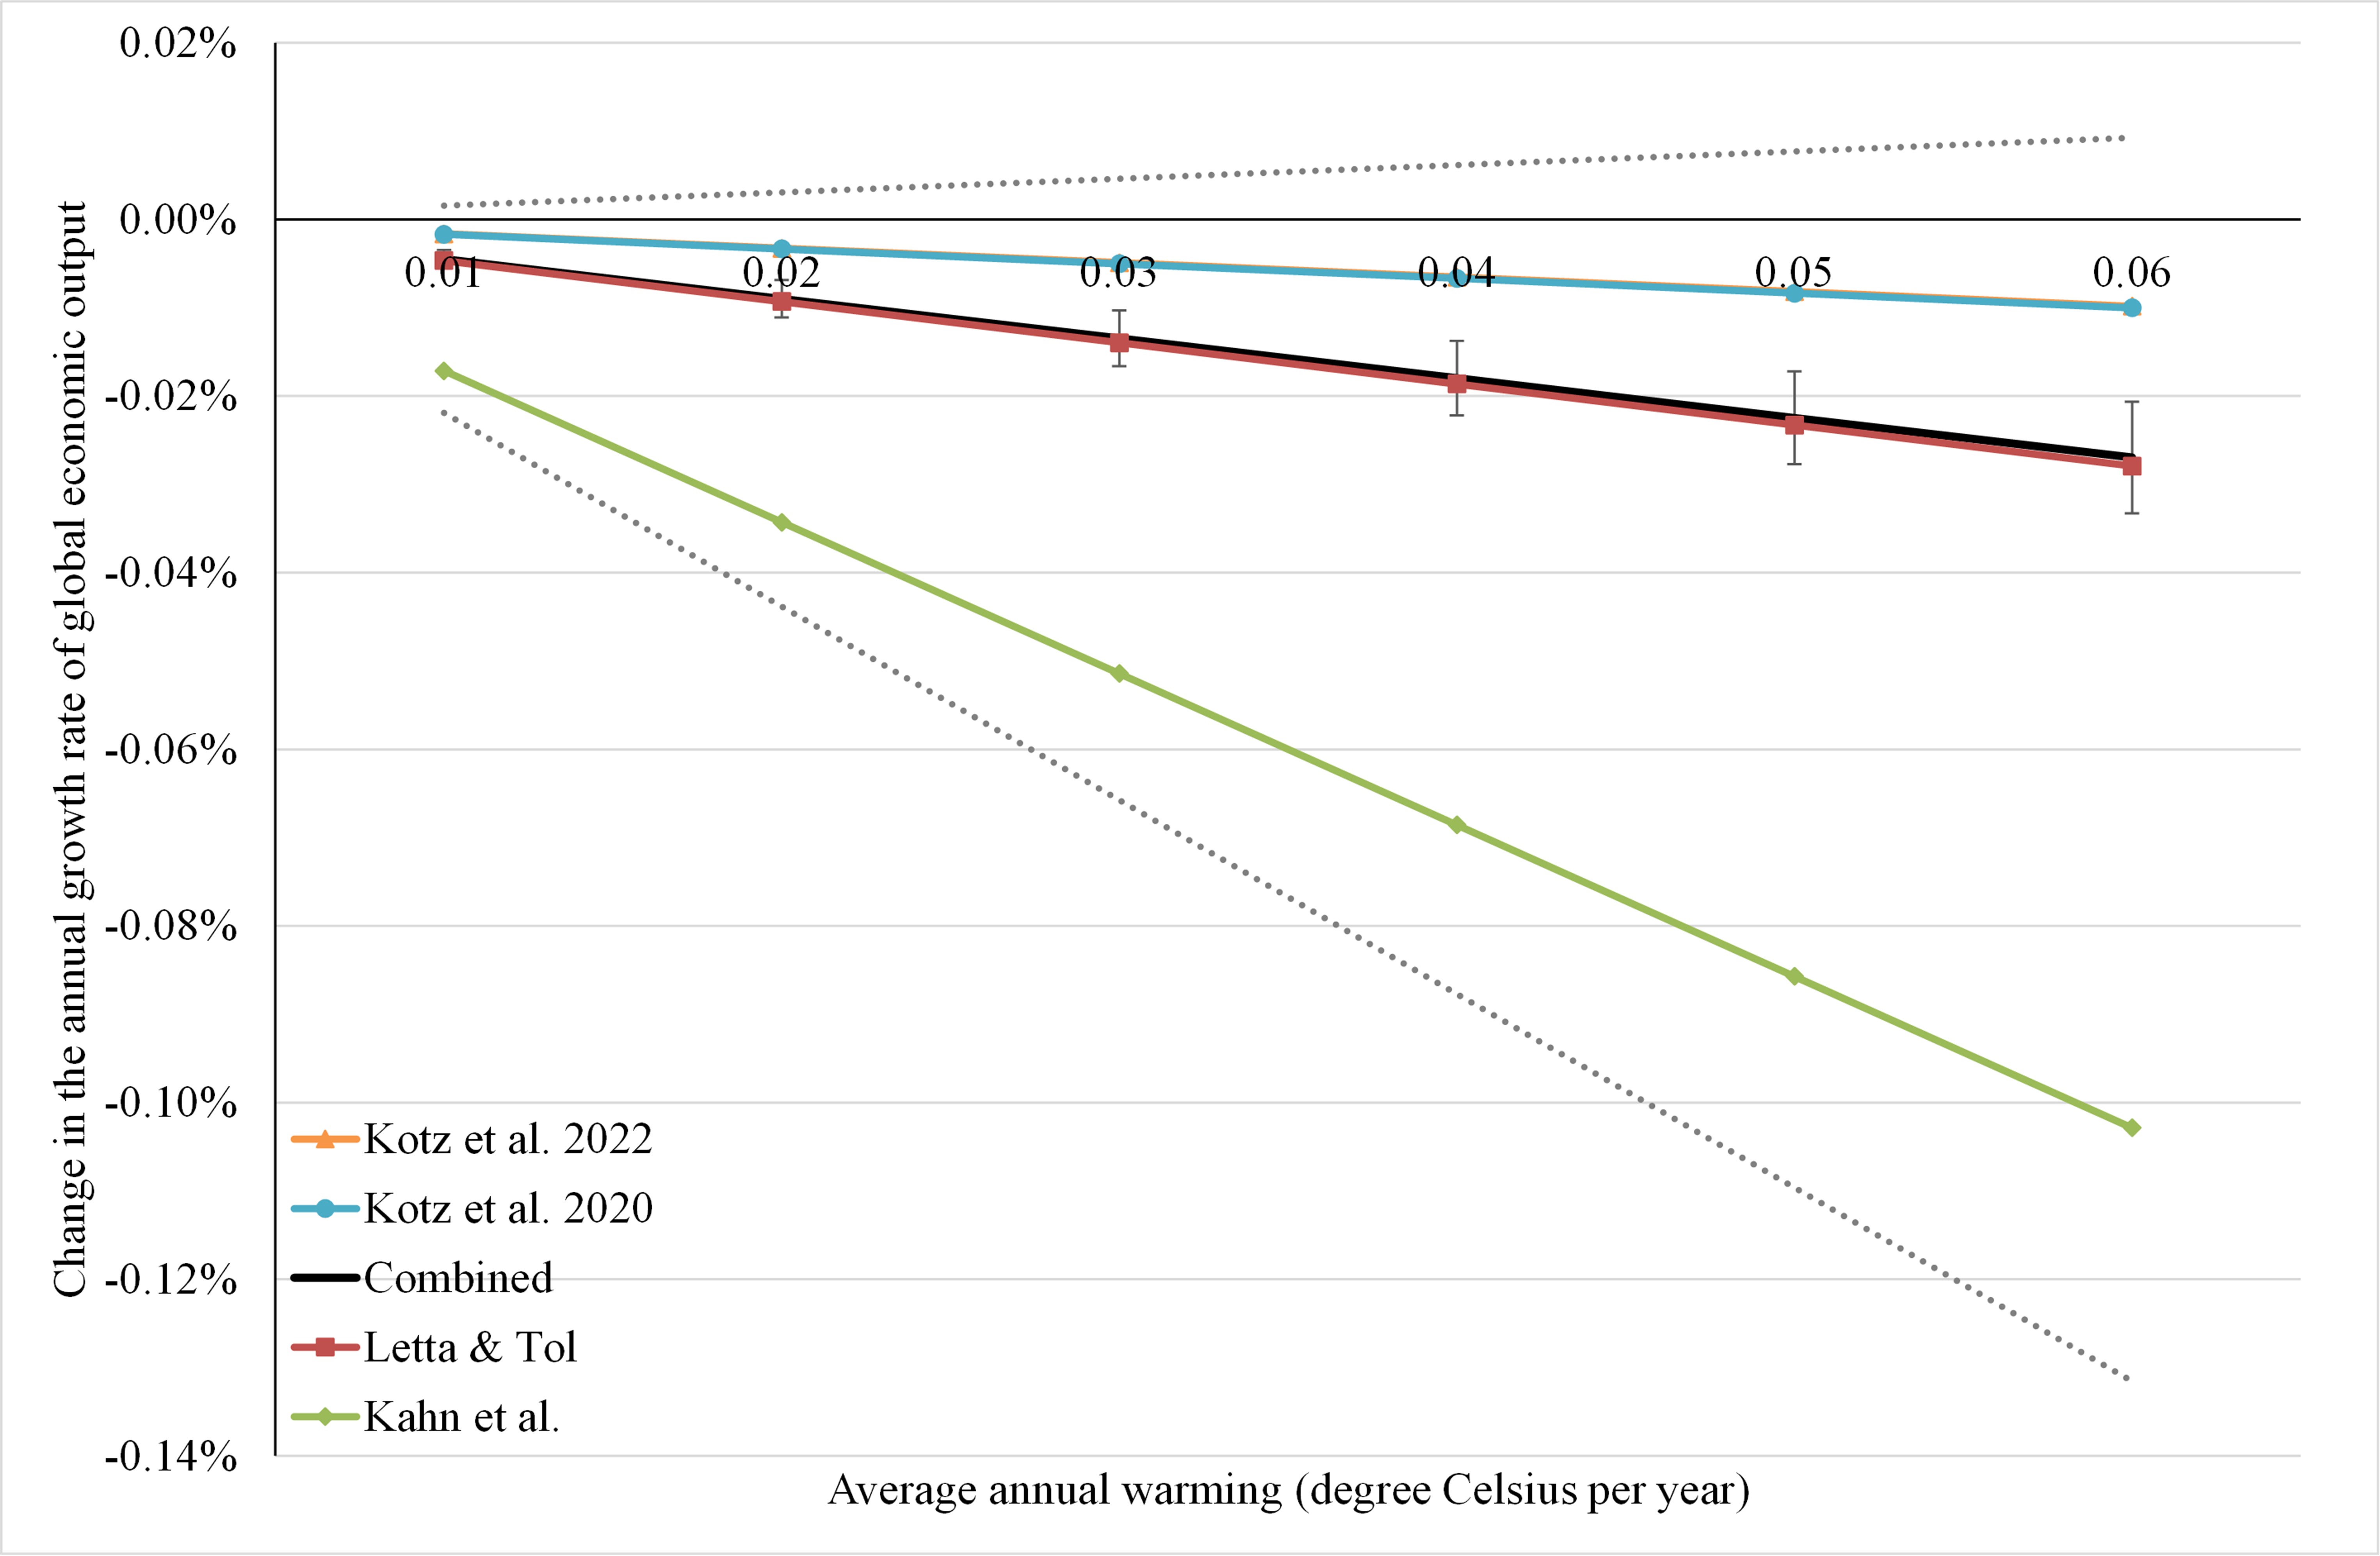
Four studies estimate the effect of temperature change on economic growth: Letta and Tol (2018), Kahn et al. (2019), Kotz et al. (2021) and Kotz et al. (2022). As noted above, Kalkuhl and Wenz (2020) also estimate this but prefer a specification in which the impact of temperature level dominates the impact of temperature change.
Letta and Tol (2018) finds a linear effect that only affects poor countries. Kotz et al. (2021, 2022) also use a linear specification but weather shocks affect all countries; the effect is statistically significantly larger in warmer countries, but the effect size is too small to meaningfully affect projections of climate change. Kahn et al. (2019) find that all countries are affected equally, but that hot shocks have a larger impact than cold shocks.
Weather is stochastic. In a stationary climate, the models of Letta and Tol (2018) and Kotz et al. (2021, 2022) predict that the impact of negative and positive temperature shocks cancel out. In a warming climate, positive shocks are more likely and, as the models are linear, the expected impact on growth is proportional to the rate of warming. In the model of Kahn et al. (2019), a stationary climate does have a negative effect on economic growth, assumed to be offset by the country fixed effects.111111As they define temperature shocks relative to the mean, the impact of climate change is transient by construction, just as it is in Letta and Tol (2018) and Kotz et al. (2021, 2022), provided that climate change does not affect the skewness of the temperature distribution. In a warming climate, the expected impact on growth is the sum of average reduction in negative shocks and the average increase in positive shocks.
Figure 3 shows the estimated effect sizes, as a function of the rate of warming rather than its level. The two results by Kotz et al. (2021, 2022) are very similar and least pessimistic. Kahn et al. (2019) shows the largest effects. Letta and Tol (2018) is somewhere in between and very close to the combined effect. Shrinkage leads again to overly confident results, so Figure 3 also shows the top of Kotz’ confidence interval and the bottom of Kahn’s.
4 Reconciling estimates
There are two sets of estimates of the economic impact of climate change. The first set directly studies the impact of climate change. A range of methods is used, including enumerative studies, computable general equilibrium models, Ricardian or other econometric techniques, and elicitation methods. The second set studies the impact of weather shocks, exclusively using econometric methods, and from this one infers the effects of climate change. Other key differences between the two set of studies is that the former leads to a level effect on welfare while the latter is a growth effect on output.
Welfare and output effects are easily reconciled if we assume that consumption is proportional to output—Pizer (1999) shows that the impact of climate change on the savings’ rate is minimal—and note that output studies are incomplete for ignoring the intangible losses due to climate change. For example, some studies of the impact of climate and weather on output assume that health effects are adequately captured by expenditure on medical and funeral services.
A further complication is that welfare effects may arise from a change in the composition rather than the level of economic output. Defensive expenditure—additional coastal protection due to sea level rise, for instance—counts towards economic output but against welfare. Tol et al. (1998) estimate that 7-25% of impact estimates are the costs of adaptation; I use their midpoint of 16% below. Again, estimates of the impact of weather shocks on economic output are a lower bound on estimates of the impact on welfare.
Level and growth effects are harder to reconcile. Previous studies mixed growth and level effects without further ado in a graph (Kahn et al., 2019, Rose et al., 2022) or a meta-analysis Howard and Sterner (2017). This is inadequate. A growth effect implies a level effect, of course, but for a particular year, and conditional on assumptions on the accumulation of weather shocks into climate change and on the shape of the impact function. Fankhauser and Tol (2005) show that the growth effect implied by a level effect is contingent on the assumed growth model and its parameters as well as on the rate of climate change. Below, I assess the growth effect of the level impact. I then accumulate both implied and estimated growth effects along a particular scenario so as to compare the results of these two strands of literature.
4.1 Growth effects
The economic impact of climate change has an apparent effect on economic growth. Suppose that climate change scales down economic output by a factor , where denotes the economic impact of climate change (Nordhaus, 1992, 1993). If output is a Cobb-Douglas function of capital and labour then, by log-linearization and differentiation, the growth rate of the economy
| (2) |
where is output at time , is total factor productivity, is the capital stock, is the labour force and is the capital elasticity of output; . Growth is slower if , that is, if climate change damages are increasing.
The apparent impact on economic growth is probably small. If the impact is 1.00% in year and 1.01% in the year after, . The apparent growth effect is large only if damages are high, if the impact function is highly non-linear, or if climate change very rapid.
The actual impact is larger than the apparent one. Contrast two output levels
| (3) |
for and .
In a Solow-Swan model of economic growth, and are exogenous. Then the change in the growth rate of the economy
| (4) |
where is the savings rate. The final equality holds if the capital stock is in its steady-state . Equation (4) holds for the year immediately following the impact. In later years, the impact on growth equals
| (5) |
This shows that the impact of climate change on economic growth is transient: The effect fades away—as in the econometric studies that have growth depend on the change in temperature.
The growth effect fades away quickly. would be reasonable parameter choices. The cumulative effect is around: .
In new growth models, where total factor productivity is endogenous, the impact of an output shock is also transient. In unified growth models, where the labour force too is endogenous, shocks are transient too, unless the shock happens to push the economy from a Solowian to a Malthusian equilibrium or vice versa.
The hypothesis, furthered by Dell et al. (2012) and Burke et al. (2015), that the level of climate change would affect the growth rate of the economy is thus inconsistent with the theory of economic growth. Kahn et al. (2019, Appendix A2) reach the same conclusion and discuss the implied econometric issues. The Dell-Burke hypothesis is tested by Kotz et al. (2021, 2022) and rejected. Kalkuhl and Wenz (2020) similarly estimate a model in which both temperature level and temperature change affect economic growth, to find that the level is not significant; they nonetheless keep levels in their preferred specification, and this effect dominates numerically. Newell et al. (2021) use cross-validation tests; out of 800 specifications, only 9 are valid, 7 where temperature change affects economic growth and 2 where temperature level affects economic growth.121212These 9 valid specification are included in Figure 1.
4.2 Results
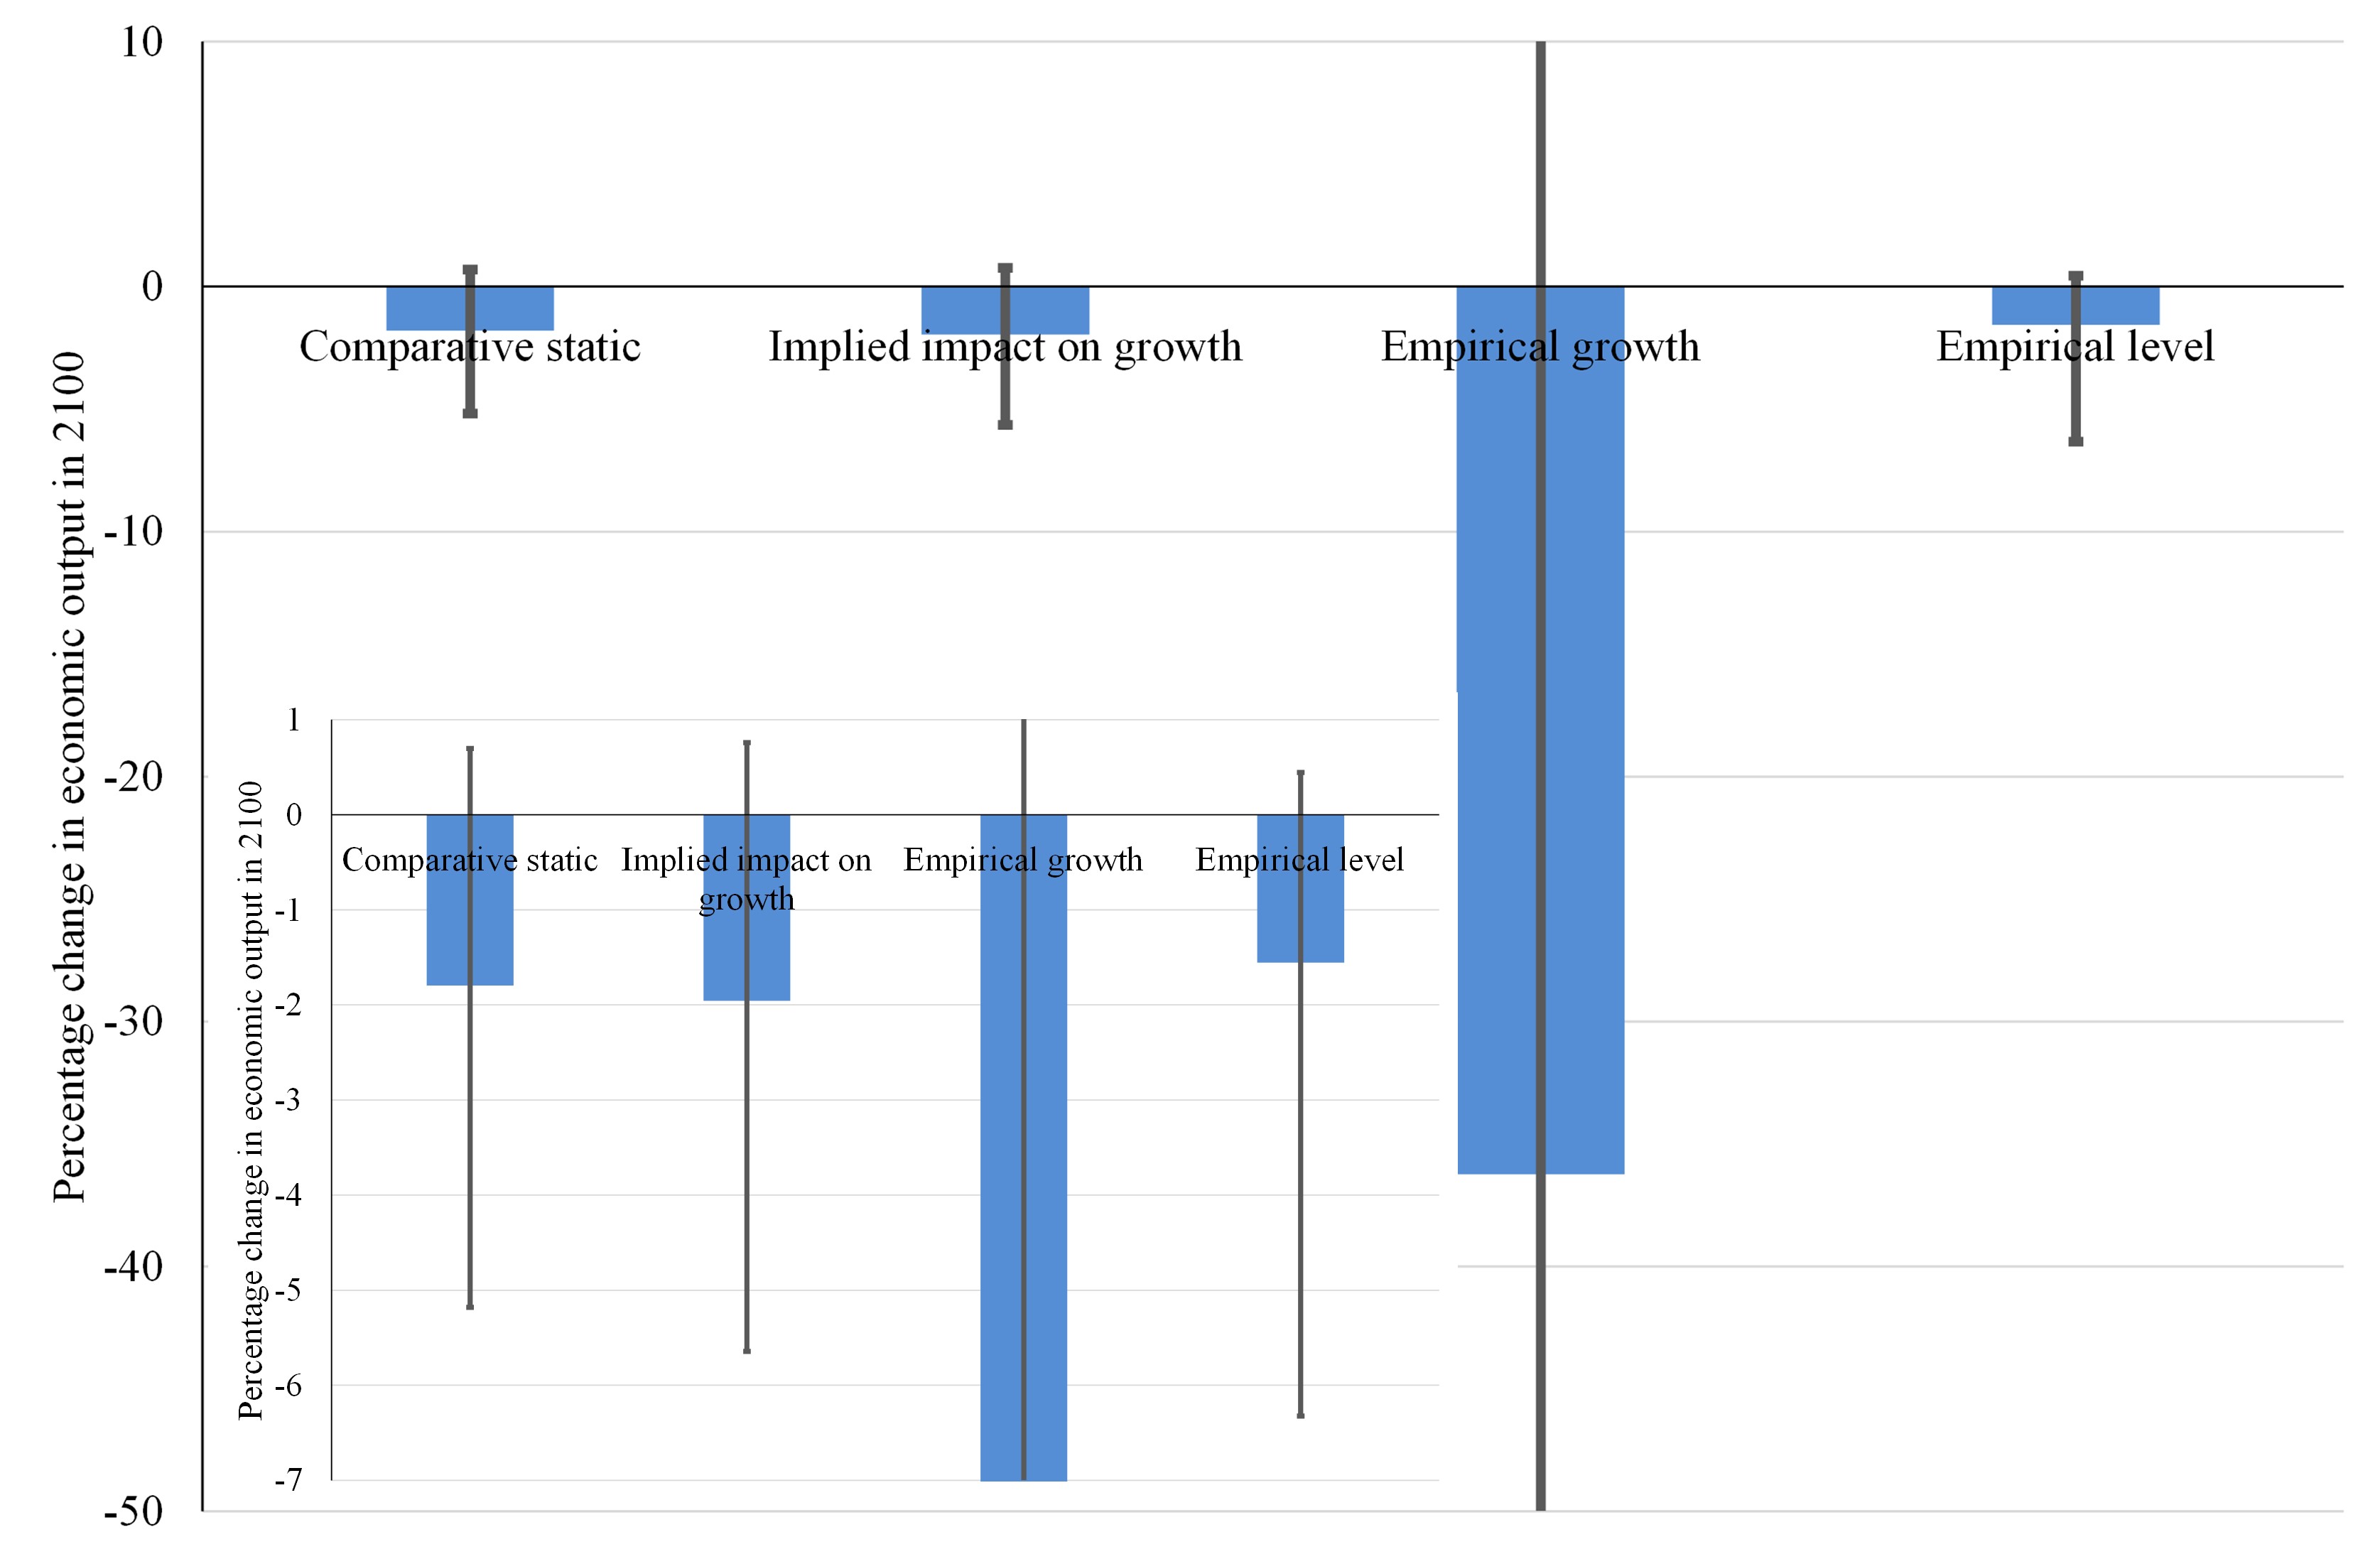
Figure 4 compares the above results. I assume that the world was 1.1 warmer in 2020 than in the time just before the start of the industrial revolution (Gulev et al., 2021). Following Newell et al. (2021), I assume that the world will warm on average 0.04 per year to reach 4.3 by 2100.131313This is not very likely Srikrishnan et al. (2022), but makes comparison to previous results easier.
The first column in Figure 4 shows the comparative static impact as discussed in Section 2 for 4.3 warming, limited to the market impacts and assuming that 39% of impacts lead to a reduction of economic output.14141455% of impacts are market impacts, 16% are defensive investment. The second column shows the implied impact on economic growth, accumulated over the 80 year period. The latter effect is somewhat smaller than the former, 1.80% v 1.65% of GDP.
The third column shows the cumulative effect on economic output according to the econometric studies that assume that the level of temperature affects economic growth. These studies are very pessimistic: Economic output would be 36% smaller with than it would be without climate change.
The fourth and final column shows the cumulative effect for the studies that assume that the rate of warming affects economic growth. The central estimate is 1.55% of GDP. This is somewhat smaller than the growth effect estimated above.
Figure 4 also includes the indicative 67% confidence intervals. The comparative static studies show the widest range, the empirical level studies the narrowest. The empirical growth studies are at odds with the rest of the literature. The empirical level studies and the comparative static ones by and large agree.
5 Implications for the social cost of carbon
The social cost of carbon, or its marginal damage, depends on the total impact of climate change. It also depends on the emissions scenario, the parameterisation of the carbon cycle, the rate and extent of warming, and the aggregation of impacts across people, between scenarios, and over time. Instead of exploring that vast parameter space, I report a limited analysis:
-
1.
For each of the 69 estimates in Table LABEL:tab:compstat, I fit Nordhaus’ impact function, the more common among the four single-parameter ones in Table 2, and compute the social cost of carbon.
- 2.
- 3.
-
4.
I use a single scenario (SSP2), a single carbon cycle, a single climate sensitivity (3/tCO2), and a single discount rate (a Ramsey rate with a 1% pure rate of time preference and a relative rate of risk aversion of 1). These are the central values in Tol (2019a).
-
5.
I assume away uncertainty and ambiguity. There is no disaggregation of impacts so that inequity aversion is irrelevant.
This makes for a total of 95 estimates of the social cost of carbon.151515Note that Equation (1) has that per capita income affects total but not marginal impacts.
Table LABEL:tab:compstat shows the estimated social cost of carbon for the 69 estimates of the impact of climate change. The social cost of carbon ranges from -$355/tC to +$587/tC. The lower bound is due to Tol (2002), who finds positive impacts in the near-term; by construction, impacts are then always positive. The upper bound is due to Horowitz (2009), who finds large negative impacts in the near-term. The weighted average is $59/tC, an estimate that is well in line with the literature (Tol, 2021b).
Table 2 shows the estimated social cost of carbon for the 8 alternative impact functions, fitted to all 69 estimates of the total impact. The social cost of carbon varies between $3/tC for the exponential function and $29/tC for the linear function. While the exponential function projects the highest total impacts in the distant future, the linear function projects substantial impacts in the near future. The social cost of carbon is discounted, and thus highest under linearity (Peck and Teisberg, 1994). The higher estimates are a better fit to the data so that the social cost of carbon for the Bayesian model average is $27/tC.
Table B1 shows the estimated social cost of carbon for the four alternative estimation methods, using the best-fitting impact function. Confirming Figure B2. the elicitation studies are the most pessimistic with an estimate of $87/tC. The econometric studies, which are essentially undecided about the impact until it gets really hot, are most optimistic with a social costs of carbon of $1/tC.
Studies of the impact of weather shocks that relate economic growth to temperature are specific to each country. The global impact is approximately quadratic. See Figure 3. Table B2 shows the fitted parameters, as well as the estimated social cost of carbon, which ranges from -$171/tC for the study of Pretis et al. (2018) to +$539/tC for Kikstra et al. (2021), reflecting the respective impacts in the near- and mid-term. Shrinking the 7 alternative estimates leads to a social cost of carbon of $218/tC, which is high compared to the estimates based on the impact of climate change.
Table B3 shows the parameters and the social cost of carbon of the weather studies that relate growth to temperature change. Estimates range from $16/tC for Letta and Tol (2018) to $60/tC for Kahn et al. (2019). The combined estimate is $17/tC, close to three of the four studies, and somewhat lower than the climate impact estimates.
Unsurprisingly, the results for the social costs of carbon are in line with the results for the total impact of climate change. There is a wide range of uncertainty. Different methods yield different results. Elicitation leads to pessimistic estimates, and relating economic growth to temperature levels appears to be unreliable.
6 Discussion and conclusion
I do four things in this paper. First, I update my earlier meta-analysis using the same methods but much more data. Three new results emerge from this. (1) The initially positive impacts have vanished: The central estimate of the economic impact of global warming is always negative. (2) The confidence interval about the estimates has widened considerably, and now includes no impact for very considerable warming. The more we learn about the economic impacts of climate change, the better we understand our ignorance. (3) Elicitation methods give the most pessimistic results, econometric studies the most optimistic ones, with the enumerative methods and computable general equilibrium models in the middle. Two old results remain. (4) The uncertainty about the impact is skewed towards negative surprises. (5) Poorer countries are much more vulnerable than richer ones.
The second contribution is a meta-analysis of the impact of weather shocks, in two parts. Studies that relate economic growth to temperature levels cannot agree on the sign of the impact. Studies that make economic growth a function of temperature change differ an order of magnitude in effect size, but do agree on the sign. The former studies posit that climate change has a permanent effect on economic growth, the latter that the impact is transient.
The third contribution reconciles climate change and weather shocks. The impact on economic growth implied by studies of the impact of climate change are close to the growth impact estimated as a function of temperature change. Growth impacts implied by the temperature level are much larger.
Finally, I assess the implications for the social cost of carbon. The pattern of results for the marginal impact is roughly the same as for the total impact. Because of discounting, the impact of moderate warming is more important for the social cost of carbon than the impact of more pronounced climate change.
The following research gaps appear. Enumerative studies have not been published for a while. New research would reveal whether these papers are really out of date, as is sometimes claimed (National Academies of Sciences, Engineering, and Medicine, 2017). Elicitation studies tend to be pessimistic. It is not clear why supposed experts deviate from the published literature. Computable general equilibrium models draw from the same or similar sets of calibrated impacts, yet produce a range of different impacts. Systematic model comparison would be useful.
The econometric studies, however, show the widest range of results. These come in three groups—the impact of climate on income, the impact of weather on income growth, and the impact of changes in weather on income growth.161616A survey of the many sectoral and regional climate and weather studies is beyond the current paper. There is considerably variation within groups, even when data used are much the same, and more variation between groups, both numerically and conceptually. Econometricians are adept at testing which specification fits the data best; these methods should be applied here (Newell et al., 2021, set an example). Analyses should be better guided by theory. Data sets should be extended to greater regional detail and longer periods.
For the moment, however, Figure 1 presents our best knowledge on the economic impacts of climate change. It is this information, warts and all, that should be used to estimate the social cost of carbon and inform the optimal rate of emission reduction—at least until new, hopefully better studies shine a different light on this question.
References
- Acevedo et al. (2020) S. Acevedo, M. Mrkaic, N. Novta, E. Pugacheva, and P. Topalova. The Effects of Weather Shocks on Economic Activity: What are the Channels of Impact? Journal of Macroeconomics, 65(103207), 2020. doi: 10.1016/j.jmacro.2020.103.
- Ackerman and Stanton (2012) F. Ackerman and E. A. Stanton. Climate risks and carbon prices: Revising the social cost of carbon. Economics - The Open-Access, Open-Assessment E-Journal (2007-2020), 6:1–25, 2012. URL https://ideas.repec.org/a/zbw/ifweej/201210.html.
- Adger (2006) W. N. Adger. Vulnerability. Global Environmental Change, 16(3):268 – 281, 2006. ISSN 0959-3780. URL http://www.sciencedirect.com/science/article/pii/S0959378006000422. Resilience, Vulnerability, and Adaptation: A Cross-Cutting Theme of the International Human Dimensions Programme on Global Environmental Change.
- Anthoff and Tol (2022) D. Anthoff and R. S. J. Tol. Testing the dismal theorem. Journal of the Association of Environmental and Resource Economists, 9(5):885–920, 2022. URL https://doi.org/10.1086/720612.
- Auffhammer (2018) M. Auffhammer. Quantifying economic damages from climate change. Journal of Economic Perspectives, 32(4):33–52, 2018.
- (6) G. Berz. Insuring against catastrophe. Disasters. URL http://www.ourplanet.com/imgversn/113/berz.html.
- Bluedorn et al. (2009) J. C. Bluedorn, A. Valentinyi, and M. Vlassopoulos. The Long-Lived Effects of Historic Climate on the Wealth of Nations. MPRA Paper 18701, University Library of Munich, Germany, Nov. 2009. URL https://ideas.repec.org/p/pra/mprapa/18701.html.
- Bosello et al. (2012) F. Bosello, F. Eboli, and R. Pierfederici. Assessing the economic impacts of climate change. Review of Environment Energy and Economics, pages 1–9, 2012.
- Bosetti et al. (2007) V. Bosetti, E. Massetti, and M. Tavoni. The WITCH Model. Structure, Baseline, Solutions. Working Papers 2007.10, Fondazione Eni Enrico Mattei, Jan. 2007. URL https://ideas.repec.org/p/fem/femwpa/2007.10.html.
- Botzen et al. (2021) W. W. Botzen, F. Estrada, and R. S. Tol. Methodological issues in natural disaster loss normalisation studies. Environmental Hazards, 20(2):112–115, 2021. doi: 10.1080/17477891.2020.1830744.
- Burke et al. (2015) M. Burke, S. M. Hsiang, and E. Miguel. Global non-linear effect of temperature on economic production. Nature, 527(7577):235–239, 2015. doi: 10.1038/nature15725.
- Callahan and Mankin (2022) C. Callahan and J. Mankin. National attribution of historical climate damages. Climatic Change, 172(40), 2022. doi: https://doi.org/10.1007/s10584-022-03387-y.
- Conte et al. (2021) B. Conte, K. Desmet, D. K. Nagy, and E. Rossi-Hansberg. Local sectoral specialization in a warming world. Journal of Economic Geography, 21(4):493–530, 2021.
- Cruz and Rossi-Hansberg (2021) J.-L. Cruz and E. Rossi-Hansberg. The economic geography of global warming. Working Paper 28466, National Bureau of Economic Research, February 2021. URL http://www.nber.org/papers/w28466.
- d’Arge (1979) R. d’Arge. Climate and economic activity. In Proceedings of the World Climate Conference, a conference of experts on climate and mankind, Geneva, 12-13 February 1979, pages 652–681. World Meteorological Organization, Geneva, 1979.
- Dell et al. (2012) M. Dell, B. F. Jones, and B. A. Olken. Temperature shocks and economic growth: Evidence from the last half century. American Economic Journal: Macroeconomics, 4(3):66–95, July 2012. doi: 10.1257/mac.4.3.66. URL http://www.aeaweb.org/articles?id=10.1257/mac.4.3.66.
- Dell et al. (2014) M. Dell, B. F. Jones, and B. A. Olken. What do we learn from the weather? the new climate-economy literature. Journal of Economic Literature, 52(3):740–798, 2014.
- Dellink et al. (2019) R. Dellink, E. Lanzi, and J. Chateau. The Sectoral and Regional Economic Consequences of Climate Change to 2060. Environmental & Resource Economics, 72(2):309–363, February 2019.
- Deryugina and Hsiang (2017) T. Deryugina and S. Hsiang. The marginal product of climate. Working Paper 24072, National Bureau of Economic Research, November 2017. URL http://www.nber.org/papers/w24072.
- Desmet and Rossi-Hansberg (2015) K. Desmet and E. Rossi-Hansberg. On the spatial economic impact of global warming. Journal of Urban Economics, 88(C):16–37, 2015.
- Eboli et al. (2010) F. Eboli, R. Parrado, and R. Roson. Climate-change feedback on economic growth: Explorations with a dynamic general equilibrium model. Environment and Development Economics, 15(5):515–533, 2010. doi: 10.1017/S1355770X10000252.
- Fankhauser (1995) S. Fankhauser. Valuing Climate Change - The Economics of the Greenhouse, volume 1. EarthScan, London, 1995. ISBN 1-85383-237-5.
- Fankhauser and Tol (1995) S. Fankhauser and R. S. J. Tol. A recalculation of the social costs of climate change—a comment. The Ecologist, Occasional paper:16–18, 1995.
- Fankhauser and Tol (2005) S. Fankhauser and R. S. J. Tol. On climate change and economic growth. Resource and Energy Economics, 27(1):1–17, 2005. URL https://www.sciencedirect.com/science/article/pii/S0928765504000338.
- Gandhi et al. (2022) S. Gandhi, M. E. Kahn, R. Kochhar, S. Lall, and V. Tandel. Adapting to flood risk: Evidence from a panel of global cities. Working Paper 30137, National Bureau of Economic Research, June 2022. URL http://www.nber.org/papers/w30137.
- Golosov et al. (2014) M. Golosov, J. Hassler, P. Krusell, and A. Tsyvinski. Optimal taxes on fossil fuel in general equilibrium. Econometrica, 82(1):41–88, 2014. doi: 10.3982/ECTA10217.
- Gulev et al. (2021) S. K. Gulev, P. W. Thorne, J. Ahn, F. J. Dentener, C. M. Domingues, S. Gerland, D. Gong, D. S. Kaufman, H. C. Nnamchi, J. Quaas, J. A. Rivera, S. Sathyendranath, S. L. Smith, B. Trewin, K. von Schuckmann, and R. S. Vose. Changing state of the climate system. In V. Masson-Delmotte, P. Zhai, A. Pirani, S. L. Connors, C. Péan, S. Berger, N. Caud, Y. Chen, L. Goldfarb, M. I. Gomis, M. Huang, K. Leitzell, E. Lonnoy, J. B. R. Matthews, T. K. Maycock, T. Waterfield, O. Yelekçi, R. Yu, and B. Zhou, editors, Climate Change 2021: The Physical Science Basis—Contribution of Working Group I to the Sixth Assessment Report of the Intergovernmental Panel on Climate Change, chapter 2, pages 287–422. Cambridge University Press, Cambridge, 2021.
- Gunasekera et al. (2008) D. Gunasekera, M. Ford, E. Heyhoe, A. Gurney, H. Ahammad, S. Phipps, I. Harman, J. Finnigan, and M. Brede. Global integrated assessment model: A new analytical tool for assessing climate change risks and policies. Australian Commodities, 15(1):195–216, 2008.
- Hanemann (2008) W. M. Hanemann. What is the Economic Cost of Climate Change? Department of Agricultural & Resource Economics, UC Berkeley, Working Paper Series qt9g11z5cc, Department of Agricultural & Resource Economics, UC Berkeley, Aug. 2008. URL https://ideas.repec.org/p/cdl/agrebk/qt9g11z5cc.html.
- Henseler and Schumacher (2019) M. Henseler and I. Schumacher. The impact of weather on economic growth and its production factors. Climatic Change, 154(3):417–433, 2019. doi: 10.1007/s10584-019-02441-.
- Hope (2006) C. W. Hope. The marginal impact of CO2 from PAGE2002: An integrated assessment model incorporating the IPCC’s five reasons for concern. Integrated Assessment, 6(1):19–56, 2006.
- Hope (2011) C. W. Hope. The social cost of CO2 from the PAGE09 model. Economics—The Open-Access, Open-Assessment E-Journal, 39:1–32, 2011.
- Horowitz (2009) J. K. Horowitz. The income-temperature relationship in a cross-section of countries and its implications for predicting the effects of global warming. Environmental and Resource Economics, 44(4):475–493, 2009. doi: 10.1007/s10640-009-9296-2.
- Howard and Sterner (2017) P. H. Howard and T. Sterner. Few and not so far between: A meta-analysis of climate damage estimates. Environmental and Resource Economics, 68(1):197–225, Sep 2017. URL https://doi.org/10.1007/s10640-017-0166-z.
- Howard and Sylvan (2020-09) P. H. Howard and D. Sylvan. Wisdom of the experts: Using survey responses to address positive and normative uncertainties in climate-economic models. Climatic Change, 162(2):213–232, September 2020-09.
- Howard and Sylvan (2021-07) P. H. Howard and D. Sylvan. Gauging economic consensus on climate change. Technical report, Institute for Policy Integrity, New York University School of Law, July 2021-07. URL https://policyintegrity.org/files/publications/Economic_Consensus_on_Climate.pdf.
- Kahn et al. (2019) M. E. Kahn, K. Mohaddes, R. N. C. Ng, M. H. Pesaran, M. Raissi, and J.-C. Yang. Long-term macroeconomic effects of climate change: A cross-country analysis. Working paper, University of Cambridge, 2019.
- Kalkuhl and Wenz (2020) M. Kalkuhl and L. Wenz. The impact of climate conditions on economic production. Evidence from a global panel of regions. Journal of Environmental Economics and Management, 103:102360, 2020. URL http://www.sciencedirect.com/science/article/pii/S0095069620300838.
- Kikstra et al. (2021) J. S. Kikstra, P. Waidelich, J. Rising, D. Yumashev, C. Hope, and C. M. Brierley. The social cost of carbon dioxide under climate-economy feedbacks and temperature variability. Environmental Research Letters, 16(9), 2021. doi: 10.1088/1748-9326/ac1d0b.
- Kjellstrom et al. (2009) T. Kjellstrom, R. S. Kovats, S. J. Lloyd, T. Holt, and R. S. J. Tol. The direct impact of climate change on regional labor productivity. Archives of Environmental & Occupational Health, 64(4):217–227, 2009. URL https://doi.org/10.1080/19338240903352776.
- Kolstad and Moore (2020) C. D. Kolstad and F. C. Moore. Estimating the economic impacts of climate change using weather observations. Review of Environmental Economics and Policy, 14(1):1–24, 2020. URL https://doi.org/10.1093/reep/rez024.
- Kompas et al. (2018) T. Kompas, V. H. Pham, and T. N. Che. The effects of climate change on gdp by country and the global economic gains from complying with the paris climate accord. Earth’s Future, 6(8):1153–1173, 2018. URL https://agupubs.onlinelibrary.wiley.com/doi/abs/10.1029/2018EF000922.
- Kotz et al. (2021) M. Kotz, L. Wenz, A. Stechemesser, M. Kalkuhl, and A. Levermann. Day-to-day temperature variability reduces economic growth. Nature Climate Change, 11(4):319–325, 2021. doi: 10.1038/s41558-020-00985-5.
- Kotz et al. (2022) M. Kotz, A. Levermann, and L. Wenz. The effect of rainfall changes on economic production. Nature, 601(7892):223–227, 2022. doi: 10.1038/s41586-021-04283-8.
- Lemoine (2018) D. Lemoine. Sufficient statistics for the cost of climate change. Working Paper 25008, National Bureau of Economic Research, September 2018. URL http://www.nber.org/papers/w25008.
- Letta and Tol (2018) M. Letta and R. S. J. Tol. Weather, climate and total factor productivity. Environmental and Resource Economics, Jun 2018. URL https://doi.org/10.1007/s10640-018-0262-8.
- Maddison and Rehdanz (2011) D. Maddison and K. Rehdanz. The impact of climate on life satisfaction. Ecological Economics, 70(12):2437–2445, 2011. URL http://www.sciencedirect.com/science/article/pii/S0921800911003028.
- Maddison (2003) D. J. Maddison. The amenity value of the climate: the household production function approach. Resource and Energy Economics, 25(2):155–175, 2003.
- Manne and Richels (2005) A. S. Manne and R. G. Richels. Key economic sectors and services. In R. Loulou, J.-P. Waaub, and G. Zaccour, editors, MERGE: An integrated assessment model for global climate change, book section 7, pages 175–189. Springer, New York, 2005.
- Manne et al. (1995) A. S. Manne, R. O. Mendelsohn, and R. G. Richels. MERGE: A model for evaluating regional and global effects of GHG reduction policies. Energy Policy, 23(1):17–34, 1995. doi: https://doi.org/10.1016/0301-4215(95)90763-W.
- McCallum et al. (2013) S. McCallum, T. Dworak, A. Prutsch, N. Kent, J. Mysiak, F. Bosello, J. Klostermann, A. Dlugolecki, E. Williams, M. König, M. Leitner, K. Miller, M. Harley, R. Smithers, M. Berglund, N. Glas, L. Romanovska, K. van de Sandt, R. Bachschmidt, S. Völler, and L. Horrocks. Support to the development of the eu strategy for adaptation to climate change: Background report to the impact assessment, part i – problem definition, policy context and assessment of policy options. Technical report, Environment Agency Austria, 2013. URL https://ec.europa.eu/clima/system/files/2016-11/background_report_part1_en.pdf.
- Mendelsohn et al. (2000) R. O. Mendelsohn, M. E. Schlesinger, and L. J. Williams. Comparing impacts across climate models. Integrated Assessment, 1(1):37–48, 2000.
- Meyer and Cooper (1995) A. Meyer and T. Cooper. A recalculation of the social costs of climate change. The Ecologist, Occasional paper:1–15, 1995.
- National Academies of Sciences, Engineering, and Medicine (2017) National Academies of Sciences, Engineering, and Medicine. Valuing Climate Damages: Updating Estimation of the Social Cost of Carbon Dioxide. The National Academies Press, Washington, DC, 2017. ISBN 978-0-309-45420-9. URL https://www.nap.edu/catalog/24651/valuing-climate-damages-updating-estimation-of-the-social-cost-of.
- Newell et al. (2021) R. Newell, B. Prest, and S. Sexton. The gdp-temperature relationship: Implications for climate change damages. Journal of Environmental Economics and Management, 108, 2021. doi: 10.1016/j.jeem.2021.102445.
- Ng and Zhao (2011) P. Ng and X. Zhao. No matter how it is measured, income declines with global warming. Ecological Economics, 70(5):963–970, 2011. ISSN 0921-8009. doi: https://doi.org/10.1016/j.ecolecon.2010.12.012.
- Nordhaus (1982) W. D. Nordhaus. How fast should we graze the global commons? American Economic Review, 72(2):242–246, 1982.
- Nordhaus (1991) W. D. Nordhaus. To slow or not to slow: The economics of the greenhouse effect. Economic Journal, 101(444):920–937, 1991.
- Nordhaus (1992) W. D. Nordhaus. An optimal transition path for controlling greenhouse gases. Science, 258(5086):1315–1319, 1992. doi: 10.1126/science.258.5086.1315. URL https://www.science.org/doi/abs/10.1126/science.258.5086.1315.
- Nordhaus (1993) W. D. Nordhaus. Rolling the ‘DICE’: An optimal transition path for controlling greenhouse gases. Resource and Energy Economics, 15(1):27–50, 1993.
- Nordhaus (1994a) W. D. Nordhaus. Expert opinion on climate change. American Scientist, 82(1):45–51, 1994a.
- Nordhaus (1994b) W. D. Nordhaus. Managing the Global Commons: The Economics of Climate Change. The MIT Press, Cambridge, 1994b.
- Nordhaus (2006) W. D. Nordhaus. Geography and macroeconomics: New data and new findings. Proceedings of the National Academy of Science, 103(10):3510–3517, 2006. URL www.pnas.org/cgi/doi/10.1073/pnas.0509842103.
- Nordhaus (2008) W. D. Nordhaus. A Question of Balance—Weighing the Options on Global Warming Policies. Yale University Press, New Haven, 2008.
- Nordhaus (2013) W. D. Nordhaus. The Climate Casino—Risk, Uncertainty and Economics for a Warming World. Yale University Press, New Haven, 2013.
- Nordhaus and Boyer (2000) W. D. Nordhaus and J. G. Boyer. Warming the World: Economic Models of Global Warming. The MIT Press, Cambridge, Massachusetts - London, England, 2000. ISBN 0-262-14071-3.
- Nordhaus and Moffat (2017) W. D. Nordhaus and A. Moffat. A survey of global impacts of climate change: Replication, survey methods, and a statistical analysis. Working Paper 23646, National Bureau of Economic Research, August 2017. URL http://www.nber.org/papers/w23646.
- Nordhaus and Yang (1996) W. D. Nordhaus and Z. Yang. A regional dynamic general-equilibrium model of alternative climate-change strategies. American Economic Review, 86(4):741–765, 1996.
- Peck and Teisberg (1994) S. Peck and T. Teisberg. Optimal carbon emissions trajectories when damages depend on the rate or level of global warming. Climatic Change, 28(3):289–314, 1994. doi: 10.1007/BF01104138.
- Pizer (1999) W. A. Pizer. The optimal choice of climate change policy in the presence of uncertainty. Resource and Energy Economics, 21(3):255–287, 1999. ISSN 0928-7655. URL https://www.sciencedirect.com/science/article/pii/S0928765599000056.
- Plambeck and Hope (1996) E. L. Plambeck and C. W. Hope. PAGE95—an updated valuation of the impacts of global warming. Energy Policy, 24(9):783–793, 1996.
- Pretis et al. (2018) F. Pretis, M. Schwarz, K. Tang, K. Haustein, and M. R. Allen. Uncertain impacts on economic growth when stabilizing global temperatures at 1.5 or 2 warming. Philosophical Transactions of the Royal Society A: Mathematical, Physical and Engineering Sciences, 376(2119):20160460, 2018. doi: 10.1098/rsta.2016.0460.
- Rehdanz and Maddison (2005) K. Rehdanz and D. J. Maddison. Climate and happiness. Ecological Economics, 52(1):111–125, 2005.
- Rose et al. (2022) S. Rose, D. Diaz, T. Carleton, L. Drouet, C. Guivarch, A. Méjean, and F. Piontek. Cross-working group box: Estimating global economic impacts from climate change. In H.-O. Pörtner, D. Roberts, M. Tignor, E. Poloczanska, K. Mintenbeck, A. Alegría, M. Craig, S. Langsdorf, S. Löschke, V. Möller, A. Okem, and B. Rama, editors, Climate Change 2022: Impacts, Adaptation, and Vulnerability. Contribution of Working Group II to the Sixth Assessment Report of the Intergovernmental Panel on Climate Change, book section 16, pages 111–116. Cambridge University Press, Cambridge, 2022.
- Roson and van der Mensbrugghe (2012) R. Roson and D. van der Mensbrugghe. Climate change and economic growth: Impacts and interactions. International Journal of Sustainable Economy, 4(3):270–285, 2012.
- Sartori and Roson (2016) M. Sartori and R. Roson. Estimation of climate change damage functions for 140 regions in the GTAP9 database. Technical report, EcMod, July 2016. URL https://ideas.repec.org/p/ekd/009007/9171.html.
- Schauer (1995) M. J. Schauer. Estimation of the greenhouse gas externality with uncertainty. Environmental & Resource Economics, 5(1):71–82, 1995. doi: 10.1007/BF00691910.
- Srikrishnan et al. (2022) V. Srikrishnan, Y. Guan, R. Tol, and K. Keller. Probabilistic projections of baseline twenty-first century co2 emissions using a simple calibrated integrated assessment model. Climatic Change, 170(3-4), 2022. doi: 10.1007/s10584-021-03279-7.
- Sterner and Persson (2008) T. Sterner and U. M. Persson. An even sterner review: Introducing relative prices into the discounting debate. Review of Environmental Economics and Policy, 2(1):61–76, 2008. URL http://www.scopus.com/scopus/inward/record.url?eid=2-s2.0-43149086375&partnerID=40&rel=R8.0.0.
- Takakura et al. (2019) J. Takakura, S. Fujimori, N. Hanasaki, T. Hasegawa, Y. Hirabayashi, Y. Honda, T. Iizumi, N. Kumano, C. Park, Z. Shen, K. Takahashi, M. Tamura, M. Tanoue, K. Tsuchida, H. Yokoki, Q. Zhou, T. Oki, and Y. Hijioka. Dependence of economic impacts of climate change on anthropogenically directed pathways. Nature Climate Change, 9(10):737–741, 2019. doi: 10.1038/s41558-019-0578-6.
- Tol (2015) R. Tol. Bootstraps for meta-analysis with an application to the impact of climate change. Computational Economics, 46(2):287–303, 2015. doi: 10.1007/s10614-014-9448-5.
- Tol (1995) R. S. J. Tol. The damage costs of climate change toward more comprehensive calculations. Environmental and Resource Economics, 5(4):353–374, 1995.
- Tol (2002) R. S. J. Tol. Estimates of the damage costs of climate change—part I: Benchmark estimates. Environmental and Resource Economics, 21(1):47–73, 2002.
- Tol (2009) R. S. J. Tol. The economic effects of climate change. Journal of Economic Perspectives, 23(2):29–51, 2009.
- Tol (2012) R. S. J. Tol. On the uncertainty about the total economic impact of climate change. Environmental and Resource Economics, 53(1):97–116, 2012. doi: 10.1007/s10640-012-9549-3.
- Tol (2013) R. S. J. Tol. The economic impact of climate change in the 20th and 21st centuries. Climatic Change, 117(4):795–808, 2013. doi: 10.1007/s10584-012-0613-3.
- Tol (2014) R. S. J. Tol. Correction and update: The economic effects of climate change. Journal of Economic Perspectives, 28(2):221–226, 2014. doi: 10.1257/jep.28.2.221.
- Tol (2016) R. S. J. Tol. The impacts of climate change according to the IPCC. Climate Change Economics, 7(1), 2016. doi: 10.1142/S2010007816400042.
- Tol (2018) R. S. J. Tol. The economic impacts of climate change. Review of Environmental Economics and Policy, 12(1):4–25, 2018. URL http://dx.doi.org/10.1093/reep/rex027.
- Tol (2019a) R. S. J. Tol. A social cost of carbon for (almost) every country. Energy Economics, 83:555 – 566, 2019a. URL http://www.sciencedirect.com/science/article/pii/S014098831930218X.
- Tol (2019b) R. S. J. Tol. A social cost of carbon for (almost) every country. Energy Economics, 83:555 – 566, 2019b. URL http://www.sciencedirect.com/science/article/pii/S014098831930218X.
- Tol (2019c) R. S. J. Tol. The impact of climate change and the social cost of carbon. In U. Soytas and R. Sari, editors, Routledge Handbook of Energy Economics, book section 16. Routledge, Abingdon, 2019c.
- Tol (2021a) R. S. J. Tol. The distributional impact of climate change. Annals of the New York Academy of Sciences, 1504(1):63–75, 2021a. doi: 10.1111/nyas.14497.
- Tol (2021b) R. S. J. Tol. Estimates of the social cost of carbon have increased over time. Papers 2105.03656, arXiv.org, May 2021b. URL https://ideas.repec.org/p/arx/papers/2105.03656.html.
- Tol et al. (1998) R. S. J. Tol, S. Fankhauser, and J. B. Smith. The scope for adaptation to climate change: what can we learn from the impact literature? Global Environmental Change, 8(2):109–123, 1998. URL https://www.sciencedirect.com/science/article/pii/S0959378098000041.
- Van Den Bremer and Van Der Ploeg (2021) T. Van Den Bremer and F. Van Der Ploeg. The risk-adjusted carbon price. American Economic Review, 111(9):2782–2810, 2021. doi: 10.1257/aer.20180517.
- Van der Ploeg (2014) F. Van der Ploeg. Abrupt positive feedback and the social cost of carbon. European Economic Review, 67:28–41, 2014. doi: 10.1016/j.euroecorev.2014.01.004.
- Weitzman (2009) M. L. Weitzman. On modeling and interpreting the economics of catastrophic climate change. The Review of Economics and Statistics, 91(1):1–19, 2009. doi: 10.1162/rest.91.1.1.
- Weitzman (2012) M. L. Weitzman. GHG targets as insurance against catastrophic climate damages. Journal of Public Economic Theory, 14(2):221–244, 2012. doi: https://doi.org/10.1111/j.1467-9779.2011.01539.x.
- Yohe and Tol (2002) G. W. Yohe and R. S. J. Tol. Indicators for social and economic coping capacity—moving towards a working definition of adaptive capacity. Global Environmental Change, 12(1):25–40, 2002.
| Study | warming | impact | st.dev. | min | max | method | scc |
|---|---|---|---|---|---|---|---|
| d’Arge (1979) | -1.0 | -0.6 | enum | 92 | |||
| Nordhaus (1982) | 2.5 | -3.0 | -12.0 | 5.0 | enum | 74 | |
| Nordhaus (1991) | 3.0 | -1.0 | enum | 17 | |||
| Nordhaus (1994b) | 3.0 | -1.3 | enum | 23 | |||
| Nordhaus (1994a) | 3.0 | -3.6 | -21.0 | 0.0 | elicit | 62 | |
| 6.0 | -6.7 | 29 | |||||
| Fankhauser (1995) | 2.5 | -1.4 | enum | 35 | |||
| Berz | 2.5 | -1.5 | enum | 37 | |||
| Schauer (1995) | 2.5 | -5.22 | 8.44 | elicit | 129 | ||
| Tol (1995) | 2.5 | -1.9 | enum | 47 | |||
| Nordhaus and Yang (1996) | 2.5 | -1.4 | enum | 35 | |||
| Plambeck and Hope (1996) | 2.5 | -2.9 | -13.1 | -0.5 | enum | 71 | |
| Mendelsohn et al. (2000) | 2.5 | 0.03 | 0.05 | ectric | -0.7 | ||
| 2.5 | 0.10 | 0.01 | -2.5 | ||||
| 4.0 | -0.01 | 0.1 | |||||
| 4.0 | -0.04 | 0.4 | |||||
| 5.2 | -0.01 | 0.1 | |||||
| 5.2 | -0.13 | 0.7 | |||||
| Nordhaus and Boyer (2000) | 2.5 | -1.5 | enum | 37 | |||
| Tol (2002) | 1.0 | 2.3 | 1.0 | enum | -355 | ||
| Maddison (2003) | 2.5 | 0.0 | ectric | -0.8 | |||
| Rehdanz and Maddison (2005) | 0.6 | -0.2 | ectric | 77 | |||
| 1.0 | -0.3 | 48 | |||||
| Hope (2006) | 2.5 | -1.0 | -3.0 | 0.0 | enum | 24 | |
| Nordhaus (2006) | 3.0 | -0.9 | 0.1 | ectric | 16 | ||
| 3.0 | -1.1 | 0.1 | 18 | ||||
| Nordhaus (2008) | 3.0 | -2.5 | enum | 43 | |||
| Horowitz (2009) | 1.0 | 3.8 | -4.2 | -2.7 | ectric | 587 | |
| Eboli et al. (2010) | 3.0 | -1.35 | CGE | 23 | |||
| Hope (2011) | 3.0 | -0.7 | -1.8 | -0.3 | enum | 12 | |
| Maddison and Rehdanz (2011) | 3.2 | -5.1 | ectric | 77 | |||
| Ng and Zhao (2011) | 1.0 | -1.35 | ectric | 209 | |||
| 1.0 | -1.61 | 249 | |||||
| Bosello et al. (2012) | 1.9 | -0.5 | CGE | 21 | |||
| Roson and van der Mensbrugghe (2012) | 2.9 | -1.8 | CGE | 33 | |||
| 5.4 | -4.6 | 24 | |||||
| McCallum et al. (2013) | 2 | -0.7 | CGE | 27 | |||
| 4 | -1.8 | 17 | |||||
| Nordhaus (2013) | 2.9 | -2.0 | enum | 37 | |||
| Desmet and Rossi-Hansberg (2015) | 4.6 | 5.1 | ectric | -37 | |||
| 9.3 | -4.9 | 9 | |||||
| 13.6 | -24.1 | 20 | |||||
| 16.7 | -78.9 | 44 | |||||
| Sartori and Roson (2016) | 3.0 | -0.7 | CGE | 12 | |||
| Kompas et al. (2018) | 1.0 | -0.5 | CGE | 72 | |||
| 2.0 | -1.1 | 41 | |||||
| 3.0 | -1.8 | 32 | |||||
| 4.0 | -2.8 | 27 | |||||
| Dellink et al. (2019) | 2.5 | -2.0 | CGE | 49 | |||
| Takakura et al. (2019) | 2.0 | -1.1 | 0.1 | CGE | 43 | ||
| 4.0 | -3.9 | 0.4 | 37 | ||||
| 6.0 | -9.1 | 1.6 | 39 | ||||
| Howard and Sylvan (2020-09) | 3.0 | -9.2 | 10.3 | -20 | -2 | elicit | 158 |
| Kalkuhl and Wenz (2020) | 1 | -2.3 | 1.32 | ectric | 355 | ||
| Conte et al. (2021) | 3.7 | -3.7 | ectric | 42 | |||
| Cruz and Rossi-Hansberg (2021) | 7.2 | -5.0 | ectric | 15 | |||
| Howard and Sylvan (2021-07) | 1.2 | -2.2 | 2.9 | elicit | 236 | ||
| 3.0 | -8.5 | 6.7 | 146 | ||||
| 5.0 | -16.1 | 13.3 | 100 | ||||
| 7.0 | -25.0 | 20.7 | 79 | ||||
| Newell et al. (2021) | 4.3 | 5.63 | ectric | -47 | |||
| 4.3 | 3.61 | -30 | |||||
| 4.3 | -1.71 | 14 | |||||
| 4.3 | -1.63 | 14 | |||||
| 4.3 | -2.17 | 18 | |||||
| 4.3 | -0.64 | 5 | |||||
| 4.3 | -1.82 | 15 | |||||
| 4.3 | -1.75 | 15 | |||||
| 4.3 | -2.16 | 18 | |||||
| Valuation methods are enumerative, elicitation, econometric, and computable general equilibrium. The social cost of carbon, in 2010 US dollar per metric tonne of carbon, is for emissions in the year 2015, the SSP2 scenario, a pure rate of time preference of 1% and a rate of risk aversion of 1; impacts are proportional to temperature squared. | |||||||
| name | function | likelihood | proponent | scc |
| Parabolic | 18.96% | Tol (2009) | 29 | |
| Hyperbolic sine | 18.36% | this study | 22 | |
| Quadratic | 14.09% | Nordhaus (1992) | 27 | |
| Weitzman 6 | 13.59% | Weitzman (2012) | 29 | |
| Weitzman 7 | 13.49% | Weitzman (2012)171717Weitzman actually raises temperature to the power 6.754, which excludes cooling. | 28 | |
| Linear | 11.50% | Hope (2006)181818Hope is actually piecewise linear, with zero impacts below one temperature threshold, linear damages above that threshold, and shifted linear damages above another temperature threshold. | 29 | |
| Piecewise linear | 9.78% | Tol (2018) | 29 | |
| Exponential | 0.22% | Van der Ploeg (2014) | 3 |
| Fankhauser | Berz | Tol | Nordhaus | Bosello | Dellink | Sartori | Kompas | Average | |
| Agriculture | -0.20 | -0.19 | -0.13 | -0.13 | -0.40 | -0.75 | -0.10 | -0.22 | -0.26 |
| Forestry | -0.01 | -0.02 | -0.01 | 0.00 | -0.01 | -0.01 | -0.01 | -0.02 | -0.01 |
| Energy | -0.12 | -0.11 | -0.07 | -0.02 | -0.02 | -0.06 | -0.07 | -0.06 | -0.07 |
| Water | -0.24 | -0.23 | -0.10 | -0.03 | -0.01 | -0.10 | -0.10 | -0.01 | -0.10 |
| Tourism | -0.09 | -0.09 | -0.09 | -0.09 | -0.17 | -0.14 | 0.04 | -0.10 | -0.09 |
| Other markets | -0.63 | -0.63 | -0.63 | -0.63 | -0.63 | -0.63 | -0.29 | -0.98 | -0.63 |
| Coastal defence | 0.00 | -0.01 | -0.08 | -0.04 | -0.03 | -0.04 | 0.00 | -0.02 | -0.03 |
| Dryland loss | -0.07 | -0.07 | -0.09 | -0.09 | -0.08 | -0.10 | 0.00 | -0.07 | -0.07 |
| Wetland loss | -0.16 | -0.16 | -0.17 | -0.19 | -0.17 | -0.17 | -0.17 | -0.17 | -0.17 |
| Ecosystem | -0.21 | -0.20 | -0.19 | -0.20 | -0.20 | -0.20 | -0.20 | -0.20 | -0.20 |
| Health | -0.26 | -0.40 | -0.77 | -0.10 | -0.01 | -0.90 | -0.19 | -0.38 | -0.38 |
| Air pollution | -0.08 | -0.08 | -0.08 | -0.08 | -0.08 | -0.08 | -0.08 | -0.08 | -0.08 |
| Time use | 0.29 | 0.29 | 0.29 | 0.29 | 0.29 | 0.29 | 0.29 | 0.29 | 0.29 |
| Settlements | -0.17 | -0.17 | -0.17 | -0.17 | -0.17 | -0.17 | -0.17 | -0.17 | -0.17 |
| Catastrophe | -0.01 | -0.01 | -0.01 | -1.02 | -0.27 | -0.27 | -0.27 | -0.27 | -0.27 |
| Migration | -0.02 | -0.02 | -0.12 | -0.06 | -0.06 | -0.06 | -0.06 | -0.06 | -0.06 |
| Amenity | -0.33 | -0.33 | -0.33 | -0.33 | -0.33 | -0.33 | -0.33 | -0.33 | -0.33 |
| Total | -2.34 | -2.44 | -2.77 | -2.90 | -2.18 | -3.56 | -1.54 | -2.77 | -2.56 |
| Original | -1.40 | -1.50 | -1.90 | -1.50 | -0.50 | -2.00 | -0.55 | -1.40 | -1.58 |
| Ratio | 1.67 | 1.63 | 1.46 | 1.93 | 2.98 | 1.78 | 2.82 | 1.98 | 1.63 |
Appendix A Differences with Howard and Sterner (2017)
Howard and Sterner (2017) include a number of estimates that I excluded, for the following reasons. The paper by Meyer and Cooper (1995) is confused, as explained in Fankhauser and Tol (1995). Howard and Sterner (2017) report an impact of 11.5% of GDP for 3.0 warming, a number that is not in Meyer and Cooper (1995). Hanemann (2008) presents estimates for the USA only, Bluedorn et al. (2009) present no estimate. Manne et al. (1995) do not present new impact estimates, instead rely on Nordhaus and Fankhauser. Howard and Sterner (2017) misinterpret their estimate, an annuity, as a point on the impact function. Ackerman and Stanton (2012), Bosetti et al. (2007), Gunasekera et al. (2008), Manne and Richels (2005), Tol (2013), Weitzman (2012) do not present new estimates of the total impact of climate change. Anthoff and Tol (2022) count over 200 papers that estimate the social cost of carbon, each of which has at least one estimate of the total impact of climate change—but very few of these papers present new estimates of the total impact. It is not clear why Howard and Sterner (2017) included 6 of these papers but not the other 194 or so.
Appendix B Additional results
| function | all | enumerative | elicitation | econometric | CGE |
| Parabolic | 20.7% | 6.4% | 20.0% | 10.8% | 9.6% |
| Hyperbolic sine | 17.6% | 3.0% | 9.0% | 12.6% | 14.5% |
| Linear | 14.0% | 2.6% | 26.9% | 11.5% | 0.2% |
| Piecewise linear | 13.3% | 41.9% | 8.2% | 14.3% | 13.2% |
| Weitzman 6 | 11.6% | 17.9% | 10.0% | 12.8% | 24.5% |
| Weitzman 7 | 11.5% | 19.5% | 9.6% | 13.3% | 28.4% |
| Quadratic | 11.2% | 6.2% | 12.7% | 10.4% | 8.8% |
| Exponential | 0.1% | 2.5% | 3.7% | 14.3% | 0.74% |
| SCC | 27 | 57 | 87 | 1 | 6 |
| study | scc | ||
| Dell et al. (2012) | -0.002131 | 0 | 222 |
| Burke et al. (2015) | 0.001558 | -0.000500 | 33 |
| Pretis et al. (2018) | 0.002586 | -0.000400 | -171 |
| Henseler and Schumacher (2019) | -0.000810 | -0.000455 | 259 |
| Acevedo et al. (2020) | 0.002105 | -0.000510 | -37 |
| Kalkuhl and Wenz (2020) | -0.006666 | -0.000015 | 463 |
| Kikstra et al. (2021) | -0.010098 | -0.000761 | 539 |
| Combined | -0.002023 | -0.000023 | 218 |
| study | scc | ||
| Letta and Tol (2018) | -0.004655 | 0 | 16 |
| Kahn et al. (2019) | 0.01714 | 0 | 60 |
| Kotz et al. (2021) | 0.0019 | -0.0018 | 17 |
| Kotz et al. (2022) | -0.0013 | -0.0018 | 18 |
| Combined | -0.004029 | -0.000377 | 17 |