DESY–22–107 \prepdateJune 2022
Measurement of the cross-section ratio in exclusive photoproduction at HERA
ZEUS Collaboration
Abstract
The exclusive photoproduction reactions and have been measured at an centre-of-mass energy of 318 GeV with the ZEUS detector at HERA using an integrated luminosity of 373 pb-1. The measurement was made in the kinematic range GeV, GeV2 and GeV2, where is the photon–proton centre-of-mass energy, is the photon virtuality and is the squared four-momentum transfer at the proton vertex. The decay channels used were , and with subsequent decay . The ratio of the production cross sections, , has been measured as a function of and and compared to previous data in photoproduction and deep inelastic scattering and with predictions of QCD-inspired models of exclusive vector-meson production, which are in reasonable agreement with the data.
The ZEUS Collaboration
I. Abt1, M. Adamus31, R. Aggarwal2, V. Aushev3, O. Behnke4, A. Bertolin5, I. Bloch6, I. Brock7, N.H. Brook8,a, R. Brugnera9, A. Bruni10, P.J. Bussey11, A. Caldwell1, C.D. Catterall12, J. Chwastowski13, J. Ciborowski14,b, R. Ciesielski4,c, A.M. Cooper-Sarkar15, M. Corradi10,d, R.K. Dementiev16, S. Dusini5, J. Ferrando4, B. Foster15,e, E. Gallo17,f, D. Gangadharan18,g, A. Garfagnini9, A. Geiser4, G. Grzelak14, C. Gwenlan15, D. Hochman19, N.Z. Jomhari4, I. Kadenko3, U. Karshon19, P. Kaur20, R. Klanner17, U. Klein4,h, I.A. Korzhavina16, N. Kovalchuk17, M. Kuze21, B.B. Levchenko16, A. Levy22, B. Löhr4, E. Lohrmann17, A. Longhin9, F. Lorkowski4, I. Makarenko4, J. Malka4,i, S. Masciocchi23,j, K. Nagano24, J.D. Nam25, Yu. Onishchuk3, E. Paul7, I. Pidhurskyi26, A. Polini10, M. Przybycień27, A. Quintero25, I. Rubinsky4, M. Ruspa28, U. Schneekloth4, T. Schörner-Sadenius4, I. Selyuzhenkov23, M. Shchedrolosiev4, L.M. Shcheglova16, I.O. Skillicorn11, W. Słomiński29, A. Solano30, L. Stanco5, N. Stefaniuk4, B. Surrow25, K. Tokushuku24, J. Tomaszewska14,m, A. Trofymov3,4, O. Turkot4,i, T. Tymieniecka31, A. Verbytskyi1, W.A.T. Wan Abdullah32, K. Wichmann4, M. Wing8,k, S. Yamada24, Y. Yamazaki33, A.F. Żarnecki14, O. Zenaiev4,l
1 Max-Planck-Institut für Physik, München, Germany
2 DST-Inspire Faculty, Department of Technology, SPPU, India
3 Department of Nuclear Physics, National Taras Shevchenko University of Kyiv, Kyiv, Ukraine
4 Deutsches Elektronen-Synchrotron DESY, Notkestr. 85, 22607 Hamburg, Germany
5 INFN Padova, Padova, Italy A
6 Deutsches Elektronen-Synchrotron DESY, Platanenallee 6, 15738 Zeuthen, Germany
7 Physikalisches Institut der Universität Bonn, Bonn, Germany B
8 Physics and Astronomy Department, University College London, London, United Kingdom C
9 Dipartimento di Fisica e Astronomia dell’ Università and INFN, Padova, Italy A
10 INFN Bologna, Bologna, Italy A
11 School of Physics and Astronomy, University of Glasgow, Glasgow, United Kingdom C
12 Department of Physics, York University, Ontario, Canada M3J 1P3 D
13
The Henryk Niewodniczanski Institute of Nuclear Physics, Polish Academy of
Sciences, Krakow, Poland
14 Faculty of Physics, University of Warsaw, Warsaw, Poland
15 Department of Physics, University of Oxford, Oxford, United Kingdom C
16 Affiliated with an institute covered by a current or former collaboration agreement with DESY
17 Hamburg University, Institute of Experimental Physics, Hamburg, Germany E
18 Physikalisches Institut of the University of Heidelberg, Heidelberg, Germany
19 Department of Particle Physics and Astrophysics, Weizmann Institute, Rehovot, Israel
20 Sant Longowal Institute of Engineering and Technology, Longowal, Punjab, India
21 Department of Physics, Tokyo Institute of Technology, Tokyo, Japan F
22
Raymond and Beverly Sackler Faculty of Exact Sciences, School of Physics,
Tel Aviv University, Tel Aviv, Israel G
23 GSI Helmholtzzentrum für Schwerionenforschung GmbH, Darmstadt, Germany
24 Institute of Particle and Nuclear Studies, KEK, Tsukuba, Japan F
25 Department of Physics, Temple University, Philadelphia, PA 19122, USA H
26 Institut für Kernphysik, Goethe Universität, Frankfurt am Main, Germany
27 AGH University of Science and Technology, Faculty of Physics and Applied Computer Science, Krakow, Poland
28 Università del Piemonte Orientale, Novara, and INFN, Torino, Italy A
29 Department of Physics, Jagellonian University, Krakow, Poland I
30 Università di Torino and INFN, Torino, Italy A
31 National Centre for Nuclear Research, Warsaw, Poland
32 National Centre for Particle Physics, Universiti Malaya, 50603 Kuala Lumpur, Malaysia J
33 Department of Physics, Kobe University, Kobe, Japan F
A supported by the Italian National Institute for Nuclear Physics (INFN)
B supported by the German Federal Ministry for Education and Research (BMBF), under contract No. 05 H09PDF
C supported by the Science and Technology Facilities Council, UK
D supported by the Natural Sciences and Engineering Research Council of Canada (NSERC)
E supported by the German Federal Ministry for Education and Research (BMBF), under contract No. 05h09GUF, and the SFB 676 of the Deutsche Forschungsgemeinschaft (DFG)
F supported by the Japanese Ministry of Education, Culture, Sports, Science and Technology (MEXT) and its grants for Scientific Research
G supported by the Israel Science Foundation
H supported in part by the Office of Nuclear Physics within the U.S. DOE Office of Science
I supported by the Polish National Science Centre (NCN) grant no. DEC-2014/13/B/ST2/02486
J supported by HIR grant UM.C/625/1/HIR/149 and UMRG grants RU006-2013, RP012A-13AFR and RP012B-13AFR from Universiti Malaya, and ERGS grant ER004-2012A from the Ministry of Education, Malaysia
a now at University of Bath, United Kingdom
b also at Lodz University, Poland
c now at Rockefeller University, New York, NY 10065, USA
d now at INFN Roma, Italy
e also at DESY and University of Hamburg, Hamburg, Germany and supported by a Leverhulme Trust Emeritus Fellowship
f also at DESY, Hamburg, Germany
g now at now at University of Houston, Houston, TX 77004, USA
h now at University of Liverpool, United Kingdom
i now at European X-ray Free-Electron Laser facility GmbH, Hamburg, Germany
j also at Physikalisches Institut of the University of Heidelberg, Heidelberg, Germany
k also supported by DESY, Hamburg, Germany
l now at CERN, Geneva, Switzerland
m now at Polish Air Force Academy in Deblin
1 Introduction
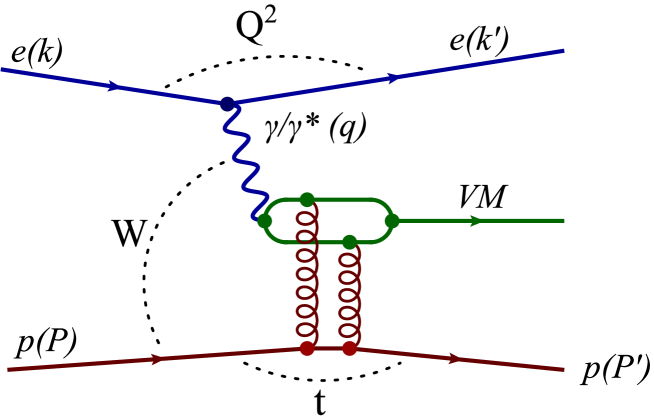
The exclusive photoproduction of vector mesons leads to a simple final-state system, as illustrated in Fig. 1(a). The clean environment and the large masses of the and mesons facilitate measurements that provide insight into the dynamics of a hard process. The and the have the same quark content but different radial distributions of the wave functions, and their mass difference is small. Therefore, this measurement allows QCD-inspired predictions of the wave-function dependence of the respective cross sections to be tested. A suppression of the cross section relative to the is expected, as the wave function has a radial node close to the typical transverse separation of the virtual pair. The process is also sensitive to the gluon density in the proton.
The exclusive (also referred to as elastic) production of a vector meson in collisions, in which the proton remains intact, is shown in Fig. 1(a). The proton-dissociative process, where the proton breaks up into a hadronic state denoted as , is shown in Fig. 1(b). The two processes have similar experimental signatures and so when the system remains undetected, proton-dissociative events form a significant background. The following kinematic variables are used to characterise these processes. The negative squared four-momentum of the exchanged photon, , is equal to , where and are the four-momenta of the incoming and outgoing lepton. As GeV2 in photoproduction and the transverse momentum of the vector meson is small in the present measured kinematic region, the hard QCD scale is provided by the squared mass of the vector meson, . The photon–proton centre-of-mass energy, , is given by , where is the four-momentum of the incoming proton. The squared four-momentum transfer at the proton vertex, , is given by , where is the four-momentum of the outgoing proton (or dissociative state ).
At the HERA collider, the ZEUS collaboration has previously measured the exclusive production of and mesons in deep inelastic scattering (DIS) [1]. The H1 collaboration has also measured exclusive production of and mesons in DIS [2], as well as in photoproduction [3, 4]. In these analyses, the ratio of the to production cross sections, where some of the systematic uncertainties are expected to cancel, was measured and compared with QCD-inspired models. These previous data exhibit an increase in the ratio with increasing that is described by many of the QCD models. No dependence of the ratio with and was observed, although the dependence has so far been measured only in DIS.
In this paper, a new measurement of the ratio of the photoproduction cross sections of the exclusive reactions and is presented. The ratio is measured differentially as a function of and . The decay channels used were , , and with the subsequent decay .
2 Experimental set-up
The measurement is based on data collected with the ZEUS detector at the HERA collider during the period 2003–2007, corresponding to an integrated luminosity of 373 pb-1. During this period, the HERA accelerator collided an electron111Hereafter, “electron” refers to both electrons and positrons unless otherwise stated. beam of energy 27.5 GeV with a proton beam of 920 GeV, yielding an centre-of-mass energy of 318 GeV.
A detailed description of the ZEUS detector can be found elsewhere [5]. A brief outline of the components that are most relevant for this analysis is given below.
In the kinematic range of the analysis, charged particles were mainly tracked in the central tracking detector (CTD) [6, 7, 8] and the microvertex detector (MVD) [9]. These components operated in a magnetic field of provided by a thin superconducting solenoid. The CTD consisted of 72 cylindrical drift-chamber layers, organised in nine superlayers covering the polar-angle222The ZEUS coordinate system is a right-handed Cartesian system, with the axis pointing in the nominal proton beam direction, referred to as the “forward direction”, and the axis pointing left towards the centre of HERA. The coordinate origin is at the centre of the CTD. The pseudorapidity is defined as , where the polar angle, , is measured with respect to the axis. The azimuthal angle, , is measured with respect to the axis. region . The MVD silicon tracker consisted of a barrel (BMVD) and a forward (FMVD) section. The BMVD contained three layers and provided polar-angle coverage for tracks from to . The four-layer FMVD extended the polar-angle coverage in the forward region to . After alignment, the single-hit resolution of the MVD was . The transverse distance of closest approach (DCA) of a track to the nominal vertex in the – plane was measured to have a resolution, averaged over the azimuthal angle, of , with in \GeV denoting the momentum transverse to the beam axis. For CTD–MVD tracks that pass through all nine CTD superlayers, the momentum resolution was , with in \GeV.
The high-resolution uranium–scintillator calorimeter (CAL) [10, 11, 12, 13] consisted of three parts: the forward (FCAL), the barrel (BCAL) and the rear (RCAL) calorimeters. Each part was subdivided transversely into towers and longitudinally into one electromagnetic section (EMC) and either one (in RCAL) or two (in BCAL and FCAL) hadronic sections (HAC). The smallest subdivision of the calorimeter was called a cell. Adjacent cells were combined to form clusters. The CAL energy resolutions, as measured under test-beam conditions, were for electrons and for hadrons, with in GeV.
The muon system consisted of rear, barrel (R/BMUON) and forward (FMUON) tracking detectors. The R/BMUON consisted of limited-streamer (LS) tube chambers placed behind the RCAL (BCAL), inside and outside a magnetised iron yoke surrounding the CAL. The barrel and rear muon chambers covered polar angles from 34∘ to 135∘ and from 135∘ to 171∘, respectively. The FMUON consisted of six trigger planes of LS tubes and four planes of drift chambers covering the angular region from 5∘ to 32∘. The muon system exploited the magnetic field of the iron yoke and, in the forward direction, of two iron toroids magnetised to about T to provide an independent measurement of the muon momenta.
The iron yoke surrounding the CAL was instrumented with proportional drift chambers to form the backing calorimeter (BAC) [14]. The BAC consisted of 5142 aluminium chambers inserted into the gaps between thick iron plates (10, 9 and 7 layers in the forward, barrel and rear directions, respectively). The chambers were typically long and had a wire spacing of . The anode wires were covered by long cathode pads. The BAC was equipped with energy readout and position-sensitive readout for muon tracking. The former was based on 1692 pad towers (), providing an energy resolution of , with in GeV. The position information from the wires allowed the reconstruction of muon trajectories in two dimensions ( in the barrel and in the endcaps) with a spatial accuracy of a few mm.
3 Monte Carlo simulations
Free parameters within the Monte Carlo (MC) simulations, which control the kinematic dependences of the reactions of interest, have been tuned to previous data. The values have been checked here and either used where appropriate or tuned to the data presented in this paper.
The Diffvm [20] MC program was used for simulating the photoproduction of exclusive heavy vector mesons, , where denotes the produced vector meson. For the event generation, the following cross-section parameterisations were used:
-
•
for the dependence on ;
- •
-
•
, with GeV-2 and GeV-2 for the dependence on for and events, respectively [3];
-
•
the values were re-weighted according to the formula , where GeV and is determined to be 0.12 GeV-2 [23];
-
•
-channel helicity conservation for the production of ;
-
•
a reweighting for the pion phase space [24] using the function , where is the invariant mass of the two pions in the decay and is the mass of the charged pion.
Proton-dissociative and events were also simulated with the Diffvm MC program with parameters:
Non-resonant electroweak dimuon production (Bethe–Heitler process) was simulated using the program Grape [25]. The MC sample contains both exclusive and proton-dissociative events.
The generated MC events were passed through the ZEUS detector and trigger simulation programs based on Geant 3 [26]. They were then reconstructed and analysed with the same programs as used for the data.
4 Event selection and signal extraction
4.1 Event selection
Events that contained signals from the decay products of the or but no other activity in the central ZEUS detector were selected. Only final states containing muons were considered.
A three-level trigger system [5, 27, 28] was used to select events online. The principal requirement for muon-candidate events was at least one CTD track matched to a cluster consistent with a minimum-ionising particle in the CAL and associated with a F/B/RMUON deposit or with a muon signal in the BAC.
To select offline events containing exclusively produced or vector mesons in photoproduction, the following additional requirements were imposed:
-
•
the coordinate of the event vertex reconstructed from the tracks was required to be within cm of the nominal interaction point and the transverse distance of the event vertex from the nominal interaction point was required to be within 0.03 cm;
-
•
events with an identified electron with energy above 5 GeV, as reconstructed using an algorithm based on a neural network [29], were rejected. This removed DIS events with GeV2;
-
•
the sum of energy in the FCAL cells immediately surrounding the beam-pipe hole ( rad) had to be smaller than 1 GeV to suppress contamination from proton-dissociative events;
-
•
the photon–proton centre-of-mass energy was required to be in the range GeV, where is reconstructed from the initial proton-beam energy, , and the difference in energy and component of momentum, , of the vector-meson candidate, , as ;
-
•
the squared four-momentum transfer at the proton vertex was required to be in the range GeV2, where is reconstructed from the transverse momentum of the vector meson, , as . This requirement significantly reduced the remaining fraction of proton-dissociative events;
-
•
each track considered was required to produce hits in the first CTD superlayer or in the MVD and cross at least three CTD superlayers. These requirements effectively limit the pseudorapidity range of each track to and ensured the selection of tracks with good momentum resolution;
-
•
two oppositely-charged tracks, each with GeV, matched to the vertex were required in the event. Each of these tracks was matched with a cluster in the CAL. The cluster was required to be consistent with a muon identified with an algorithm based on a neural network [30]. At least one of these tracks had to be associated with a F/B/RMUON signal or with a muon signal in the BAC found using the GMUON algorithm with muon quality [31];
-
•
for the selection of and events, no additional tracks were allowed. Cosmic-ray events were rejected by requiring ns, where and represent the calorimeter signal times in the lower and upper halves of the CAL. Additionally, was required, where is the angle between the momentum vectors of the candidate and ;
-
•
for the selection of events, exactly two additional oppositely-charged tracks were required. Their momenta were required to be lower than those of the muons. Each track was required to have a transverse momentum above 0.12 GeV. No explicit vertex association was required for these two tracks;
-
•
the energy of any additional CAL cluster not associated with a muon candidate, or with a pion candidate in the case of events, was required to be less than 0.5 GeV. This ensured that events with other produced neutral particles were rejected while events with clusters in the CAL consistent with noise only were not rejected.
After rejection of DIS events, a study of generator-level events from the Diffvm MC sample yielded a median of about GeV2. A similar study showed that 99% of proton-dissociative events remaining after the above requirements had a diffractive mass GeV.
4.2 Signal extraction
In the following, the signal extraction for the and final states are discussed separately.
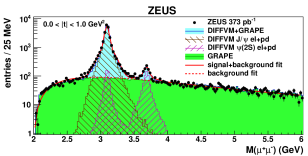
Figure 2 shows the mass distributions between 2 and 6 GeV for the selected events in the full region, GeV, and in intervals within this full range in which the cross section is measured. Figure 3 shows the mass distribution in the full region, GeV2, and in intervals within this full range in which the cross section is measured. Clear and peaks, with masses consistent with those in the PDG [32], are seen and no other significant peak is observed.
Expectations from MC simulations are also shown in Figs. 2 and 3, where here and in all subsequent figures showing MC simulations, the sum of all the MC distributions is normalised to data. The relative contribution of each different process was obtained from a fit to the data in the range GeV. The and peaks in all and ranges are consistent with events from elastic and proton-dissociative processes. The varying width of the peak with increasing is due to the different amount of tracking information available; low and high corresponds to muons in the forward and rear directions respectively where the resolution is less good than in the central tracking region, i.e. GeV. The different resolutions with are reproduced well by the detector MC simulation. The distributions outside of the and peaks are, according to MC simulations, consistent with those arising from the Bethe–Heitler process. The width of the peak does not change with varying because is not correlated with the angular distribution of the muons. However, the Bethe–Heitler background decreases significantly with increasing .
The numbers of and mesons were obtained from a fit to the data to describe the peaks and the background. Each of the peaks was fitted using the sum of two Gaussian functions centred at the same mean value. The fit was further constrained by imposing the same ratios of the widths and the normalisations for the two Gaussian shapes describing the and peaks. This was motivated by the observed scaling of the mass resolution with increasing mass of the resonance and stabilises the fit of the peak, which has a smaller number of candidates. The background function used was where , , and are parameters determined in the fit and represents the kinematic onset of the distribution and is fixed to 2 GeV, twice the minimum of a muon. The results of these fits are also shown in Figs. 2 and 3 where they describe the data well. A resonant background in the peak from the decay of mesons where the other decay products are not reconstructed is also shown as part of the MC distribution; this was estimated to be about 2.4% and will later be subtracted from the Gaussian fit. The non-resonant background under the peak from the Bethe–Heitler process is on average about 9% of the size of the signal. Under the peak, the background from the Bethe–Heitler process is about a factor of 2.5 times higher than the signal. A resonant background under the peak arises due to leakage from the reconstruction of mesons, the upper tail of which overlaps with the mass region. It is on average 15% of the signal.
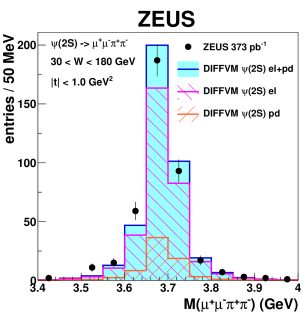
Figure 4 shows the mass distribution between 3.4 and 4 GeV and the difference in masses, , for the selected events, with the additional requirements of GeV and GeV. Clear, narrow peaks are observed in both distributions, especially for the mass difference, and both are described well by MC simulations. The distributions are consistent with events from elastic and proton-dissociative processes with a small non-resonant background that is about 2 3% of the signal size. The number of background events in the sample was estimated from data by counting the side-band events in the distribution outside the signal region, before applying the requirement on this quantity. The background events were counted in the GeV interval and the obtained number was rescaled to the signal interval GeV (see Fig. 4(b)) assuming a uniform distribution. Such a procedure was performed for each and interval. The number of mesons was found by counting the number of entries and subtracting the background in the range GeV.
The numbers of signal and background events and their statistical uncertainties used for further analysis are given in Table 1 for each channel and in five and five regions.
4.3 Correction procedure and comparison of measured and simulated distributions
In order to determine the acceptance using simulated events, simulated and measured distributions have to agree. To achieve this, corrections for the efficiency of muon reconstruction were developed for the MC simulation. Muon-identification corrections were developed using a sample of exclusive dimuon events in which one muon was tagged and the probability of reconstruction of the other muon evaluated. The probability was determined for the full reconstruction chain, including the trigger efficiency, in bins of and , depending on whether the muon was reconstructed in the R/B/FMUON. This leads to typical efficiencies of , averaged over and momentum, although in individual bins of and these can be under 10%, mainly at low momentum where the muons do not reach the detectors. They can reach up to 60% at high and high . The efficiency to reconstruct muons in the CAL was typically above 90%. After application of the data-driven corrections, the data and MC distributions agree well.
The CTD first-level trigger used in the selection of events has an efficiency that depends on the track multiplicity and needs to be evaluated for the final state with an independent trigger. A sample of DIS events [1], passing an independent trigger chain but with the same final state, was used to determine this correction. To ensure the same tracking topology, the scattered electron was restricted to the RCAL cells close the beam-pipe with no matched track. This correction was consistent with unity to within about .
The tracking efficiency for low-momentum pions ( GeV) is overestimated in MC simulations and so a correction was applied [34, 33] in simulations to decays to . An event was assigned a weight given by if one pion had transverse momentum, , below 0.26 GeV. If both pions had transverse momentum below 0.26 GeV, the quantity was calculated for each pion and the event weighted by the product of the two weights.
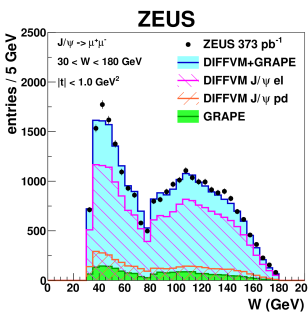
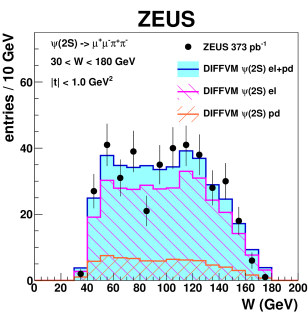
Data and MC simulations with a pair are compared in Fig. 5 for GeV and GeV, corresponding to the mass ranges of the and , respectively, after application of all corrections discussed above. The structures in the data distribution reflect the acceptance of the detector, in particular that of the muon detectors, with the dips around 80 GeV due to the requirements to remove cosmic-ray events. The data distributions are well described by MC simulations. This demonstrates the validity of the correction procedure for the muon acceptance and tuning of the MC simulation parameters. The data distribution in exhibits an exponential fall-off with increasing and is well described by the mixture of MC samples. The fraction of proton-dissociative events increases significantly with increasing , becoming the dominant process above 1 GeV2; this justifies the requirement in the analysis of GeV2 in order to enrich the sample in elastic events.
Figure 6 shows distributions in and when were observed in the final state. The distribution is reasonably flat in the range GeV with fall-offs either side of this region. The distribution exhibits an exponential fall-off with increasing . The MC simulations give a reasonable description of the data.
5 Cross-section ratio to
The following cross-section ratios, , have been measured: for , for and for the combination of the two decay modes. In each case, the decay was used in the denominator.
5.1 Determination of the cross-section ratio
The cross-section ratios for each bin and the full sample were calculated using
and
Here denotes the number of observed signal events for the charmonium state with the decay mode , is the corresponding acceptance determined from the ratio of reconstructed to generated MC events after reweighting, and is the fraction of proton-dissociative events. The value of was determined by fitting the distribution, for , of the data with the distributions from MC samples. It was found that is independent of and so the mean values of and were used for the determination of as a function of . The value of has a strong dependence on , varying from about 7% for GeV2 to 45% for GeV2 (see Table 1 for more details). The corresponding values in each bin were used in the determination of as a function of . However, there is little difference between and and so the final factor in the calculation of and is approximately unity. The following values were used for the branching fractions: , and [32].
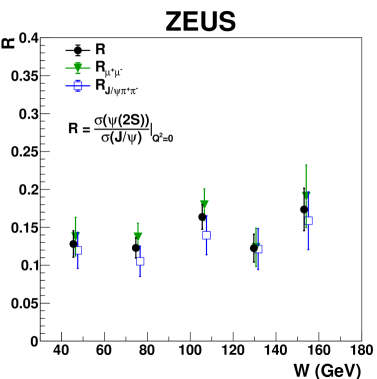
The cross-section ratios for the two decay channels, for and for are shown in Fig. 7 in bins of and , with statistical uncertainties only. The values are consistent for the two channels. The two independent measurements of the cross-section ratio were combined. The combined cross-section ratio, , was obtained using the weighted average of the cross sections determined for the two decay modes. The statistical uncertainties were used for the weights. The combined cross-section ratio, , is also shown in Fig. 7, with statistical uncertainties only.
5.2 Systematic uncertainties
The systematic uncertainties on the values were obtained by performing a suitable variation to determine the change of relative to its central value for each source of uncertainty. The following sources of systematic uncertainty were considered, with typical values given for the change on the final measured value (see Table 2 for full details):
-
•
the dependence (exp()) of the Diffvm MC simulations was varied by the uncertainty on the values: GeV-2 () and GeV-2 () for and elastic events and GeV-2 () and GeV-2 () for and proton-dissociative events. Additionally, the parameter in the re-weighting of was varied by its uncertainty, GeV-2 (). The variation in for proton-dissociative events led to changes in that increased with increasing , with an average change of in . The other variations led to typical changes of below in ;
-
•
the dependence () of the Diffvm MC simulations was varied by the uncertainty on values: () and () for and elastic events and () and () for and proton-dissociative events. Typical variations were in ;
-
•
the dependence () of the Diffvm MC simulations was varied by an uncertainty on , ( and ), estimated from comparisons to previous H1 and ZEUS analyses. These variations led to a change of less than in ;
-
•
the correction factors determined in and bins for the muon efficiencies were varied by doubling the bin size in the and grid (). These variations led to a change of in ;
-
•
the minimum muon- requirement was varied from 1.0 GeV by GeV () to check the stability of the background estimation from the fit at the lower edge of the dimuon mass spectrum and led to a change of in ;
-
•
the minimum pion- requirement was varied from 0.12 GeV by GeV () , where the value 0.1 GeV is consistent with the lower edge of the tracker acceptance, and led to a change of in ;
-
•
the pion-candidate tracks in the decay were required to be associated to the vertex rather than the default of no vertex requirement (). This led to a change of in ;
-
•
the transverse-momentum requirement for the correction of pion-candidate tracks was varied from 0.26 GeV by GeV () and led to a change of in ;
-
•
the maximum energy of a CAL cluster not associated with a muon or pion candidate was varied from the default 0.5 GeV by GeV [1] () and led to a change of in ;
-
•
the maximum allowed energy inside a cone of maximum angle surrounding the FCAL beam-pipe hole used to suppress proton-dissociative events were varied from the defaults: rad () and energy of GeV (). All variations led to a change of less than or equal to in ;
-
•
the requirement on the timing difference in the CAL, was varied from the default 8 ns by ns (), according to a study of cosmic-ray muons, and led to a change of less than in ;
- •
-
•
the branching ratios were varied according to their uncertainties given in Section 5.1 and led to changes of , and less than in for the variations in (), () and (), respectively.
The largest uncertainties arose from the change in the slope, especially for proton-dissociative events and especially at high , the association to the vertex of the pion-candidate tracks, the method for extracting the number of signal events, and the branching ratio . The total systematic uncertainty, given in Table 1, was obtained from the separate quadratic sums of the positive and negative changes in each bin.
A steepening of the distribution to low has been observed in hadron–hadron diffraction [35, 36]. To investigate this possibility in photoproduction, the values in the MC simulation for the proton-dissociative events were changed to those extracted from elastic events, i.e. from 1.0 to 4.6 GeV-2 for and from 0.7 to 4.3 GeV-2 for events for GeV. This led to an average change of in with a change of at lowest and at highest . This was not included in the total systematic uncertainty as such a change led to a poor description of the forward energy flow, estimated by the sum of energy in the FCAL surrounding the beam-pipe hole ( rad).
6 Results
The cross-section ratio has been measured in exclusive photoproduction in the kinematic range GeV2, GeV and GeV2 using a total integrated luminosity of 373 pb-1. The measured value is
where the first uncertainty is statistical and the second is the sum of all systematic uncertainties added in quadrature. This value, well below 1, confirms the expected suppression of the cross section relative to the cross section.
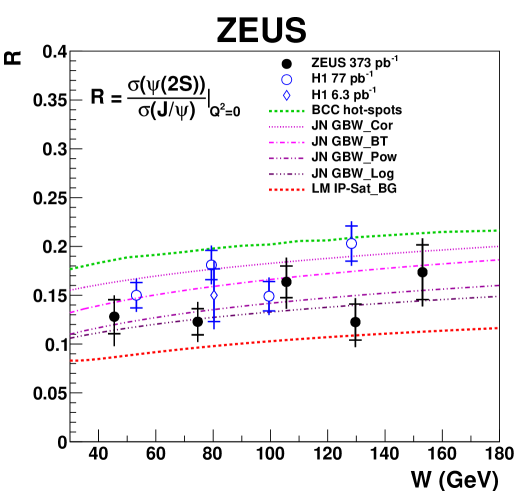
The cross-section ratios differential in and are shown in Fig. 8 and given in Table 1. As a function of , the value of is compatible with a constant value. A slow increase of with increasing is observed. The measurements presented in Fig. 8(a) are in agreement with previous measurements from H1 [3, 4]. In DIS [1] neither a dependence nor a dependence of was observed. A discussion of the comparison of the results to various model predictions is presented in Section 7.
7 Comparison to model predictions
Several models of exclusive vector-meson production are available and also predict the ratio of the production of to mesons. Predictions from three different models were compared to the data and are briefly described. All models predictions were calculated for the kinematic region GeV and GeV2.
7.1 Individual models
The model from Bendová, Čepila and Contreras [37] (BCC hot-spots) is based on energy-dependent hot spots, i.e. regions of high gluon density in the proton. The slope parameter GeV-2 was used for both and production. The value was derived from H1 and ZEUS data on photoproduction.
The model from Nemchik et al. [38, 39, 40] (JN) provides predictions with various combinations of colour-dipole interactions, skewness parameters in the gluon density and quarkonia potentials used for the calculation of the centre-of-mass wave functions. The predictions shown are based on the Golec-Biernat–Wüsthoff (GBW) colour-dipole model [41, 42] with skewness. The phenomenological quarkonia potentials used were: the so-called Buchmüller–Tye (BT), logarithmic (Log), Cornell (Cor) and power-law (Pow). Other combinations of colour-dipole models with or without skewness differ to those shown by 5–10%.
Lappi and Mäntysaari [43] (LM) use the BFKL evolution as well as the IP-Sat model [44] to predict vector-meson production in and electron–ion collisions in the dipole picture. The wave functions of the and have been calculated according to the boosted Gaussian (BG) procedure [46, 45] and the low- inclusive HERA data have been used to constrain the –dipole cross section.
7.2 Comparison of models and data
In Fig. 8, model predictions are compared to photoproduction data as a function of and . All model predictions exhibit a mild rise in with increasing . The predicted rise is similar for all models. The absolute values of the predictions differ by up to a factor of 2. The predictions from BCC lie above the data and the predictions from LM lie below the data. No uncertainties for these predictions are provided. The shapes of the models are consistent with the data, although the data are also consistent with no increase with . The predictions from JN give a better description of the normalisation and the differences in predictions due to the quarkonia potential also give some indication of the uncertainty in the models.
All models also predict an increase in with increasing , and again predict similar gradients but different absolute values. Given the uncertainties in the data and the spread of the models, the description of the data is good.
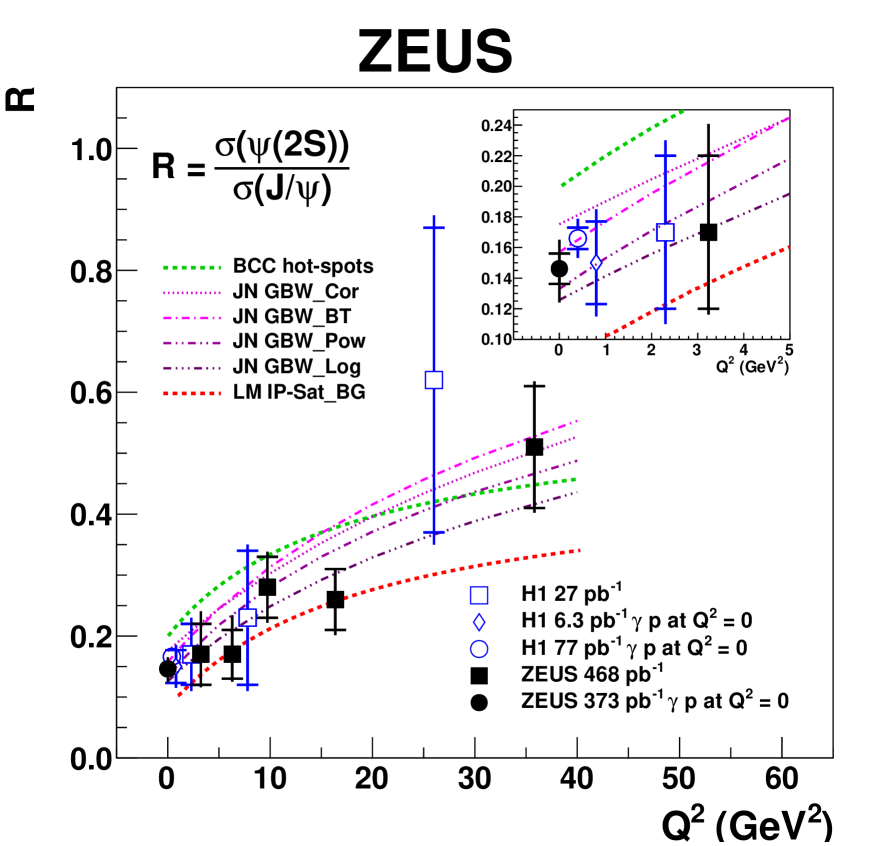
In Fig. 9, model predictions are compared to photoproduction and DIS data as a function of . All models predict a strong increase in with increasing , which is compatible with the trend seen in the data. Towards higher , the LM and BCC models exhibit a flattening of compared to the JN models. The photoproduction data have the potential to constrain the models further.
Overall, the predictions from the three models, BCC, JN and LM, give a reasonable description of the , and dependence of .
8 Summary
The cross-section ratio in exclusive photoproduction has been measured with the ZEUS detector at HERA in the kinematic range GeV2, GeV and GeV2, using an integrated luminosity of 373 pb-1. The decay channels used were and for the and for the . The cross-section ratio was determined as a function of and and presented as a function of . As a function of , the value of is compatible with a constant value. A slow increase of with increasing is observed. The data confirm previous conclusions that decreases with decreasing . Three model calculations were compared to the measured dependences of and give a reasonable description of the data, which can be used to constrain the models further.
Acknowledgements
We appreciate the contributions to the construction, maintenance and operation of the ZEUS detector of many people who are not listed as authors. The HERA machine group and the DESY computing staff are especially acknowledged for their success in providing excellent operation of the collider and the data-analysis environment. We thank the DESY directorate for their strong support and encouragement. We thank Dagmar Bendová, Jan Čepila, Michal Křelina, Jan Nemchik and Heikki Mäntysaari for providing model predictions and for useful discussions.
10
References
- [1] ZEUS Coll., H. Abramowicz et al., Nucl. Phys. B 909, 934 (2016)
- [2] H1 Coll., C. Adloff et al., Eur. Phys. J. C 10, 373 (1999)
- [3] H1 Coll., C. Adloff et al., Phys. Lett. B 541, 251 (2002)
- [4] H1 Coll., C. Adloff et al., Phys. Lett. B 421, 385 (1998)
- [5] ZEUS Coll., U. Holm (ed.), The ZEUS Detector, Status Report, DESY (1993), doi:10.3204/PUBDB-2017-12635. http://www-zeus.desy.de/bluebook/bluebook.html
- [6] N. Harnew et al., Nucl. Inst. Meth. A 279, 290 (1989)
- [7] B. Foster et al., Nucl. Phys. Proc. Suppl. B 32, 181 (1993)
- [8] B. Foster et al., Nucl. Inst. Meth. A 338, 254 (1994)
- [9] A. Polini et al., Nucl. Inst. Meth. A 581, 656 (2007)
- [10] M. Derrick et al., Nucl. Inst. Meth. A 309, 77 (1991)
- [11] A. Andresen et al., Nucl. Inst. Meth. A 309, 101 (1991)
- [12] A. Caldwell et al., Nucl. Inst. Meth. A 321, 356 (1992)
- [13] A. Bernstein et al., Nucl. Inst. Meth. A 336, 23 (1993)
- [14] I. Kudla et al., Nucl. Inst. Meth. A 300, 480 (1991)
- [15] J. Andruszków et al., Preprint DESY–92–066, DESY (1992)
- [16] ZEUS Coll., M. Derrick et al., Z. Phys. C 63, 391 (1994)
- [17] J. Andruszków et al., Acta Phys. Polon. B 32, 2025 (2001)
- [18] M. Helbich et al., Nucl. Inst. Meth. A 565, 572 (2006)
- [19] L. Adamczyk et al., Nucl. Inst. and Meth. A 744, 80 (2014)
- [20] B. List and A. Mastroberardino, Proc. Workshop on Monte Carlo Generators for HERA Physics, A.T. Doyle, G. Grindhammer, G. Ingelman, H. Jung (eds.), p. 396, DESY, Hamburg, Germany (1999). Also in preprint DESY-PROC-1999-02
- [21] H1 Coll., C. Alexa et al., Eur. Phys. J. C 73, 2466 (2013)
- [22] A. Levy, Proc. 14th Topical Conference, HCP 2002, M. Erdmann and T. Muller (eds.), p.173, Karlsruhe, Germany (2002). Also in preprint hep-ex/0301022
- [23] ZEUS Coll., S. Chekanov et al., Eur. Phys. J. C 24, 345 (2002)
- [24] T.N. Pham, B. Pire and T.N. Truong, Phys. Lett. B 61, 183 (1976)
- [25] T. Abe, Comp. Phys. Comm. 136, 126 (2001)
- [26] R. Brun et al., geant3, Technical Report CERN-DD/EE/84-1, CERN, 1987
- [27] P.D. Allfrey et al., Nucl. Inst. Meth. A 580, 1257 (2007)
- [28] W.H. Smith, K. Tokushuku and L.W. Wiggers, Proc. Computing in High-Energy Physics (CHEP), Annecy, France, Sept. 1992, C. Verkerk and W. Wojcik (eds.), p. 222. CERN, Geneva, Switzerland (1992). Also in preprint DESY–92–150B
- [29] H. Abramowicz, A. Caldwell and R. Sinkus, Nucl. Inst. Meth. A 365, 508 (1995)
- [30] V.A. Kuzmin, Nucl. Inst. Meth. A 453, 336 (2000)
- [31] I. Bloch, Ph.D. Thesis, Hamburg University, Report DESY-THESIS-2005-034 (2005)
- [32] P.A. Zyla et al., Prog. Theor. Exp. Phys. 2020, 083C01 (2020)
- [33] V. Libov, Ph.D. Thesis, Hamburg University, Report DESY-THESIS-2013-030 (2013)
- [34] O. Bachynska, Ph.D. Thesis, Hamburg University, Report DESY-THESIS-2012-045 (2012)
- [35] Y. Akimov et al., Phys. Rev. D 14, 3148 (1976)
- [36] M. Albrow et al., Nucl. Phys. B 108, 1 (1976)
- [37] D. Bendova, J. Cepila and J.G. Contreras, Phys. Rev. D 99, 034025 (2019)
- [38] M. Krelina et al., Eur. Phys. J. C 79, 154 (2019)
- [39] J. Cepila et al., Eur. Phys. J. C 79, 495 (2019)
- [40] B.Z. Kopeliovich, M. Krelina and J. Nemchik, Phys. Rev. D 103, 094027 (2021)
- [41] K.J. Golec-Biernat and M. Wusthoff, Phys. Rev. D 59, 014017 (1998)
- [42] K.J. Golec-Biernat and M. Wusthoff, Phys. Rev. D 60, 114023 (1999)
- [43] T. Lappi and H. Mäntysaari, Phys. Rev. C 83, 065202 (2011)
- [44] A.H. Reazeian et al., Phys. Rev. D 87, 034002 (2013)
- [45] T. Lappi and H. Mäntysaari, PoS (DIS2014), 069 (2014)
- [46] H. Kowalski, L. Motyka and G. Watt, Phys. Rev. D 74, 074016 (2006)
| bin | channel | signal | bg-nonres | bg-res | ||||||
|---|---|---|---|---|---|---|---|---|---|---|
| All | ||||||||||
| events | ||||||||||
| W1 | ||||||||||
| (30,60) | ||||||||||
| GeV | ||||||||||
| W2 | ||||||||||
| (60,90) | ||||||||||
| GeV | ||||||||||
| W3 | ||||||||||
| (90,120) | ||||||||||
| GeV | ||||||||||
| W4 | ||||||||||
| (120,140) | ||||||||||
| GeV | ||||||||||
| W5 | ||||||||||
| (140,180) | ||||||||||
| GeV | ||||||||||
| t1 | ||||||||||
| (0.0,0.1) | ||||||||||
| GeV2 | ||||||||||
| t2 | ||||||||||
| (0.1,0.2) | ||||||||||
| GeV2 | ||||||||||
| t3 | ||||||||||
| (0.2,0.4) | ||||||||||
| GeV2 | ||||||||||
| t4 | ||||||||||
| (0.4,0.6) | ||||||||||
| GeV2 | ||||||||||
| t5 | ||||||||||
| (0.6,1.0) | ||||||||||
| GeV2 |
| variation | |||||||||||
| grid | |||||||||||
| vertex | |||||||||||
| correction | |||||||||||
| elasticity threshold | |||||||||||
| forward cone | |||||||||||
| forward energy | |||||||||||
| muons timing | |||||||||||
| MC tempates fit | |||||||||||
| Total |