Monitoring Urban Forests from Auto-Generated Segmentation Maps
Abstract
We present and evaluate a weakly-supervised methodology to quantify the spatio-temporal distribution of urban forests based on remotely sensed data with close-to-zero human interaction. Successfully training machine learning models for semantic segmentation typically depends on the availability of high–quality labels. We evaluate the benefit of high–resolution, three-dimensional point cloud data (LiDAR) as source of noisy labels in order to train models for the localization of trees in orthophotos. As proof of concept we sense Hurricane Sandy’s impact on urban forests in Coney Island, New York City (NYC) and reference it to less impacted urban space in Brooklyn, NYC.
Index Terms— environmental monitoring, laser radar, geospatial analysis, big data applications, weak supervision
1 Introduction & Motivation
While overhead imagery is available in many parts of the world [1],the lack of associated labels makes image classification and semantic segmentation challenging. To manually annotate historical datasets at the granularity of a single tree, individual buildings, secondary roads, etc., exceeds the capacity of the scientific community. Often, patterns and shapes can be easily recognized by eye in high-resolution orthophotos. However, developing automatic labeling tools with similar performance is a challenge. In [2] efforts focus on automatically extracting features from the spatial statistics of remote sensing measurements. Based on a comprehensive set of humanly-defined rules, massive amounts of noisy segmentation maps automatically get generated as basis for e.g. weakly–supervised machine learning models to label high-resolution aerial imagery.
While automatic labels may bear noise, such information can prove adequate for semantic segmentation in order to track change of land use, or to quantify the impact of natural disasters and climate change. Noisy labels in binary classification [3], image classification [4], and deep learning [5] did get studied extensively. Similar approaches in the geospatial domain [6, 7] are less accurate and require further refinements [8, 9].
Many urban areas are located in coastal regions; exposing them to flooding, hurricane damage, and surging waves vulnerabilities. In a case study we explore the automated, rule-based generation of noisy labels for urban forests from high–density, three-dimensional point cloud data. Subsequently, we employ those auto-generated labels to train a convolutional neural network (U-Net, [10]) and a standard, noise-robust machine learning model (Support Vector Machine, SVM, [11]) to semantically segment historical multi-spectral orthophotos for tree identification.
In summary, our work demonstrates the value of generating noisy, but high–density labels for remote sensing machine learning models to accurately identify urban forests in historical imagery with little human interaction. In particular, we extract noisy labels from derived statistics of a Light Detection And Ranging (LiDAR) survey in the area of New York City. Then, we utilize these labels for semantic segmentation of multi-spectral imagery to identify damage from Hurricane Sandy.
2 Datasets
2.1 New York City LiDAR survey
Point cloud LiDAR data was acquired in 2017 [12] at 10 points per square meter. The raw point cloud data was converted into raster layers based on the physically sensed laser pulse quantities, namely: time-of-flight (elevation), number-of-returns (count of reflected laser pulses), and reflected laser light intensity. The raster layers of grid size is generated by a sliding circle with diameter in order to accumulate statistics such as minimum, maximum, mean, and standard deviation of all three physical quantities listed above, cf. [2]. In our study, we generate noisy labels from these high-quality LiDAR survey statistics following some physical rules detailed in Section 3.
2.2 New York City land classification
With the aid of the 2017 New York City (NYC) LiDAR data, additional geospatial surveys like building footprints, and overhead imagery, the city’s terrain got mapped into 8 land cover classes: Tree Canopy, Grass/Shrub, Bare Soil, Water, Buildings, Roads, Other Impervious, and Railroads employing a proprietary software [13]. Such detailed land use information is rare to come by and costly to process. In our study, we employ the NYC Land Classification as ground truth validation dataset for performance quantification (cf. Table 1) of our models trained on the noisy labels (cf. Section 3).
2.3 Multispectral imagery
The National Agriculture Imaging Program’s (NAIP) [14] orthophotos provide imagery recording 4 spectral bands: near-infrared (NIR), red (R), green (G), and blue (B). The data is acquired at meter spatial resolution every other year. In our experiments we utilize the 2017 data for model training, and infer semantic segmentation of trees on data of years 2011, 2013, and 2015.
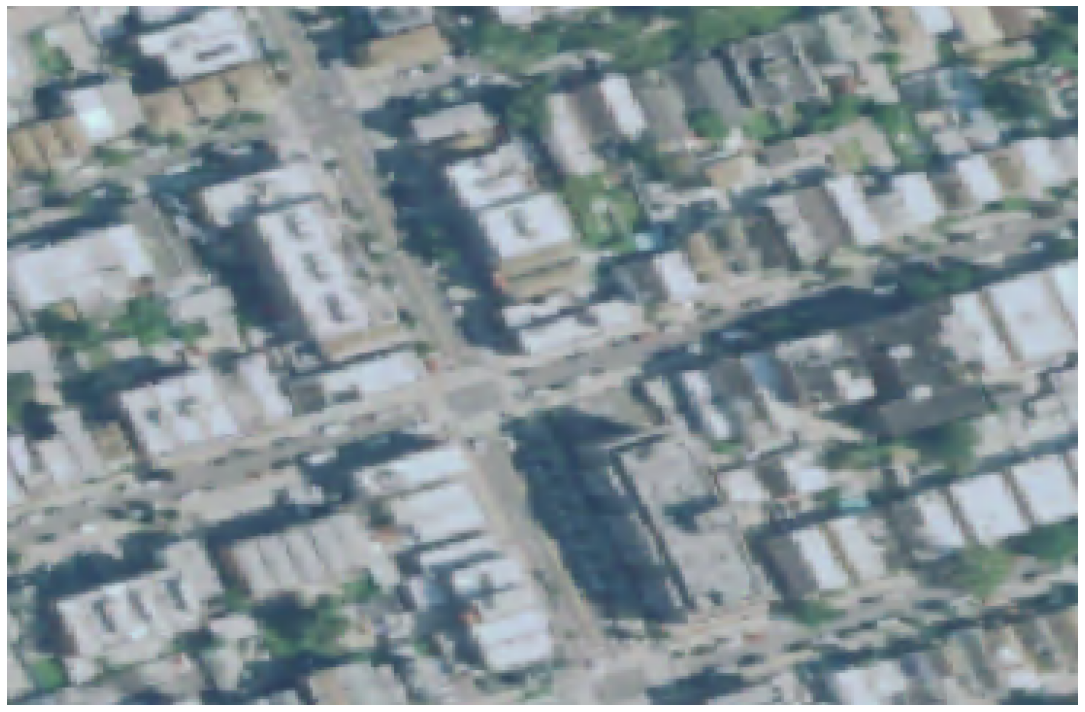
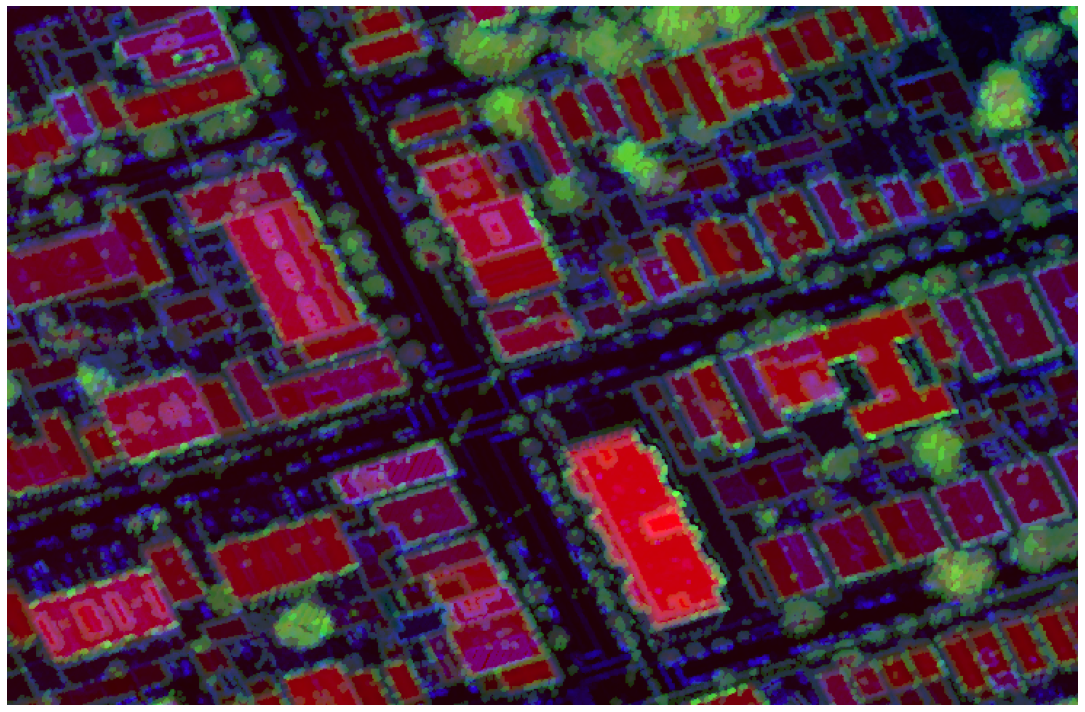
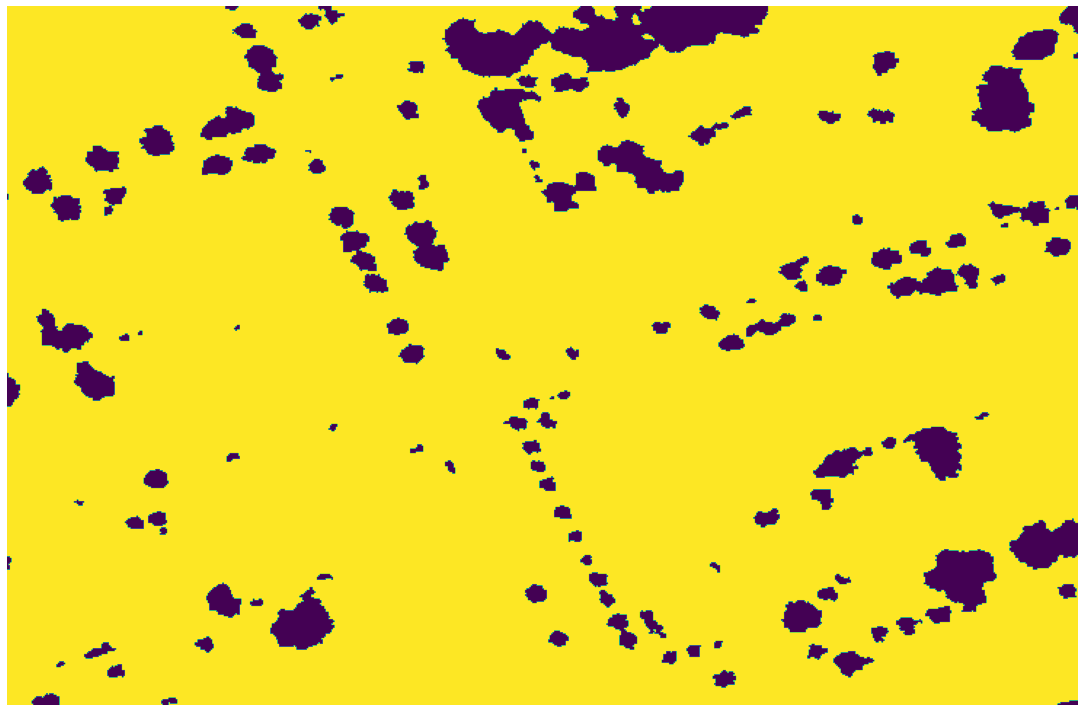
Fig. 1 illustrates samples of the curated datasets for a randomly picked geospatial area. All datasets did get spatio-temporally indexed into a nested, common grid with the aid of open-source software libraries such as GDAL [15] and PDAL [16]. Distributed data curation and model training was performed in super-computing facilities.
3 Methodology & Experimental Setup
3.1 Rule-based label generation
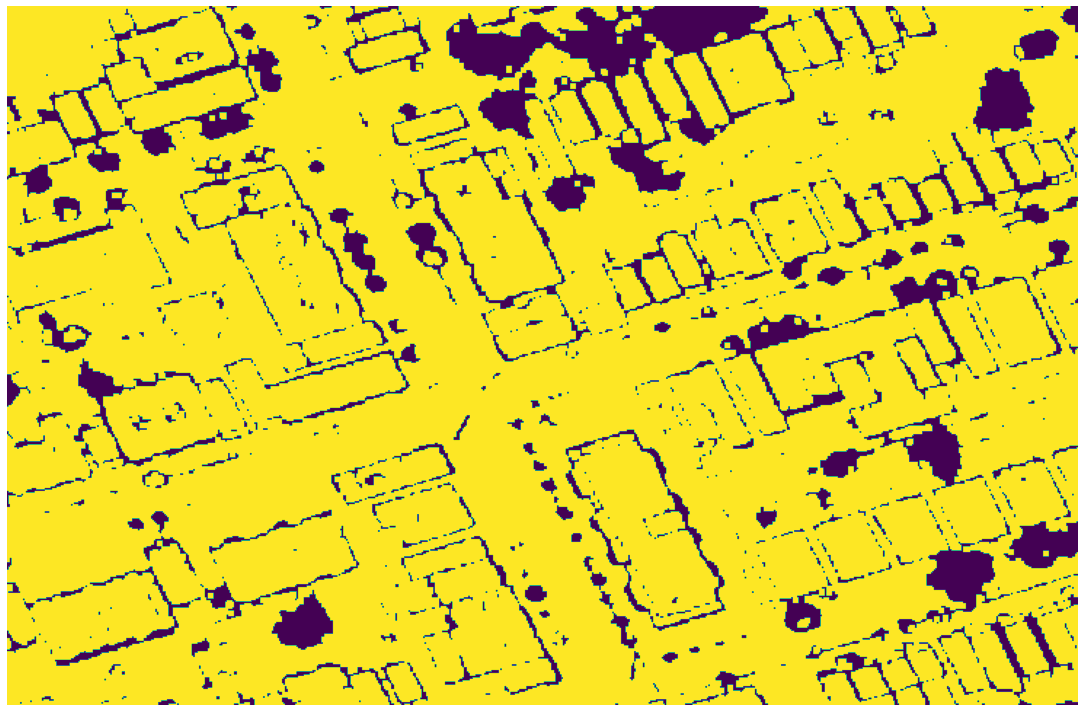
After the LiDAR point cloud survey is rasterized as detailed in Section 2 with illustration in Fig. 1(b), we apply a simple, rule-based thresholding technique to generate a (noisy) segmentation map for trees, as depicted by Fig. 1(c), more details in [2]. The rationale of this approach is guided by intuitive, physical arguments as follows: While the laser pulse emitted by the airborne LiDAR device penetrates the tree’s canopy, most likely multiple returns get generated by partial reflections on various elevation levels caused by branches, leaves, and potentially bare ground. In consequence, significant variation of both, elevation and the number of returned pulses, characterizes such vegetation which, in turn, manifests in the rasterized LiDAR statistics layers, cf. green channel of Fig. 1(b). Thresholding is sensitive to noise, generating inexact labels. As e.g. obvious from Fig. 1(b), edges of buildings (red channel) generate imprints in the LiDAR statistics layers: multiple laser returns signal significant variation in elevation. However, we note that rule-based label creation is instantaneous compared to the lengthy process of manual labeling by visual inspections of human experts. We experimentally quantify the trade-off noisy labeling vs. human inspection in the following.
3.2 Experimental setup
In a proof of concept we evaluate our approach of noisy label generation through investigation of the damage caused by Hurricane Sandy [17], detailed in Section 4. We picked two standard machine learning models to quantify the accuracy of tree identification from the multi-spectral NAIP imagery, Fig. 1(a), to perform supervised training on auto-generated, noisy segmentation maps, Fig. 1(c), namely: (a) deep learning: U-Net [10] architecture with four fully convolutional layers of down/up sampling optimized by a mixture of standard pixel-wise cross-entropy loss and a Dice loss [18] on patches of 256256 pixels, and (b) standard machine learning: Support Vector Machine (SVM) with Gaussian kernel [19] operating on the single-pixel, four-channel NAIP spectral space. Once the models were successfully trained on 2017 NAIP imagery in Queens, NYC, inference is conducted in various areas of Brooklyn, NYC for the years 2011, 2013, and 2015. We are guided by the identification of representative locations demonstrating the effect of Hurricane Sandy which struck in 2012. Spatially contrasting the inferred urban forest segmentation maps of two consecutive temporal data (2011–2013, 2013–2015), we observe changes in tree cover as detailed in Section 4, Table 2, and Fig. 2.
4 Results & Application
4.1 Performance evaluation of noisy labels
For identifaction of trees Table 1 summarizes our results in terms of standard accuracy measures [20] for binary classification, specifically: precision (type I error, false alarm), recall (type II error, missed detection), score (), and the Intersection-over-Union (IoU) [21].
Table 1 displays model performance based on the NYC Land Cover dataset, cf. Section 2.2 (exact), versus the LiDAR-based auto-generated labels (noisy). For reference, the center row in Table 1 represents performance when the noisy label generation is considered a model itself. Three key observations we distill: (a) Deep learning (U-Net) taking into account spatial context has an edge over standard machine learning techniques (SVM) operating on the single-pixel level as apparent by the IoU and -score. (b) Further the data support the assumption that training on exact segmentation maps outperforms results based on noisy labels. (c) However, most striking, machine learning has the potential to surpass the bare accuracy of noisy labels trained on. Prominently, while the precision of the noisy labels relative to the exact ones is at the level of 52%, both, the SVM and the U-Net approach generate models exceeding such by a margin of 25% and 35%, respectively.
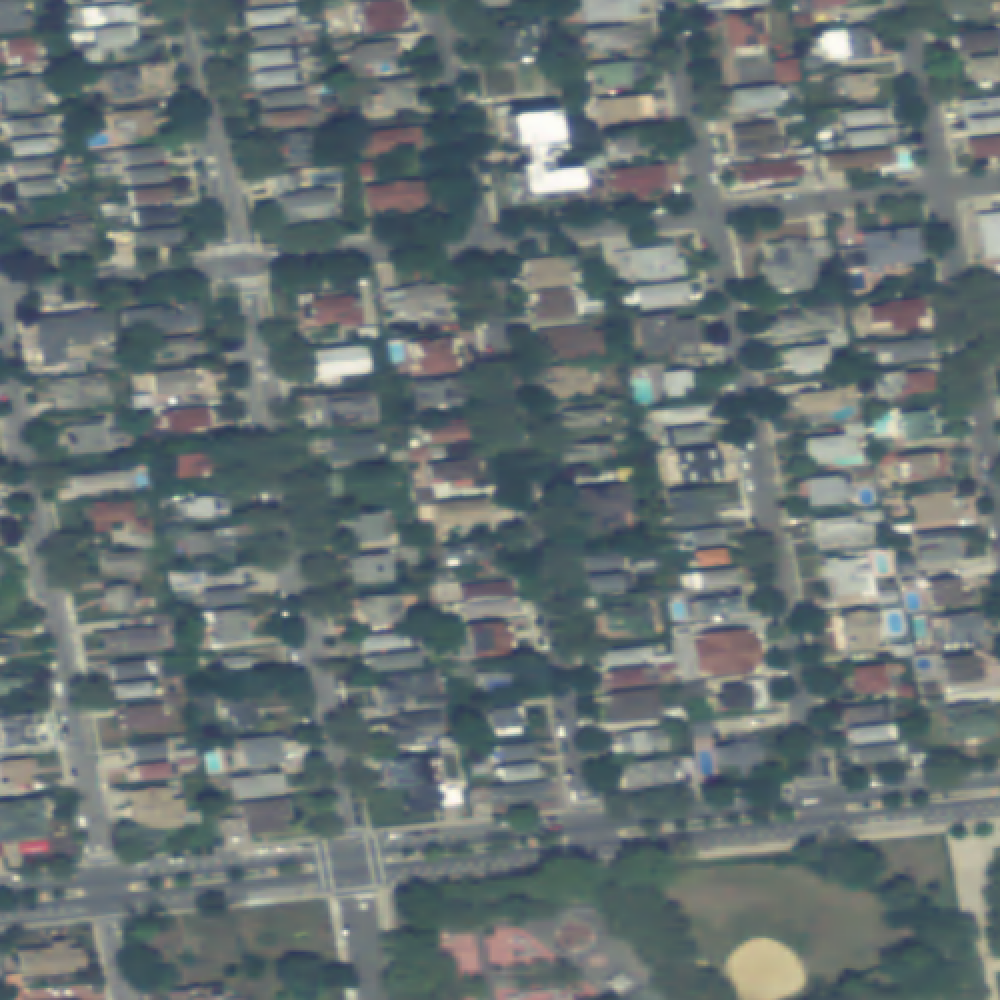
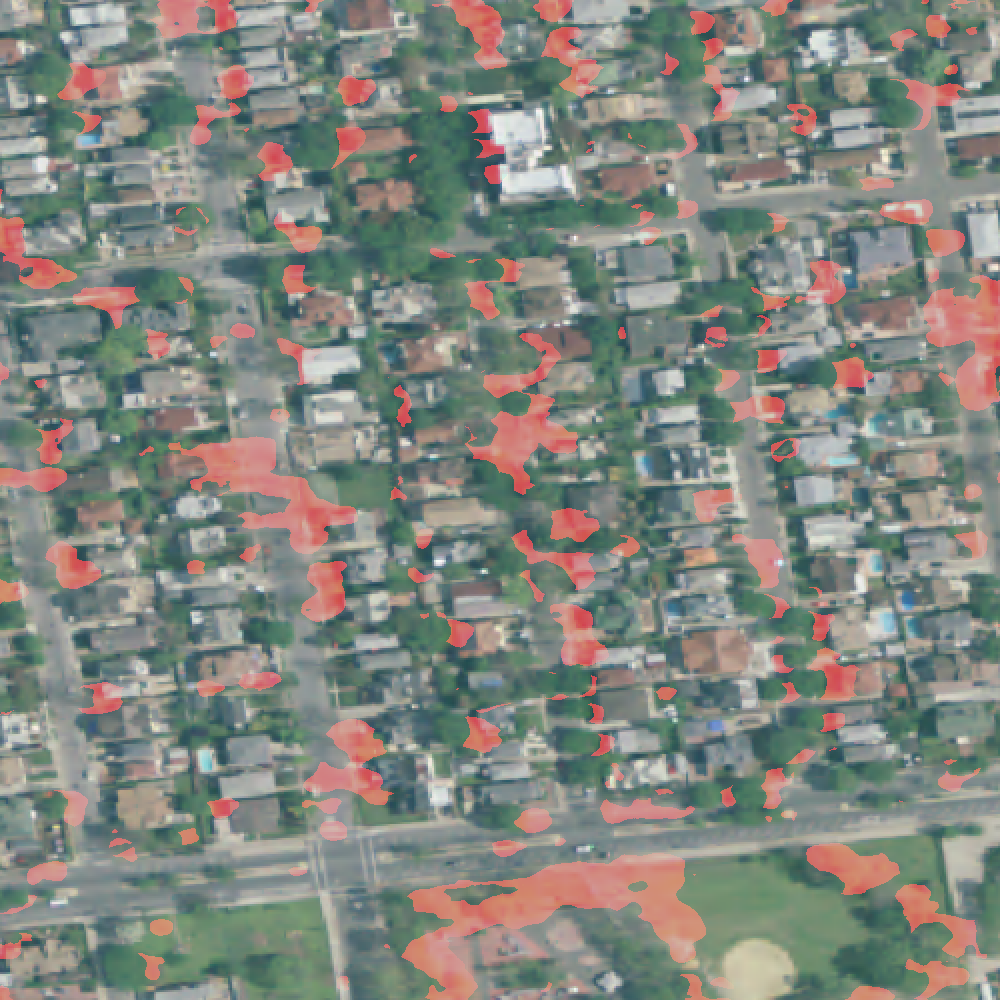
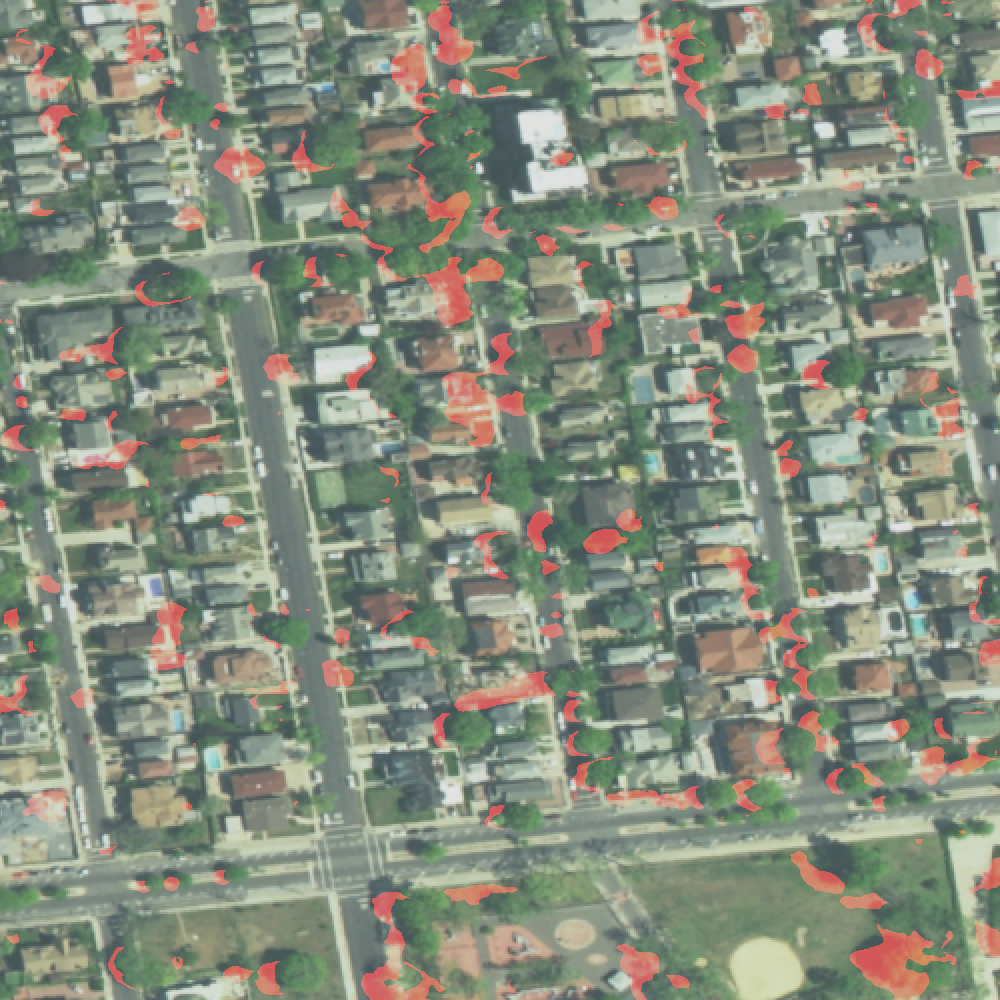
4.2 Tracing the impact of Hurricane Sandy
In order to investigate Hurricane Sandy’s damage to the urban forests of NYC, we let the U-Net model detect trees in Brooklyn before and after the extreme weather event. Through such survey we identified 3 qualitatively separate scenes as summarized in Table 2: (a) suburban areas close by the sea side with a significant loss in forests, (b) urban areas with less total area of tree cover, but protective blocks of massive, high-elevation buildings that seem to mitigate damage in trees, (c) suburban neighborhoods inland with little to no loss in urban forests. In fact, tracking the change in urban tree cover over consecutive years may reveal secondary effects. Specifically, while the change from 2011 to 2013 indicates direct damage by the storm, the 5% loss observed from 2013 to 2015 is likely from storm-caused flooding near the shore where salty sea water lets malfunction roots of trees long-term. To illustrate, Fig. 2 provides several snapshots of a highly impacted suburban area before and after the storm. As observed, our model is mature to generate reasonable detection results of fallen trees after Hurricane Sandy.
5 Conclusion & Perspectives
Rapid generation of geospatial labels is essential to analyze overhead imagery for change detection. It bears potential for environmental analysis of our planet, to e.g. provide clues on climate–induced land surface change: icecap melting, greening of the arctic, and patterns of vegetation type change due to raising temperatures and drought—to name a few. Here we presented a method to quickly generate noisy labels from one data type, and use such labels for another data type with little human interaction to delineate urban forests. Semantic segmentation using U-Net and SVM learning indicate comparable results to models trained on human expert–labeled data. In a proof-of-concept study, the change due to 2012 Hurricane Sandy was quantified for the New York City coastal regions.
| Model | Label | precision | recall | IoU | |
|---|---|---|---|---|---|
| U-Net | exact | .85 | .81 | .82 | .71 |
| noisy | .87 | .60 | .69 | .55 | |
| ref. noisy vs. exact[2] | .52 | .60 | .55 | .38 | |
| SVM | noisy | .77 | .58 | .63 | .48 |
| exact | .82 | .54 | .62 | .48 | |
| scene definition | sample reference | vegetation state | relative change | |
|---|---|---|---|---|
| description | ||||
| suburban close to shore | damaged | -14% | -5% | |
| urban close to shore | little damage | -3% | +4% | |
| suburban inland | undamaged | +.5% | +3% | |
results based on U-Net inference on NAIP imagery of years 2011, 2013, and 2015, geolocation hyperlinked to OpenStreetMap web page
Our initial experiments call for future systematic benchmarks of the approach: How may we adapt machine/deep learning architectures to cope with the noisy nature of labels to improve model accuracy for change detection in urban forests? To which extent may self-supervised learning [22] assist in mitigating inference noise from orthophotos with variation in e.g. seasonal conditions of the tree’s canopy? Moreover, regarding the analysis of damage caused by Sandy: We have a mild indication that trees along roads from South–North is more severely damaged compared to their East–West counterparts in the Eastern Coney Island suburbs. Urban planning may benefit from automated remote sensing to identify and mitigate the impact of natural disasters, and to efficiently drive reforestation. Since NAIP data and LiDAR surveys is available for major US cities, future work may apply the proposed method to various geospatial locations affected by natural hazards in order to proof the efficiency of our approach.
References
- [1] Toni Lyn Morelli, Christopher Daly, Solomon Z Dobrowski, Deanna M Dulen, Joseph L Ebersole, Stephen T Jackson, Jessica D Lundquist, Constance I Millar, Sean P Maher, William B Monahan, et al. Managing climate change refugia for climate adaptation. PLoS One, 11(8):e0159909, 2016.
- [2] Conrad M Albrecht, Fernando Marianno, and Levente J Klein. Autogeolabel: Automated label generation for geospatial machine learning. In 2021 IEEE International Conference on Big Data (Big Data), page in press. IEEE, 2021.
- [3] Nagarajan Natarajan, Inderjit S Dhillon, Pradeep K Ravikumar, and Ambuj Tewari. Learning with noisy labels. Advances in neural information processing systems, 26:1196–1204, 2013.
- [4] Tong Xiao, Tian Xia, Yi Yang, Chang Huang, and Xiaogang Wang. Learning from massive noisy labeled data for image classification. In Proceedings of the IEEE conference on computer vision and pattern recognition, pages 2691–2699, 2015.
- [5] Jiangfan Han, Ping Luo, and Xiaogang Wang. Deep self-learning from noisy labels. In Proceedings of the IEEE/CVF International Conference on Computer Vision, pages 5138–5147, 2019.
- [6] Sherrie Wang, William Chen, Sang Michael Xie, George Azzari, and David B Lobell. Weakly supervised deep learning for segmentation of remote sensing imagery. Remote Sensing, 12(2):207, 2020.
- [7] Michael Schmitt, Jonathan Prexl, Patrick Ebel, Lukas Liebel, and Xiao Xiang Zhu. Weakly supervised semantic segmentation of satellite images for land cover mapping–challenges and opportunities. arXiv preprint arXiv:2002.08254, 2020.
- [8] Caleb Robinson, Kolya Malkin, Nebojsa Jojic, Huijun Chen, Rongjun Qin, Changlin Xiao, Michael Schmitt, Pedram Ghamisi, Ronny Hänsch, and Naoto Yokoya. Global land-cover mapping with weak supervision: Outcome of the 2020 ieee grss data fusion contest. IEEE Journal of Selected Topics in Applied Earth Observations and Remote Sensing, 14:3185–3199, 2021.
- [9] Runmin Dong, Weizhen Fang, Haohuan Fu, Lin Gan, Jie Wang, and Peng Gong. High-resolution land cover mapping through learning with noise correction. IEEE Transactions on Geoscience and Remote Sensing, 2021.
- [10] Olaf Ronneberger, Philipp Fischer, and Thomas Brox. U-net: Convolutional networks for biomedical image segmentation. In International Conference on Medical image computing and computer-assisted intervention, pages 234–241. Springer, 2015.
- [11] Corinna Cortes and Vladimir Vapnik. Support-vector networks. Machine learning, 20(3):273–297, 1995.
- [12] New York City. New york city lidar, 2017. https://maps.nyc.gov/lidar/2017/. [Online, accessed 10-September-2021].
- [13] New York City. Land cover nyc, 2017. https://data.cityofnewyork.us/Environment/Land-Cover-Raster-Data-2017-6in-Resolution/he6d-2qns. [Online, accessed 10-September-2021].
- [14] United States Department of Agriculture. Naip orthoimagery. https://www.fsa.usda.gov/programs-and-services/aerial-photography/imagery-programs/naip-imagery/. [Online; accessed 10-September-2021].
- [15] Frank Warmerdam. The geospatial data abstraction library. pages 87–104, 2008.
- [16] Howard Butler, Bradley Chambers, Preston Hartzell, and Craig Glennie. Pdal: An open source library for the processing and analysis of point clouds. Computers & Geosciences, 148:104680, 2021.
- [17] The City of New York. Sandy inundation zone, 2012. data retrieved from NYC OpenData hub, https://data.cityofnewyork.us/api/geospatial/uyj8-7rv5?method=export&format=Original.
- [18] Carole H Sudre, Wenqi Li, Tom Vercauteren, Sebastien Ourselin, and M Jorge Cardoso. Generalised dice overlap as a deep learning loss function for highly unbalanced segmentations. In Deep learning in medical image analysis and multimodal learning for clinical decision support, pages 240–248. Springer, 2017.
- [19] Gustavo Camps-Valls and Lorenzo Bruzzone. Kernel-based methods for hyperspectral image classification. IEEE Transactions on Geoscience and Remote Sensing, 43(6):1351–1362, 2005.
- [20] Jesse Davis and Mark Goadrich. The relationship between precision-recall and roc curves. In Proceedings of the 23rd international conference on Machine learning, pages 233–240, 2006.
- [21] Yu Jin Zhang. A review of recent evaluation methods for image segmentation. In Proceedings of the Sixth International Symposium on Signal Processing and its Applications (Cat. No. 01EX467), volume 1, pages 148–151. IEEE, 2001.
- [22] Longlong Jing and Yingli Tian. Self-supervised visual feature learning with deep neural networks: A survey. IEEE transactions on pattern analysis and machine intelligence, 2020.