Cosmological Constraints on the Global Star Formation Law of Galaxies: Insights From Baryon Acoustic Oscillation Intensity Mapping
Abstract
Originally proposed as a cosmological probe of the large-scale structure, line intensity mapping (LIM) also offers a unique window into the astrophysics of galaxy evolution. Adding to the astrophysical explorations of LIM technique that have traditionally focused on small, non-linear scales, we present a novel method to study the global star formation law using forthcoming data from large-scale baryonic acoustic oscillation (BAO) intensity mapping. Using the amplitude of the percent-level but scale-dependent bias induced by baryon fraction fluctuations on BAO scales, we show that combining auto- and cross-correlation power spectra of two (or more) LIM signals allows to probe the star formation law power index . We examine the prospect for mapping H and [O III] lines across all scales, especially where imprints of the baryon fraction deviation exist, with space missions like SPHEREx. We show that although SPHEREx may only marginally probe by accessing a modest number of large-scale modes in its 200 deg2 deep survey, future infrared all-sky surveys reaching a comparable depth with an improved spectral resolution () are likely to constrain to a precision of 10–30%, sufficient for distinguishing models with varying feedback assumptions, out to using BAO intensity mapping. Leveraging this effect, large, cosmic-variance-limited LIM surveys in the far future can scrutinize the physical connection between galaxy evolution and the large-scale cosmological environment, while performing stringent tests of the standard cosmological model.
1 Introduction
The coupling between radiation and baryons prior to cosmic recombination drives primordial acoustic waves that leave characteristic imprints on the matter power spectrum through the gravitational effect of baryons. These so-called baryon acoustic oscillations (BAOs) exist on a typical scale of about cMpc, and have become an important standard ruler in cosmology Eisenstein (2005). Baryons are later on coupled to dark matter through gravity and can be perceived as a (biased) tracer of the matter distribution, with a roughly constant bias factor on large, linear scales. However, a scale-dependent bias is predicted to be induced by fluctuations of the relative baryon fraction measured by the local densities of baryons and dark matter (Barkana & Loeb 2011, hereafter BL11; Angulo et al. 2013; Schmidt 2016; Soumagnac et al. 2016). Detection of this effect has been attempted through BAO measurements using galaxies from the SDSS-III BOSS data, in the aim of testing the standard cosmological paradigm and connecting the light-to-mass ratio of galaxies to their large-scale cosmological environment (Soumagnac et al., 2016, 2019). However, the results remain inconclusive due to the limited sample size and imaging quality of SDSS data.
Given the close connection between the BAO-induced modulation of the baryon fraction and the mass-to-light ratio of galaxies, the scale-dependent modulation is a useful probe of how the star formation activity is related to the gas content of galaxies — a fundamental relation of galaxy evolution often referred to as the global star formation law (Kennicutt, 1998; Daddi et al., 2010; Krumholz et al., 2012; Liu et al., 2015; de los Reyes & Kennicutt, 2019; Kennicutt & De Los Reyes, 2021). Astronomical determination of it relies on accurately measuring multi-wavelength proxies of the ongoing star formation rate (SFR; e.g., rest-frame UV continuum) and the gas mass (e.g., CO line luminosity) from selected galaxy samples, and therefore tends to be demanding and susceptible to various systematics, such as dust obscuration, gas excitation, and selection bias, especially at (Casey et al., 2014). To date, the state-of-art analysis is still restricted to a relatively small sample of several hundred nearby galaxies (see de los Reyes & Kennicutt, 2019; Kennicutt & De Los Reyes, 2021), while yet more comprehensive analyses of larger sample sizes and/or at higher redshifts are limited by requirements for high-quality, multi-wavelength data. Statistical constraints from BAO amplitudes thus represent a novel independent way to characterize the global star formation law, including its potential redshift evolution and multi-modality (Santini et al., 2014; Kennicutt & De Los Reyes, 2021), without the necessity of detecting individual galaxies.
A concept originating from the field of observational cosmology, the line intensity mapping (LIM) technique has received increasing attention in recent years as a powerful means to study the astrophysics of galaxies and the intergalactic medium (Chang et al., 2019; Kovetz et al., 2019). In particular, the tight connection between the emission-line production and the astrophysics of interstellar gas of galaxies makes LIM a promising statistical probe of galaxy evolution. Historically, large-scale fluctuations of line intensity fields have been mainly considered for cosmological applications, such as probing alternative dark matter models, dark energy, gravitational lensing, neutrino properties, and the primordial non-Gaussianity (e.g., Sitwell et al., 2014; Karkare & Bird, 2018; Bernal et al., 2019; Liu & Breysse, 2021; Chung, 2022; Maniyar et al., 2022; Moradinezhad Dizgah et al., 2022). The majority of astrophysical explorations of LIM have been focusing on small, non-linear scales, where astrophysical processes of galaxy evolution are manifested through their effects on the one-halo or shot-noise components of the LIM power spectrum (e.g., Wolz et al., 2017; Breysse & Alexandroff, 2019; Mas-Ribas & Chang, 2020; Schaan & White, 2021). Therefore, it is interesting to extend the scope of astrophysical information from LIM to the linear regime by measuring baryon fraction fluctuations with BAO intensity mapping. The wide-bandwidth and coarse-grain averaged nature of LIM also makes it convenient to conduct coherent analysis of large statistical samples at multiple redshifts, thereby constraining any time evolution.
LIM will be a main survey strategy of future space missions such as the Spectro-Photometer for the History of the Universe, Epoch of Reionization, and Ices Explorer (SPHEREx; Doré et al., 2014) and the Cosmic Dawn Intensity Mapper (CDIM; Cooray et al., 2019), which promise to offer unprecedented surface brightness sensitivity at near-infrared wavelengths that may allow to detect signals as faint as that expected from the first stars in the universe (see e.g., Sun et al., 2021; Parsons et al., 2021). High signal-to-noise measurements of large-scale LIM signals of optical/UV lines like H 6563 Å, [O III] 5007 Å and [O II] 3727 Å are also made possible at (Gong et al., 2017). It is therefore intriguing to understand how BAO imprints of the baryon fraction deviation may be utilized by these future experiments to study galaxy evolution at intermediate redshifts.
In this paper, we propose a novel method of constraining the global star formation law of galaxies from cosmological measurements of BAO intensity mapping. In Section 2, we present the modeling framework of the line intensity field in the presence of baryon fraction fluctuations and how LIM surveys can leverage the scale-dependent bias induced on BAO scales to extract the star formation law power index. In Section 3, we use SPHEREx as an example to investigate the observational prospects for our method and forecast the constraining power on the parameters of interest based on the estimated detectability of H and [O III] LIM signals. We discuss some limitations and future improvements of our analysis, before concluding in Section 4.
2 Models
The BAO-induced modulation of the relative clustering of baryons and dark matter is proposed by BL11 as a useful cosmological probe. In this work, we reformulate the original observational proposal, which involves measurements of the (original and luminosity-weighted) number density fields of galaxies, into a framework of multi-tracer LIM observations, which avoids the complications associated with flux-limited samples and alleviates parameter degeneracies.
2.1 Intensity Fields and Halo Baryon Fraction
2.1.1 Perturbations of Halo Baryon Fraction
Here we briefly review the physical concepts behind the halo baryon fraction perturbations on BAO scales, and interested readers are referred to BL11 for more details.
The scale-dependent modulation of the baryon and dark matter density fields due to primordial acoustic waves can be described as
| (1) |
where is the total matter overdensity. We use CAMB (Lewis et al., 2000) to obtain , the fractional deviation of the global baryon fraction whose cosmic mean value is . Relatedly, the halo baryon fraction is . By separating perturbations into large-scale and small-scale effects of the density field and halo collapse, the lowest-order perturbation of the halo baryon fraction is
| (2) |
where is the critical density for spherical collapse in linear theory. The mostly constant, small-scale baryon fraction deviation, , can be well-approximated by , and is a constant factor describing the enhancement of gas depletion into halos due to non-linear collapse, which can be characterized by simulations (Naoz et al., 2011; Angulo et al., 2013).
2.1.2 Connection to Line Intensity Fields
For a given line tracer of the LSS with line luminosity , we have (BL11)
| (3) |
where is the luminosity-weighted effective bias of the tracer stems from the halo bias111Because we work solely with LIM signals in this work, bias contributions from the source number density and the luminosity weighting considered separately in BL11 are combined into a single ., which is taken to be scale-independent, and denotes the additional, scale-dependent bias associated with perturbations of . Factors (the star formation power law index) and (the –SFR power law index) for the luminosity weighting of are determined by galaxy astrophysics. Both observations and analytic models invoking feedback regulations suggest a universal, power-law relation between star formation activity and the gas content of galaxies, namely the global star formation law. Specifically, the star formation rate surface density is related to the gas surface density by , where the exact value of is sensitive to astrophysical processes like stellar feedback (Dekel et al., 2019). For example, the well-known Kennicutt-Schmidt law suggests , whereas Faucher-Giguère et al. (2013) propose a simple model where the galaxy disc is supported entirely by stellar feedback and find . If the –SFR relation also follows a simple power law with index (as is usually the case, see Section 2.2.2), then
| (4) |
which implies , as discussed above.
BL11 make an initial observational proposal to use the scale dependence from , which modulates the BAO peak amplitudes but barely changes the peak positions, to separate different bias contributions. Specifically, they propose to compare the number density and luminosity density power spectra of the same galaxy sample to cancel out sources of foreground contamination in common. By analogy, we note that LIM data enable a major simplification of observables thanks to their sensitivity to the aggregate line emission (Visbal & Loeb, 2010). The (square-rooted) power spectrum ratio of two LIM signals is
| (5) |
where we assume the large-scale limit and that the two line tracers share the same (but see Section 2.2.1 for a full treatment), such that the coefficients can be expressed as and , respectively. Similar to what BL11 find, we see that the scale dependence of allows to separately constrain and with , and thereby infer . Nonetheless, several important issues are apparent. First, with alone, it is clearly infeasible to decouple individual bias factors , , and from their ratios. Second, to deduce the global star formation law represented by from , the parameter must be known a priori, though it can actually vary significantly for a single line tracer under different astrophysical conditions, or for different tracers as is relevant here.
Therefore, to ultimately constrain , some means in addition to the measurement of is needed to lift the degeneracies among different bias factors and account for astrophysical uncertainties in the –SFR relation. In what follows, we investigate and demonstrate a natural extension of Equation (5) in the context of multi-tracer LIM. The cross-correlation between the two line tracers and the full shape of the line intensity power spectrum including the small-scale, shot-noise term are incorporated into the analysis, in order to maximally separate the different bias factors and astrophysical parameters.
2.2 LIM Observables and Emission Line Models
2.2.1 Power Spectrum and Galaxy–Halo Connection
For a given line , the power spectrum of line intensity fluctuations is
| (6) |
where is the net bias factor of the tracer defined in Equation (3) and is the matter power spectrum of . Scale-independent factors and represent the mean line intensity and the shot-noise power arising from the Poissonian distribution of discrete line emitters, respectively. We compute them from the –SFR relation as
| (7) |
and
| (8) |
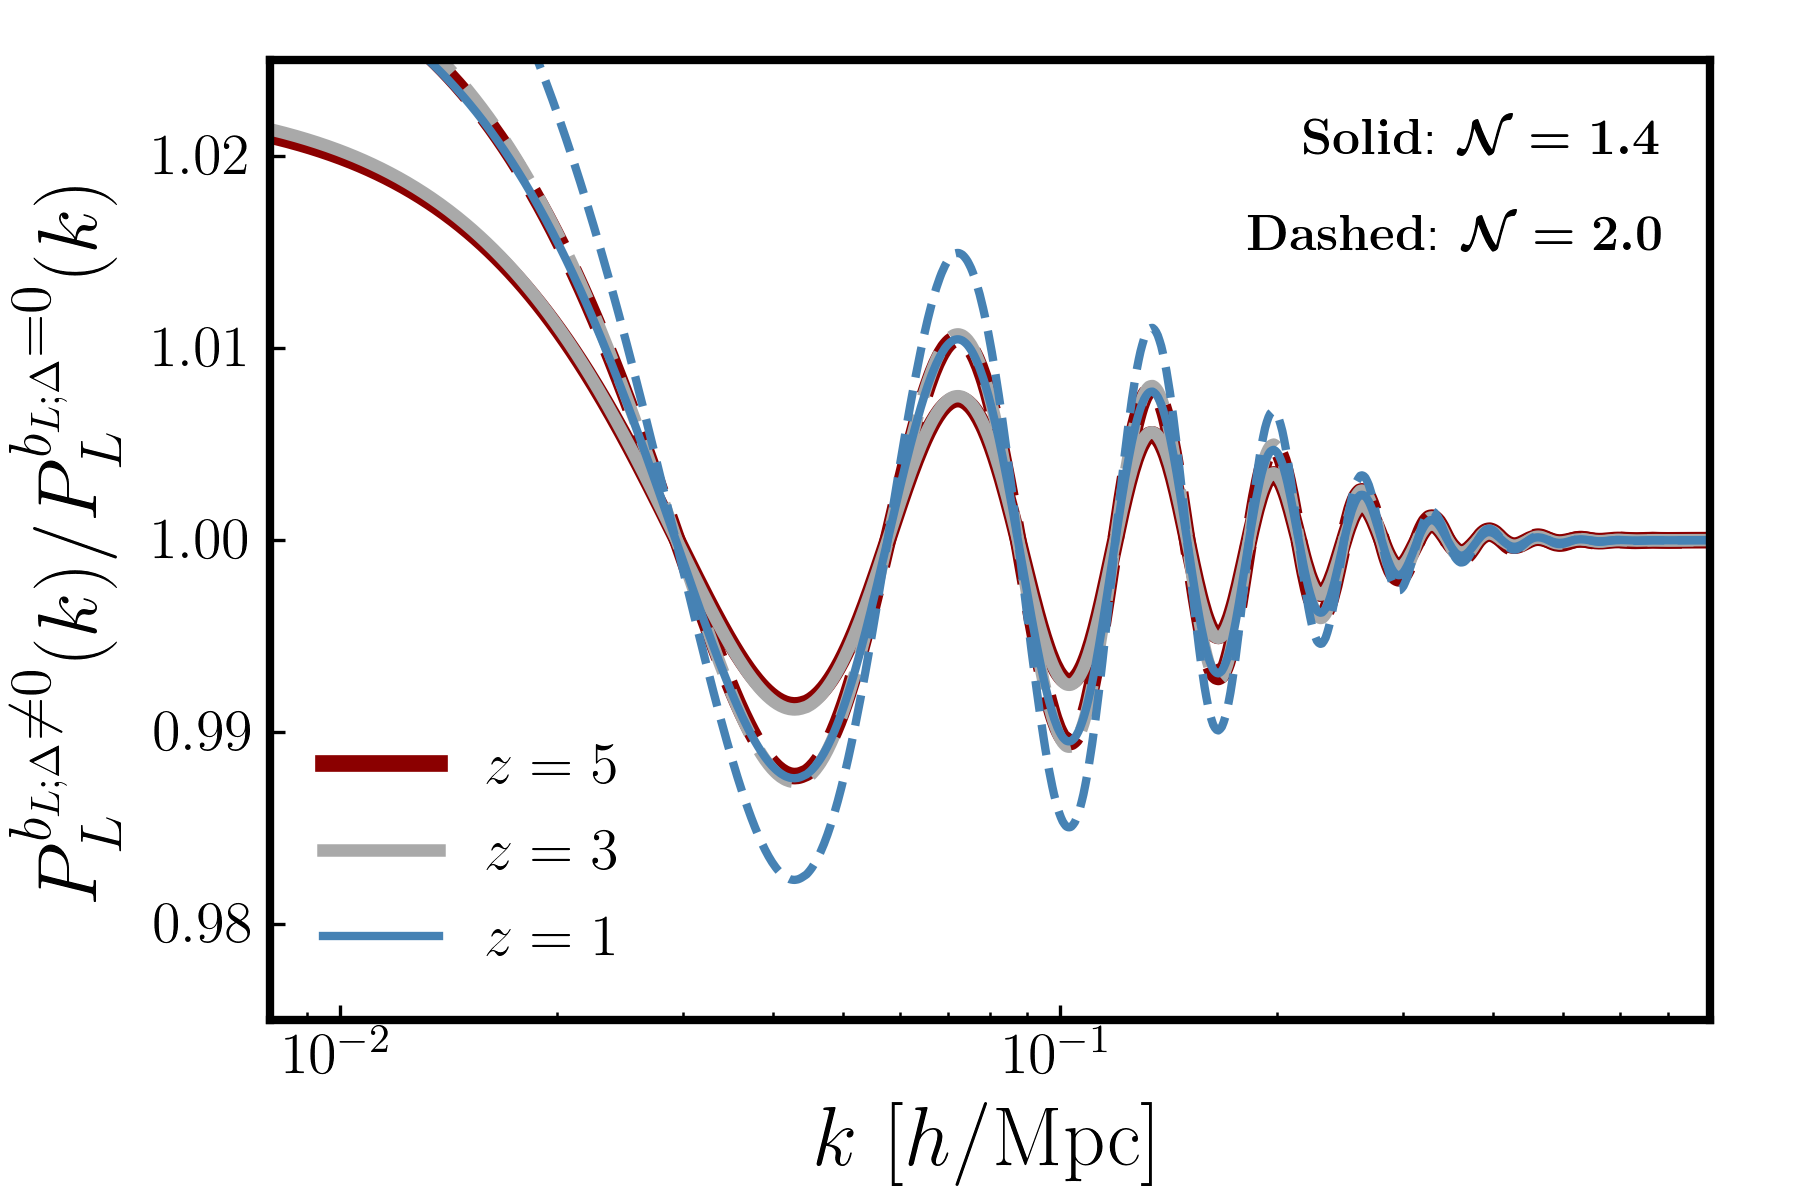
where is related to the line luminosity density by , the comoving angular diameter distance , and the luminosity distance . We adopt the halo mass function from Tinker et al. (2008) and evaluate the integrals over . Figure 1 shows how the line intensity power spectra compare with and without including the scale-dependent bias induced by baryon fraction fluctuations.
For simplicity, we assume a one-to-one correspondence between halos and galaxies, and ignore details of the halo occupation distribution (HOD) and the stochasticity in the line luminosity that can have non-trivial effects on small scales (see e.g., Sun et al., 2019; Schaan & White, 2021). For each galaxy, we obtain its SFR, , from the Data Release 1 of the UniverseMachine code (Behroozi et al., 2019), which semi-empirically models the correlated halo assembly and galaxy growth.
2.2.2 L–SFR Relation
As discussed in Section 2.1, the line intensity serves as a biased tracer of the local matter density, which is subject to not only the halo occupation and environmental dependence of galaxy evolution but also the relation between the production of line photons and the baryon fraction of galaxies. While accounts for the fluctuations sourced by the dependence of source number density and luminosity on the local matter density, we also need to specify the –SFR relation to model . Motivated by the well-established correlation observed between the SFR and the luminosity of lines as star formation tracers, we take
| (9) |
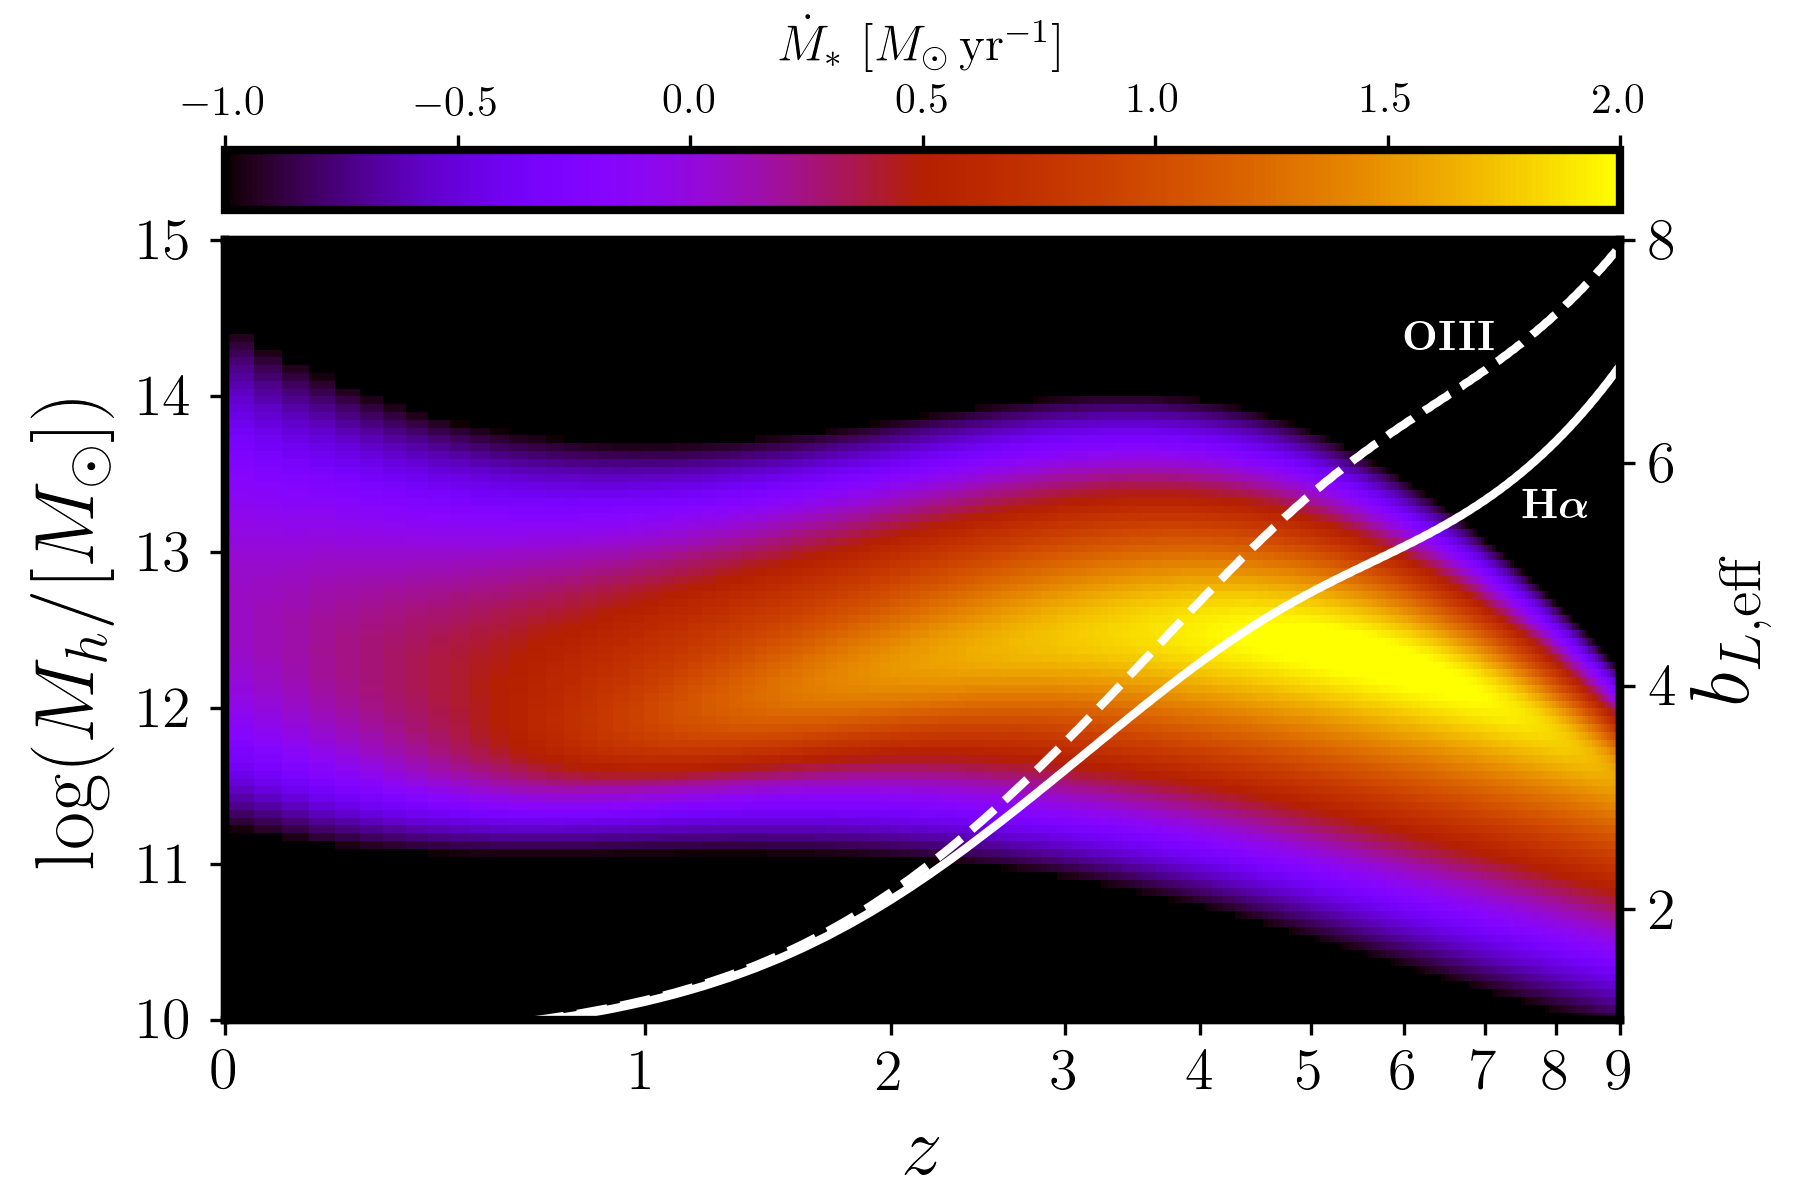
where for each line we vary both (affecting the power spectrum amplitude) and (affecting both the power spectrum amplitude and shape). In Figure 2, we plot over the space the scale-independent, effective bias of two promising target lines for LIM, H and [O III], that will be studied by SPHEREx. Note that while we treat as a free parameter in our Fisher matrix analysis (see Section 3), we use fiducial values of and to obtain the fiducial of our tracers from the scale-independent halo bias. As shown in Figure 2, of either line evolves by about a factor of 5 and the different redshift trends are associated with the different fiducial values taken (see Table 1).
3 Observational Prospects
3.1 Basic Setups
To demonstrate the capability of BAO intensity mapping for probing the global star formation law through the baryon fraction deviation, in this section we envisage a case study to jointly measure H and [O III] LIM signals at –5 with using a SPHEREx-like experiment. We empirically model the LIM signals using the best-fit results to the observed –SFR relations, assuming and for H (Ly et al., 2007), and and for [O III] (Villa-Vélez et al., 2021). Table 1 summarizes the fiducial input values and priors (1, quoted in percentage of the fiducial value) of model parameters, on which the constraints from mock observations are estimated through the Fisher matrix analysis.
As discussed in Section 2.1.2, to explore the parameter constraints that SPHEREx-like experiments can provide, we investigate the observational prospects for measuring together the ratio of H and [O III] auto-power spectra, , and their cross-power spectrum, . There are two main reasons that we choose instead of using the auto-power spectra of the respective lines. It preserves the format of the metric proposed in BL11, which can be easily separated into scale-independent and scale-dependent terms. More importantly, given that auto-power spectra are often contaminated by some common sources of foreground such as the atmospheric emission and the extragalactic background light, taking the ratio makes it more justified to use the (propagated) signal-to-noise ratio (S/N) estimated from simple mode counting.
We then adopt the survey specifications of SPHEREx to estimate the detectability of and , following procedures outlined in e.g., Gong et al. (2017). While the all-sky survey of SPHEREx is more advantageous for measuring the BAO amplitudes on large scales, it is too shallow compared to the 200 deg2 SPHEREx deep survey, which is approximately 7 times deeper in terms of the surface brightness sensitivity and thus more suitable for LIM applications. Thus, we assume a survey area of 200 deg2 and a spectral resolving power of , consistent with the way H and [O III] LIM will be conducted by SPHEREx in its four shortest-wavelength bands. There are, however, two noteworthy differences from Gong et al. (2017). First, for the surface brightness sensitivity that determines the instrument noise power, , we assume the current best estimate (CBE) performance of SPHEREx222See the public product released at https://github.com/SPHEREx/Public-products/blob/master/Surface_Brightness_v28_base_cbe.txt, which leads to an approximately 100 times lower . Second, given the relatively low spectral resolution of SPHEREx, we include an extra smoothing factor, , in the sensitivity calculation that accounts for the attenuation of the signal power spectrum on small scales due to finite spatial and spectral resolutions. Although our baseline model predicts H and [O III] signal levels similar to those in Gong et al. (2017) and that the total S/N estimates of the power spectra differ only by a factor of 2, the two aforementioned factors imply S/N distributions as a function of much different from Gong et al. (2017).
3.2 Fisher Matrix Analysis
With estimates of the target observables and SPHEREx sensitivities in hand, we calculate the covariance matrix of the model parameters using the Fisher matrix
| (10) |
where the summation is over all the bins for the data vector , and the covariance between the two observables is neglected since auto- and cross-power measurements are subject to generally uncorrelated systematic uncertainties.
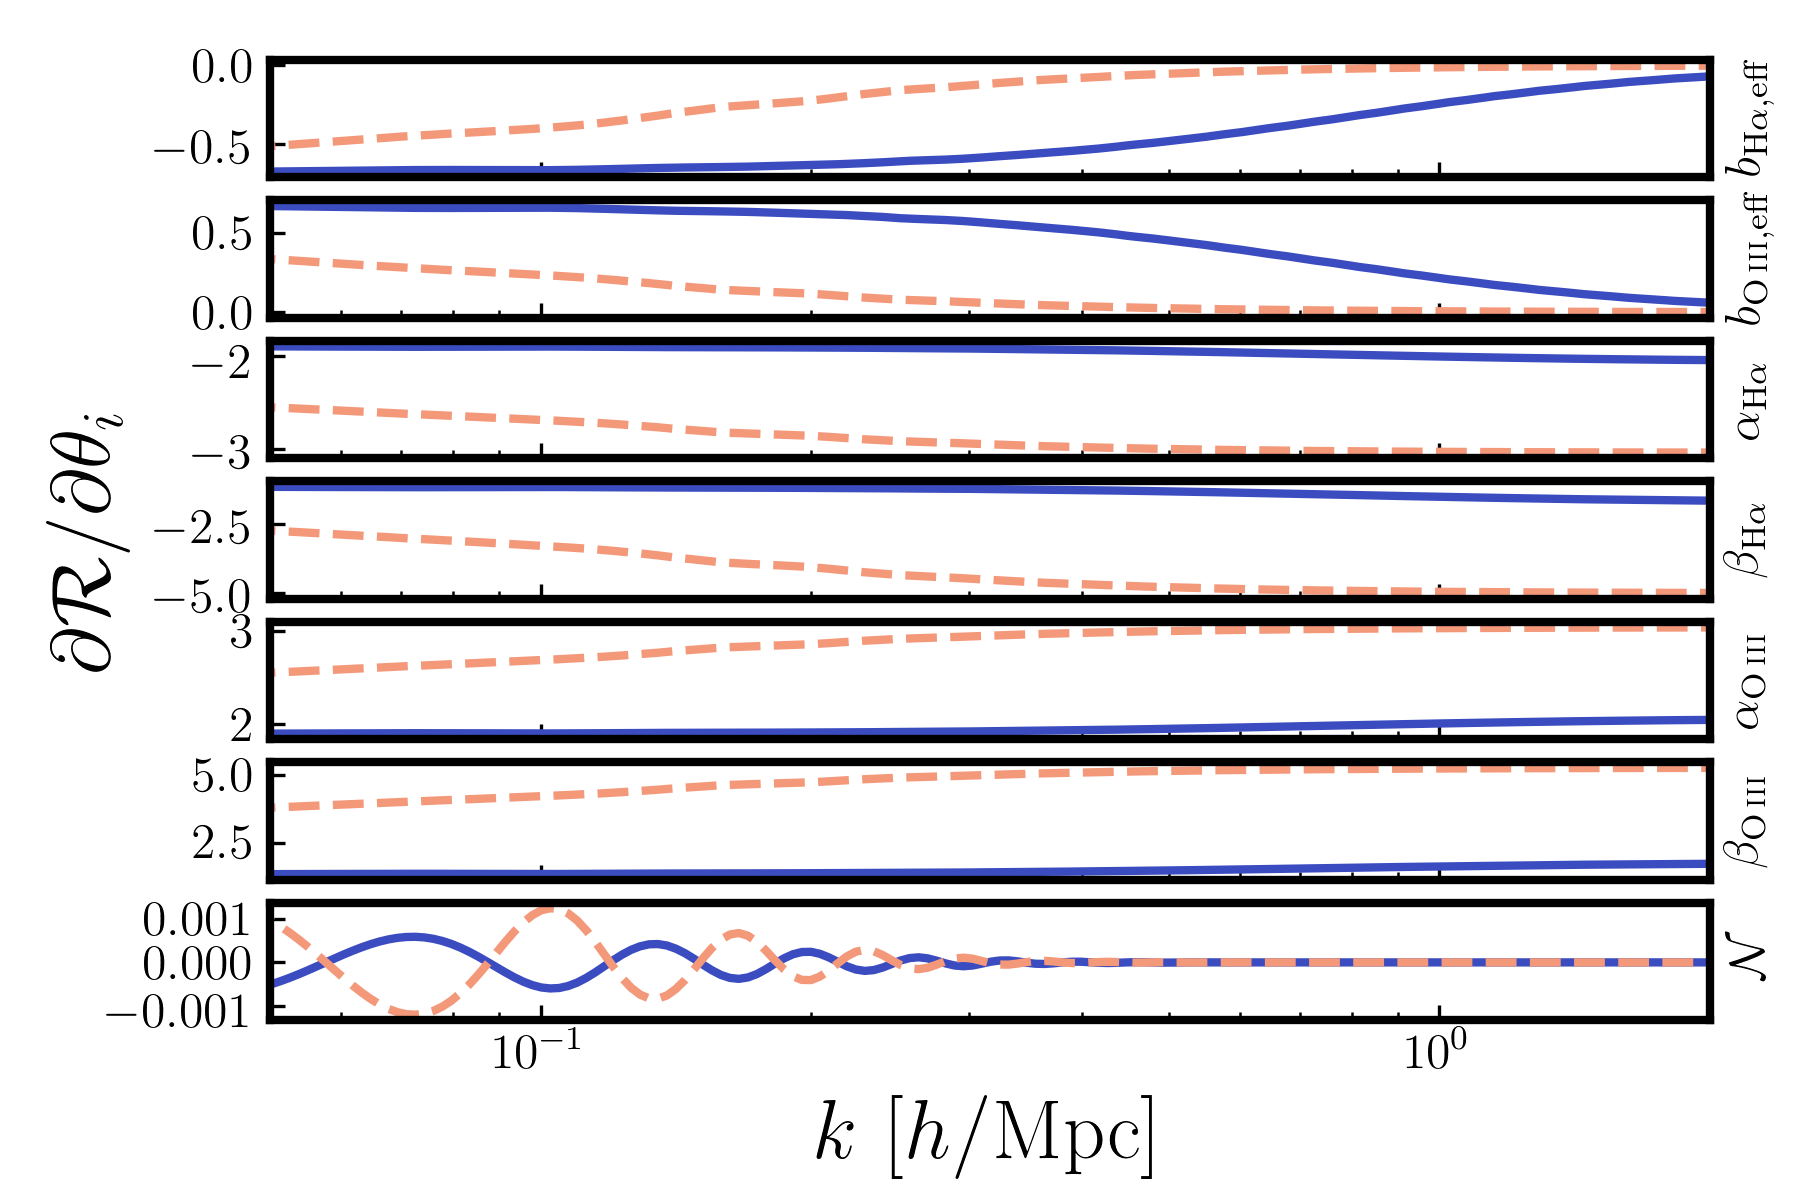
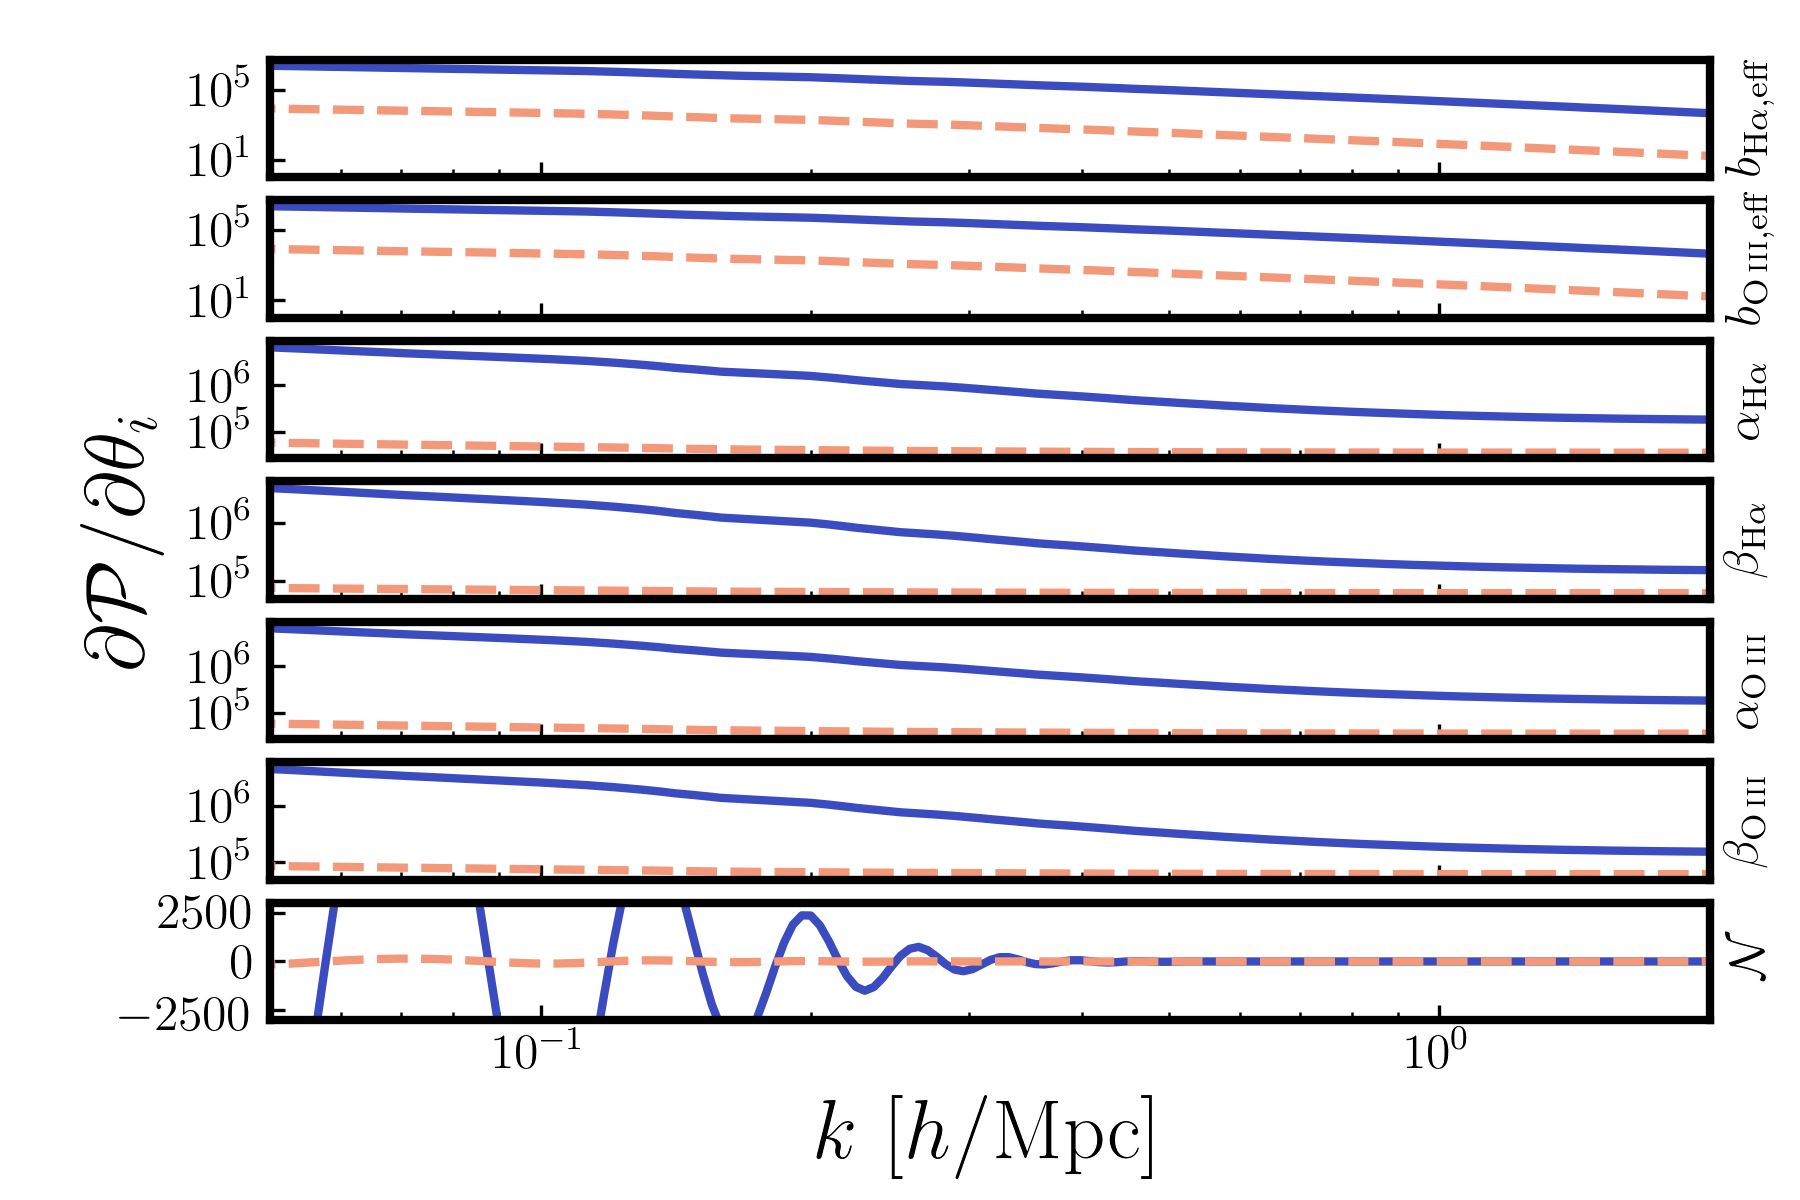
Figure 3 shows the parameter derivatives of the two observables entering the Fisher matrix analysis, and . The way they are modulated by the model parameters can be perceived from the shape of the curves, which characterizes the scale dependence of the modulation. For instance, from both and , it is clear that has a diminishing effect on the observables towards smaller scales, which become increasingly dominated by the shot noise that only depends on and . For , because it only imposes small perturbations on the power spectrum amplitude on BAO scales, the derivatives with respect to it have qualitatively different shapes compared with others. Such distinctions in the scale dependence are key to the capability for separately constraining all free parameters with the two observables. Indeed, as suggested by the close similarity between some curves of derivatives, e.g., with respect to and , strong (anti-)correlation and thus degeneracy exist between these parameters.
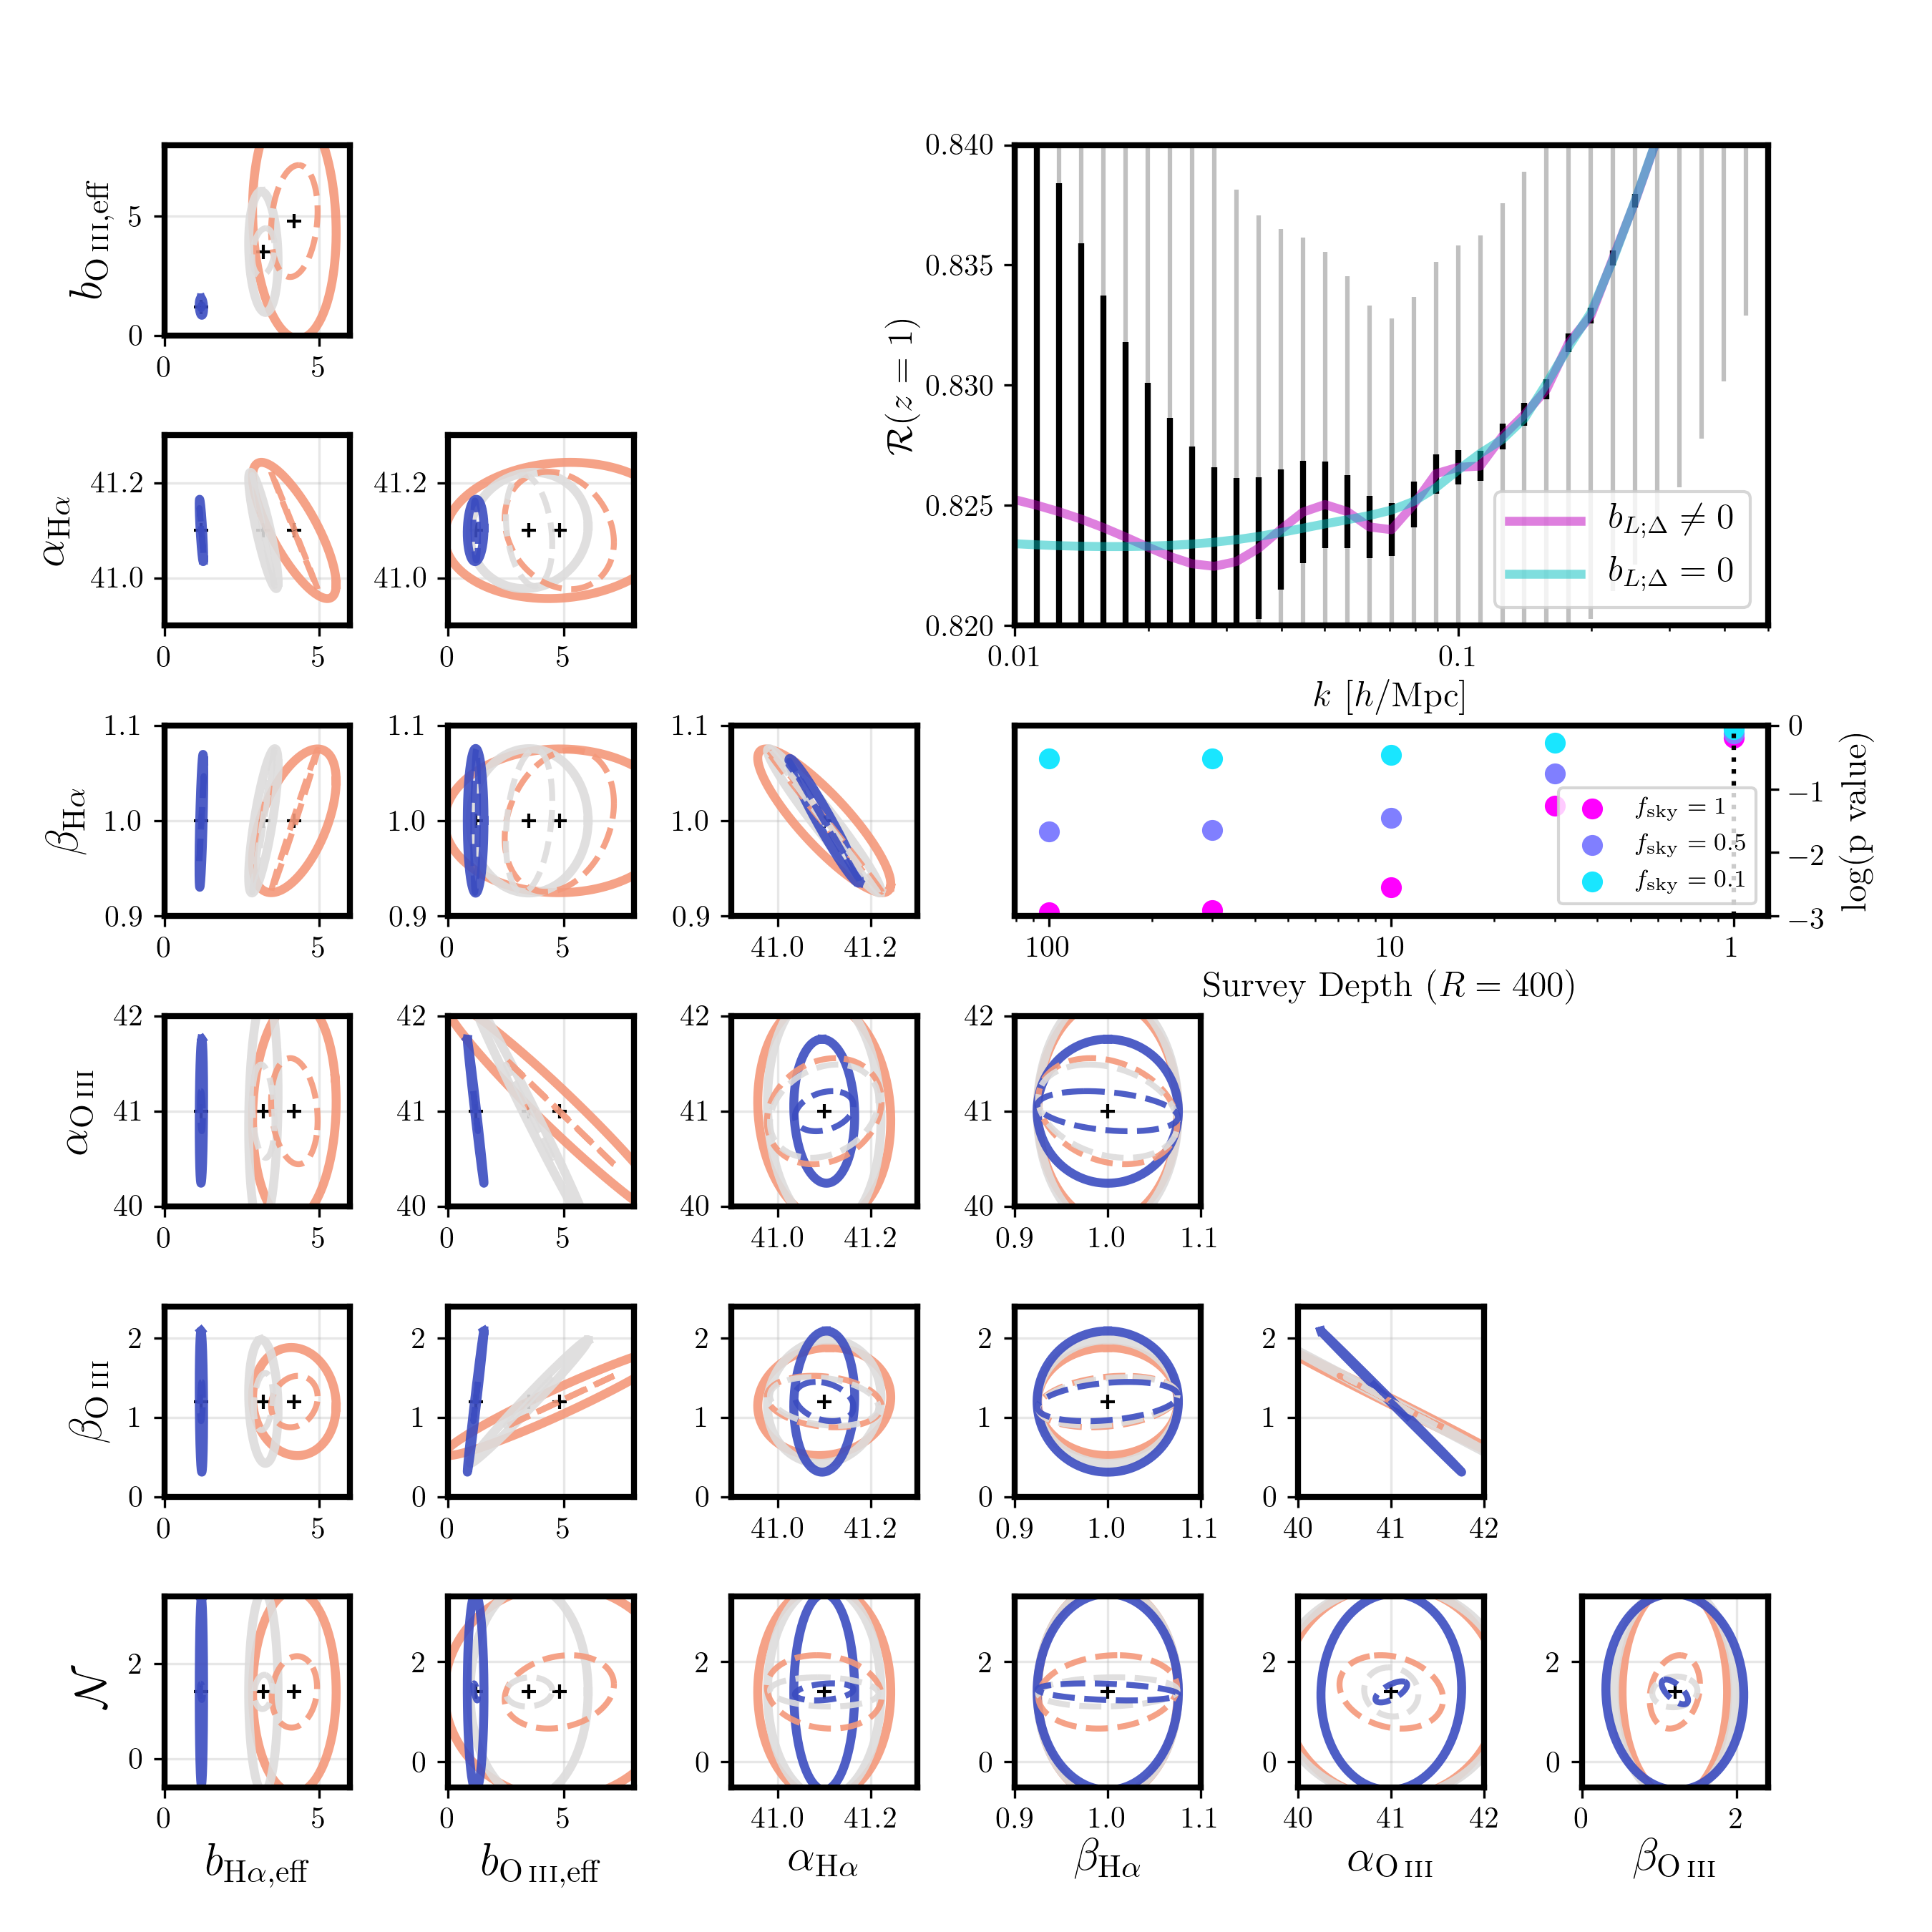
We show in Figure 4 the projected constraints on all the free parameters together with their degeneracy patterns from our Fisher matrix analysis. Overall, jointly measuring and of H and [O III] at high significance makes it possible to robustly constrain the model parameters, including . Unfortunately, although measurements of the observables are already cosmic-variance limited for the SPHEREx deep survey, it does not have large enough sky coverage and spectral resolution to measure a sufficient number of large-scale modes. With the assumed priors, can only be measured to a 80% precision with SPHEREx as shown by solid contours, with insufficient evidence for a scale-dependent bias induced by baryon fraction fluctuations, which we quantify by the p value corresponding to the chi-square difference between best-fit models with and without the scale-dependent bias (a p value 0.9 is obtained in this case). While jointly fitting all redshift bins neglecting any redshift evolution improves the constraints, it is still hard to achieve meaningful constraints with the limited size and spectral resolution of the SPHEREx deep survey.
Thus, we also consider a more idealized all-sky survey with that provides a 10-fold increase in the number of accessible modes required to beat down the sample variance and the same survey depth as the SPHEREx deep survey. With similar instrument specifications but 10 times higher spectral resolution, a much lower system temperature (5 K vs. 80 K for SPHEREx) must be reached via active cooling to achieve a reasonable mission duration of about 2 years. As shown by the dashed contours, such a deep, all-sky survey allows the model parameters to be measured a lot more precisely and the constraints are much less prior-dominated. In this idealized case, a strong evidence for BAO-induced scale-dependent bias is observed (p value 0.005), and can be determined to a precision of 10–30% up to , which allows to investigate the physical origin of the global star formation law and reveal any dependence on redshift or the galaxy population. For reference, in the upper inset of Figure 4, we show a comparison of the constraints on from the two surveys considered, together with best-fit models with and without introducing the scale-independent bias. In the lower inset, we show how the p value of chi-square difference between the best-fit models changes with and the survey depth with respective to the SPHEREx all-sky survey. Consistent with what the dashed contours imply, an all-sky survey reaching the SPHEREx deep survey depth with is required for obtaining a strong evidence for the scale-dependent bias.
Two other features are noteworthy from the resulting constraint ellipses. First, the degeneracy patterns displayed are generally well-expected from how the model parameters affect the two observables. Clear (anti-)correlations are evident between and , and , etc. Second, we do see a change of degeneracy direction between and other parameters from to and 4. This is associated with a change in the dependence of the [O III]–H power ratio on , which can be easily seen from the derivative curve of shown in the top panel of Figure 3, due to the presence of shot-noise contribution in , which can alter the way a nonzero impacts at sufficiently high redshifts like .
4 Discussion and Conclusions
So far, we have assessed how imprints of the baryon fraction deviation on BAO scales can be utilized by future LIM surveys to constrain the fundamental relationship between star formation and the gas content of galaxies. A number of caveats need to be noted though regarding our analysis. First, in practice, LIM data sets ultimately need to be analyzed allowing both astrophysics and cosmology to vary. This is particularly true for large-scale signals such as the BAOs considered in this work, and will inevitably make the extraction and interpretation of astrophysical information like more challenging. Meanwhile, although we choose to leave them out of this work for succinctness, observational effects that complicate the target LIM signals, such as redshift-space distortions (RSDs) and line interlopers, are important factors to be accounted for in the actual data analysis. Fortunately, with techniques such as measuring the full multipole moments of redshift-space power spectrum, it is possible to reliably constrain both the astrophysics and cosmology, with effects of RSDs and interloping lines properly included (see e.g., Gong et al., 2020, and references therein). Finally, even on linear scales, astrophysical processes other than what the star formation law encodes may also introduce scale-dependent bias that can further complicate the interpretation of observations, for either astrophysics or cosmology. Some examples of such large-scale modulations include feedback (Coles & Erdogdu, 2007), radiative transfer effects (Pontzen, 2014), and the impact of galaxy formation physics on halo occupation statistics (Angulo et al., 2014).
In summary, the BAO-induced scale-dependent bias associated with baryon fraction fluctuations provides a useful way to probe astrophysics such as the global star formation law of galaxies on cosmological scales. Our analysis shows that LIM promises to measure this effect and directly constrain the global star formation law power index , using large-number statistics in a huge cosmic volume rather than zoom-in analyses of individual galaxies. However, such measurements are challenging to make, typically requiring an immense number of modes to achieve a high sensitivity to the BAO amplitudes, which is beyond the capability current-generation surveys like SPHEREx. Future all-sky LIM surveys reaching similar depth but with times better spectral resolving power than SPHEREx will be capable of measuring at high significance with BAO intensity mapping. Beyond performing stringent tests on the standard cosmological model, results from such surveys will examine in detail the galaxy evolution theory against the backdrop of large-scale structure formation.
References
- Angulo et al. (2013) Angulo, R. E., Hahn, O., & Abel, T. 2013, MNRAS, 434, 1756, doi: 10.1093/mnras/stt1135
- Angulo et al. (2014) Angulo, R. E., White, S. D. M., Springel, V., & Henriques, B. 2014, MNRAS, 442, 2131, doi: 10.1093/mnras/stu905
- Barkana & Loeb (2011) Barkana, R., & Loeb, A. 2011, MNRAS, 415, 3113, doi: 10.1111/j.1365-2966.2011.18922.x
- Behroozi et al. (2019) Behroozi, P., Wechsler, R. H., Hearin, A. P., & Conroy, C. 2019, MNRAS, 488, 3143, doi: 10.1093/mnras/stz1182
- Bernal et al. (2019) Bernal, J. L., Breysse, P. C., & Kovetz, E. D. 2019, Phys. Rev. Lett., 123, 251301, doi: 10.1103/PhysRevLett.123.251301
- Breysse & Alexandroff (2019) Breysse, P. C., & Alexandroff, R. M. 2019, MNRAS, 490, 260, doi: 10.1093/mnras/stz2534
- Casey et al. (2014) Casey, C. M., Narayanan, D., & Cooray, A. 2014, Phys. Rep., 541, 45, doi: 10.1016/j.physrep.2014.02.009
- Chabrier (2003) Chabrier, G. 2003, PASP, 115, 763, doi: 10.1086/376392
- Chang et al. (2019) Chang, T.-C., Beane, A., Dore, O., et al. 2019, BAAS, 51, 282. https://arxiv.org/abs/1903.11744
- Chung (2022) Chung, D. T. 2022, arXiv e-prints, arXiv:2203.12581. https://arxiv.org/abs/2203.12581
- Coles & Erdogdu (2007) Coles, P., & Erdogdu, P. 2007, J. Cosmology Astropart. Phys, 2007, 007, doi: 10.1088/1475-7516/2007/10/007
- Cooray et al. (2019) Cooray, A., Chang, T.-C., Unwin, S., et al. 2019, in Bulletin of the American Astronomical Society, Vol. 51, 23. https://arxiv.org/abs/1903.03144
- Daddi et al. (2010) Daddi, E., Elbaz, D., Walter, F., et al. 2010, ApJ, 714, L118, doi: 10.1088/2041-8205/714/1/L118
- de los Reyes & Kennicutt (2019) de los Reyes, M. A. C., & Kennicutt, Robert C., J. 2019, ApJ, 872, 16, doi: 10.3847/1538-4357/aafa82
- Dekel et al. (2019) Dekel, A., Sarkar, K. C., Jiang, F., et al. 2019, MNRAS, 488, 4753, doi: 10.1093/mnras/stz1919
- Doré et al. (2014) Doré, O., Bock, J., Ashby, M., et al. 2014, arXiv e-prints, arXiv:1412.4872. https://arxiv.org/abs/1412.4872
- Eisenstein (2005) Eisenstein, D. J. 2005, New A Rev., 49, 360, doi: 10.1016/j.newar.2005.08.005
- Faucher-Giguère et al. (2013) Faucher-Giguère, C.-A., Quataert, E., & Hopkins, P. F. 2013, MNRAS, 433, 1970, doi: 10.1093/mnras/stt866
- Gong et al. (2020) Gong, Y., Chen, X., & Cooray, A. 2020, ApJ, 894, 152, doi: 10.3847/1538-4357/ab87a0
- Gong et al. (2017) Gong, Y., Cooray, A., Silva, M. B., et al. 2017, ApJ, 835, 273, doi: 10.3847/1538-4357/835/2/273
- Karkare & Bird (2018) Karkare, K. S., & Bird, S. 2018, Phys. Rev. D, 98, 043529, doi: 10.1103/PhysRevD.98.043529
- Kennicutt (1998) Kennicutt, Robert C., J. 1998, ApJ, 498, 541, doi: 10.1086/305588
- Kennicutt & De Los Reyes (2021) Kennicutt, Robert C., J., & De Los Reyes, M. A. C. 2021, ApJ, 908, 61, doi: 10.3847/1538-4357/abd3a2
- Kovetz et al. (2019) Kovetz, E., Breysse, P. C., Lidz, A., et al. 2019, BAAS, 51, 101. https://arxiv.org/abs/1903.04496
- Krumholz et al. (2012) Krumholz, M. R., Dekel, A., & McKee, C. F. 2012, ApJ, 745, 69, doi: 10.1088/0004-637X/745/1/69
- Lewis et al. (2000) Lewis, A., Challinor, A., & Lasenby, A. 2000, ApJ, 538, 473, doi: 10.1086/309179
- Liu et al. (2015) Liu, L., Gao, Y., & Greve, T. R. 2015, ApJ, 805, 31, doi: 10.1088/0004-637X/805/1/31
- Liu & Breysse (2021) Liu, R. H., & Breysse, P. C. 2021, Phys. Rev. D, 103, 063520, doi: 10.1103/PhysRevD.103.063520
- Ly et al. (2007) Ly, C., Malkan, M. A., Kashikawa, N., et al. 2007, ApJ, 657, 738, doi: 10.1086/510828
- Maniyar et al. (2022) Maniyar, A. S., Schaan, E., & Pullen, A. R. 2022, Phys. Rev. D, 105, 083509, doi: 10.1103/PhysRevD.105.083509
- Mas-Ribas & Chang (2020) Mas-Ribas, L., & Chang, T.-C. 2020, Phys. Rev. D, 101, 083032, doi: 10.1103/PhysRevD.101.083032
- Moradinezhad Dizgah et al. (2022) Moradinezhad Dizgah, A., Keating, G. K., Karkare, K. S., Crites, A., & Choudhury, S. R. 2022, ApJ, 926, 137, doi: 10.3847/1538-4357/ac3edd
- Naoz et al. (2011) Naoz, S., Yoshida, N., & Barkana, R. 2011, MNRAS, 416, 232, doi: 10.1111/j.1365-2966.2011.19025.x
- Parsons et al. (2021) Parsons, J., Mas-Ribas, L., Sun, G., et al. 2021, arXiv e-prints, arXiv:2112.06407. https://arxiv.org/abs/2112.06407
- Planck Collaboration et al. (2016) Planck Collaboration, Ade, P. A. R., Aghanim, N., et al. 2016, A&A, 594, A13, doi: 10.1051/0004-6361/201525830
- Pontzen (2014) Pontzen, A. 2014, Phys. Rev. D, 89, 083010, doi: 10.1103/PhysRevD.89.083010
- Santini et al. (2014) Santini, P., Maiolino, R., Magnelli, B., et al. 2014, A&A, 562, A30, doi: 10.1051/0004-6361/201322835
- Schaan & White (2021) Schaan, E., & White, M. 2021, J. Cosmology Astropart. Phys, 2021, 068, doi: 10.1088/1475-7516/2021/05/068
- Schmidt (2016) Schmidt, F. 2016, Phys. Rev. D, 94, 063508, doi: 10.1103/PhysRevD.94.063508
- Sitwell et al. (2014) Sitwell, M., Mesinger, A., Ma, Y.-Z., & Sigurdson, K. 2014, MNRAS, 438, 2664, doi: 10.1093/mnras/stt2392
- Soumagnac et al. (2016) Soumagnac, M. T., Barkana, R., Sabiu, C. G., et al. 2016, Phys. Rev. Lett., 116, 201302, doi: 10.1103/PhysRevLett.116.201302
- Soumagnac et al. (2019) Soumagnac, M. T., Sabiu, C. G., Barkana, R., & Yoo, J. 2019, MNRAS, 485, 1248, doi: 10.1093/mnras/stz240
- Sun et al. (2019) Sun, G., Hensley, B. S., Chang, T.-C., Doré, O., & Serra, P. 2019, ApJ, 887, 142, doi: 10.3847/1538-4357/ab55df
- Sun et al. (2021) Sun, G., Mirocha, J., Mebane, R. H., & Furlanetto, S. R. 2021, MNRAS, 508, 1954, doi: 10.1093/mnras/stab2697
- Tinker et al. (2008) Tinker, J., Kravtsov, A. V., Klypin, A., et al. 2008, ApJ, 688, 709, doi: 10.1086/591439
- Villa-Vélez et al. (2021) Villa-Vélez, J. A., Buat, V., Theulé, P., Boquien, M., & Burgarella, D. 2021, A&A, 654, A153, doi: 10.1051/0004-6361/202140890
- Visbal & Loeb (2010) Visbal, E., & Loeb, A. 2010, J. Cosmology Astropart. Phys, 2010, 016, doi: 10.1088/1475-7516/2010/11/016
- Wolz et al. (2017) Wolz, L., Blake, C., & Wyithe, J. S. B. 2017, MNRAS, 470, 3220, doi: 10.1093/mnras/stx1388