No correlation of the Lyman continuum escape fraction with spectral hardness
The properties that govern the production and escape of hydrogen-ionizing photons (Lyman continuum, LyC; with energies ¿13.6 eV) in star-forming galaxies are still poorly understood, but they are key to identifying and characterizing the sources that reionized the Universe. Here we empirically explore the relation between the hardness of ionizing radiation and the LyC leakage in a large sample of low- star-forming galaxies from the recent Hubble Space Telescope Low- Lyman Continuum Survey. Using Sloan Digital Sky Survey stacks and deep XShooter observations, we investigate the hardness of the ionizing spectra () between 54.4 eV (He+) and 13.6 eV (H) from the optical recombination lines He ii 4686Å and H 4861Å for galaxies with LyC escape fractions spanning a wide range, . We find that the observed intensity of He ii/H is primarily driven by variations in the metallicity, but is not correlated with LyC leakage. Both very strong (¡¿ ) and nonleakers (¡¿ ) present similar observed intensities of He ii and H at comparable metallicity, between and for and , respectively. Our results demonstrate that does not correlate with , which implies that strong LyC emitters do not show harder ionizing spectra than nonleakers at similar metallicity.
Key Words.:
Galaxies: starburst – Galaxies: high-redshift – Cosmology: dark ages, reionization, first stars1 Introduction
Numerous studies of star-forming galaxies at have shown differences with low- galaxies in the Sloan Digital Sky Survey (SDSS), based on shifts in the classical, optical BPT emission-line diagrams toward higher excitation in the nebular gas phase (see the review of Kewley et al., 2019, and references therein). Such shifts can be due to different physical effects causing harder ionizing spectra of their stellar populations (e.g., lower metallicities, younger ages), interstellar medium (ISM) properties (higher ionization parameter, different gas pressure and/or density), -element enhancements, selection effects, or others (cf. Steidel et al., 2016; Kewley et al., 2019; Izotov et al., 2021a).
Possibly larger differences have been observed in rest-UV spectra of distant galaxies, where strong nebular emission from C iv 1550 and He ii 1640 has been found (e.g., Stark et al., 2015; Mainali et al., 2017; Vanzella et al., 2021). These lines have also been detected in confirmed or suspected Lyman-continuum (LyC) emitters at (see Vanzella et al., 2018, 2020; Naidu et al., 2022). These observations suggest hard ionizing spectra in particular because C iv and He ii probe energies above 47.8 and 54.5 eV, respectively, and are thus sensitive to higher-energy radiation than the classical strong optical emission lines of [O iii], [O ii], [N ii], and [S ii] (e.g., Kewley et al., 2019; Feltre et al., 2016).
Nebular He ii emission provides the best measure of the hardness of the ionizing radiation field because its recombination lines111The strongest and most commonly detected lines are He ii 1640 and He ii 4686. are basically direct photons counters for energies eV, whereas the forbidden metal lines depend on many parameters (ionization parameter and others). Naidu et al. (2022) stacked rest-UV spectra of Ly emitters (LAEs) at for which they estimated LyC escape fractions using indirect methods, finding narrow He ii 1640, C iv 1550, and other lines in sources with high LyC escape, whereas low escape sources only show C iii] and O iii] emission. Based on this, they suggested a possible relation between the hardness of the ionizing spectra and LyC escape. He ii is also seen in the stacks of the LyC candidates of Marchi et al. (2018) selected as Lyman break galaxies (LBGs), although the poor resolution makes it difficult to exclude a significant contribution from stellar emission. Moreover, nebular He ii emission has not been reported in the LBG stacked LyC emitter spectra of Steidel et al. (2018). These findings call for a clarification of the possible link between LyC escape, nebular He ii emission, and the hardness of the radiation between energies 13.6 and 54 eV.
At low redshift, Jaskot & Oey (2013) have examined how hard ionizing radiation can influence emission line diagnostics of the optical depth of LyC radiation in green pea galaxies, a class of strong emission line galaxies now known to contain LyC emitters. Schaerer et al. (2022) have recently discovered intense C iv and He ii 1640 emission lines in three low- strong LyC emitters, (), with UV properties similar to the high- galaxies mentioned above. They proposed that strong C iv 1550 emission indicates high LyC escape fractions. Furthermore, they also estimated that strong LyC leakers do not have harder ionizing spectra than nonleakers, and that the presence of strong C iv and He ii in the spectra of LyC leakers could be primarily due to a high ionizing photon production (Schaerer et al., 2022).
On the other hand, Pérez-Montero et al. (2020) suggested that the observed He ii 4686 emission in metal-poor low- galaxies could be explained by significant photon leakage, without the need for additional sources of hard ionizing photons, while it is generally accepted that normal stellar populations cannot produce sufficient photons above 54 eV (see, e.g., Stasińska et al., 2015; Schaerer et al., 2019; Olivier et al., 2021; Simmonds et al., 2021). These results again call for a systematic approach to determine whether LyC emitting galaxies show a different He+-ionizing radiation than comparable galaxies with negligible Lyman continuum escape.
In this Letter we determine empirically and in a differential manner the hardness of the ionizing spectra between 54.4 and 13.6 eV (i.e., the ionization potential of He+ and that of H) as a function of the LyC escape fraction for the first time. To achieve this goal, we use the data from 89 low-redshift star-forming galaxies for which Lyman continuum and nonionizing UV spectra are available from the recent Hubble Space Telescope (HST) Low- Lyman Continuum Survey and other observations (see Sect. 2). Using optical spectra and stacking, we determine the hardness of ionizing radiation field from the optical recombination lines He ii 4686 and H in a straightforward manner, in contrast to methods using forbidden optical lines and to methods relying on UV emission lines. Our first constraints on the hardness of LyC emitters and a control sample thus contribute to a better knowledge of the analogue sources of cosmic reionization, their ionizing radiation field and ISM.
2 Observations
2.1 Lyman continuum and UV observations
We used the recent LzLCS, which consists of 66 star-forming galaxies at (Flury et al., 2022a, b; Saldana-Lopez et al., 2022) and 23 additional sources previously studied by Izotov et al. (2016b, c, 2018a, 2021b) and Wang et al. (2019). This unique dataset includes 37 LyC emitters detected with high signal-to-noise ratio (S/N¿3), with escape fractions spanning a wide range ( 1–90 %), and strong upper limits for the remaining sources. The galaxies span a wide range of physical properties with stellar masses , star formation rates SFR yr-1, and nebular abundances , derived using the direct method (Flury et al., 2022a).
2.2 SDSS optical spectra
Optical spectra are available for all sources from SDSS and BOSS surveys (Eisenstein et al., 2011). We retrieved optical spectra from the SDSS Science Archive Server. SDSS spectra have a spectral resolution . The extinction curve of Fitzpatrick (1999) and the Galactic values from the dust maps of Green et al. (2018) were used to correct the reddening effect of the Galaxy. Flux measurements were derived using Gaussian profiles and the Python nonlinear least-squares function curve_fit and corresponding uncertainties using a Monte Carlo method. The Cardelli et al. (1989) reddening law () was adopted to correct for the internal extinction using the ratios of well-detected Balmer emission lines (following Izotov et al., 1994).
In the lines of interest in this work, H is detected with high significance in all galaxies, but not He ii, yielding limits of He ii/H on average, which are fairly above the typical intensities He ii/H found in other compact star-forming galaxies (e.g., Izotov et al., 2016a), including LyC emitters (Guseva et al., 2020). Therefore, we performed a stacking analysis of the SDSS spectra to improve the He ii/H limits.
| SDSS Bins | Denomination | Definition | N | He ii/H | |||
|---|---|---|---|---|---|---|---|
| (1) | (2) | (3) | (4) | (5) | (6) | (7) | (8) |
| very strong leakers | 8 | ||||||
| strong leakers | 13 | ||||||
| weak leakers | 29 | ||||||
| non-leakers | 39 | ||||||
| and metallicity | and ¡ 8.0 | 11 | |||||
| and | 6 | ||||||
| and ¿ 8.3 | 4 | ||||||
| and ¡ 8.0 | 9 | ||||||
| and | 15 | ||||||
| and ¿ 8.3 | 5 | ||||||
| and ¡ 8.0 | 6 | ||||||
| and | 22 | ||||||
| and ¿ 8.3 | 11 |
Notes. Columns (1), (2), and (3): Groups, denomination, and definition of each bin. Column (4): Number of sources in each bin. Columns (5) and (6): mean and 68% confidence intervals (bootstrap resampling) of and for each bin. Column (7): Observed He ii/H intensities. Column (8): Hardness of the ionizing spectra between 54.4 eV (He+) and 13.6 eV (H) following Eq. 1 and assuming . Upper limits refer to a limit.
We built two different groups of stacked spectra, one composed of bins in absolute LyC escape fraction, , and another one composed of bins in and . For the first group, we defined the four bins using determined from the UV analysis of Saldana-Lopez et al. (2022). For the second group, we built nine stack spectra considering three bins of and three bins of metallicity. Table 1 contains the definition of the bins and the main derived properties from the stacked spectra.
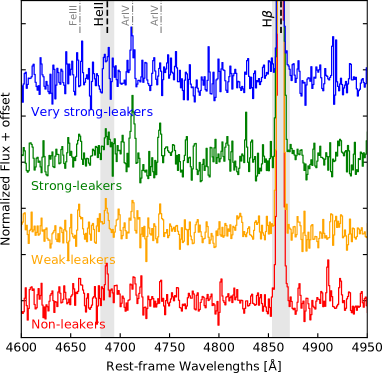
For each bin, the SDSS spectra were deredshifted using the systemic redshifts from the observed wavelengths of bright optical lines and were resampled using a linear interpolation onto a common wavelength grid. Next, we normalized the spectra at Å, that is, relatively free of emission or absorption features. Finally, we stacked all spectra by averaging the flux in each spectral bin. We also tested other stacking methods using the median and the weight-average using the uncertainty spectra, but no significant differences in the observed intensity of He ii/H were found between these three methods. Fig. 1 shows the four stacked spectra in bins of . He ii is detected at least in three stacks, together with other faint lines, such as [Fe iii] 4658Å and the [Ar iv] doublet at 4711Å and 4740Å. We note the lack of significant broad emission in the stacks around 4650Å and 5808Å, which might be associated with a significant contribution of Wolf-Rayet stars (e.g., Brinchmann et al., 2008).
2.3 XShooter/VLT observations
Spectroscopic observations of eight LzLCS sources were carried out during 2021 with the XShooter instrument on the Very Large Telescope (VLT), with total integration times of 50-100 min. The XShooter spectra were reduced in a standard manner using the ESO Reflex reduction pipeline (version 2.11.5; Freudling et al. 2013) to produce flux-calibrated spectra. The Galaxy and internal reddening were corrected using the same method as described in Section 2.2. We also used the measurements for five other LyC emitters observed with XShooter by Guseva et al. (2020). In total, He ii is detected in nine sources at ¿, with intrinsic He ii/H. For the remaining four sources, upper limits between and are inferred.
3 Results and discussion
3.1 HeII/H versus escape of LyC photons
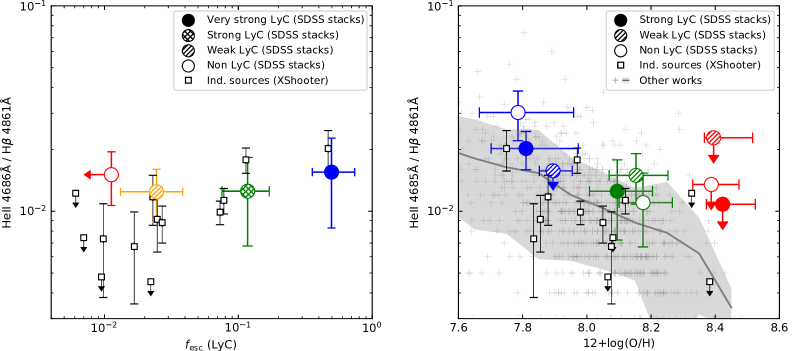
The main result of our study is presented in the left panel of Fig. 2, which shows the relation between the observed He ii/H ratio and the observed LyC escape fraction . Overall, we find no significant dependence of the He ii/H intensity on from the SDSS stacks.
To quantify this, we computed Kendall’s- correlation coefficient between these two variables following Akritas & Siebert (1996), which allows the inclusion of upper limits. Using the results from SDSS stacks, we find (-, uncertainties derived using a Monte Carlo method), which is basically consistent with a null correlation within our uncertainties. On the other hand, using the results from the 13 individual sources with deep XShooter spectra, we find a positive correlation with (-). However, these results are statistically less meaningful than those obtained with SDSS stacks using the average properties of 89 sources that also include the XShooter sources. In addition, the underlying effect of on He ii/H has not been considered so far.
The intensity of He ii/H of star-forming galaxies is known to vary with metallicity in that it increases with decreasing of (e.g., Brinchmann et al., 2008; Shirazi & Brinchmann, 2012; Schaerer et al., 2019). As our sample spans a wide range of metallicities, (Flury et al., 2022a), this behavior should be considered in our analysis. Therefore, we used nine SDSS stacks grouped in three bins of and three bins of (see Table 1 for details).
The right panel of Fig. 2 shows the relation between He ii/H and for strong LyC leakers (solid circles) and non- or weak LyC leakers (empty and dashed circles) in the metallicity bins. For comparison, we also show the observed intensities of He ii/H and metallicities of a compilation of almost 900 star-forming galaxies from SDSS DR14 (pluses; Izotov et al., 2016a), for which the [O iii] 4363Å line is detected with an accuracy better than 4, allowing thus direct abundance determinations using the method. The overall properties of the parent sample are discussed in Guseva et al. (2019).
Two main conclusions can be drawn from the right panel of Fig. 2. First, strong LyC leakers present roughly the same He ii/H intensities as non- or weak leakers at comparable metallicities. For instance, strong He ii/H intensities are found for both nonleakers and strong LyC leakers in the low-metallicity bin (He ii/H and , respectively), while sources with show He ii/H , independently of . Moreover, for a specific range of , the line intensities He ii/H inferred for strong leakers do not differ from those typically observed in other star-forming galaxies (Izotov et al., 2016a). Second, low-metallicity star-forming galaxies present stronger He ii/H than high-metallicity galaxies. This trend has been reported in other works of increasing the He ii/H intensity with decreasing metallicity. The same trend is seen in the individual sources with XShooter observations, where we find an anticorrelation between He ii/H and metallicity of (-). For example, the two XShooter sources with the highest He ii/H ratios () present ¡8.0, while the sources that are not detected in He ii all have ¿8.0. This behavior explains the positive correlation between He ii/H and seen in the individual sources with deep XShooter spectra (Fig. 2, left).
3.2 No variation in hardness with LyC escape
The hardness of the ionizing radiation field between energies above 54.4 and 13.6 eV, described by , is to first order related to the relative recombination line intensities by
| (1) | ||||
where expresses the number of ionizing photons emitted above the corresponding ionization potential, and relates the recombination rate to the line intensity (Osterbrock & Ferland, 2006). For we have adopted typical values of the electron temperature ( kK). The above expression also accounts for the escape of ionizing photons, which are a priori different for He+ and H-ionizing photons. It is expected that because the doubly ionized He region is generally significantly smaller than the H ii region, or in other words, He+-ionizing photons are absorbed much closer to the source than those of lower energy. Except possibly for extremely hard, power-law-like ionizing spectra, is therefore expected to be very low, or at least lower than .
We have shown that the intensity of He ii/H does not depend on and is primarily driven by variations with metallicity. Therefore, Eq. 1 implies that the hardness does not correlate with the LyC escape, since, if anything, He ii/H should increase with increasing even for constant (see Eq. 1). Table 1 provides the inferred values of for all the stacks using Eq. 1 and assuming . No variation is found in between strong and nonleakers within the uncertainties.
3.3 Implications
Our results rule out LyC leakage to explain the origin of nebular He ii emission put forward by Pérez-Montero et al. (2020). Their galaxies present roughly the same He ii/H intensities at comparable metallicity as those studied in our work (see their Figure 1). According to these authors, the observed intensities of He ii could be explained by density-bounded H ii regions with very highly ionizing photon leaking, with a mean for the entire sample. Clearly, the results shown in Fig. 2 contradict this scenario, where the same intensities of He ii/H are found in sources with both very high and very low , that is, without any dependence on . Furthermore, the invoked mean is significantly higher than measured in comparable low- galaxies (Flury et al., 2022a, b), and for the strongest known low- leaker (J12434646 with reported by Izotov et al. (2018b), or inferred in Saldana-Lopez et al. (2022)), we measure He ii/H (2), which is not exceptionally high compared to many other star-forming galaxies with similar metallicity ( , cf. Fig. 2, right panel). Other mechanisms or sources are needed to explain the origin of nebular He ii (see, e.g., Olivier et al., 2021; Simmonds et al., 2021, and references therein).
At , Naidu et al. (2022) recently identified two groups of LAEs, one probably showing strong LyC escape, and the other low LyC escape fractions. Comparing the stacked spectra of these two groups, they found differences in their observed rest-frame UV spectra, with the strong leaker candidates showing high-ionization lines of C iv 1550Å and He ii 1640Å, and the other group showing only lower-ionization lines (e.g., C iii 1909Å). From this finding, Naidu et al. (2022) suggested that strong LyC leakers could have harder ionizing spectra. On the other hand, if the galaxies studied in our work are comparable to high- LAEs, our results imply that these observed differences are not related to LyC escape.
Generally speaking, the absence of hardness variations with shows that this property of the global radiation field does not determine the conditions for the ionizing photon escape. In contrast, other studies have found significant correlations between different physical properties and , which might indicate such physical processes. This includes highly concentrated star formation (high SFR surface densities), a high ionization parameter, an inhomogeneous ISM and dust distribution, and low amounts of dust (Verhamme et al., 2017; Gazagnes et al., 2018; Cen, 2020; Flury et al., 2022b; Saldana-Lopez et al., 2022). Our finding does not exclude that radiative processes contribute to determining LyC escape, but it indicates that the hardness of the radiation field (over the energy range measured here) is not fundamental. For example, this suggests that LyC escape is not related to low-luminosity active galactic nuclei (AGNs). However, our differential study does not explain the origin of nebular He ii emission, which is known to require sources of ionizing photons above 54 eV in amounts that are not predicted for normal stellar populations (see, e.g., Shirazi & Brinchmann, 2012; Stasińska et al., 2015; Schaerer et al., 2019).
4 Summary
We have empirically investigated the hardness of the ionizing spectra between 54.4 and 13.6 eV (, i.e., the ionization potential of He+ and that of H) as a function of the LyC escape fraction, , of a large sample of star-forming galaxies at low redshift for which LyC are available from HST observations. Optical recombination lines of He ii 4686Å and H 4861Å from SDSS and XShooter spectra were used to determine and its dependence on . The underlying effect of metallicity was also considered.
We built stacked spectra in bins of and metallicity, allowing us to study the behavior of He ii/H across a wide range of and . We find that the intensity of He ii/H does not depend on . Very strong leakers (¡¿ ) and nonleakers (¡¿ ) have similar intensities of He ii/H on average, about He ii/H . Instead, we find that He ii/H is primarily driven by variations in metallicity, where He ii/H increases with decreasing , in particular, for , as known from previous studies (e.g., Shirazi & Brinchmann, 2012; Schaerer et al., 2019). At comparable metallicities, strong LyC leakers present roughly the same He ii/H intensities as non- or weak leakers and as in many other normal star-forming galaxies, where nebular He ii is detected.
In short, our results demonstrate that does not correlate with . This implies that strong LyC emitters do not show harder ionizing spectra than nonleakers at similar metallicity. Future studies will address other hardness or softness indicators of the radiation field and will more broadly examine the nebular properties of the galaxies from the LzLCs.
Acknowledgements.
The authors thank the referee for useful comments that greatly improved the clarity of this work. Y.I.I. acknowledges support from the National Academy of Sciences of Ukraine by its priority project “Fundamental properties of the matter in the microworld, astrophysics and cosmology”. R.A. acknowledges support from ANID Fondecyt Regular Grant 1202007. Funding for the Sloan Digital Sky Survey IV has been provided by the Alfred P. Sloan Foundation, the U.S. Department of Energy Office of Science, and the Participating Institutions. SDSS-IV acknowledges support and resources from the Center for High Performance Computing at the University of Utah. The SDSS website is www.sdss.org.References
- Akritas & Siebert (1996) Akritas, M. G. & Siebert, J. 1996, MNRAS, 278, 919
- Brinchmann et al. (2008) Brinchmann, J., Kunth, D., & Durret, F. 2008, A&A, 485, 657
- Cardelli et al. (1989) Cardelli, J. A., Clayton, G. C., & Mathis, J. S. 1989, ApJ, 345, 245
- Cen (2020) Cen, R. 2020, ApJ, 889, L22
- Eisenstein et al. (2011) Eisenstein, D. J., Weinberg, D. H., Agol, E., et al. 2011, AJ, 142, 72
- Feltre et al. (2016) Feltre, A., Charlot, S., & Gutkin, J. 2016, MNRAS, 456, 3354
- Fitzpatrick (1999) Fitzpatrick, E. L. 1999, PASP, 111, 63
- Flury et al. (2022a) Flury, S. R., Jaskot, A. E., Ferguson, H. C., et al. 2022a, ApJS, 260, 1
- Flury et al. (2022b) Flury, S. R., Jaskot, A. E., Ferguson, H. C., et al. 2022b, ApJ, 930, 126
- Freudling et al. (2013) Freudling, W., Romaniello, M., Bramich, D. M., et al. 2013, A&A, 559, A96
- Gazagnes et al. (2018) Gazagnes, S., Chisholm, J., Schaerer, D., et al. 2018, A&A, 616, A29
- Green et al. (2018) Green, G. M., Schlafly, E. F., Finkbeiner, D., et al. 2018, MNRAS, 478, 651
- Guseva et al. (2019) Guseva, N. G., Izotov, Y. I., Fricke, K. J., & Henkel, C. 2019, A&A, 624, A21
- Guseva et al. (2020) Guseva, N. G., Izotov, Y. I., Schaerer, D., et al. 2020, MNRAS, 497, 4293
- Izotov et al. (2016a) Izotov, Y. I., Guseva, N. G., Fricke, K. J., & Henkel, C. 2016a, MNRAS, 462, 4427
- Izotov et al. (2021a) Izotov, Y. I., Guseva, N. G., Fricke, K. J., et al. 2021a, A&A, 646, A138
- Izotov et al. (2016b) Izotov, Y. I., Orlitová, I., Schaerer, D., et al. 2016b, Nature, 529, 178
- Izotov et al. (2016c) Izotov, Y. I., Schaerer, D., Thuan, T. X., et al. 2016c, MNRAS, 461, 3683
- Izotov et al. (2018a) Izotov, Y. I., Schaerer, D., Worseck, G., et al. 2018a, MNRAS, 474, 4514
- Izotov et al. (1994) Izotov, Y. I., Thuan, T. X., & Lipovetsky, V. A. 1994, ApJ, 435, 647
- Izotov et al. (2021b) Izotov, Y. I., Worseck, G., Schaerer, D., et al. 2021b, MNRAS, 503, 1734
- Izotov et al. (2018b) Izotov, Y. I., Worseck, G., Schaerer, D., et al. 2018b, MNRAS, 478, 4851
- Jaskot & Oey (2013) Jaskot, A. E. & Oey, M. S. 2013, ApJ, 766, 91
- Kewley et al. (2019) Kewley, L. J., Nicholls, D. C., & Sutherland, R. S. 2019, Annual Review of Astronomy and Astrophysics, 57, 511
- Mainali et al. (2017) Mainali, R., Kollmeier, J. A., Stark, D. P., et al. 2017, ApJ, 836, L14
- Marchi et al. (2018) Marchi, F., Pentericci, L., Guaita, L., et al. 2018, A&A, 614, A11
- Naidu et al. (2022) Naidu, R. P., Matthee, J., Oesch, P. A., et al. 2022, MNRAS, 510, 4582
- Olivier et al. (2021) Olivier, G. M., Berg, D. A., Chisholm, J., et al. 2021, arXiv e-prints, arXiv:2109.06725
- Osterbrock & Ferland (2006) Osterbrock, D. E. & Ferland, G. J. 2006, Astrophysics of gaseous nebulae and active galactic nuclei
- Pérez-Montero et al. (2020) Pérez-Montero, E., Kehrig, C., Vílchez, J. M., et al. 2020, A&A, 643, A80
- Saldana-Lopez et al. (2022) Saldana-Lopez, A., Schaerer, D., Chisholm, J., et al. 2022, arXiv e-prints, arXiv:2201.11800
- Schaerer et al. (2019) Schaerer, D., Fragos, T., & Izotov, Y. I. 2019, A&A, 622, L10
- Schaerer et al. (2022) Schaerer, D., Izotov, Y. I., Worseck, G., et al. 2022, A&A, 658, L11
- Shirazi & Brinchmann (2012) Shirazi, M. & Brinchmann, J. 2012, MNRAS, 421, 1043
- Simmonds et al. (2021) Simmonds, C., Schaerer, D., & Verhamme, A. 2021, A&A, 656, A127
- Stark et al. (2015) Stark, D. P., Walth, G., Charlot, S., et al. 2015, MNRAS, 454, 1393
- Stasińska et al. (2015) Stasińska, G., Izotov, Y., Morisset, C., & Guseva, N. 2015, A&A, 576, A83
- Steidel et al. (2018) Steidel, C. C., Bogosavljević, M., Shapley, A. E., et al. 2018, ApJ, 869, 123
- Steidel et al. (2016) Steidel, C. C., Strom, A. L., Pettini, M., et al. 2016, ApJ, 826, 159
- Vanzella et al. (2020) Vanzella, E., Caminha, G. B., Calura, F., et al. 2020, MNRAS, 491, 1093
- Vanzella et al. (2021) Vanzella, E., Caminha, G. B., Rosati, P., et al. 2021, A&A, 646, A57
- Vanzella et al. (2018) Vanzella, E., Nonino, M., Cupani, G., et al. 2018, MNRAS, 476, L15
- Verhamme et al. (2017) Verhamme, A., Orlitová, I., Schaerer, D., et al. 2017, A&A, 597, A13
- Wang et al. (2019) Wang, B., Heckman, T. M., Leitherer, C., et al. 2019, ApJ, 885, 57