The properties of the X-ray corona in the distant () quasar APM 08279+5255
We present new joint XMM-Newton and NuSTAR observations of APM 08279+5255, a gravitationally-lensed, broad-absorption line quasar (). After showing a fairly stable flux () from 2000 to 2008, APM 08279 was found in a fainter state in the latest X-ray exposures (), which can likely be ascribed to a lower X-ray activity. Moreover, the 2019 data present a prominent Fe K emission line and do not show any significant absorption line. This fainter state, coupled to the first hard X-ray sampling of APM 08279+5255, allowed us to measure X-ray reflection and the high-energy cutoff in this source for the first time. From the analysis of previous XMM-Newton and Chandra observations, X-ray reflection is demonstrated to be a long-lasting feature of this source, but less prominent prior to 2008, possibly due to a stronger primary emission. The estimated high-energy cutoff ( keV) sets a new redshift record for the farthest ever measured and places APM 08279+5255 in the allowed region of the compactness-temperature diagram of X-ray coronae, in agreement with previous results on high- quasars.
Key Words.:
accretion, accretion disks – black hole physics – quasars: individual: APM 08279+5255 – quasars: absorption lines – quasars: supermassive black holes – X-rays: general1 Introduction
Observational efforts in the past three decades have demonstrated the validity of the two-phase model (Haardt & Maraschi 1991; Haardt et al. 1994) in describing the high-energy emission of Active Galactic Nuclei (AGN). Optical/UV disc photons are predicted to be Compton up-scattered by the electrons of the hot corona (), which surrounds the central supermassive black hole (SMBH). The ”Comptonization” process generates the cutoff-power-law-like spectrum measured in the X-rays, in which the cutoff energy is set by the temperature of the hot corona. At very hard energies, photon-photon collisions decay into electron-positron pairs which can, in turn, annihilate and produce energetic photons. Pair production can then become a runaway process acting as a natural thermostat for the corona. The conditions in which this takes place depend on a combination of corona temperature and radiative compactness (Cavaliere & Morrison 1980), as well as on the plasma optical depth (). In fact, Comptonization models of hot coronae with slab geometry predict a cutoff in the X-ray power law at for optically thin(thick) plasma (e.g., Petrucci et al. 2001). The typically employed quantities (Cavaliere & Morrison 1980; Guilbert et al. 1983) include the dimensionless temperature parameter:
| (1) |
with for an optically thin(thick) plasma, along with the dimensionless compactness parameter:
| (2) |
where and are electron mass and temperature, respectively, and are the luminosity and size of the X-ray source, respectively, is the Thomson scattering cross-section, and is the Boltzmann constant.
| Observation | ObsID | Date | Net Exposure (ks) | |
| XMM 101 | 0830480101 | 2019 Mar 24 | 24.1 | |
| Nu02 | 60401017002 | 2019 Apr 19 | 93.5 — 92.8 | |
| Nu04 | 60401017004 | 2019 Apr 22 | 59.7 — 59.2 | |
| XMM 301 | 0830480301 | 2019 Apr 23 | 24.5 — 28.2 — 25.7 |
In principle, by populating the diagram, it is possible to probe the mechanisms regulating the corona temperature and test the pair-production thermostat predictions. To that aim, broadband X-ray spectra of compact sources are needed to properly model the primary emission and, in particular, its high-energy cutoff. This was extensively done with hard X-ray observatories, such as BeppoSAX (e.g., Petrucci et al. 2001; Dadina 2007, 2008), INTEGRAL (e.g., Malizia et al. 2014), and Swift (e.g., Vasudevan et al. 2013; Koss et al. 2017). A real breakthrough in the study of X-ray coronae has arrived thanks to NuSTAR (Harrison et al. 2013), the first focusing hard X-ray telescope, which allowed for an improved estimation of the coronal temperature in nearby sources. By gathering literature results from both non-focusing instruments and NuSTAR, Fabian et al. (2015) built a compilation of measurements in both local AGN and black-hole binaries, finding many of their coronae to lie at the edge of the runaway pair-production region in the plane. Similar results were later obtained by Ricci et al. (2018) based on sources of the Swift/BAT AGN Spectroscopic Survey (BASS, Ricci et al. 2017). Interestingly, Ricci et al. (2018) also discovered a negative correlation between the average high-energy cutoff and Eddington ratio in BASS AGN, regardless of either luminosity or SMBH-mass selection.
With its wide hard X-ray bandpass, INTEGRAL allowed for detailed studies of the coronal high-energy cutoff in local AGN (e.g., Molina et al. 2009, 2013; de Rosa et al. 2012), many of which were later updated and confirmed by NuSTAR measurements. Nonetheless, NuSTAR can properly constrain the high-energy cutoff only if this falls in its bandpass or, otherwise, only in high count-rate sources. The outstanding results obtained by NuSTAR have thus been restricted to nearby AGN () with and (see, e.g., the recent work by Akylas & Georgantopoulos 2021), until recently, when Lanzuisi et al. (2019) (hereafter, L19) were able to probe the high-luminosity regime () through NuSTAR observations of high- AGN. L19 were the the first to proper constrain the high-energy cutoff of two AGN at (2MASSJ1614346+470420 at – hereafter, 2MASSJ16; B1422+231 at – hereafter B1422) using NuSTAR data, confirming the measurement for B1422 by Dadina et al. (2016) from XMM-Newton data. Both sources show rather low values () and fall in the limited allowed region for high-luminosity AGN of the plane. Interestingly, the measured values are much lower than those of BASS AGN showing similar Eddington ratios (, Ricci et al. 2018).
One of the most interesting high- quasars is APM 08279+5255 (, APM 08279 hereafter; Irwin et al. 1989). This broad-absorption line quasar is lensed in three images by an as-yet-undetected foreground galaxy, possibly set at (Ellison et al. 2004). Due to the lensing-system uncertainty, different models predict very different magnification values, ranging from (Riechers et al. 2009) to (Egami et al. 2000). Regardless of the actual magnification factor, APM 08279 is among the brightest high- AGN in many bands, with one of the best sampled high- spectral energy distributions (e.g., Stacey et al. 2018; Leung et al. 2019). In fact, APM 08279 is a very well known quasar in many astrophysical research fields and it lately became the first high- quasar whose SMBH mass was estimated via reverberation mapping of the Si IV and C IV emission lines (, Saturni et al. 2016). APM 08279 is also a very peculiar source for ultra-fast outflows (UFOs), namely, the X-ray winds that could be responsible for the generation of galaxy-wide outflows and thus for the establishment of the AGN-host-galaxy co-evolution (e.g., Faucher-Giguère & Quataert 2012; King & Pounds 2015; Costa et al. 2020). In fact, APM 08279 was the first high- source in which UFOs were detected (Chartas et al. 2002) and it was later found to host some of the fastest X-ray winds ever seen ( up to 0.76c, Chartas et al. 2009, hereafter C09). However, the most remarkable feature of APM 08279 is the double-velocity UFO present in all the observations up to early 2008 (C09; Saez et al. 2009), except for its first X-ray exposure (Hasinger et al. 2002, hereafter H02).
We present in this paper the first X-ray broadband analysis of APM 08279, making use of the latest XMM-Newton observations followed up by the first ever NuSTAR exposures of this source (2019, PI: G. Lanzuisi). The paper is organized as follows: reduction and analysis of 2019 observations are discussed in Sects. 2–3. Our results are then compared to previous Chandra and XMM-Newton observations, which we re-analyzed, in Sect. 4. We then place the observed X-ray corona properties in a broader context in Sect. 5. The scientific results are summarized in Sect. 6. We assume a flat CDM cosmology (Planck Collaboration et al. 2020), with and throughout the paper.
2 Data reduction
APM 08279 was observed by XMM-Newton on 2019 March 24 for 31.4 ks (hereafter, XMM 101). On that date, EPIC-MOS cameras failed, thus it was observed again on 2019 April 23 for additional 33.3 ks (hereafter, XMM 301). These exposures were followed up by NuSTAR on 2019 April 19 for 93.5 ks (hereafter, Nu02) and on 2019 April 22 for 59.7 ks (hereafter, Nu04). The observation log is shown in Table 1.
XMM-Newton data were reduced applying standard procedure and the latest calibration files through SAS v.18.0. The event files of EPIC-pn cameras were filtered at 1.2 and 1.0 counts per second in the 10–12 keV band, for XMM 101 and 301, respectively, while those of XMM 301 EPIC-MOS cameras were filtered at 0.3 counts per second, in the same band. EPIC-pn source spectra were extracted from circular regions of 25″radii for both XMM 101 and 301 (% encircled energy fraction); EPIC-MOS source spectra were extracted using 20″-radius circles (% encircled energy fraction). Background spectra were extracted from circular regions of 60″radii for each XMM-Newton camera. Wider source regions, coupled with different good-time-interval filtering thresholds and other background extraction regions, were tested. No significant improvement of the spectral signal-to-noise ratio (S/N) was yielded, therefore, we stuck to the filtering and spectra extraction setup just described (i.e., source regions encircling the PSF core).
NuSTAR observations were processed using the standard pipeline of NuSTAR Data Analysis Software package (NuSTARDAS) v.2.0.0 (within Heasoft v.6.28) and calibrated with NuSTAR CALDB v.20200813. No significant background flares are present in these observations – a fact that we checked through the IDL script nustar_filter_lightcurve222https://github.com/NuSTAR/nustar-idl. After testing different extraction regions to find the ones yielding the best S/N, we selected 40″-radius circles for the source (% encircled energy fraction). These were coupled to annular background regions, centered on the target, with inner(outer) radii of 110″(170″) to exclude the wings of the source PSF and sample the non-uniform local background. This extraction setup was used for both FPMA and FPMB in each observation. Unfortunately, APM 08279 turned out to be fainter than expected based on past observations (as described in Sect. 4). Thus, during these exposures, source spectra are background dominated above keV regardless of the reduction and spectra-extraction setup.
3 Spectral analysis of 2019 data
Having checked that no significant intra-observation flux variability is present, we fit the time-averaged spectra with Xspec v.12.11.1. EPIC-pn data belong to the high-statistics regime, whereas EPIC-MOS and NuSTAR spectra to the mid-to-low-statistics regime (600 and 300 net counts, respectively). We grouped our data to 1 count/bin and applied C-statistics (Cash 1979) because matching the requirements to use the statistics (at least 20 cts/bin) would have led to a loss in the energy resolution of NuSTAR and EPIC-MOS due to the coarse binning. Nevertheless, we also tested our models on spectra grouped at 20 cts/bin using statistics as a sanity check and found results consistent to those presented here.
XMM 301 and the two NuSTAR observations are almost simultaneous, while XMM 101 was taken 30 days before XMM 301. No significant spectral variability is present between the two XMM-Newton epochs333The ratio of the two EPIC-pn spectra shows no evident trend and is well consistent with being constant. . Thus, we fit spectra from the four epochs together by linking all parameters, if not said otherwise, letting cross-calibration constants free to vary. Throughout the paper, all models are modified by Galactic absorption (, HI4PI Collaboration et al. 2016) and errors and upper limits are given at 90% confidence level, unless otherwise stated.
3.1 Broadband X-ray spectra
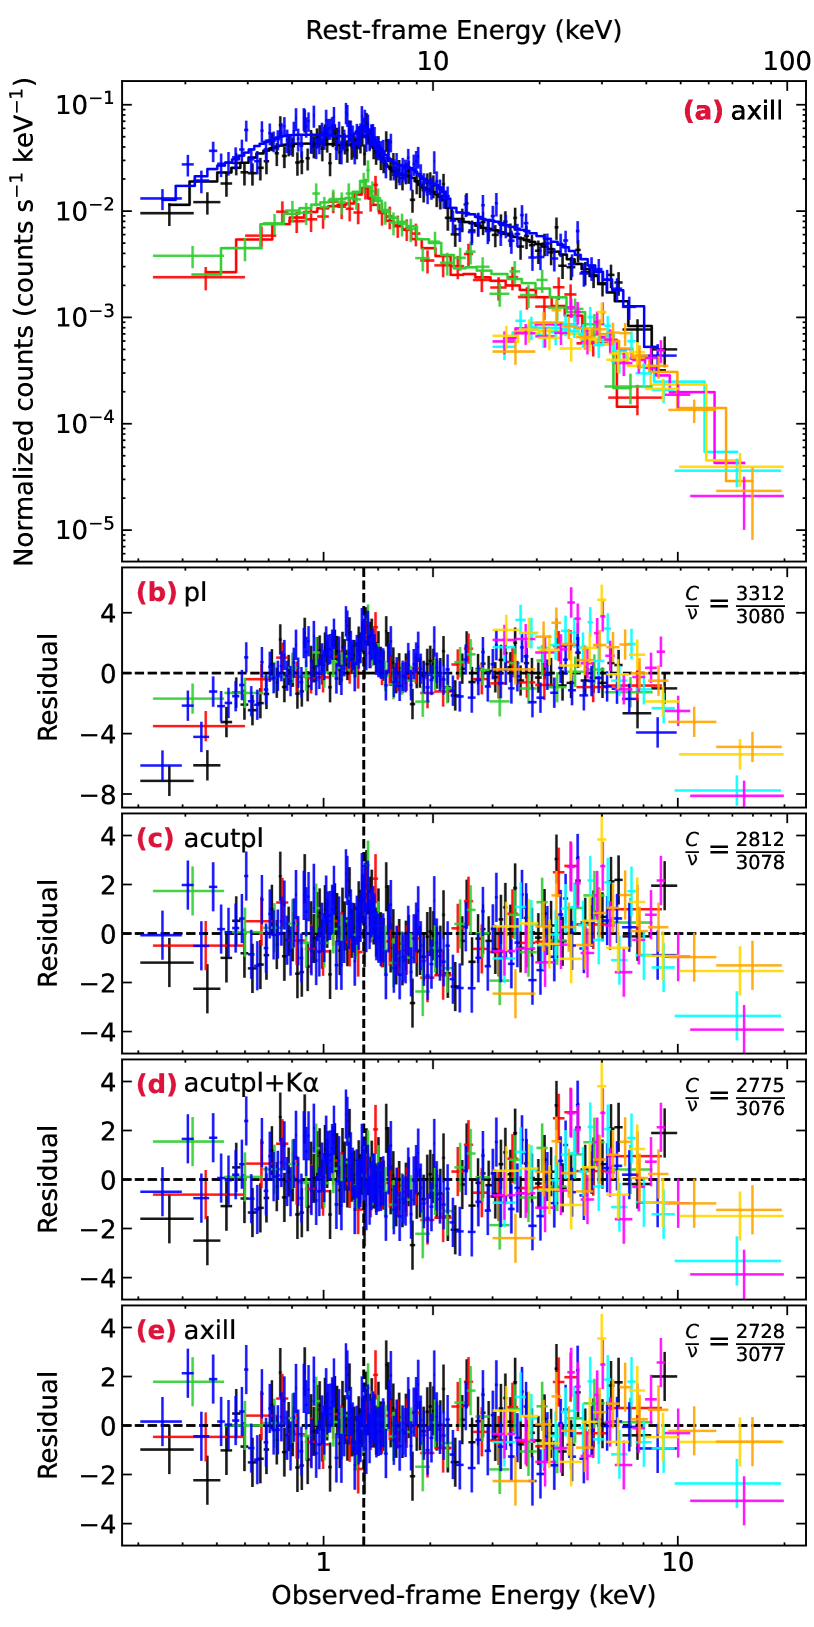
The joint fit of XMM-Newton and NuSTAR data allows us to model the broadband-band continuum of APM 08279 in the 0.3–20 keV observed-frame energy range (i.e., 1.5–98 keV rest-frame energy range). The spectra present a cutoff at hard energies and soft absorption in excess of the Galactic value, which are clearly visible in the residuals against a single power-law model (pl Model; see Fig. 1, panel (b)). In fact, a zphabs*zcutoffpl model (hereafter, acutpl model; Fig. 1, panel (c)) well reproduces both features in statistical terms, but yields a power law that is considerably harder () than expected values for an AGN (e.g., Vignali et al. 1999; Piconcelli et al. 2005; Just et al. 2007) and a very low high-energy cutoff (keV). Absorption in the soft band is due to a “cold” medium placed at the systemic redshift of the source, with a column density consistent with previous observations (\al@hasinger2002,chartas2009; \al@hasinger2002,chartas2009). For the rest of the analysis, our models include this additional absorption component. The data clearly present a prominent Fe K emission line, detected at keV ( keV) as a highly-significant () narrow line444The line width is visually resolved, but letting this parameter free to vary yields no statistical improvement (). Moreover, the best-fit line width is consistent with being narrow both based on its face value ( keV) and its 90% confidence range ( keV) in the rest frame. We thus set the rest-frame width of the Fe K line to keV. on top of an acutpl continuum in both XMM-Newton observations. Therefore, we tie the Fe K line component between the two epochs.
An acutpl+K model fails to fit the high-energy bump (Fig. 1, panel (d)) which, combined with the low photon index and high Fe K equivalent width (EW; rest-frame eV) can be evidence for X-ray reflection. We tested this scenario through the non-relativistic reflection model xillver, part of the relxill package (García et al. 2014; Dauser et al. 2014), which accounts for a direct cutoff power law and its reprocessed emission (continuum and self-consistent emission and absorption features) by a distant, (possibly ionized) medium. Reflection is parameterized through photon index ; high-energy cutoff, ; iron abundance (that we set to Solar); ionization of the disk, 555The ionization parameter is defined as , where is the X-ray luminosity of the incident radiation, is the gas density and is the distance from the ionizing source. ; inclination angle, i; and reflection fraction, , defined as the fraction relative to the reflected emission expected from a slab subtending a 2 solid angle. Low inclination angles return a better fit and are naturally preferred by the data when the parameter is set free to vary; however, the data statistics prevents us from actually constraining it, thus we set °. Similarly, we first leave the ionization of the disk free to vary and then freeze its value to its best fit (). By the inclusion of the reflection continuum (axill model), we find a better representation of our broadband spectra, both statistically ( for one additional parameter; see confidence contours in Fig. 2) and physically (see Table 2). The power-law photon index () agrees with typical values of high- sources (e.g., Vignali et al. 2005; Just et al. 2007) and so does the high-energy cutoff ( keV) with the few other measurements available at (Lanzuisi et al. 2016; Dadina et al. 2016; L19). The yielded reflection fraction () carries the information that the reflecting material is seeing a source primary emission that is much larger than the one reaching the observer. Two of the possible explanations for such a large value of are i) pc-scale reflection in which the primary source activity has dropped (and so has the direct emission seen by the observer), whereas the reflector is still illuminated by the echo of the previous stronger source emission due to the travel-time delay (e.g., Lanzuisi et al. 2016); ii) disc reflection in a lamp-post geometry where the corona height is low and thus light-bending is severe (e.g., Gandhi et al. 2007).
| Model | stat () | ||||||
| (1) | (2) | (3) | (4) | (5) | (6) | (7) | (8) |
| pl | – | – | – | – | – | 3312 (3080) | |
| acutpl | – | – | – | 2812 (3078) | |||
| acutpl+K | – | 2775 (3076) | |||||
| axill | – | – | 2728 (3077) |
3.2 Search for UFO imprints
With its persistent double-velocity component X-ray wind (C09), APM 08279 is a one-of-a-kind object for studying UFOs in high- AGN. However, 2019 data (see Fig. 1) appear not to show the prominent and broad features previously seen in this source. We thus searched our spectra only for narrow ( keV, rest-frame) emission and absorption features. We applied the blind method of Miniutti & Fabian (2006), as implemented in Cappi et al. (2009), over the energy range spanned by past UFO events in APM 08279 ( keV) using the axill best fit as baseline model, also including the NuSTAR spectra to correctly model the broadband continuum. We then tested our data including zgauss components where the blind search and the residuals to model axill (Fig. 1, panel (e)) showed hints of absorption lines.
XMM 301 presents no signs of emission or absorption features additional to those already included in xillver, while XMM 101 shows hints of a narrow absorption line at keV (/, rest-frame width set to keV). We ran Monte Carlo simulations (Protassov et al. 2002) to measure the real significance of the 11 keV line, by simulating broadband spectra from our axill best fit model (see Table 2) using the fakeit function of Xspec. By searching the simulated spectra for the detection of spurious emission and absorption lines, we built the posterior probability distribution of finding a real detection. Applying such a distribution to the line at 11.7 keV in XMM 101, we find that its significance is lower than the 90% confidence level. Thus, we find that no UFO features are present in the latest X-ray data of APM 08279.
4 X-ray reflection in previous observations
During 2019 exposures, APM 08279 turned out to be fainter than what was previously expected (see Fig. 3, upper panel, and Tables 1 and 3), and clearly showed X-ray reflection signatures for the first time. We thus collected all previous XMM-Newton and Chandra X-ray observations with the aim of answering the following questions: namely, whether X-ray reflection was already in place before 2019 and, thus, how that would relate to what was observed in 2019.
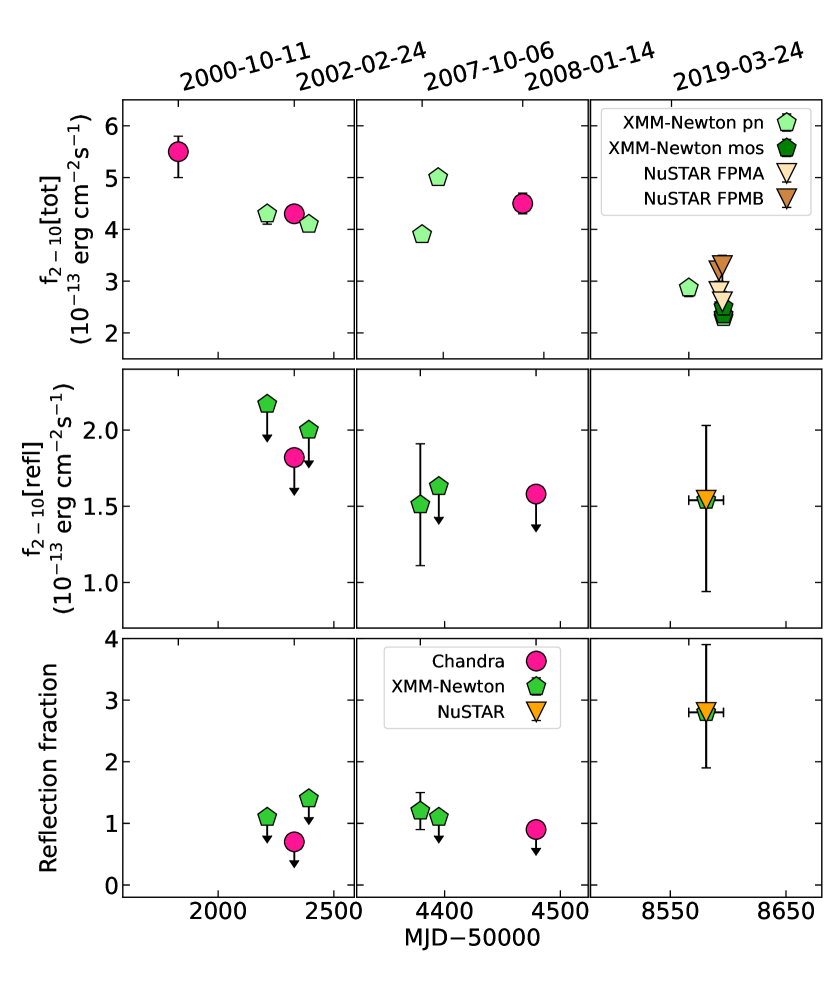
By referring to literature studies (\al@hasinger2002,chartas2009; \al@hasinger2002,chartas2009), we left out of the data sample the first Chandra exposure, the shortest one, because of the low count statistics. Table 3 summarizes the relevant information about archival observations, including the acronyms that we use to indicate them. We refer to H02 for the analysis of XMM1 and to C09 for the remaining five (CXO2, XMM2, XMM3, XMM4, CXO3). We reduced the selected Chandra (CXO2, CXO3) and XMM-Newton (XMM1, XMM2, XMM3, XMM4) archival exposures to uniformly apply the latest calibration files, filtering high-background intervals in XMM-Newton data using the same GTI thresholds of C09. The count statistics of these spectra is much higher than that of 2019 data, thanks to the higher flux of APM 08279 and to the longer exposures. Similarly to the approach of C09, spectra with more than cts were grouped to 100 cts/bin (EPIC-pn data of XMM2, XMM3, XMM4), while those with few cts to 20 cts/bin (XMM1 EPIC-pn, all EPIC-MOS and Chandra spectra). We thus applied statistics in the spectral analysis of past observations, jointly fitting EPIC-pn and -MOS spectra collected in the same epoch.
| Name | ObsID | Date | MJD | Total Exp. | Ref. | ||
| CXO1 | 1643 | 2000 Oct 11 | 51828 | 9.1 | a | – | |
| XMM1 | 0092800101 | 2001 Oct 30 | 52212 | 16.5 | a | ||
| CXO2 | 2979 | 2002 Feb 24 | 52329 | 88.8 | b | ||
| XMM2 | 0092800201 | 2002 Apr 28 | 52392 | 102.3 | a, b | ||
| XMM3 | 0502220201 | 2007 Oct 06 | 54379 | 89.6 | b | ||
| XMM4 | 0502220301 | 2007 Oct 22 | 54395 | 90.5 | b | ||
| CXO3 | 7684 | 2008 Jan 14 | 54479 | 88.1 | b |
To probe the X-ray reflection, we first drew on the best-fit models from the literature. H02 fit XMM1 data with an absorption edge, whereas C09 fit the spectra firstly using phenomenological models, where the UFOs are modeled only through their main absorption imprint, and secondly using Xstar analytical models (warmabs). Testing X-ray reflection while already accounting for UFOs through warmabs is a non-trivial exercise, so we selected the phenomenological representation of past data (Model 6, C09). We then tested the X-ray reflection by replacing the single power-law emission of literature phenomenological best-fit models with a xillver component (lit_xill model). We set the absorption-edge parameters in XMM1 to those reported by H02. Both energy and width of the UFO absorption lines are set to those presented in C09 and we leave their normalization free to vary. The lack of high-energy coverage in past observations prevents us from constraining the high-energy cutoff. We thus set it to the value measured in 2019 data ( keV), safely far from the high-energy end of Chandra and XMM-Newton spectra. We also set the reflection inclination angle to °, as done in Sect. 3.1, and assume a low-ionization reflecting medium as found for 2019 data ().
We investigated the evolution of the source emission through the epochs using three probes: i) the 2–10 keV observed-band total source flux, ii) the 2–10 keV observed-band flux of the reflection component only, and iii) the reflection fraction . To measure probe ii), we built a pure-reflection model using xillver with , setting its normalization to the best-fit value of the respective lit_xill model scaled by the measured reflection fraction. When is only constrained as an upper limit, we derived an upper limit to the 2–10 keV observed-band reflection flux. When is constrained (as is for XMM3 and 2019 data), we measured the reflection flux by scaling the normalization of the lit_xill model by the best fit value of . We then assigned as uncertainty the spread in flux obtained by scaling the normalization by the respective upper and lower 90% confidence level values of . Figure 3 shows the evolution of the three probes across the considered observing epochs. The source X-ray flux (upper panel) presents a factor of decrease between the period 2000–2008 and 2019 while, despite the many upper limits, the reflection flux (middle panel) is fully consistent with showing no trend across the years. The 2–10 keV observed-energy band corresponds to keV in the rest-frame, which is where X-ray reflection induces the so-called “reflection hump” and where flux suppression by absorption is strong only in Compton-thick AGN (e.g., Maiolino et al. 1998; Bassani et al. 1999; Matt et al. 2000). Regarding the obscuration hypothesis, we find no evolution in the column density of the low-ionization absorber; the one measured in 2019 data (see Sect. 3.1 and Table 2) is consistent with results from the literature (\al@hasinger2002,chartas2009; \al@hasinger2002,chartas2009). As a consequence, the reduction in flux must be ascribed to a decrease of the source primary activity. The trend (or lack of it) in the first two panels of Fig. 3 is indeed well matched by the evolution of (lower panel) which, despite the large uncertainties, shows a discontinuity between 2019 and epochs prior to 2008. Coupling the three probes together suggests that the reflection component seen in 2019 data was likely already in place before 2008, but less evident due to a stronger primary continuum.
In this scenario, the reflection component observed in 2019 can possibly be interpreted as the echo of APM 08279 previous activity, due to (i) the time delay between the X-ray source and the reflector and (ii) the reduced direct emission observed in the last epoch. This is similar to the case of PG 1247+267: Lanzuisi et al. (2016) explain its very high reflection fraction in terms of X-ray source variability, namely, the primary emission has dropped but the reflection still has not due to the additional light-travel path. Using the same argument, we can place a lower limit on the distance between reflector and X-ray corona, assuming that the variability during the 2008–2019 observational gap is only ascribed to a uniform decrease in the activity of the X-ray corona. We consider the time elapsed between CXO3 and XMM 101 ( d in the quasar rest frame) as that corresponding to the light travel path between X-ray source and reflector (). Under this assumption, we derive the lower limit to the reflector location as pc (in accordance to the lower limit obtained from the Fe K line width: pc), which definitely excludes a disc origin in favor of a distant reflector. By this lower limit, the reflection likely happens in the molecular torus (e.g., Burtscher et al. 2013; Netzer 2015) or, based on the estimate by Saturni et al. (2016) for this quasar, at the boundary of the broad-line region.
5 Properties of the X-ray corona
We presented a detailed analysis of the first NuSTAR observations of APM 08279, a gravitationally lensed, broad-absorption line quasar at , taken jointly to the latest XMM-Newton exposures in 2019. By means of primary-emission decrease (see Sect. 4) and high-energy sampling, we are able for the first time to see and constrain a strong reflection component () and the high-energy cutoff ( keV) in this source. Despite the large uncertainties, the high-energy cutoff of APM 08279 is fully consistent with the only other estimates at (Dadina et al. 2016; L19; see also the tentative measure of Lanzuisi et al. 2016). We thus break the previous redshift record of B1422 (Dadina et al. 2016; L19) and find additional evidence for complex emission mechanisms, very much alike those of local Seyfert galaxies, in high- AGN (up to ). It is of interest to notice that we do not find evidence for significant X-ray winds in the 2019 observations of APM 08279, the archetype of high- UFOs. While these winds are known to be variable and episodic events (e.g., Dadina et al. 2005; Cappi et al. 2006; Giustini et al. 2011; Gofford et al. 2014; Igo et al. 2020; Parker et al. 2021), the present data do not allow us to investigate further on their disappearance. Only a new, dedicated monitoring will be key in probing i) whether this new flux state is enduring, ii) whether UFOs are no longer a distinctive feature of APM 08279 , and iii) whether the former might be the cause of the latter.
The measured reflection fraction () is, even considering the large uncertainties, much higher than what expected based on previous results in the literature for high-luminosity sources: AGN with are usually found to show (Del Moro et al. 2017; Zappacosta et al. 2018). We note that even though lower than our estimate, both the reflection fractions measured in L19 are higher than what expected for high-luminosity sources. However, the case of APM 08279 during 2019 exposures quite differs from those of B1422 and 2MASSJ16, and is more alike that of PG 1247+267, as discussed in Sect. 4. Moreover, the Fe K EW of APM 08279, measured with the phenomenological model acutpl+K (Table 2), is larger than the expectation based on the results over samples of high- and local AGN (e.g., Falocco et al. 2013) and on the Iwasawa-Taniguchi effect (Bianchi et al. 2007), but is consistent, at 90% confidence level, with the highest EWs of the CAIXA sample (corresponding to the 98% percentile of the EW distribution, Bianchi et al. 2009). In fact, such high values of and of Fe K EW in 2019 data, coupled with the non-evolution of the X-ray reflection flux in the 2–10 keV observed band and the lower limit placed on the reflector’s distance, likely hint that the reflection component in this last observation could be the echo of APM 08279 previous activity. Moreover, the majority of the reflection fraction values obtained from data prior to 2008 (see Fig. 3 and Table 3) are in decent agreement with what expected from the literature (). This is additional proof for our interpretation of APM 08279 activity variation (see Sect. 4), and for the Seyfert-like mechanisms that give origin to its emission.
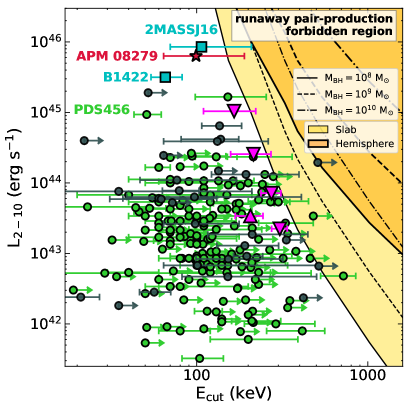
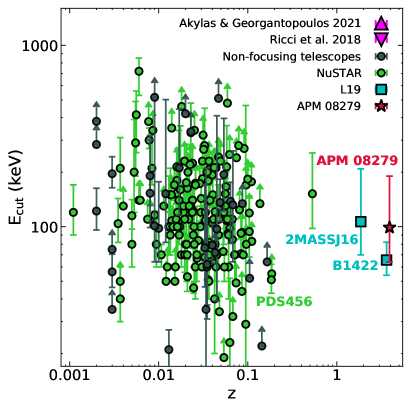
L19 adopted the plane of Fabian et al. (2015) translated into the directly observable quantities versus , respectively, through Eqs. (1) (with , as assumed in Fabian et al. 2015) and (2). In the same way, theoretical () critical lines of Stern et al. (1995) were converted into () thresholds, assuming a corona size (Schwarzschild radius: ) and SMBH masses and , namely, representative of the sample of Fabian et al. (2015) and of powerful, high- quasars, respectively. L19 also updated the compilation by Fabian et al. (2015) with more recent measurements, obtained both with and without NuSTAR data, and both on individual targets or over samples of sources (e.g., Malizia et al. 2014; Tortosa et al. 2017; Buisson et al. 2018; Molina et al. 2019). L19 included also the median values, binned in compactness (i.e., ), of the large BASS sample of local AGN as measured by Ricci et al. (2018). Figure 4 (left) shows the – plane of L19 further updated with our measurement, the pair-production critical lines for , and results from other recent works, derived through canonical modeling of the continuum (Kara et al. 2017; Tortosa et al. 2018; Kamraj et al. 2018; Ursini et al. 2020; Baloković et al. 2020; Middei et al. 2020, 2021; Reeves et al. 2021, see also Ezhikode et al. 2020, where the authors model X-ray reflection accounting for relativistic effects). When multiple estimates for a same source are available, we only kept the latest one. We also added earlier measurements of Dadina (2007) that were not revised in later works, and selecting the best constrained value in case of multiple measurements for a single source. Akylas & Georgantopoulos (2021) recently studied the distribution of coronal temperatures in a big sample of Seyfert 1 selected by Swift and followed up by NuSTAR (118 sources, many also comprised in Ricci et al. 2017, 2018). Figure 4 shows the median high-energy cutoff of Seyfert 1 galaxies measured by Akylas & Georgantopoulos (2021). Recent works by Saturni et al. (2016, 2018) have agreed on APM 08279 data being best reproduced by low magnification factors (). To add our target to the – plane, we estimated the de-absorbed and de-lensed 2–10 keV luminosity of APM 08279 () assuming a magnification factor of (Riechers et al. 2009). Like the other high- AGN, APM 08279 falls in the allowed region for high-mass SMBHs with X-ray luminosity higher than . Being located in the proximity of the central SMBH, hot coronae are subject to the laws of general relativity (e.g., Wilkins et al. 2021). Tamborra et al. (2018) provide correction factors to be applied to results obtained through canonical reflection models. The authors demonstrate that, without accounting for general relativity, the observed high-energy cutoff () underestimates the intrinsic value by a factor . Tamborra et al. (2018) compute g-factors for a variety of combinations of corona properties and reflection inclination angles. Assuming a corona and an inclination angle ° (see Sect. 3.1), the corresponding g-factor spans between 1.2 and 1.5. Even assuming the maximum value, the 90% confidence level upper bound of the high-energy cutoff of APM 08279 falls below the critical line for a slab corona and . Thus, APM 08279 would still lie in the allowed region of the plane for a SMBH mass of even when general relativity effects are accounted for.
L19 found that the median cutoff energy expected for local BASS AGN (Ricci et al. 2018) in the same accretion regime as their high- sources was much higher than the measured values of B1422 and 2MASSJ16. For what concerns APM 08279, local AGN in the same Eddington regime as our target (, Saturni et al. 2018) show a median high-energy cutoff of keV, which is well above the best-fit measurement ( keV) but consistent with its 90% confidence range ( keV). However, the existence of a relation between high-energy cutoff and Eddington ratio was recently debated in the literature: Hinkle & Mushotzky (2021) and Kamraj et al. (2022) find no correlation between accretion parameters and the high-energy cutoff in their new analyses of BASS AGN, as opposed to what seen by Ricci et al. (2018). According to their spectral analysis of NuSTAR data alone of Swift/BAT selected AGN, Kang & Wang (2022) confirmed the absence of a – relation and, interestingly, they find that some sources fall in the runaway pair-production region of Fig. 4. Only a better sampling of both the high-luminosity end and the high-accretion regime will allow us to better understand the physics regulating hot coronae in powerful AGN. Lastly, we addressed the possibility of APM 08279 having a magnification factor more similar to (Egami et al. 2000), which would make our target a more ”regular” AGN (, ). Nevertheless, APM 08279 would still fall in the allowed region of the plane and its high-energy cutoff would not be consistent with the median value of BASS AGN in a similar accretion regime.
6 Summary and conclusions
We presented our analysis of the first X-ray broadband spectrum of APM 08279, a gravitationally lensed, broad-absorption line quasar at . We then compared our findings with past observations and we summarize our key results here:
-
•
We measured a long-lasting X-ray reflection component in this source for the first time. We find it consistent with being produced by distant material, in the molecular torus or at the boundary of the broad-line region (). The large reflection fraction of is interpreted in terms of a decrease in the primary X-ray emission, as, for instance, the case of PG 1247+267.
-
•
We break the previous redshift record for the farthest high-energy cutoff ever observed. Our measurement of keV is fully in agreement with previous results on high-, high-luminosity AGN.
-
•
As opposed to the other high- sources of L19, the cutoff measured for APM 08279 is consistent (within a 90% confidence level) with the median values of BASS AGN in the same accretion regime. A better sampling of this luminosity regime will be key to study the behavior of such sources.
Results that have come about over the last two decades have shown that studies of high- AGN are observationally challenging but highly rewarding, when carried out by means of long-enough exposures of present-day observatories. Next-generation X-ray telescopes will be crucial in substantially expanding the samples used to test the physical processes that regulate hot coronae. In particular, enlarging the sample of high- AGN, especially at the fainter end, will shed light on whether low- and high- AGN comply with the same relations. Would they differ, only future studies of high- AGN will disclose whether it is owed to the different luminosity regimes or whether it is a byproduct of a potential evolution with cosmic time. To this aim, the eROSITA All-Sky Survey will be key in discovering new high- AGN, to then be followed up by present facilities such as NuSTAR and, hopefully, future hard X-ray instruments.
Acknowledgements.
We acknowledge financial support from ASI under grants ASI-INAF I/037/12/0 and n. 2017-14-H.O, and from the grant PRIN MIUR 2017PH3WAT (‘Black hole winds and the baryon life cycle of galaxies’). This work is based on observations obtained with XMM-Newton, an ESA science mission with instruments and contributions directly funded by ESA Member States and the USA (NASA). This research has made use of data obtained from the Chandra Data Archive, and software provided by the Chandra X-ray Center (CXC) in the application package CIAO. This research has made use of data and/or software provided by the High Energy Astrophysics Science Archive Research Center (HEASARC), which is a service of the Astrophysics Science Division at NASA/GSFC. This work made use of data from the NuSTAR mission, a project led by the California Institute of Technology, managed by the Jet Propulsion Laboratory, and funded by the NASA. This research has made use of the NuSTAR Data Analysis Software (NuSTARDAS) jointly developed by the ASI Science Data Center (ASDC, Italy) and the California Institute of Technology (USA).References
- Akylas & Georgantopoulos (2021) Akylas, A. & Georgantopoulos, I. 2021, A&A, 655, A60
- Baloković et al. (2020) Baloković, M., Harrison, F. A., Madejski, G., et al. 2020, ApJ, 905, 41
- Bassani et al. (1999) Bassani, L., Dadina, M., Maiolino, R., et al. 1999, The Astrophysical Journal Supplement Series, 121, 473
- Bianchi et al. (2007) Bianchi, S., Guainazzi, M., Matt, G., & Fonseca Bonilla, N. 2007, A&A, 467, L19
- Bianchi et al. (2009) Bianchi, S., Guainazzi, M., Matt, G., Fonseca Bonilla, N., & Ponti, G. 2009, A&A, 495, 421
- Buisson et al. (2018) Buisson, D. J. K., Parker, M. L., Kara, E., et al. 2018, MNRAS, 480, 3689
- Burtscher et al. (2013) Burtscher, L., Meisenheimer, K., Tristram, K. R. W., et al. 2013, A&A, 558, A149
- Cappi et al. (2006) Cappi, M., Panessa, F., Bassani, L., et al. 2006, A&A, 446, 459
- Cappi et al. (2009) Cappi, M., Tombesi, F., Bianchi, S., et al. 2009, A&A, 504, 401
- Cash (1979) Cash, W. 1979, ApJ, 228, 939
- Cavaliere & Morrison (1980) Cavaliere, A. & Morrison, P. 1980, ApJ, 238, L63
- Chartas et al. (2002) Chartas, G., Agol, E., Eracleous, M., et al. 2002, ApJ, 568, 509
- Chartas et al. (2009) Chartas, G., Saez, C., Brandt, W. N., Giustini, M., & Garmire, G. P. 2009, ApJ, 706, 644
- Costa et al. (2020) Costa, T., Pakmor, R., & Springel, V. 2020, MNRAS, 497, 5229
- Dadina (2007) Dadina, M. 2007, A&A, 461, 1209
- Dadina (2008) Dadina, M. 2008, A&A, 485, 417
- Dadina et al. (2005) Dadina, M., Cappi, M., Malaguti, G., Ponti, G., & de Rosa, A. 2005, A&A, 442, 461
- Dadina et al. (2016) Dadina, M., Vignali, C., Cappi, M., et al. 2016, A&A, 592, A104
- Dauser et al. (2014) Dauser, T., Garcia, J., Parker, M. L., Fabian, A. C., & Wilms, J. 2014, MNRAS, 444, L100
- de Rosa et al. (2012) de Rosa, A., Panessa, F., Bassani, L., et al. 2012, MNRAS, 420, 2087
- Del Moro et al. (2017) Del Moro, A., Alexander, D. M., Aird, J. A., et al. 2017, ApJ, 849, 57
- Egami et al. (2000) Egami, E., Neugebauer, G., Soifer, B. T., et al. 2000, ApJ, 535, 561
- Ellison et al. (2004) Ellison, S. L., Ibata, R., Pettini, M., et al. 2004, A&A, 414, 79
- Ezhikode et al. (2020) Ezhikode, S. H., Dewangan, G. C., Misra, R., & Philip, N. S. 2020, MNRAS, 495, 3373
- Fabian et al. (2015) Fabian, A. C., Lohfink, A., Kara, E., et al. 2015, MNRAS, 451, 4375
- Falocco et al. (2013) Falocco, S., Carrera, F. J., Corral, A., et al. 2013, A&A, 555, A79
- Faucher-Giguère & Quataert (2012) Faucher-Giguère, C.-A. & Quataert, E. 2012, MNRAS, 425, 605
- Gandhi et al. (2007) Gandhi, P., Fabian, A. C., Suebsuwong, T., et al. 2007, MNRAS, 382, 1005
- García et al. (2014) García, J., Dauser, T., Lohfink, A., et al. 2014, ApJ, 782, 76
- Giustini et al. (2011) Giustini, M., Cappi, M., Chartas, G., et al. 2011, A&A, 536, A49
- Gofford et al. (2014) Gofford, J., Reeves, J. N., Braito, V., et al. 2014, ApJ, 784, 77
- Guilbert et al. (1983) Guilbert, P. W., Fabian, A. C., & Rees, M. J. 1983, MNRAS, 205, 593
- Haardt & Maraschi (1991) Haardt, F. & Maraschi, L. 1991, ApJ, 380, L51
- Haardt et al. (1994) Haardt, F., Maraschi, L., & Ghisellini, G. 1994, ApJ, 432, L95
- Harrison et al. (2013) Harrison, F. A., Craig, W. W., Christensen, F. E., et al. 2013, ApJ, 770, 103
- Hasinger et al. (2002) Hasinger, G., Schartel, N., & Komossa, S. 2002, ApJ, 573, L77
- HI4PI Collaboration et al. (2016) HI4PI Collaboration, Ben Bekhti, N., Flöer, L., et al. 2016, A&A, 594, A116
- Hinkle & Mushotzky (2021) Hinkle, J. T. & Mushotzky, R. 2021, MNRAS, 506, 4960
- Igo et al. (2020) Igo, Z., Parker, M. L., Matzeu, G. A., et al. 2020, MNRAS, 493, 1088
- Irwin et al. (1989) Irwin, M. J., Webster, R. L., Hewett, P. C., Corrigan, R. T., & Jedrzejewski, R. I. 1989, AJ, 98, 1989
- Just et al. (2007) Just, D. W., Brandt, W. N., Shemmer, O., et al. 2007, ApJ, 665, 1004
- Kammoun et al. (2017) Kammoun, E. S., Risaliti, G., Stern, D., et al. 2017, MNRAS, 465, 1665
- Kamraj et al. (2022) Kamraj, N., Brightman, M., Harrison, F. A., et al. 2022, ApJ, 927, 42
- Kamraj et al. (2018) Kamraj, N., Harrison, F. A., Baloković, M., Lohfink, A., & Brightman, M. 2018, ApJ, 866, 124
- Kang & Wang (2022) Kang, J.-L. & Wang, J.-X. 2022, arXiv e-prints, arXiv:2203.07118
- Kara et al. (2017) Kara, E., García, J. A., Lohfink, A., et al. 2017, MNRAS, 468, 3489
- King & Pounds (2015) King, A. & Pounds, K. 2015, ARA&A, 53, 115
- Koss et al. (2017) Koss, M., Trakhtenbrot, B., Ricci, C., et al. 2017, ApJ, 850, 74
- Lanzuisi et al. (2019) Lanzuisi, G., Gilli, R., Cappi, M., et al. 2019, ApJ, 875, L20
- Lanzuisi et al. (2016) Lanzuisi, G., Perna, M., Comastri, A., et al. 2016, A&A, 590, A77
- Leung et al. (2019) Leung, T. K. D., Hayward, C. C., Casey, C. M., et al. 2019, ApJ, 876, 48
- Maiolino et al. (1998) Maiolino, R., Salvati, M., Bassani, L., et al. 1998, A&A, 338, 781
- Malizia et al. (2014) Malizia, A., Molina, M., Bassani, L., et al. 2014, ApJ, 782, L25
- Matt et al. (2000) Matt, G., Fabian, A. C., Guainazzi, M., et al. 2000, MNRAS, 318, 173
- Middei et al. (2021) Middei, R., Matzeu, G. A., Bianchi, S., et al. 2021, A&A, 647, A102
- Middei et al. (2020) Middei, R., Tombesi, F., Vagnetti, F., et al. 2020, A&A, 635, A18
- Miniutti & Fabian (2006) Miniutti, G. & Fabian, A. C. 2006, MNRAS, 366, 115
- Molina et al. (2013) Molina, M., Bassani, L., Malizia, A., et al. 2013, MNRAS, 433, 1687
- Molina et al. (2009) Molina, M., Bassani, L., Malizia, A., et al. 2009, MNRAS, 399, 1293
- Molina et al. (2019) Molina, M., Malizia, A., Bassani, L., et al. 2019, MNRAS, 484, 2735
- Netzer (2015) Netzer, H. 2015, ARA&A, 53, 365
- Parker et al. (2021) Parker, M. L., Alston, W. N., Härer, L., et al. 2021, MNRAS, 508, 1798
- Petrucci et al. (2001) Petrucci, P. O., Haardt, F., Maraschi, L., et al. 2001, ApJ, 556, 716
- Piconcelli et al. (2005) Piconcelli, E., Jimenez-Bailón, E., Guainazzi, M., et al. 2005, A&A, 432, 15
- Planck Collaboration et al. (2020) Planck Collaboration, Aghanim, N., Akrami, Y., et al. 2020, A&A, 641, A6
- Protassov et al. (2002) Protassov, R., van Dyk, D. A., Connors, A., Kashyap, V. L., & Siemiginowska, A. 2002, ApJ, 571, 545
- Reeves et al. (2021) Reeves, J. N., Braito, V., Porquet, D., et al. 2021, MNRAS, 500, 1974
- Ricci et al. (2018) Ricci, C., Ho, L. C., Fabian, A. C., et al. 2018, MNRAS, 480, 1819
- Ricci et al. (2017) Ricci, C., Trakhtenbrot, B., Koss, M. J., et al. 2017, ApJS, 233, 17
- Riechers et al. (2009) Riechers, D. A., Walter, F., Carilli, C. L., & Lewis, G. F. 2009, ApJ, 690, 463
- Saez et al. (2009) Saez, C., Chartas, G., & Brandt, W. N. 2009, ApJ, 697, 194
- Saturni et al. (2018) Saturni, F. G., Bischetti, M., Piconcelli, E., et al. 2018, A&A, 617, A118
- Saturni et al. (2016) Saturni, F. G., Trevese, D., Vagnetti, F., Perna, M., & Dadina, M. 2016, A&A, 587, A43
- Stacey et al. (2018) Stacey, H. R., McKean, J. P., Robertson, N. C., et al. 2018, MNRAS, 476, 5075
- Stern et al. (1995) Stern, B. E., Poutanen, J., Svensson, R., Sikora, M., & Begelman, M. C. 1995, ApJ, 449, L13
- Tamborra et al. (2018) Tamborra, F., Papadakis, I., Dovčiak, M., & Svoboda, J. 2018, MNRAS, 475, 2045
- Tortosa et al. (2018) Tortosa, A., Bianchi, S., Marinucci, A., Matt, G., & Petrucci, P. O. 2018, A&A, 614, A37
- Tortosa et al. (2017) Tortosa, A., Marinucci, A., Matt, G., et al. 2017, MNRAS, 466, 4193
- Ursini et al. (2020) Ursini, F., Petrucci, P. O., Bianchi, S., et al. 2020, A&A, 634, A92
- Vasudevan et al. (2013) Vasudevan, R. V., Brandt, W. N., Mushotzky, R. F., et al. 2013, ApJ, 763, 111
- Vignali et al. (2005) Vignali, C., Brandt, W. N., Schneider, D. P., & Kaspi, S. 2005, AJ, 129, 2519
- Vignali et al. (1999) Vignali, C., Comastri, A., Cappi, M., et al. 1999, ApJ, 516, 582
- Wilkins et al. (2021) Wilkins, D. R., Gallo, L. C., Costantini, E., Brandt, W. N., & Blandford, R. D. 2021, Nature, 595, 657
- Younes et al. (2019) Younes, G., Ptak, A., Ho, L. C., et al. 2019, ApJ, 870, 73
- Zappacosta et al. (2018) Zappacosta, L., Comastri, A., Civano, F., et al. 2018, ApJ, 854, 33
Appendix A High-energy cutoff measurements by NuSTAR and nonfocusing telescopes
| Source | Flag | References | |||
|---|---|---|---|---|---|
| NGC 5506 | 0.006 | 42.68 | 1 | (a),(b) | |
| NGC 7213 | 0.006 | 42.07 | 1 | (a),(b) | |
| MCG-6-30-15 | 0.008 | 43.39 | 1 | (a),(b) | |
| MCG 5-23-16 | 0.009 | 43.2 | 1 | (a),(b) | |
| SWIFT J2127.4+5654 | 0.014 | 43.0 | 1 | (a),(b) | |
| NGC 5548 | 0.018 | 43.3 | 1 | (a),(b) | |
| Mrk 335 | 0.026 | 42.51 | 1 | (a),(b) | |
| 1H0707-495 | 0.041 | 43.06 | 1 | (a),(b) | |
| Fairall 9 | 0.047 | 43.98 | 1 | (a),(b) | |
| Cyg A | 0.056 | 44.24 | 1 | (a),(b) | |
| 3C 382 | 0.058 | 44.37 | 1 | (a),(b) | |
| IGR J0033+6122 | 0.105 | 45.28 | 2 | (c),(a),(b) | |
| 3C 111 | 0.049 | 44.81 | 2 | (c),(a),(b) | |
| IGR J07597-3842 | 0.04 | 43.89 | 2 | (c),(a),(b) | |
| NGC 3783 | 0.01 | 43.42 | 2 | (c),(a),(b) | |
| NGC 4151 | 0.003 | 42.96 | 2 | (c),(a),(b) | |
| IGR J16558-5203 | 0.054 | 44.12 | 2 | (c),(a),(b) | |
| 1H2251-179 | 0.064 | 44.62 | 2 | (c),(a),(b) | |
| MCG-02-58-022 | 0.047 | 44.29 | 2 | (c),(a),(b) | |
| MCG+08-11-011 | 0.021 | 44.03 | 1 | (d),(b) | |
| Mrk 6 | 0.019 | 43.21 | 1 | (d),(b) | |
| IGR J12415-5750 | 0.024 | 43.24 | 1 | (d),(b) | |
| IC4329A | 0.016 | 43.97 | 1 | (d),(b) | |
| GRS 1734-292 | 0.021 | 43.64 | 1 | (d),(b) | |
| 3C 390.3 | 0.056 | 44.37 | 1 | (d),(b) | |
| NGC 6814 | 0.005 | 42.18 | 1 | (d),(b) | |
| 4C 74.24 | 0.104 | 44.38 | 1 | (d),(b) | |
| S5 2116+81 | 0.086 | 44.42 | 1 | (d),(b) | |
| PG 1114+445 | 0.144 | 44.6 | 2 | (e),(a),(b) | |
| NGC 4051 | 0.002 | 40.68 | 2 | (e),(a),(b) | |
| PG 1202+281 | 0.165 | 44.39 | 2 | (e),(a),(b) | |
| NGC 4138 | 0.003 | 41.21 | 2 | (e),(a),(b) | |
| Mrk 766 | 0.013 | 42.38 | 2 | (e),(a),(b) | |
| NGC 4258 | 0.002 | 40.82 | 2 | (e),(a),(b) | |
| Mrk 50 | 0.023 | 43.19 | 2 | (e),(a),(b) | |
| NGC 4593 | 0.009 | 42.82 | 2 | (e),(a),(b) | |
| Mrk 1383 | 0.087 | 44.17 | 2 | (e),(a),(b) | |
| NGC 3998 | 0.0035 | 41.51 | 1 | (f),(b) | |
| NGC 4579 | 0.0056 | 41.9 | 1 | (f),(b) | |
| ESO 103-035 | 0.013 | 42.96 | 1 | (g),(b) | |
| IGR 2124 | 0.02 | 43.68 | 1 | (g),(b) | |
| B2202-209 | 0.532 | 45.22 | 1 | (h),(b) | |
| GRS 1734-292 | 0.021 | 43.72 | 1 | (i),(b) |
(a) Fabian et al. (2015), (b) L19, (c) Malizia et al. (2014), (d) Molina et al. (2019), (e) Vasudevan et al. (2013), (f) Younes et al. (2019), (g) Buisson et al. (2018), (h) Kammoun et al. (2017), (i) Tortosa et al. (2017).
| Source | Flag | References | |||
|---|---|---|---|---|---|
| NGC 985 | 0.043 | 43.72 | 2 | (j) | |
| ESO198-G24 | 0.045 | 43.8 | 2 | (j) | |
| NCG 1068 | 0.003 | 42.26 | 2 | (j) | |
| 3C 120 | 0.033 | 44.04 | 2 | (j) | |
| H0557 | 0.034 | 43.88 | 2 | (j) | |
| MCG-1-24-12 | 0.02 | 42.37 | 2 | (j) | |
| MCG-5-23-16 | 0.008 | 43.11 | 2 | (j) | |
| NGC 3516 | 0.009 | 42.83 | 2 | (j) | |
| NGC 4151* | 0.003 | 42.45 | 2 | (j) | |
| NGC 4507 | 0.012 | 42.67 | 2 | (j) | |
| NGC 4945 | 0.002 | 40.51 | 2 | (j) | |
| Mrk 509* | 0.035 | 43.78 | 2 | (j) | |
| MR 2251 | 0.068 | 44.59 | 2 | (j) | |
| NGC 7469 | 0.017 | 43.27 | 2 | (j) | |
| Ark 564 | 0.02468 | 43.59 | 1 | (k) | |
| MGC +8-11-11 | 0.0204 | 43.71 | 1 | (l) | |
| Ark 120 | 0.033 | 43.96 | 1 | (l) | |
| PG 1211+143 | 0.0809 | 43.54 | 1 | (l) | |
| 1E 0754.6+3928 | 0.096 | 43.7 | 1 | (m) | |
| HE 1143-1810 | 0.0328 | 43.74 | 1 | (n) | |
| MCG-01-24-12 | 0.0196 | 43.18 | 1 | (o) | |
| PDS 456 | 0.184 | 44.97 | 1 | (p) | |
| 1RXSJ034704.9 | 0.095 | 42.72 | 1 | (q) | |
| 1RXS J174538.1 | 0.111 | 43.75 | 1 | (q) | |
| 1RXS J213445.2 | 0.067 | 43.24 | 1 | (q) | |
| 2MASS J19334715 | 0.057 | 43.39 | 1 | (q) | |
| 2MASX J04372814 | 0.053 | 42.85 | 1 | (q) | |
| 2MASX J12313717 | 0.028 | 42.34 | 1 | (q) | |
| 2MASX J15144217 | 0.068 | 43.19 | 1 | (q) | |
| 2MASX J15295830 | 0.104 | 43.5 | 1 | (q) | |
| 2MASX J19301380 | 0.063 | 43.66 | 1 | (q) | |
| 2MASX J19380437 | 0.04 | 42.85 | 1 | (q) | |
| 2MASX J20005575 | 0.037 | 42.8 | 1 | (q) | |
| 3C 227 | 0.086 | 43.65 | 1 | (q) | |
| 4C +18.51 | 0.186 | 43.79 | 1 | (q) | |
| ESO 438-G009 | 0.024 | 42.03 | 1 | (q) | |
| Fairall 1146 | 0.031 | 42.81 | 1 | (q) | |
| Fairall 1203 | 0.058 | 42.75 | 1 | (q) | |
| HB89 0241+622 | 0.044 | 43.36 | 1 | (q) | |
| IGR J14471-6414 | 0.053 | 42.75 | 1 | (q) | |
| IGR J14552-5133 | 0.016 | 41.89 | 1 | (q) | |
| IRAS 04392-2713 | 0.084 | 43.46 | 1 | (q) | |
| LCRSB 232242.2 | 0.036 | 41.95 | 1 | (q) | |
| Mrk 9 | 0.04 | 42.34 | 1 | (q) | |
| Mrk 376 | 0.056 | 42.83 | 1 | (q) | |
| Mrk 595 | 0.027 | 41.96 | 1 | (q) | |
| Mrk 732 | 0.029 | 42.5 | 1 | (q) | |
| Mrk 739 | 0.03 | 42.32 | 1 | (q) | |
| Mrk 813 | 0.11 | 43.71 | 1 | (q) | |
| Mrk 817 | 0.031 | 42.56 | 1 | (q) | |
| Mrk 841 | 0.036 | 43.05 | 1 | (q) | |
| Mrk 1018 | 0.042 | 42.18 | 1 | (q) | |
| Mrk 1044 | 0.016 | 42.02 | 1 | (q) | |
| Mrk 1310 | 0.019 | 42.17 | 1 | (q) | |
| Mrk 1393 | 0.054 | 42.48 | 1 | (q) | |
| NGC 0985 | 0.043 | 43.02 | 1 | (q) | |
| PG 0804+761 | 0.1 | 43.56 | 1 | (q) | |
| PKS 0558-504 | 0.137 | 44.03 | 1 | (q) | |
| RBS 0295 | 0.074 | 43.17 | 1 | (q) | |
| RBS 0770 | 0.032 | 43.05 | 1 | (q) | |
| RBS 1037 | 0.084 | 43.14 | 1 | (q) | |
| RBS 1125 | 0.063 | 42.91 | 1 | (q) | |
| SBS 1136+594 | 0.06 | 43.28 | 1 | (q) | |
| SDSS J104326.47 | 0.048 | 42.67 | 1 | (q) | |
| UM 614 | 0.033 | 42.58 | 1 | (q) | |
| WKK 1263 | 0.024 | 42.94 | 1 | (q) | |
| NGC 262 | 0.015 | 43.62 | 1 | (r) | |
| ESO 195-IG021 | 0.0494 | 43.76 | 1 | (r) | |
| NGC 454 E | 0.0121 | 42.43 | 1 | (r) | |
| NGC 513 | 0.0195 | 42.73 | 1 | (r) | |
| NGC 612 | 0.0298 | 43.82 | 1 | (r) | |
| 2MASX J0140 | 0.0716 | 44.0 | 1 | (r) | |
| MCG-01-05-047 | 0.0172 | 42.9 | 1 | (r) | |
| NGC 788 | 0.0136 | 43.18 | 1 | (r) | |
| ESO 416-G002 | 0.0591 | 43.53 | 1 | (r) | |
| NGC 1052 | 0.005 | 41.9 | 1 | (r) | |
| 2MFGC 2280 | 0.0152 | 43.33 | 1 | (r) | |
| NGC 1229 | 0.0363 | 42.93 | 1 | (r) | |
| NGC 1365 | 0.0055 | 42.0 | 1 | (r) | |
| 2MASX J0356 | 0.0748 | 43.87 | 1 | (r) | |
| 3C 105 | 0.089 | 44.36 | 1 | (r) | |
| 2MASX J0423 | 0.045 | 44.05 | 1 | (r) | |
| MCG+03-13-001 | 0.0154 | 42.63 | 1 | (r) | |
| CGCG 420-015 | 0.0294 | 43.48 | 1 | (r) | |
| ESO 033-G002 | 0.0181 | 42.93 | 1 | (r) | |
| LEDA 178130 | 0.035 | 44.0 | 1 | (r) | |
| 2MASX J0508 | 0.0175 | 42.99 | 1 | (r) | |
| NGC 2110 | 0.0078 | 43.73 | 1 | (r) | |
| ESO 005-G004 | 0.0062 | 42.03 | 1 | (r) | |
| Mrk 3 | 0.0135 | 43.83 | 1 | (r) | |
| ESO 121-IG028 | 0.0405 | 43.63 | 1 | (r) | |
| LEDA 549777 | 0.061 | 43.63 | 1 | (r) | |
| LEDA 511628 | 0.0469 | 43.53 | 1 | (r) | |
| MCG+06-16-028 | 0.0157 | 42.93 | 1 | (r) | |
| IRAS 07378-3136 | 0.0258 | 43.23 | 1 | (r) | |
| UGC 3995 A | 0.0158 | 42.93 | 1 | (r) | |
| Mrk 1210 | 0.0135 | 42.93 | 1 | (r) | |
| MCG-01-22-006 | 0.0218 | 43.43 | 1 | (r) | |
| CGCG 150-014 | 0.0647 | 43.93 | 1 | (r) | |
| MCG+11-11-032 | 0.0363 | 43.63 | 1 | (r) | |
| 2MASX J0903 | 0.091 | 43.73 | 1 | (r) | |
| 2MASX J0911 | 0.0268 | 43.33 | 1 | (r) | |
| IC 2461 | 0.0075 | 41.93 | 1 | (r) | |
| MCG-01-24-012 | 0.0196 | 43.46 | 1 | (r) | |
| 2MASX J0923 | 0.0424 | 43.83 | 1 | (r) | |
| NGC 2992 | 0.0077 | 43.03 | 1 | (r) | |
| NGC 3079 | 0.0037 | 42.73 | 1 | (r) | |
| ESO 263-G013 | 0.0335 | 43.73 | 1 | (r) | |
| NGC 3281 | 0.0107 | 42.53 | 1 | (r) | |
| MCG+12-10-067 | 0.0336 | 43.13 | 1 | (r) | |
| MCG+06-24-008 | 0.0259 | 42.92 | 1 | (r) | |
| UGC 5881 | 0.0206 | 42.53 | 1 | (r) | |
| NGC 3393 | 0.0125 | 43.53 | 1 | (r) | |
| 2MASX J1136 | 0.014 | 42.33 | 1 | (r) | |
| NGC 3822 | 0.0209 | 42.53 | 1 | (r) | |
| B2 1204+34 | 0.0791 | 44.09 | 1 | (r) | |
| IRAS 12074-4619 | 0.0315 | 42.93 | 1 | (r) | |
| WAS 49 | 0.061 | 43.73 | 1 | (r) | |
| NGC 4388 | 0.0084 | 42.87 | 1 | (r) | |
| NGC 4395 | 0.0011 | 40.63 | 1 | (r) | |
| LEDA 170194 | 0.0367 | 43.2 | 1 | (r) | |
| NGC 4941 | 0.0037 | 41.73 | 1 | (r) | |
| NGC 4992 | 0.0251 | 43.46 | 1 | (r) | |
| Mrk 248 | 0.0366 | 43.53 | 1 | (r) | |
| ESO 509-IG066 | 0.0446 | 43.63 | 1 | (r) | |
| NGC 5252 | 0.023 | 43.43 | 1 | (r) | |
| 2MASX J1410 | 0.0339 | 42.93 | 1 | (r) | |
| NGC 5643 | 0.004 | 41.13 | 1 | (r) | |
| NGC 5674 | 0.0249 | 43.23 | 1 | (r) | |
| NGC 5728 | 0.0094 | 43.23 | 1 | (r) | |
| IC 4518A | 0.0163 | 42.73 | 1 | (r) | |
| 2MASX J1506 | 0.0377 | 42.93 | 1 | (r) | |
| NGC 5899 | 0.0086 | 42.23 | 1 | (r) | |
| MCG+11-19-006 | 0.044 | 43.43 | 1 | (r) | |
| MCG-01-40-001 | 0.0227 | 42.93 | 1 | (r) | |
| NGC 5995 | 0.0252 | 43.28 | 1 | (r) | |
| MCG+14-08-004 | 0.0239 | 42.81 | 1 | (r) | |
| Mrk 1498 | 0.0547 | 44.22 | 1 | (r) | |
| IRAS 16288+3929 | 0.0306 | 43.37 | 1 | (r) | |
| NGC 6240 | 0.0245 | 44.02 | 1 | (r) | |
| NGC 6300 | 0.0037 | 42.04 | 1 | (r) | |
| MCG+07-37-031 | 0.0412 | 43.85 | 1 | (r) | |
| 2MASX J1824 | 0.067 | 43.83 | 1 | (r) | |
| IC 4709 | 0.0169 | 42.83 | 1 | (r) | |
| LEDA 3097193 | 0.022 | 43.34 | 1 | (r) | |
| ESO 103-G035 | 0.0133 | 43.25 | 1 | (r) | |
| ESO 231-G026 | 0.0625 | 44.12 | 1 | (r) | |
| 2MASX J1926 | 0.071 | 43.33 | 1 | (r) | |
| 2MASX J1947 | 0.0539 | 43.83 | 1 | (r) | |
| 3C 403 | 0.059 | 44.03 | 1 | (r) | |
| 2MASX J2006 | 0.043 | 43.33 | 1 | (r) | |
| 2MASX J2018 | 0.0144 | 42.83 | 1 | (r) | |
| 2MASX J2021 | 0.017 | 42.63 | 1 | (r) | |
| NGC 6921 | 0.0145 | 43.13 | 1 | (r) | |
| MCG+04-48-002 | 0.0139 | 42.73 | 1 | (r) | |
| IC 5063 | 0.0114 | 43.03 | 1 | (r) | |
| NGC 7130 | 0.0162 | 43.53 | 1 | (r) | |
| MCG+06-49-019 | 0.0213 | 42.13 | 1 | (r) | |
| NGC 7319 | 0.0225 | 42.63 | 1 | (r) | |
| NGC 7582 | 0.0053 | 41.78 | 1 | (r) | |
| 2MASX J2330 | 0.037 | 43.13 | 1 | (r) | |
| PKS 2331-240 | 0.0477 | 43.86 | 1 | (r) | |
| PKS 2356-61 | 0.0963 | 44.23 | 1 | (r) |
(j) Dadina (2007), (k) Kara et al. (2017), (l) Tortosa et al. (2018), (m) Middei et al. (2020), (n) Ursini et al. (2020), (o) Middei et al. (2021), (p) Reeves et al. (2021), (q) Kamraj et al. (2018), (r) Baloković et al. (2020).
| Source | Flag | References | |||
|---|---|---|---|---|---|
| 2MASSJ16 | 1.86 | 45.93 | 1 | (b) | |
| B1422 | 3.62 | 45.5 | 1 | (b) | |
| APM 08279 | 3.91 | 45.8 | 1 | This work |
(b) L19.