The Hubble tension in the non-flat CDM model
Abstract
We investigate the Hubble tension in the non-flat CDM model. The non-flat CDM model extends the CDM model by including the spatial curvature as a free parameter. The CDM model extends the standard CDM model of cosmology through additional parameters accounting for the possible effect of a trispectrum in the primordial fluctuations. In the cosmic microwave background data, this effect can be parameterized using parameters that change the observed angular power spectrum from the theoretical power spectrum due to a trispectrum that couples long and short wavelength modes. In this work, we perform Markov Chain Monte Carlo (MCMC) data analysis on the recent Planck 2018 temperature and polarization fluctuations data and the local Hubble constant measurements from supernovae data assuming a non-flat CDM model. We find that there is a preference for non-zero values of the spatial curvature parameter and the CDM parameter at a level of improvement of approximately 23.
1 Introduction
The Planck 2018 temperature and polarization fluctuations data currently provide very tight constraints on the standard model of cosmology [1]. One of the important cosmological parameters that can be inferred from the Planck cosmic microwave background (CMB) fluctuations data is the Hubble constant [2], , the current expansion rate of the universe. The Planck 2018 temperature and polarization data, assuming the standard model, provide constraints () that are tighter than the direct measurements of the Hubble constant using Type Ia supernovae from the SH0ES collaboration () [3]. These measurements of the Hubble constant, , from the early and late universe disagree at more than [4]; see also [5], however. A more recent work from the SH0ES team [6] presents a tighter measurement of the Hubble constant at which brings the disagreement with the Planck CMB prediction to . This disagreement between the measurement of Hubble constant from Type Ia supernovae and that derived from CMB is a very active area of investigation in cosmology. It is possible that the resolution of the discrepancy can be due to currently unaccounted for systematic effects in one or more of the data sets that are used in the analyses. It is also possible that the resolution of the discrepancy comes through an extension to the cosmological model. See recent review articles [7, 8, 9] for discussions of several proposed solutions to the Hubble tension problem.
One potential solution to the Hubble tension was presented in [10]; it extends the model by allowing the primordial fluctuations to deviate from the assumption of Gaussianity. The extended model is called the model and it requires the primordial fluctuations that seed the CMB fluctuations have a deviation from Gaussianity. In [10], using Planck 2015 temperature fluctuations data, it was shown that the model can alleviate the Hubble tension; the model reduced the tension (), bud did not completely resolve it. Most of the potential solutions to the Hubble tension problem presented so far similarly fit this description: they are able to reduce the level of tension but unable to solve the tension completely.
It is therefore interesting to consider if we can add another parameter to the model on top of the additional parameter(s) of the model, and whether such an analysis can further alleviate the Hubble tension. We do such an analysis in this work by adding the spatial curvature as a free parameter in the model. We investigate parameter constraints on the spatial curvature and the parameters using the final Planck satellite CMB temperature+polarization data in combination with the Riess et. al 2020 Hubble constant measurement [3]. In the non-flat model, the expansion history of the universe depends on the curvature density parameter today () in addition to matter (), radiation () and dark energy () densities:
| (1) |
The model considers the effect of a primordial trispectrum on the observed angular power spectrum. In the presence of a trispectrum, it is possible that long-wavelength fluctuations modulate the small scale modes and therefore the observed power spectrum. The effect can be modeled by modifying the theoretical angular power spectrum () in the following manner [10]:
| (2) |
where and are additional parameters of the model, and are the angular power spectra evaluated by changing the spectral index from to with the other cosmological parameters fixed. It can be shown [10] that the effect of an additional modulation term such as on a pseudo- power spectrum estimator is equivalent to a non-Gaussian term in the covariance matrix due to a primordial trispectrum of the form [11]:
| (3) |
where is the power spectrum of potential fluctuations, s are the four wavenumbers of the trispectrum in momentum space such that and . A negative parameter (as is preferred by the data analysis presented later) means that the actual value of the amplitude of fluctuations is larger than what is inferred from CMB power spectra assuming . However, note that in the model the exact value of cannot be calculated given a trispectrum. Only the variance of i.e. can be calculated. As such, it is not easy to directly translate the constraints obtained on and parameters in this work to the trispectrum amplitude of the primordial trispectrum. The parameter in the primrodial trispectrum Eq. (3) is related to the mass of the additional scalar field in the quasi-single field model that generates the trispectrum [12, 13]. From Eq.(2), we can see that has degeneracy with the spectral index .
The modified angular power spectra in Eq.(2) are used to fit with the experimental angular power spectra. In the MCMC sampling, the cosmological parameters, the calibration parameters and the parameters are all sampled together. To calculate the theoretical power spectra, , we make use of camb [14, 15]. To sample the posterior parameter distribution, we use the cobaya [16] package and its implementation of the Metropolis sampler [17, 18, 19]. With the assumption that the long-wavelength modes that are responsible for the exact realization of both the temperature and polarization fluctuations of the Planck satellite data are mostly the same, we use a single parameter for all power spectra. The amount of overlap of these long-wavelength modes with the CMB lensing power spectra needs to be studied carefully, and as such, we will omit using the CMB lensing power spectra in this work.
There have been a few analyses so far that have added the spatial curvature as an additional parameter to the cosmological model and its extensions in the context of current discussions of cosmic parameter tensions [20, 21, 22, 23, 24, 25, 23, 26], but in most of the cosmological analyses the universe is assumed to be flat. It is known that the Planck-only data favors a negative value of at roughly [27]; this preference is not robust to addition of CMB lensing and BAO data [1].
2 Data Used
The main (most constraining) data we use are the Planck 2018 temperature and polarization fluctuations data. There are three separate likelihood calculations for these data, which are listed below. The descriptions of the Planck 2018 data and likelihoods are provided in [28]. Next, we use the Hubble constant measurement from the SH0ES collaboration [3], which disagrees with the derived from the Planck data at a significance greater than [4]. When we allow to vary, the CMB-only (Planck) data does not constrain very well. Therefore, our main result compares the MCMC results for two models ( and non-flat ) when all of the following data sources are used:
-
1.
Planck 2018 low temperature multipoles - planck_2018_lowl.TT
-
2.
Planck 2018 low polarization multipoles - planck_2018_lowl.EE
-
3.
Planck 2018 high temperature and polarization multipoles - planck_2018_highl_plik.TTTEEE
-
4.
SH0ES Hubble constant measurement - H0.riess2020 [3]
-
5.
Pantheon Supernova data - SN.pantheon [29]
The Pantheon sample consists of 1048 type Ia supernovae distance measurements in the redshift range [29]. We can add the Pantheon supernova data to our analysis without making any change to the available Pantheon likelihood. This is because the model prediction of distance measurements only depend on background parameters: , , , and , and not on the additional parameters and . We omit some cosmological datasets such as the Baryon Acoustic Oscillation (BAO) and CMB lensing for which detailed understanding of the theoretical prediction of the model is lacking. It will be interesting to check whether the result we obtain in this work holds when BAO and CMB lensing predictions for model are worked out and the relevant data are included.
In addition to the comparison of and non-flat , we will also briefly discuss MCMC results for the non-flat model, in which is allowed to be a free parameter in addition to the six cosmological parameters.
| Parameter | Best-fit | Constraint (68%) | 99.7% Range |
| [-0.299, -0.040] | |||
| [-0.0003, 0.0140] | |||
| [68.72, 75.85] | |||
| [0.2454, 0.3009] | |||
| [1.04008, 1.04206] | |||
| [0.02210, 0.02310] | |||
| [3.078, 3.375] | |||
| [0.9043, 0.9787] | |||
| [-0.334, 0] |
3 Results
In Table 1, we list 1D marginalized posterior constraints for several parameters of the model. The second column gives the best-fit parameter values whereas the third column gives the posterior mean values with the corresponding one standard deviation constraint on a parameter. The table, in the third column, lists the three standard deviation range of posterior values for each of the parameters.
3.1 Constraint on parameters
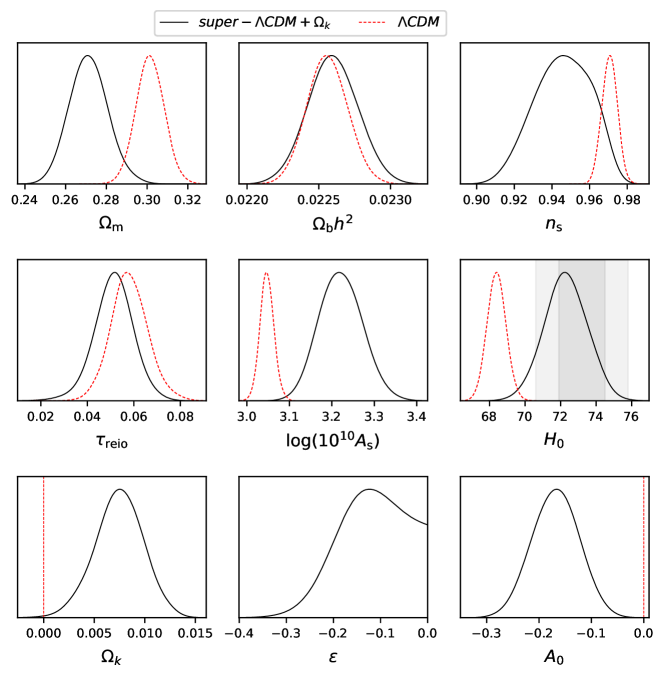
In Figure 1, we show 1D marginalized posterior distribution for six parameters for our MCMC results from both (red dashed) and (black solid) models. Large parameter shifts occur for the Hubble constant (), which is desired as our study of the non-flat model is motivated to solve the Hubble tension. When the spatial curvature is made a free parameter, the Planck and Pantheon data do not simultaneously constrain and parameters; the situation improves when the SH0ES Hubble constant measurement is included and the combined data set prefers a higher value of the Hubble constant in the non-flat model: .
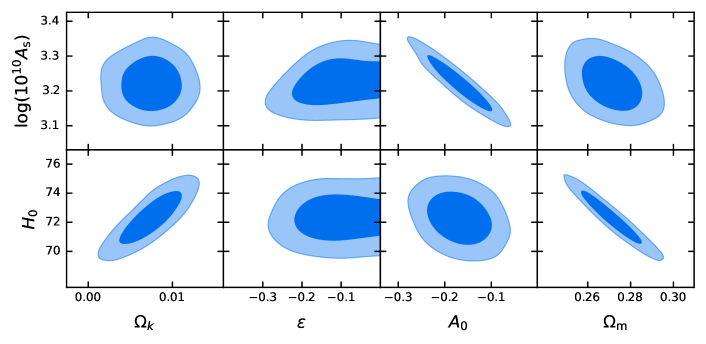
With a shift in the expansion rate to a higher value, there is a corresponding shift in the matter density to a lower value in the non-flat model: . The strong degeneracy between the Hubble constant and the matter density can be seen in the 2D posterior probability density plot of Figure 2.
There is also a preference in the non-flat model for the amplitude of fluctuations and therefore to a higher value than in the model; see Figure 1. This behavior is consistent with the previous work in [10] and is due to the preference for a negative value of the parameter ; the strong degeneracy between and can be seen in Figure 2.
3.2 1D Marginalized constraint on and
The constraint on , marginalized over all other parameters, is . Compared to the constraint in [10] where the parameter was fixed to zero, the marginalized constraint on in this work is tighter — preferring non-zero value of at approximately even when marginalized over all other parameters. The 1D marginalized posterior distribution of the three new parameters in the extended model (, and ) is shown in Figure 1 (bottom panel). Note that the data we used do not constrain the scale parameter of the model very well. The 1D marginalized constraint on is , with a preference for a non-zero value of spatial curvature at slightly less than once we account for the non-Gaussian nature of the 1D marginalized distribution. The posteriors for and are not significantly correlated. Next, we discuss how their joint posterior probability distribution significantly excludes the values of .
3.3 2D Posterior distribution on
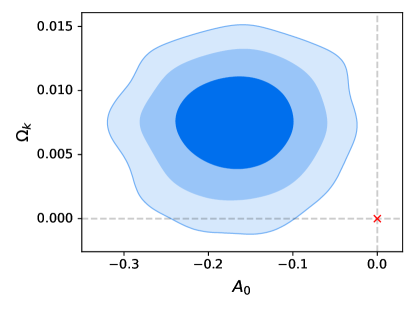
In Figure 3, we show the 2D posterior probability distribution for parameters produced in the non-flat fit using the data. In the figure, the dashed lines show the value of these parameters in the standard model i.e. and . The value in the 2D plane is shown as a red cross at . As can be seen in the figure, the value is outside the () confidence contour. If we add a confidence contour in Figure 3 which corresponds to about , the value (red cross) still lies comfortably outside the contour. However, we start to observe that the contour has a noisier shape indicating that we need a larger sample of MCMC points to make robust inference at confidence level; therefore, we do not plot beyond the confidence contour.
4 Discussion
We now discuss the improvement in fits in the non-flat model compared to the flat model. The model fit improvement of the non-flat model over model for our data combination is substantial: . But it is important to check whether the improvement in overall fit of the data occurs at the expense of significantly reducing the quality of fit to a subset of the data.
| Likelihood | non-flat | non-flat | flat | flat (Planck only) | flat (Planck+SH0ES) |
|---|---|---|---|---|---|
| planck_2018_lowl.TT | 21.43 | 23.67 | 22.10 | 23.26 | 22.40 |
| planck_2018_lowl.EE | 395.75 | 396.52 | 396.02 | 396.05 | 397.61 |
| planck_2018_highl_plik.TTTEEE | 2338.82 | 2350.32 | 2349.14 | 2344.6 | 2349.74 |
| H0.riess2020 | 0.74 | 1.75 | 13.93 | - | 15.71 |
| SN.pantheon | 1036.08 | 1035.33 | 1034.76 | - | - |
| Total | 3792.82 | 3807.59 | 3815.95 | - | - |
| (relative to flat ) | -23.1 | -8.4 | 0 | - | - |
In Table 2, we list and compare the of fits for different models and data. In the table we can see if any improvement in fits is largely driven by one of the data at the expense of significantly degrading the quality of fit to other data. Comparing the of fits for the non-flat (second column in Table 2) with the of fits for the flat (fourth column in Table 2), it is clear that the non-flat model’s large improvement in fit of the data does not deteriorate individual Planck temperature and polarization likelihood fits. The large improvement in is also consistent with the the 2D posterior plot shown in Figure 3, in which we can observe that the combination of data prefers a non-zero value of at a statistical significance exceeding . We note, however, that the preference for non-zero is for the sign opposite to what is found with the -only data in the model in [27], which finds a preference for whereas our analysis with a different data combination finds a preference for .
The mild preference of the Planck CMB data for negative in the model seems to come from its ability to better fit the apparent larger lensing effect in the temperature data (sometimes parameterized by the phenomenological parameter) in addition to the better fit to the low- temperature data [1]. However, those fits were done without adding the SH0ES data. In the fits with Planck+SH0ES+Pantheon data, we find an improvement in fit in the model over the model by , but with a preference for . As can be seen in Table 2, most of the improvement in fit is due to better fitting the SH0ES data, while the fit to the Planck CMB data worsens by (compared to flat using Planck-only data). This is not desirable and points to the fact that the two data sets are discrepant in the model. On the contrary, the non-flat model improves fitting of the Planck CMB data compared to the flat model (with Planck-only data) by .
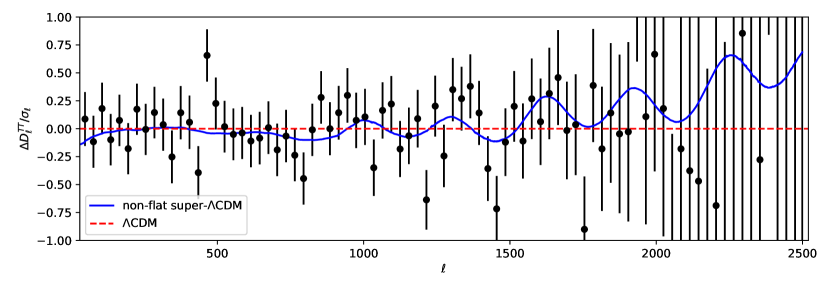
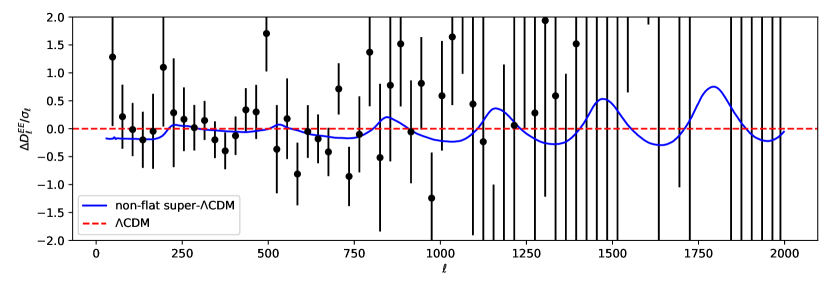
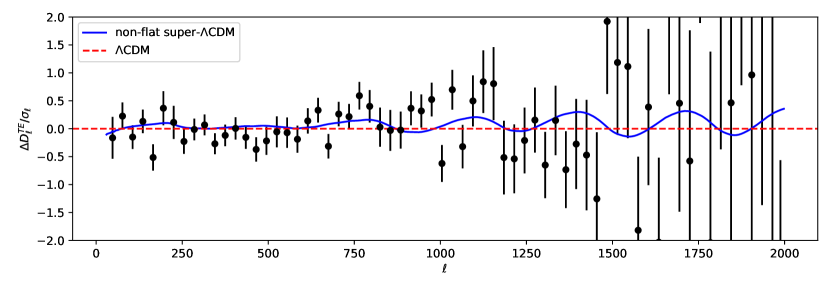
In Figure 4, we plot the residuals of Planck power spectrum data. The residuals of for and spectra are calculated with respect to the corresponding best-fit Planck 2018 Planck spectra provided by the Planck Colaboration111COM_PowerSpect_CMB-base-plikHM_TTTEEE-lowl-lowE-lensing-minimum-theory_R3.01.txt and plotted after normalizing by the cosmic variance for each multipole. In the figure we also plot the corresponding residuals of the best-fit non-flat power spectra; the best-fit model parameters used can be found in Table 1. For the spectra, we can observe that the non-flat model captures some of the oscillatory features of the data residuals () leading to an improvement in CMB .
5 Summary
In this work, we present a concrete example of how the Hubble tension could be a hint of two different extensions to the standard model. We find that a non-flat model can significantly alleviate the Hubble tension. We find that the model greatly improves the fit to the combination of Planck temperature plus polarization, the local measurement of the Hubble constant, and the Pantheon supernovae distance measurements. With three extra model parameters, the fit improvement of the model with respect to the standard for the data combination Planck + SH0ES + Pantheon is found to be . The Hubble constant value preferred is larger compared to the Planck-only derived Hubble constant. We find that the better fit is obtained without degrading the fit to the Planck likelihood.
Acknowledgments
The computational work necessary for this paper was done using a Google Cloud Research Credits program with the award GCP19980904. The author would like to thank the anonymous referee for useful comments that has improved the content and presentation of the paper.
References
- [1] N. Aghanim, et al., Planck 2018 results. VI. Cosmological parameters, Astron. Astrophys. 641 (2020) A6, [Erratum: Astron.Astrophys. 652, C4 (2021)]. arXiv:1807.06209, doi:10.1051/0004-6361/201833910.
- [2] W. L. Freedman, B. F. Madore, The Hubble Constant, Ann. Rev. Astron. Astrophys. 48 (2010) 673–710. arXiv:1004.1856, doi:10.1146/annurev-astro-082708-101829.
- [3] A. G. Riess, S. Casertano, W. Yuan, J. B. Bowers, L. Macri, J. C. Zinn, D. Scolnic, Cosmic Distances Calibrated to 1% Precision with Gaia EDR3 Parallaxes and Hubble Space Telescope Photometry of 75 Milky Way Cepheids Confirm Tension with CDM, Astrophys. J. Lett. 908 (1) (2021) L6. arXiv:2012.08534, doi:10.3847/2041-8213/abdbaf.
- [4] L. Verde, T. Treu, A. G. Riess, Tensions between the Early and the Late Universe, Nature Astron. 3 (2019) 891. arXiv:1907.10625, doi:10.1038/s41550-019-0902-0.
- [5] W. L. Freedman, Measurements of the Hubble Constant: Tensions in Perspective, Astrophys. J. 919 (1) (2021) 16. arXiv:2106.15656, doi:10.3847/1538-4357/ac0e95.
- [6] A. G. Riess, et al., A Comprehensive Measurement of the Local Value of the Hubble Constant with 1 km/s/Mpc Uncertainty from the Hubble Space Telescope and the SH0ES Team (12 2021). arXiv:2112.04510.
- [7] E. Mörtsell, S. Dhawan, Does the Hubble constant tension call for new physics?, JCAP 09 (2018) 025. arXiv:1801.07260, doi:10.1088/1475-7516/2018/09/025.
- [8] E. Di Valentino, O. Mena, S. Pan, L. Visinelli, W. Yang, A. Melchiorri, D. F. Mota, A. G. Riess, J. Silk, In the realm of the Hubble tension—a review of solutions, Class. Quant. Grav. 38 (15) (2021) 153001. arXiv:2103.01183, doi:10.1088/1361-6382/ac086d.
- [9] N. Schöneberg, G. Franco Abellán, A. Pérez Sánchez, S. J. Witte, V. Poulin, J. Lesgourgues, The Olympics: A fair ranking of proposed models (7 2021). arXiv:2107.10291.
- [10] S. Adhikari, D. Huterer, Super-CMB fluctuations and the Hubble tension, Phys. Dark Univ. 28 (2020) 100539. arXiv:1905.02278, doi:10.1016/j.dark.2020.100539.
- [11] V. Assassi, D. Baumann, D. Green, On Soft Limits of Inflationary Correlation Functions, JCAP 11 (2012) 047. arXiv:1204.4207, doi:10.1088/1475-7516/2012/11/047.
- [12] X. Chen, Y. Wang, Large non-Gaussianities with Intermediate Shapes from Quasi-Single Field Inflation, Phys. Rev. D 81 (2010) 063511. arXiv:0909.0496, doi:10.1103/PhysRevD.81.063511.
- [13] X. Chen, Y. Wang, Quasi-Single Field Inflation and Non-Gaussianities, JCAP 04 (2010) 027. arXiv:0911.3380, doi:10.1088/1475-7516/2010/04/027.
-
[14]
A. Lewis, A. Challinor, A. Lasenby,
Efficient computation of CMB
anisotropies in closed FRW models, Astrophys. J. 538 (2000) 473–476.
arXiv:astro-ph/9911177, doi:10.1086/309179.
URL https://arxiv.org/abs/astro-ph/9911177 - [15] C. Howlett, A. Lewis, A. Hall, A. Challinor, CMB power spectrum parameter degeneracies in the era of precision cosmology, JCAP 04 (2012) 027. arXiv:1201.3654, doi:10.1088/1475-7516/2012/04/027.
- [16] J. Torrado, A. Lewis, Cobaya: Code for Bayesian Analysis of hierarchical physical models, JCAP 05 (2021) 057. arXiv:2005.05290, doi:10.1088/1475-7516/2021/05/057.
- [17] A. Lewis, S. Bridle, Cosmological parameters from CMB and other data: A Monte Carlo approach, Phys. Rev. D 66 (2002) 103511. arXiv:astro-ph/0205436, doi:10.1103/PhysRevD.66.103511.
- [18] A. Lewis, Efficient sampling of fast and slow cosmological parameters, Phys. Rev. D 87 (10) (2013) 103529. arXiv:1304.4473, doi:10.1103/PhysRevD.87.103529.
-
[19]
R. M. Neal, Taking Bigger
Metropolis Steps by Dragging Fast Variables, ArXiv Mathematics e-prints
(Feb. 2005).
arXiv:math/0502099.
URL https://arxiv.org/abs/math/0502099 - [20] W. Yang, S. Pan, E. Di Valentino, O. Mena, A. Melchiorri, 2021- Odyssey: Closed, Phantom and Interacting Dark Energy Cosmologies, JCAP 10 (2021) 008. arXiv:2101.03129, doi:10.1088/1475-7516/2021/10/008.
- [21] E. Di Valentino, A. Melchiorri, J. Silk, Investigating Cosmic Discordance, Astrophys. J. Lett. 908 (1) (2021) L9. arXiv:2003.04935, doi:10.3847/2041-8213/abe1c4.
- [22] S. Vagnozzi, E. Di Valentino, S. Gariazzo, A. Melchiorri, O. Mena, J. Silk, The galaxy power spectrum take on spatial curvature and cosmic concordance, Phys. Dark Univ. 33 (2021) 100851. arXiv:2010.02230, doi:10.1016/j.dark.2021.100851.
- [23] M. Shimon, Y. Rephaeli, Parameter interplay of CMB temperature, space curvature, and expansion rate, Phys. Rev. D 102 (8) (2020) 083532. arXiv:2009.14417, doi:10.1103/PhysRevD.102.083532.
- [24] B. Bose, L. Lombriser, Easing cosmic tensions with an open and hotter universe, Phys. Rev. D 103 (8) (2021) L081304. arXiv:2006.16149, doi:10.1103/PhysRevD.103.L081304.
- [25] T. Tröster, et al., KiDS-1000 Cosmology: Constraints beyond flat CDM, Astron. Astrophys. 649 (2021) A88. arXiv:2010.16416, doi:10.1051/0004-6361/202039805.
- [26] W. Handley, Curvature tension: evidence for a closed universe, Phys. Rev. D 103 (4) (2021) L041301. arXiv:1908.09139, doi:10.1103/PhysRevD.103.L041301.
- [27] E. Di Valentino, A. Melchiorri, J. Silk, Planck evidence for a closed Universe and a possible crisis for cosmology, Nature Astron. 4 (2) (2019) 196–203. arXiv:1911.02087, doi:10.1038/s41550-019-0906-9.
- [28] N. Aghanim, et al., Planck 2018 results. V. CMB power spectra and likelihoods, Astron. Astrophys. 641 (2020) A5. arXiv:1907.12875, doi:10.1051/0004-6361/201936386.
- [29] D. M. Scolnic, et al., The Complete Light-curve Sample of Spectroscopically Confirmed SNe Ia from Pan-STARRS1 and Cosmological Constraints from the Combined Pantheon Sample, Astrophys. J. 859 (2) (2018) 101. arXiv:1710.00845, doi:10.3847/1538-4357/aab9bb.
- [30] A. G. Riess, S. Casertano, W. Yuan, L. M. Macri, D. Scolnic, Large Magellanic Cloud Cepheid Standards Provide a 1% Foundation for the Determination of the Hubble Constant and Stronger Evidence for Physics beyond CDM, Astrophys. J. 876 (1) (2019) 85. arXiv:1903.07603, doi:10.3847/1538-4357/ab1422.