A Rich Satellite Population of the NGC 4437 Group and
Implications of a Magnitude Gap for Galaxy Group Assembly History
Abstract
Both observations and cosmological simulations have recently shown that there is a large scatter in the number of satellites of Milky Way (MW)-like galaxies. In this study, we investigate the relation between the satellite number and galaxy group assembly history, using the band magnitude gap () between the first and the second brightest galaxy as an indicator. From 20 deg2 of Hyper Suprime-Cam Subaru Strategic Program Wide layer, we identify 17 dwarf satellite candidates around NGC 4437, a spiral galaxy with about one-fourth of the MW stellar mass. We estimate their distances using the surface brightness fluctuation (SBF) method. Then we confirm five candidates as members of the NGC 4437 group, resulting in a total of seven group members. Combining the NGC 4437 group (with mag) with other groups in the literature, we find a stratification of the satellite number by for a given host stellar mass. The satellite number for given host stellar mass decreases as increases. The same trend is found in simulated galaxy groups in IllustrisTNG50 simulations. We also find that the host galaxies in groups with a smaller (like NGC 4437) have assembled their halo mass more recently than those in larger gap groups, and that their stellar-to-halo mass ratios (SHMRs) increase as increases. These results show that the large scatter in the satellite number is consistent with a large range of , indicating diverse group assembly histories.
1 Introduction
In the CDM paradigm, galaxies form in the center of dark matter halos and evolve through hierarchical merging and accretion. Smaller halos that are accreted into larger halos and become gravitationally bound are called subhalos, which observationally correspond to the satellite galaxies. It is inferred that the more massive the dark matter halos are, the more abundant the satellite systems are.
This structure formation model has been tested by comparing observations with simulations. The well-known “Missing Satellites” problem (Klypin et al., 1999; Moore et al., 1999) is an example. With dark matter-only cosmological simulations, Milky Way (MW)-like halos in the CDM scenario are predicted to have far more satellites than observed around the MW and it is considered as one of the “small-scale” challenges to CDM (see Bullock & Boylan-Kolchin, 2017, and references therein). This motivated numerous studies of individual satellite systems, to find out whether the MW satellite population is representative among them, from the Local Volume (LV; D 11Mpc) host galaxies (e.g. M31 (see Martin et al., 2016; McConnachie, 2012; McConnachie et al., 2018, for compiled data), M81 (Chiboucas et al., 2009, 2013), NGC 5128 (Centaurus A) (Crnojević et al., 2014, 2019; Müller et al., 2017, 2019), M94 (Smercina et al., 2018), M101 (Danieli et al., 2017; Bennet et al., 2017, 2019; Carlsten et al., 2019a), NGC 4258 (M106) (Spencer et al., 2014; Kim et al., 2011), NGC 628 (Davis et al., 2021)) to those in farther distances (NGC 3175 (Kondapally et al., 2018), NGC 2950 and NGC 3245 (Tanaka et al., 2018)).
In more recent years, statistical studies of satellites around MW-like galaxies have been carried out (Carlsten et al., 2020a, b, 2021; Wang et al., 2021; Geha et al., 2017; Habas et al., 2020; Mao et al., 2021; Roberts et al., 2021). Among them Carlsten et al. (2021) presented a study of a large sample of dwarf satellite systems around 12 LV host galaxies within the projected distance to their host galaxy () of 150 kpc, to which surface brightness fluctuation (SBF) or the tip of the red giant branch (TRGB) distances are measured. They found that the MW satellite luminosity function is typical among other MW-like LV hosts.
At farther distances beyond the LV, while it is more difficult to identify and confirm membership of faint galaxies, clear advantages exist: there are a larger number of MW-like galaxies and a smaller field of view is sufficient to survey the entire virial volume. Among others, the SAGA survey (Geha et al., 2017; Mao et al., 2021) presented a study of spectroscopically confirmed satellites with a homogeneous spatial and photometric completeness. The SAGA Stage II (Mao et al., 2021) presented 127 satellites within kpc around 36 MW-like hosts at distance 25 Mpc 40.75 Mpc. They suggested that the number of satellites ( mag) of the MW-like hosts is remarkably varied, from zero to nine. In their sample, the MW has a typical number of satellites.
Meanwhile, several theoretical studies found that baryonic cosmological simulations produce fewer observable satellites around MW-like hosts compared with previous simulation studies, which is consistent with observations (Wetzel et al., 2016; Garrison-Kimmel et al., 2019; Fattahi et al., 2016; Sawala et al., 2016; Font et al., 2021). Also, the diversity of satellite number was shown by Engler et al. (2021) who studied satellite systems of 198 MW-like hosts found in IllustrisTNG50 (Nelson et al., 2019).
Thus, there is growing consensus between observations and simulations that the number of satellites of the MW is typical among other observed and simulated systems. Besides, a large scatter in the number of satellites is recognized from both approaches.
One of the causes of the large scatter might be diverse galaxy assembly histories. In the hierarchical structure formation scenario, it is expected that an early-formed system would have already cannibalized its massive satellite galaxies, if existed. Therefore, the early-formed system would likely have a small number of satellite galaxies with the central galaxy dominating the brightness of the group. Indeed, Mao et al. (2021) noted that MW-mass galaxy groups with massive satellites in the SAGA survey have a larger number of satellites. In addition, Smercina et al. (2021) found a tight relationship between the mass of a galaxy’s most dominant merger and its number of satellites, using stellar halo and satellite properties of eight nearby MW-like galaxies. As a metric for the galaxy’s most dominant merger, they used either the total accreted stellar mass or the mass of the most massive satellite.
In this view, a magnitude difference, or a magnitude gap () between the brightest and the second brightest galaxy gives useful information about galaxy assembly history. A galaxy group with a large magnitude gap is likely to have assembled its mass at an early epoch. Indeed, fossil groups, which are massive groups observationally selected on the basis of band magnitude gap, mag and X-ray luminosity (Jones et al., 2003), are considered to have assembled their mass earlier than non-fossil groups (D’Onghia et al., 2005) or have lacked recent infall of new massive satellites (Kundert et al., 2017) (See Aguerri & Zarattini (2021) for a recent review on fossil groups). Note that is largely varied among nearby galaxy groups. While the M81 group has a massive satellite M82 and thus has a small gap, mag (calculated from de Vaucouleurs et al., 1991), the M94 group has only faint satellites in its virial volume and thus has a very large gap, mag (Smercina et al., 2018).
However, only a few studies have examined the observational evidence of the anticorrelation between the magnitude gap and the number of satellites (Hearin et al., 2013; Wang et al., 2021). Hearin et al. (2013) found that SDSS groups with small magnitude gaps ( mag) have a richer satellite system than large-gap groups ( mag) at fixed velocity dispersion among group members as a mass proxy , at about MW-mass range. They used a volume-limited galaxy group catalog complete down to absolute band magnitude mag identified in Data Release 7 of the SDSS. Therefore, their sample does not contain large-gap groups with the second brightest galaxy fainter than mag. This criteria would exclude most of the nearby galaxy groups with low mass. In addition, Wang et al. (2021) suggested that MW-mass galaxy groups with magnitude gaps smaller than one mag have richer satellite systems than those with larger magnitude gaps. However, most nearby galaxies have magnitude gaps larger than one mag. Therefore, to understand any relation between the magnitude gap and a large scatter in satellite number among nearby MW-like galaxies, more observations of nearby satellite systems with various magnitude gaps as well as comparisons with simulations are required.
Here we study satellite populations of the NGC 4437 group, which has a relatively small magnitude gap ( mag) among nearby galaxy groups but larger than the previously studied regime. Then we compare the NGC 4437 group with those of other nearby galaxy groups as well as with mock galaxy groups from cosmological simulations.
NGC 4437 (=NGC 4517) is a LV spiral galaxy ( mag, Mpc) with about one fourth the stellar mass of the MW, forming a pair with NGC 4592 which is a Large Magellanic Cloud (LMC)-mass dwarf spiral galaxy ( mag, Mpc) (Kim et al., 2020). See Table 1 for the basic information of the two spiral galaxies. Although various surveys have detected several faint galaxies around NGC 4437 and NGC 4592, their relationship with these spiral galaxies was not defined except CGCG 014-054, a late-type dwarf galaxy at a Tully-Fisher distance Mpc that was grouped together with the two galaxies by Karachentsev & Nasonova (2013).
In this study, we surveyed a wide area around NGC 4437 in the WIDE layer of Hyper Suprime-Cam Subaru Strategic Program (HSC-SSP, Aihara et al., 2018) and found 17 dwarf satellite candidates. To distinguish them from background galaxies in the Virgo cluster ( Mpc (Mei et al., 2007)), we checked their membership by measuring their SBF distances. In doing so, we present a spatially complete list of confirmed satellite galaxies around NGC 4437, complete down to mag.
This paper is structured as follows. In Section 2, we describe the HSC data and our detection of dwarf satellite candidates. In §3, we present SBF distances to the dwarf satellite candidates and discuss their membership in the NGC 4437 group. In §4, we describe the spatial distribution of the NGC 4437 group in comparison with simulated galaxy groups in the IllustrisTNG50 cosmological simulation. In §5, we discuss environmental properties and the correlations between the magnitude gap, number of member galaxies, and assembly history of low-mass galaxy groups. In the final section, we summarize our main results.
2 Data and Dwarf Satellite Galaxy Survey
We use the - and -band imaging data from the second public data release (Aihara et al., 2019) for the Wide layer of the HSC-SSP (Aihara et al., 2018), to search for dwarf satellite candidates around NGC 4437. The HSC is a wide-field optical imager mounted on the 8.2m Subaru telescope. The survey consists of three layers, Wide, Deep, and UltraDeep with a photometric depth of 26, 27, and 28 mag, respectively.
The images from the HSC-SSP are fully reduced, sky subtracted, and coadded with the pipeline hscPipe designed for the LSST (Bosch et al., 2018; Ivezić et al., 2019). In hscpipe v6, astrometric and photometric calibrations were performed against the Pan-STARRS1 DR1 catalog (Aihara et al., 2019). Sky subtraction was carried out by two steps and Aihara et al. (2019) showed that the technique preserves low surface brightness features better than previous versions of hscpipe. The pixel scale of HSC images is 0.168″ per pixel. The average seeing is 0.58″ in i-band and 0.77″ in g-band.
NGC 4437 is located in the WIDE12H field, one of the Wide layers of the survey. We first visually inspected the 5°4°( 0.8 Mpc 0.6 Mpc at the distance of NGC 4437) area centered on NGC 4437 to search for extended objects. We restricted our search to galaxies larger than (450 pc at the distance of NGC 4437) by visual diameter extent because applying the SBF techniques to smaller low surface brightness galaxies would result in an insufficient S/N. Also, we ruled out galaxies that show visually too small SBFs to be at a distance of about 9 Mpc.
Due to the proximity to the Virgo cluster in the sky (°), some Virgo members may be included in this area. Among the objects of which a radial velocity can be found in NASA Extragalactic Database (NED), we excluded galaxies that have a relative radial velocity with respect to NGC 4437 km s-1. As a result, we selected Dw1, Dw3, Dw4, Dw6, Dw7, Dw12, Dw13, Dw14, Dw15, and Dw16 as our initial sample. The selected satellite candidates with velocity measurements are Dw1, Dw3, Dw4, Dw6, and Dw13 (Figure 1 and Table 2). If an object does not have a velocity measurement, we consider it as a satellite candidate.
Then we performed a semi-automated detection following Carlsten et al. (2020a) to detect low surface brightness galaxies and estimate the completeness of our search. In this process, we added Dw2, Dw5, Dw8, Dw9, Dw10, Dw11, and Dw17 to the sample.
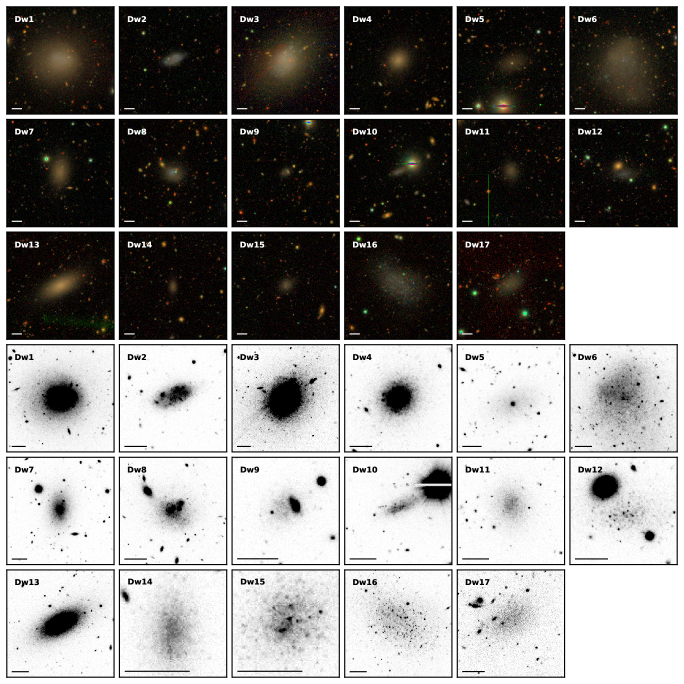
As a result, we find 17 candidate galaxies that vary in size, surface brightness, and morphology. Their locations are shown in Figure 2. Table 2 lists basic information of our candidate galaxies. The coordinates and heliocentric velocities are obtained from NASA Extragalactic Database (NED). We derived photometric properties of these galaxies from AUTO magnitudes obtained using Source Extractor (Bertin & Arnouts, 1996) to the HSC images. The faintest object in band is Dw8, with mag (which would correspond to mag assuming the distance of the NGC 4437). The color range of our candidate galaxies is .
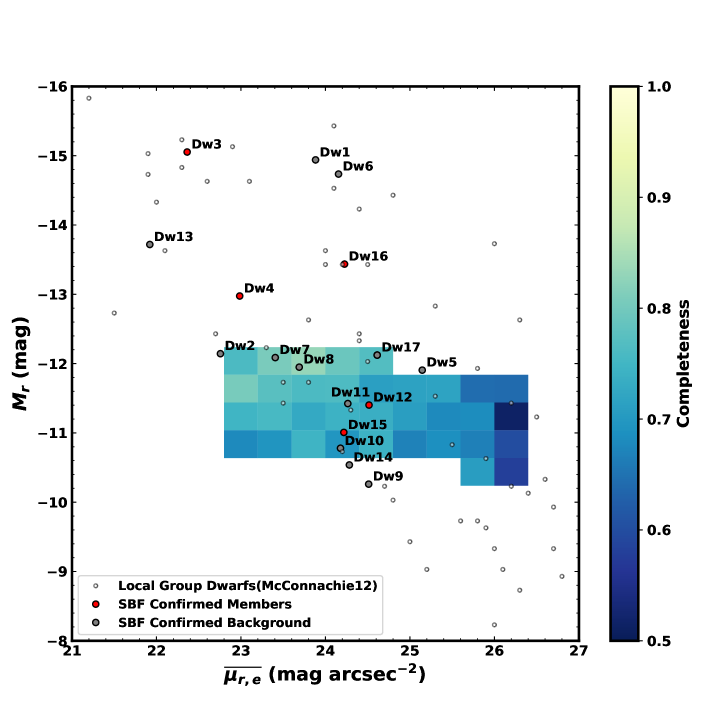
To check if our survey is complete, we injected 20,000 artificial galaxies of various structural parameters ( mag and ) randomly into the survey field and performed semi-automated detection to find the recovery rate. We assume that our automated detection and visual search are complete for galaxies brighter than this range. Figure 3 shows a completeness map in -band absolute magnitude and average surface brightness within the effective radius of our sample galaxies. For comparison, dwarf galaxies in the Local Group from McConnachie (2012) are displayed as gray circles. Locations of our sample galaxies are overlapped with those of the Local Group dwarf galaxies. The recovery rates (completeness) are indicated as colors. In general, completeness decreases as the surface brightness decreases or the total magnitude becomes fainter. More than 70% of artificial galaxies with mag arcsec-1 and mag are recovered.
| Name | R.A. | Decl. | Vhelioa | DTRGBb | c | d | e | f | Morphologyg |
|---|---|---|---|---|---|---|---|---|---|
| (deg) | (deg) | (km s-1) | (Mpc) | (mag) | (mag) | () | (kpc) | ||
| NGC 4437 | 167 | SA(s)cd | |||||||
| NGC 4592 | 110 | SA(s)dm |
Note. — a From recent measurements in NED.
b Kim et al. (2020)
c NGC 4437: from Jarrett et al. (2003), NGC 4592: AUTO magnitude we measured from 2MASS images using SExtractor.
d NGC 4437: converted from mag (Total face-on magnitude; de Vaucouleurs et al., 1991) using (Engler et al., 2021), NGC 4592: AUTO magnitude measured from HSC images using SExtractor.
e Calculated assuming . Note that (Carlsten et al., 2021).
f Calculated using the versus relation obtained from IllustrisTNG50: .
g de Vaucouleurs et al. (1991).
| Id | R.A. | Decl. | Vhelio | texp(/) | Morphology | ||||||
|---|---|---|---|---|---|---|---|---|---|---|---|
| (deg) | (deg) | (km s-1) | (mag) | (mag) | (mag) | (mag) | (″) | (mag ) | (s) | ||
| Dw1 | 1170/2430 | Tr | |||||||||
| Dw2 | 1170/1830 | Ir | |||||||||
| Dw3 | 1290/1060 | Tr | |||||||||
| Dw4 | 1192 | 1740/2070 | Sph | ||||||||
| Dw5 | 1590/3060 | Sph | |||||||||
| Dw6 | 750 | 1590/2460 | Tr | ||||||||
| Dw7 | 1740/2260 | Sph | |||||||||
| Dw8 | 1020/1230 | Tr | |||||||||
| Dw9 | 1170/1830 | Sph | |||||||||
| Dw10 | 1890/2060 | Ir | |||||||||
| Dw11 | 1590/1460 | Sph | |||||||||
| Dw12 | 1020/1230 | Ir | |||||||||
| Dw13 | 1890/1060 | Sph | |||||||||
| Dw14 | 1740/1660 | Sph | |||||||||
| Dw15 | 2460/1490 | Sph | |||||||||
| Dw16 | 2460/1090 | Ir | |||||||||
| Dw17 | 1170/1030 | Sph |
Note. — Galaxy References. Dw1: 2dFGRS N320Z113 (Metcalfe et al., 1989), Dw2: APMUKS(BJ) B122737.31+010900.4 (Maddox et al., 1990), Dw3: CGCG 014-054 (Zwicky et al., 1961), Dw4: MGC 34050 (Liske et al., 2003), Dw5: APMUKS(BJ) B123007.66-002012.9 (Maddox et al., 1990), Dw6: UGCA 285 (Karachentseva, 1968), Dw7: APMUKS(BJ) B123035.83-000559.0 (Maddox et al., 1990), Dw10: SDSS J123506.51-004736.7 (SDSS Data Release 6), Dw11: SDSS J123611.78+004313.7 (SDSS Data Release 6), Dw12: APMUKS(BJ) B123408.34-000920.0 (Maddox et al., 1990), Dw13: MGC 35222 (Liske et al., 2003), Dw14: SDSS J123753.44-003602.6 (SDSS Data Release 6), Dw15: APMUKS(BJ) B123615.42-001923.4 (Maddox et al., 1990), Dw16: KDG 171 (Karachentseva, 1968), Dw17: MGC 36065 (Liske et al., 2003)
Note. — R.A., Decl., and Vhelio are from NED recent values. Magnitudes are obtained from AUTO magnitude of SExtractor photometry. Magnitude errors include calibration error 0.017 mag (Aihara et al., 2019). indicates average -band surface brightness in half-light radius. Morphology indicates dwarf galaxy morphological types classified by our visual inspection, following Karachentsev et al. (2013) (Sph for spheroidal galaxies, Ir for irregular galaxies, and Tr for transition types between spheroidals and irregulars.)
For the following analysis, we adopt the AB magnitude in the HSC system which is similar to SDSS and CFHT systems (see Kim & Lee, 2021). We correct for foreground reddening on each galaxy based on the extinction maps by Schlegel et al. (1998) and the conversion coefficients obtained by Schlafly & Finkbeiner (2011), and use a subscript 0 for corrected values.
3 Group membership Confirmation Using SBF Distances
3.1 SBF Measurement
While SBF techniques have been widely used for measuring distances to bright early-type semi-resolved galaxies (e.g., Tonry & Schneider, 1988; Jerjen et al., 2000; Mei et al., 2005; Mieske et al., 2007; Cantiello et al., 2018; Blakeslee et al., 2021), recent studies have shown that SBF techniques are also useful for measuring distances to dwarf galaxies with various morphological types (Carlsten et al., 2019b, 2021; Kim & Lee, 2021). Subtracting the contributions from contaminating sources is trickier in the dwarf regime, but with a statistical approach for background subtraction (Carlsten et al., 2019b) and using a band masking threshold (Kim & Lee, 2021), one can derive reliable distances to dwarf galaxies.
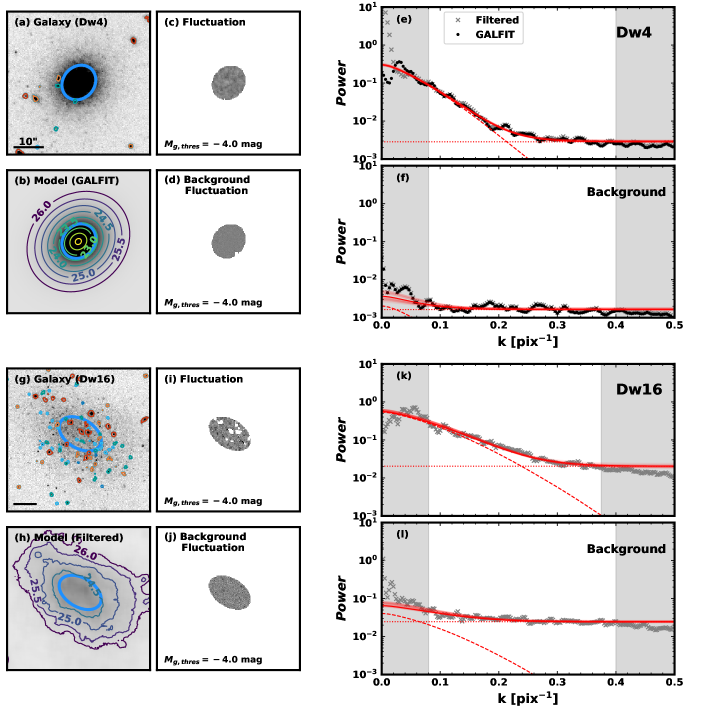
In order to estimate the distances to the satellite candidate galaxies and confirm their group membership, we measure SBF magnitudes of the candidate galaxies following the methods described in Kim & Lee (2021). Here we briefly introduce the main steps of the SBF method and show examples of a dwarf spheroidal galaxy Dw4 and a blue, asymmetric irregular galaxy Dw16 in Figure 4.
In a nutshell, the SBF technique measures a PSF-scale fluctuation (dashed-line components in right panels of Figure 4) in Fourier domain of the fluctuation image, (Figure 4(c) and (i)), where Galaxy denotes the observed galaxy image (Figure 4(a) and (g)) and Model corresponds to the smooth galaxy light component (Figure 4(b) and (h)). For making smooth galaxy models, we use GALFIT (Peng et al., 2002) for the galaxies which are well described by a single Sérsic model or use median filtered images for the galaxies with an asymmetric morphology or star forming regions, with the filter size set to ten times the seeing size, following Kim & Lee (2021). Using such a filter size, the power spectra calculated using GALFIT and median filtered image (e.g. black dots and gray crosses in Figure (e)) agree very well except for the largest scale ( pix-1), which is not used for the power spectrum fitting.
We choose an optimal area for SBF calculation of a galaxy to minimize measurement errors. We measured the SBF using various annular masks (blue ellipses in Figure 4(a) and (g)) and selected an area based on the galaxy’s surface brightness and size. The size, color, and mean surface brightness of the selected areas are shown in Table 3. For early-type galaxies or low surface brightness galaxies, galaxy colors and fluctuation magnitudes do not depend significantly on the choice of area. In the case of Dw3, the inner and outer regions of the galaxy show different colors, indicating different stellar populations. Therefore, we divided the galaxy into an inner region and an outer region and calculated their SBFs separately.
For subtracting fluctuations from background sources, namely foreground stars and background galaxies, we measure the fluctuations in multiple background fields as described in Carlsten et al. (2019b), and subtract the median power. Panels (d) and (j) show examples of background fluctuations and panels (f) and (l) show the corresponding power spectra. In addition, in order to mask young stellar populations which result in stochastic effects, we mask all the sources brighter than a band masking threshold, . Kim & Lee (2021) showed that the rms of the SBF calibration is the smallest in the case of mag, among the five masking thresholds and mag.
However, without prior information of distance, it is impossible to know which apparent magnitude corresponds to mag in absolute magnitude. Therefore, we try using five thresholds, , 25.8, 25.3, 24.8, and mag, corresponding to , –4.0, –4.5, –5.0, and mag at the distance of NGC 4437, Mpc derived using the TRGB method (Kim et al., 2020). Note that the absolute masking thresholds change if a galaxy is located at a different distance. For example, at a distance of 11.68 Mpc (7.37 Mpc), the thresholds correspond to and mag ( and mag).
Lastly, we use fluctuation – integrated color relations for dwarf galaxies in the HSC system in Kim & Lee (2021) to obtain SBF absolute magnitudes and derive distances to the satellite candidate galaxies. Kim & Lee (2021) derived fluctuation – integrated color relations for dwarf galaxies using the HSC data for 12 nearby dwarf galaxies of various morphological types. They presented the -band SBF calibrations for different masking thresholds (see their Table 3): , in the case of mag which leads to the smallest rms scatter of 0.16 mag.
| Name | Annulus | Distance () a | b | c | Membership | ||
|---|---|---|---|---|---|---|---|
| (″) | (mag) | (mag ″-2) | (Mpc) | (mag) | (Mpc) | ||
| Dw1 | 0.0 - 10.8 | 22.6 | -4.5 | 0.25 | N | ||
| Dw2 | 0.0 - 11.3 | 23.6 | -5.0 | 1.48 | N | ||
| Dw3inner | 0.0 - 15.5 | 22.4 | -4.0 | 0.09 | Y | ||
| Dw3outer | 15.5 - 25.2 | 23.7 | -4.0 | 0.46 | |||
| Dw4 | 0.0 - 6.5 | 22.7 | -4.0 | 0.05 | Y | ||
| Dw5 | 0.0 - 11.5 | 24.8 | -5.0 | 0.68 | N | ||
| Dw6 | 0.0 - 14.4 | 23.8 | -5.0 | 0.31 | N | ||
| Dw7 | 0.0 - 15.8 | 24.0 | -5.0 | 0.34 | N | ||
| Dw8 | 0.0 - 9.0 | 24.0 | -5.0 | 0.82 | N | ||
| Dw9 | 0.0 - 5.4 | 24.6 | -5.0 | 0.42 | N | ||
| Dw10 | 4.3 - 8.6 | 24.7 | -5.0 | 0.60 | N | ||
| Dw11 | 0.0 - 5.4 | 24.2 | -5.0 | 1.31 | N | ||
| Dw12 | 0.0 - 7.2 | 24.4 | -4.0 | 0.39 | Y | ||
| Dw13 | 0.0 - 10.8 | 22.4 | -5.0 | 0.12 | N | ||
| Dw14 | 0.0 - 5.4 | 24.1 | -5.0 | 0.12 | N | ||
| Dw15 | 0.0 - 6.1 | 24.2 | -4.0 | 0.17 | Y | ||
| Dw16 | 0.0 - 10.8 | 24.2 | -4.0 | 0.37 | Y | ||
| Dw17 | 0.0 - 9.7 | 24.2 | -5.0 | 1.31 | N |
3.2 Group Membership Confirmation
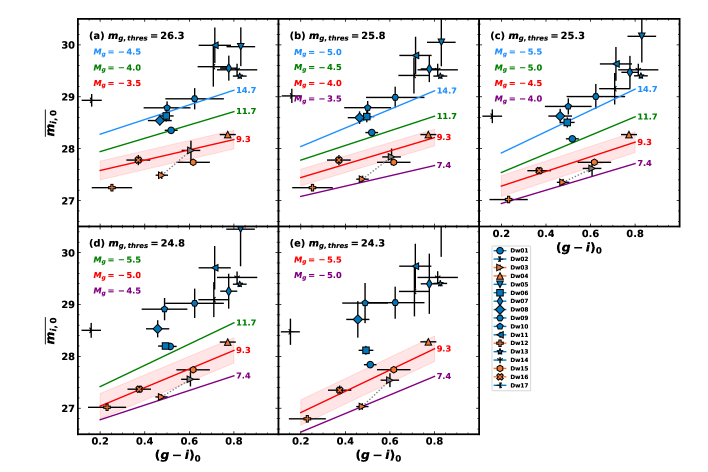
Figure 5 shows the SBF magnitudes of the dwarf galaxies, using five different band masking thresholds. We plot our confirmed NGC 4437 group members as orange symbols and background galaxies as blue symbols. In this subsection, we describe how we decided the membership based on SBF distances.
In each panel, we plot the SBF – integrated color relations derived by Kim & Lee (2021), assuming the distance of 9.28 Mpc (to NGC 4437), as red lines. At the 9.28 Mpc distance, the masking thresholds correspond to and mag, respectively. With fainter , the slopes decrease and the y-intercepts increase. The relations assuming smaller and larger distances (7.37 Mpc, 11.68 Mpc, and 14.71 Mpc) and corresponding absolute magnitudes are also shown. If the distance to a galaxy is similar to 9.28 Mpc, its SBF magnitudes are likely to overlap with the shaded red regions. This diagram can be used for roughly estimating distances and choosing which to use.
The SBF magnitudes do not differ significantly within the error range according to the choice of a masking threshold, for the galaxies in the color range mag: for example, Dw4, Dw5, Dw7, Dw11, Dw13, Dw14, and Dw17. The latter six galaxies have significantly fainter SBFs than Dw4. They are even fainter than the relations for Mpc. Thus, they are likely Virgo members, not members of the NGC 4437 group.
In the bluer colors, the SBF magnitudes vary with the choice of a masking threshold. Therefore, deciding the membership of galaxies with bluer colors is more difficult. For instance, it seems that SBF magnitudes of Dw1 and Dw6 are fainter than the galaxies with orange symbols for mag, but the differences decrease at brighter masking thresholds. However, in this case, deciding on a bright masking threshold is not recommended because the thresholds correspond to brighter absolute magnitudes if they are truly located behind the distance of NGC 4437 and thus young stellar populations might not have been properly masked. We decide that they are likely background objects, based on the fact that SBF magnitudes of Dw1 agree with the relations for 11.68 Mpc and those of Dw6 with 14.71 Mpc in the threshold range mag.
The SBF magnitudes of the Dw3 inner field and Dw12 seem to be slightly brighter than the other three galaxies with orange symbols. If they are located in front of NGC 4437, it would be better to refer to the cases for brighter masking thresholds than fainter thresholds. The SBF magnitudes of Dw12 overlap with the red shaded regions for the cases of and mag, so we decide that it is likely a member of the NGC 4437 group. For Dw3, while the SBF magnitudes of the inner field shows better agreement with the case of Mpc instead of Mpc, the outer field shows better agreement with Mpc. Thus membership confirmation based on SBF distances is more ambiguous. Fortunately, the velocity of Dw3 ( km s-1) is measured to be close to that of NGC 4437 ( km s-1) (see in Table 1 and 2) and we conclude that it is a likely member of the NGC 4437 group.
Figure 6 shows (a) distances, (b) SBF magnitudes, (c) distance measurement errors, and (d) total distance errors of the five likely members for five masking thresholds. is calculated assuming 9.28 Mpc distance. Except for Dw3(outer region) and Dw15, distances do not vary systematically with choice of masking thresholds. In the case of the outer region of Dw3, the systematic trend arises from varying apparent SBF magnitudes. On the other hand, SBF magnitudes of Dw15 are constant but the difference comes from calibrations. In the panel (c), we display the measurement errors in Mpc. Measurement errors are the sum of power spectrum fitting errors and the background subtraction errors. Large errors in Dw3(outer region) and Dw16 are due to increased stochasticity in background subtraction in low surface brightness region. In the panel (d), we show total errors, the sum of measurement error and the calibration error. Calibration errors dominate total errors. The calibration error is the smallest when using , which is also reflected in total errors. We select for our final choice of distances. For Dw3, where measured SBF distance is slightly different when using inner and outer regions, we adopt the average value 8.24 0.96 Mpc.
Table 3 lists distances calibrated using mag. For the five likely members, we assume that the masking threshold corresponds to mag and apply the calibration for such threshold, (rms = 0.16 mag). For the other likely background objects, we use calibrations for other thresholds depending on their SBF magnitudes. indicates standard deviations of SBF distances using multiple masking thresholds. Note that is generally negligible compared to calibration errors.
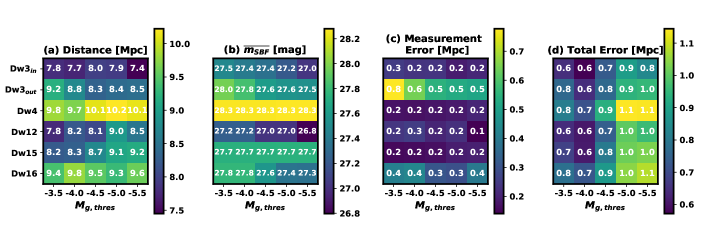
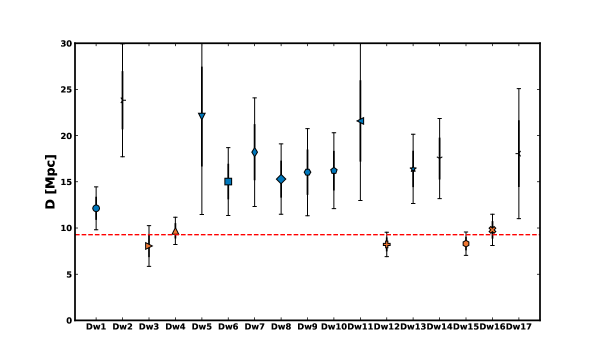
Figure 7 shows the distances and their error ranges of the dwarf galaxies. While 2 distance range of the five likely members (Dw3, Dw4, Dw12, Dw15, and Dw16) includes the distance of NGC 4437, 9.28 Mpc, that of the other galaxies does not. Adopting the criterion used by Carlsten et al. (2019a) and Carlsten et al. (2021), which is confirming a dwarf as a background object whose distance lower bound is beyond the distance of the host, we consider these twelve galaxies as background galaxies. Note that all the galaxies we newly added by the automated detection are confirmed as background galaxies, indicating that our initial visual inspection was conservative. Table 4 lists the confirmed members of the NGC 4437 Group in the order of absolute magnitudes.
Among our likely members, Dw15 has the faintest band magnitude ( mag). We assume that our search is complete at least down to mag, among the galaxies with sufficient surface brightness to apply the SBF method.
| Name | (mag)a | Distance (Mpc) | (km s-1) |
|---|---|---|---|
| NGC 4437 | |||
| NGC 4592 | |||
| Dw3 | |||
| Dw16 | |||
| Dw4 | |||
| Dw12 | |||
| Dw15 |
4 Satellites Beyond the Virial Radius
In the previous sections, we identified dwarf satellite candidates in about 5° 4°area around NGC 4437 and found that seven galaxies (NGC 4437, NGC 4592, Dw3, Dw4, Dw12, Dw15, and Dw16) are members of the NGC 4437 group. In this section, we describe the spatial distribution of the galaxies in the NGC 4437 group and discuss it using simulated galaxy groups in IllustrisTNG50.
4.1 Spatial Distribution of the NGC 4437 Group
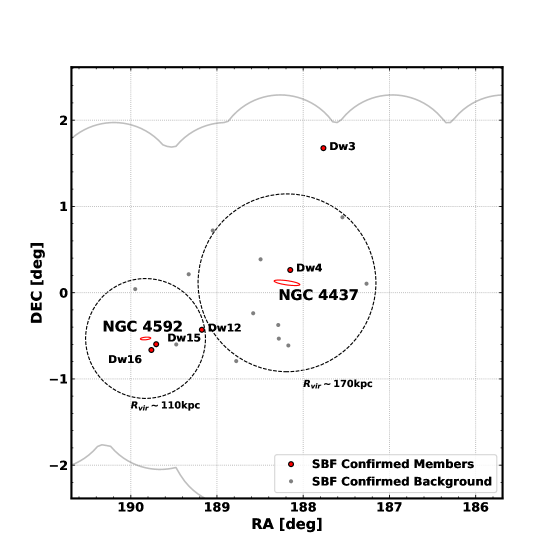
In Figure 2, we plot the spatial distribution of the likely members of the NGC 4437 Group as red symbols. Black dashed circles indicate virial radii of NGC 4437 and NGC 4592, 170 kpc (1°) and 110 kpc (0.7°). These values are derived by three steps: (1) converting band magnitudes to stellar masses assuming , (2) assuming halo masses and , respectively, based on the stellar to halo mass ratio from Behroozi et al. (2013) (0.024 and 0.007, respectively) , and (3) deriving virial radii from the versus relation obtained from IllustrisTNG50 (see Section 5.2) group catalogs, . The parameters are listed in Table 1. Thus, our field of view covers approximately area centered on NGC 4437. This spatial coverage is wider than most observational studies of nearby galaxy groups, which restrict the group members to those within the projected virial radius (e.g. Carlin et al., 2016; Smercina et al., 2018; Davis et al., 2021; Carlsten et al., 2021; Mao et al., 2021).
The distance between NGC 4437 and NGC 4592 is about two times the virial radius of NGC 4437. Dw4 is in the virial volume of NGC 4437 and Dw12, Dw15, and Dw16 are located within the virial radius of NGC 4592. Dw3 is relatively isolated, being outside of the virial radius of both NGC 4437 and NGC 4592. If we restrict the group members to those within the projected virial radius (dashed lines in Figure 2), we should regard NGC 4437 and NGC 4592 as primary galaxies of separate groups. However, given that their observed radial velocities are remarkably similar (km s-1), it is likely that they are gravitationally bound. However, the velocity information is not conclusive because we do not know their tangential velocities. To decide whether or not to view the two galaxies as consisting a single group, in the next subsection, we check spatial extent and velocity distributions of galaxies in the IllustrisTNG50 mock galaxy groups, especially for if the galaxies located outside the virial radius of the host galaxies are truly gravitationally bound.
4.2 IllustrisTNG50 Mock Galaxy Groups
We use group catalogs from the IllustrisTNG50 project (Marinacci et al., 2018; Naiman et al., 2018; Nelson et al., 2018; Pillepich et al., 2018; Springel et al., 2018; Nelson et al., 2019) to select mock galaxy groups. IllustrisTNG is a suite of large-scale cosmological galaxy formation simulations, with three different volumes and resolutions (TNG50, TNG100, and TNG300). We choose the smallest resolution TNG50, which has the baryonic mass resolution . The group catalog includes halos determined by friends-of-friends (FoF) algorithm with a linking length and substructures (subhalos) identified by Subfind algorithm (Springel et al., 2001; Dolag et al., 2009).
4.2.1 Subhalo Selection
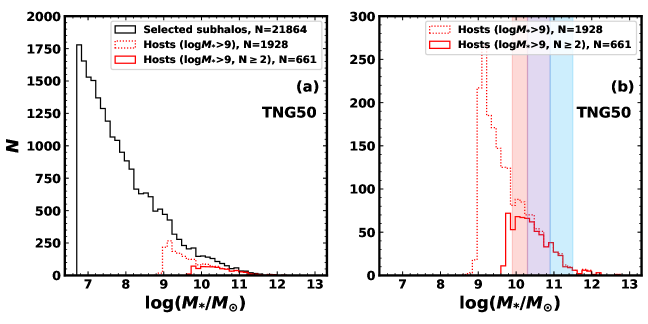
We only consider subhalos with SubhaloFlag = 1 and instantaneous dark matter fraction larger than 10%, to exclude non-cosmological objects that are fragments or clumps produced through baryonic processes in already formed galaxies (Nelson et al., 2019). We also restrict our analysis to luminous subhalos with stellar masses of at least measured within twice the stellar half-mass radius following Engler et al. (2021), in order to avoid resolution effects. This stellar mass threshold roughly corresponds to mag, similar to the completeness limit of our search of NGC 4437 group satellites. In IllustrisTNG50, 21864 subhalos satisfy both criteria. Black lines in Figure 8a shows a stellar mass function of the selected subhalos.
4.2.2 Galaxy Group Selection
Next, we select galaxy groups based on two criteria. First, we limit our analysis to FoF groups with a total stellar mass larger than . In IllustrisTNG50, 1928 FoF groups satisfy this mass limit. Red dotted lines in Figure 8 shows the host galaxy stellar mass function of such groups. Here we define a host galaxy as the most massive subhalo among subhalos in a FoF group and satellite galaxies as the other subhalos. Second, we only consider galaxy groups that have at least one satellite galaxy brighter than mag. That is, the galaxy groups with at least one subhalo (other than the host subhalo itself) that satisfies the subhalo selection criteria. Red solid lines in Figure 8 display the host galaxy stellar mass function of the 661 groups that satisfy both the two criteria. Then we classify selected FoF groups according to host stellar mass: low-mass NGC 4437 group-like groups (; ), MW-like groups (; ), and massive groups (; ). These are indicated as vertical colored bars in the right panel (Figure 8b).
4.2.3 Spatial Extent of Simulated Galaxy Groups
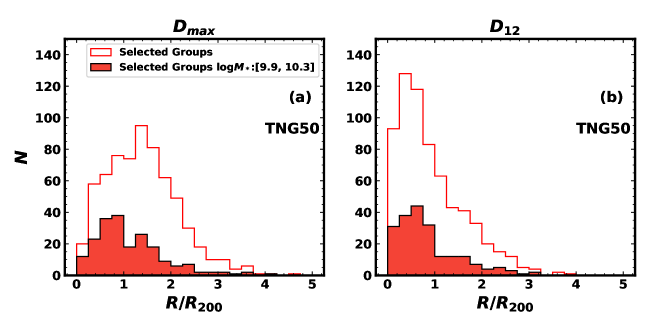
Now we define two quantities to describe the spatial extent of simulated galaxy groups: and . of a galaxy group is the distance between the host galaxy and the farthest satellite galaxy ( mag). of a galaxy group is the distance between the host galaxy and the second brightest member galaxy. For the NGC 4437 group, Mpc (Kim et al., 2020). is highly uncertain because of the wide distance error ranges in dwarf galaxies.
In Figure 9 we plot the histogram of two quantities in units of the virial radius . The solid lines indicate all the selected galaxy groups and the filled lines display NGC 4437 group-like galaxy groups, the galaxy groups of which host galaxies have similar stellar masses with NGC 4437 (). About half of the NGC 4437 group-like galaxy groups have larger than and about 10% of them outside . About 30% of the NGC 4437 group-like galaxy groups have the second brightest member galaxy outside and 10% outside . This shows that although a majority of groups have and within , a significant fraction of satellite galaxies lie outside the , like the case for NGC 4437 and NGC 4592.
To test if these large-distance satellite galaxies are truly bound to the host galaxies, we check their relative velocities. We find that a majority (75%) of the second brightest member galaxies of galaxy groups with are infalling toward their host galaxies. The other 25% of them are receding from the host galaxy but have a velocity smaller than the escape velocity. Thus, it is likely that second brightest member galaxies outside the will get closer to the primary galaxy and shortly become close satellites. Therefore we conclude that galaxies grouped as a FoF halo in the IllustrisTNG50 are bound, even though their separations are large.
To summarize, we find that a significant fraction of subhalos in a FoF group in the IllustrisTNG50 simulation are located outside the and that they are still bound to the host galaxy. Thus, we decide to view the NGC 4437 group, which has , as a single group.
5 Discussion
In this section, we discuss the properties of the satellites of the NGC 4437 group, in comparison with previous studies on low-mass and MW-mass galaxy groups and with cosmological hydrodynamic simulations.
5.1 Enironmental Quenching of Satellites
Star formation properties of our satellite galaxies imply that environmental quenching has affected them. The two satellite galaxies (Dw4 and Dw15) that are located in the shortest projected distance to NGC 4437 and NGC 4592, are dwarf spheroidal galaxies with red colors ( and mag, respectively), implying that they consist of old stellar populations. On the other hand, the satellites located farther from the pair of spiral galaxies (Dw3, Dw12, and Dw16) are late-types with bluer colors ( mag) and ultraviolet flux is detected from GALEX images of them. This is consistent with earlier finding that the morphological type of satellite galaxies around the MW, M31, M81 and M101 shows a strong correlation with projected distances from their host galaxies (Einasto et al., 1974), and with color-projected distance relation well-known for galaxy clusters (Dressler, 1980) and the Local Group (van den Bergh, 1994). Recent studies show that similar trends exist even for low-mass galaxy groups (Carlin et al., 2021; Davis et al., 2021). The satellite system of the NGC 4437 group supports the idea that environmental quenching plays a role even for low-mass galaxy groups where lower ram pressure and tidal fields are expected.
5.2 Satellite Luminosity Functions, Number of Member Galaxies, and the Magnitude Gap
There are seven galaxies ( mag) confirmed as members of the NGC 4437 group. In this subsection, we compare the spatially complete satellite population of the NGC 4437 group with the mock galaxy groups in the IllustrisTNG50 cosmological simulation and with other observed galaxy groups.
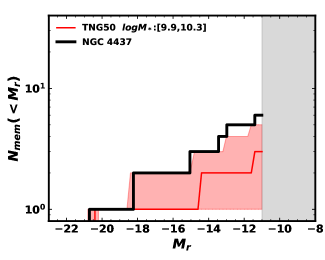
Figure 10 displays the observed cumulative luminosity function (LF) of the members in the NGC 4437 group (thick black solid line) in comparison with the median LF of simulated NGC 4437 group-like galaxy groups (defined in Section 4.2). The median and range of the LF of simulated galaxy groups are shown as a red line with a red shaded region. The photometric limit of this study, mag, is indicated by the gray shaded region. The NGC 4437 group has a relatively large satellite population compared to the simulated galaxy groups with a similar host stellar mass.
In addition, the median of the of the second brightest galaxy in the simulated galaxy groups is about mag. NGC 4592, the second brightest galaxy in the NGC 4437 group, is relatively bright ( mag) among the NGC 4437 group-like simulated galaxy groups. This means that it has a relatively small magnitude gap ( mag) between the host galaxy (NGC 4437) and the brightest satellite galaxy (NGC 4592) compared to the simulated galaxy groups.
Previously studied observational evidence of the anticorrelation between the and the number of satellites is based on the comparison between galaxy groups with a very small ( mag for Hearin et al. (2013) and mag for Wang et al. (2021)) and the rest. To check whether the anticorrelation extends to a larger gap regime for low-mass galaxy groups, we classify the simulated galaxy groups into five groups by , , , , , and .
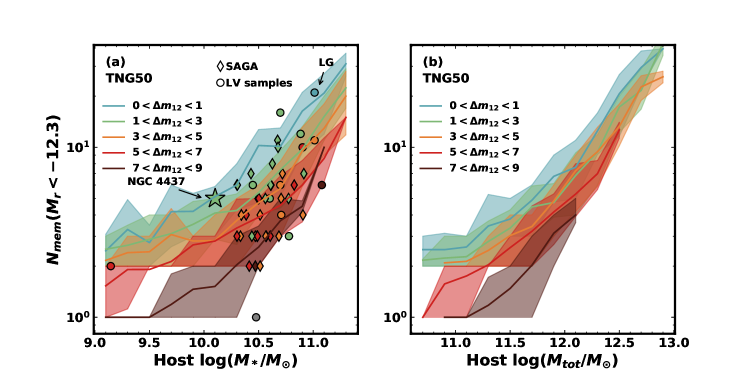
Figure 11 displays the number of member galaxies of the group, as a function of (a) host galaxy stellar mass and (b) host galaxy total mass from the IllustrisTNG50 simulation. Here we consider the satellites brighter than mag in order to match the magnitude limit of the SAGA survey (Mao et al., 2021) which will be described below. The five groups classified by are shown by different colors (the bluer color for the smaller ). Two correlations are seen in these figures. First, the positive correlation between and host galaxy stellar mass is seen in the simulated groups. The correlation is tighter against the total mass (including the dark matter halo mass) of the host galaxy. In addition, the number of satellites from the simulated groups shows a clear stratification in both Figure 11(a) and (b): galaxy groups with a smaller have a larger . Note that the stratification of the same exists across a broad range.
We overplot the observed number of member galaxies and the host stellar mass in Figure 11(a) with colored symbols. Colors indicate the five groups of . The circle symbols and diamond symbols indicate the LV galaxy groups and the SAGA survey sample, respectively. The LV sample, most of which are from the compilation by Carlsten et al. (2021), consists of 13 galaxy groups of which satellite membership is determined by measuring their distances using either the TRGB or the SBF method: MW (McConnachie, 2012, for compiled data), M31 (Martin et al., 2016; McConnachie, 2012; McConnachie et al., 2018, for compiled data), the Local Group (LG; including the MW and M31 subgroups and quasi-isolated outlying members classified by McConnachie (2012)), NGC 2403 (Carlin et al., 2021), NGC 4258 (Kim et al., 2011; Spencer et al., 2014; Carlsten et al., 2021), NGC 4631 (Tanaka et al., 2017; Carlsten et al., 2021), M51 (Carlsten et al., 2021), M101 (Danieli et al., 2017; Bennet et al., 2017, 2019; Carlsten et al., 2019a), M94 (Smercina et al., 2018), NGC 1023 (Trentham & Tully, 2009; Carlsten et al., 2021), M104 (Javanmardi et al., 2016; Carlsten et al., 2021), M81 (Chiboucas et al., 2009, 2013), and NGC 5128 (Crnojević et al., 2014, 2019; Müller et al., 2017, 2019). The other galaxy groups that are in Carlsten et al. (2021) compilation but not in this study are excluded either because the spatial coverage is too low (less than 20% of projected virial area is covered) or the SBF signal-to-noise is too low to confirm satellites as faint as mag. The SAGA survey sample (Mao et al., 2021) consists of galaxy groups with 36 MW-like host galaxies. The MW-like host galaxies are selected by their K-band magnitudes ( mag). The SAGA survey covered more than 80% of the projected kpc area and confirmed satellite memberships from their redshifts. It is considered complete to satellites brighter than mag. Note that while the spatial coverage of the LV sample significantly differs from galaxy to galaxy and most of them cover less than the virial area, the SAGA survey sample has a relatively consistent spatial coverage.
Most of the references gave luminosities in bandpasses other than -band. We converted the -band magnitudes to -band magnitudes using (Engler et al., 2021). For SAGA hosts, we transformed magnitudes to magnitudes using magnitude relations in TNG100 derived using 44 MW-like subhalos with the same range with SAGA selection criteria, (rms = 0.05 mag). The MW-like subhalos are selected using the magnitudes of the MW (Bland-Hawthorn, & Gerhard, 2016).
Although with a large scatter, the observed galaxy groups generally follow the simulated group lines. Also, the positive correlation between the and the host galaxy stellar mass and the anticorrelation between the and the exists for observed galaxy group samples.
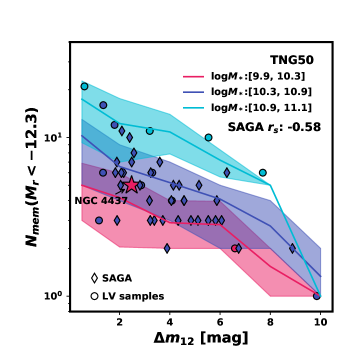
Figure 12 illustrates as a function of for the same simulated and observed samples as in Figure 11. To account for host galaxy stellar mass, we sort our compiled sample into three mass groups according to their host stellar masses as defined in Section 4.2: NGC 4437-like (, pink), MW-like (, purple), and massive groups (, skyblue). A majority of the galaxy groups belong to the MW-like groups.
Among the galaxy groups in the same mass range, the observational data for the groups show clearly a correlation between the number of satellites and : the smaller the , the richer the satellite system. The more massive groups have a larger for given , although the sample numbers in the massive groups and the low-mass groups are small. Again, the observed data generally follow the simulated group lines. The Spearman rank correlation coefficient between and of the SAGA sample (which is a dominant component of the MW-like groups) is (value = ), which confirms that and are anticorrelated.
We check this correlation in higher resolution simulations, the FIRE project (Hopkins et al., 2014, 2018), a suite of high-resolution zoom-in simulation for MW-like galaxies. In their study of the relation between merger history and satellite populations of eight nearby MW-like galaxies, Smercina et al. (2021) defined the stellar mass of the dominant merger (, defined as the greater of either total accreted stellar mass () or stellar mass of the most massive satellite ()). They suggested that shows no clear correlation with the number of satellites ( for mag) in the FIRE simulation data, while it shows a strong correlation in the observational data (see their Figure 3). Note that the FIRE data used in their study cover a much smaller mass range of () than the observational data ().
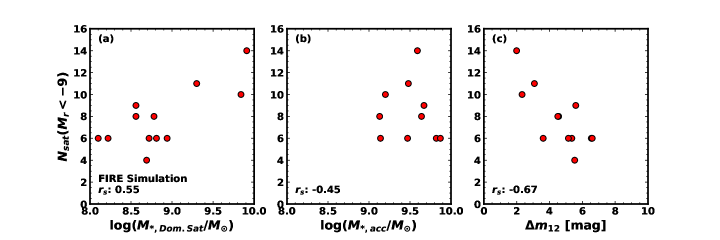
Using the information of the FIRE sample in Table 3 of Smercina et al. (2021) we investigate relations between merger mass indicators ( and ) and the number of satellites () in a group. Figure 13(a) shows a positive correlation (, -value=0.06) between and the . However, there is a week anti-correlation (, -value=0.14) between and the in Figure 13(b). As a consequence, shows no correlation with (, -value=0.59).
If we use the stellar mass ratio between the host galaxy and the most massive satellite galaxy (), which is equivalent to assuming a constant mass-to-light ratio, we find a stronger correlation between and (, -value=0.02) as seen in Figure 13(c). Thus it is shown that the number of satellites increases as the the mass ratio between the host galaxy and the most massive satellite galaxy decreases (or as their magnitude gap increases). This result is consistent with those from observational data and IllustrisTNG50 data in this study (as in Figure 11).
In summary, both observational data and simulation data show that there is a strong correlation among the three parameters of the galaxy groups: the number of member galaxies is correlated with host galaxy stellar mass and with .
5.3 Magnitude Gap as an Indicator for Galaxy Assembly History
Since the magnitude gap is correlated with the number of member galaxies as well as with host galaxy stellar mass, it is likely to also correlate with group assembly histories. If most of the group mass has assembled at an early epoch and no bright galaxy accreted since then, the galaxy group might lack bright satellites at present. If a bright satellite existed in the group, it would have been already cannibalized by the host galaxy. Therefore, is likely to be related to mass accretion history.
This view is supported by the previous studies of fossil groups, which are generally defined as massive systems ( mag by Raouf et al. (2014)) with a large magnitude gap ( mag). The fossil groups are known to have earlier formation times and lack recent satellite accretion (D’Onghia et al., 2005; Kundert et al., 2017). However, the correlation between and assembly history for galaxy groups with lower mass than the fossil groups is not well-established.
In this subsection, we investigate host galaxy assembly histories as a function of , across a wide host mass range. In particular, we examine cumulative total mass and stellar mass assembly histories, halo formation times, and stellar-to-halo mass ratios (SHMRs; the ratio of the total stellar mass to the total mass (including dark matter halos)) of host galaxies in relation to . For this purpose we use the group catalogs from IllustrisTNG50, as described in the previous subsection. From now on, we consider galaxy groups of which the second brightest galaxy is brighter than mag, which is the magnitude limit in our survey of the NGC 4437 group. As before, we divide our galaxy groups into three groups according to their host stellar mass: low-mass groups (; ), MW-like groups (; ), and massive groups (; ), and examine their median properties. In each mass group, we divide simulated galaxy groups into five groups according to .
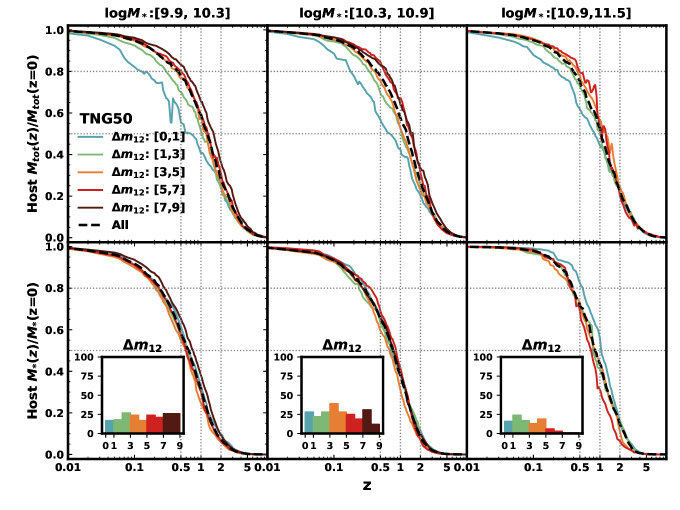
The upper and lower panels of Figure 14 display total mass and stellar mass assembly histories (mass fraction with respect to the current mass as a function of redshift) of the galaxy groups. The black lines indicate the median assembly history of all groups. Less massive groups (left and middle panels) assemble, on average, their total mass at an earlier epoch compared to more massive groups (right panel). This tendency is the opposite for the stellar mass assembly history. Less massive groups assemble their stellar mass at a later epoch, since most host galaxies of low-mass groups show continuous star formation until present day while those of massive groups are quenched.
The distributions of are shown in the histograms of Figure 14. For the MW-like and massive groups, the number of groups decreases with increasing . In contrast, many of the low-mass galaxies have a large .
We plot the median assembly history of each group divided according to with different colors (the bluer for the smaller ). Host galaxies with large assemble their total mass earlier than those with small , in all three mass groups. This suggests that is a useful parameter that distinguishes different total mass assembly histories. On the other hand, no such trend exists for stellar mass assembly histories, as shown in the lower panels.
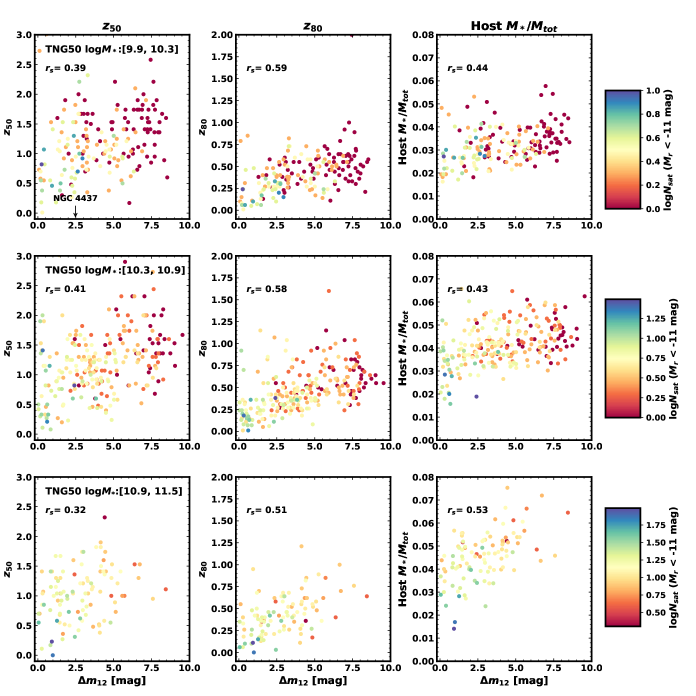
Next, we compare halo formation times of groups with different . The halo formation time is useful for parameterizing galaxy assembly histories. Here, we examine two parameters, and . () is a redshift at which the host galaxy assembled 50% (80%) of its mass.
The left panels of Figure 15 display relations between and . We show three mass groups separately at the top, middle, and bottom panels. Colors indicate the number of satellite galaxies with mag. There are positive correlations between and in all three mass groups, with . Host galaxies of the galaxy groups with a smaller have a larger number of satellites and have assembled their total mass recently. For instance, 80% of low-mass galaxy groups with have assembled a half of the mass as early as at , while only 40% of low-mass groups with have assembled a half of the mass at . From this, it is inferred that NGC 4437 with small magnitude gap ( mag) is likely to have assembled its mass later than other host galaxies with a large magnitude gap.
The middle panels show the relations between and . The correlations for are stronger () compared to . This is consistent with the findings from Kundert et al. (2017) that assembly history of fossil groups and nonfossil groups differs more in recent accretion history and that is a more useful parameter than in distinguishing them.
The panels in the right represent SHMRs of host galaxies as a function of . In all three mass groups, positive correlations exist between the two parameters. The correlation is stronger for more massive groups. This is consistent with previous findings that SHMRs of fossil groups are larger than those of nonfossil groups, based on both observations and simulations (Harrison et al., 2012; Kundert et al., 2017). For low-mass groups, SHMRs span relatively a narrow range, meaning that halo masses are not much varied given stellar mass. The correlations are weaker and thus does not likely to inform much about SHMRs, not to the same degree as does for higher masses.
To summarize, informs halo formation times and SHMRs of host galaxies even for low-mass groups, in the same manner that can be inferred from the studies of fossil groups: galaxy groups with a large tend to have a small number of satellites, have assembled at an early epoch, and have a large SHMR. A large diversity in the number of satellites of nearby galaxies partially originate from diverse assembly histories and an easily observable parameter, , can be used as an indicator for assembly times.
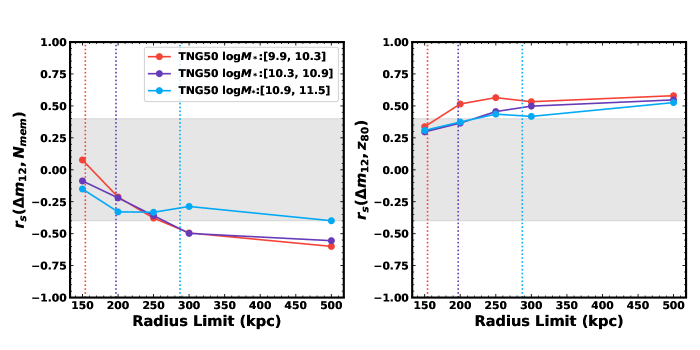
Note that the simulated galaxy groups we use to derive correlations in Figure 15 are spatially more complete than most observed samples. We investigate the relation between the survey coverage and the Spearman correlation coefficients in Figure 16. We derive Spearman correlation coefficients five times using different radius limits for defining a group, 150, 200, 250, 300, and 500 kpc. and are determined within each radius limit. In the left panel we show the correlation coefficients between and (), and in the right panel and (). We plot the correlation coefficients for three different mass ranges with colored circle symbols and the median virial radii as vertical dotted lines. The absolute values of correlations generally increase as radius limit increases, for both panels. The correlations are not significant if the satellite galaxies are searched only in the virial radius. Thus, for to be useful for inferring galaxy assembly histories, it is recommended that satellite galaxies are searched in a wide area as large as .
6 Summary
NGC 4437 is a low-mass edge-on spiral galaxy ( mag) paired with a dwarf spiral galaxy, NGC 4592 ( mag). We searched for dwarf galaxies in the 5° 4° area around NGC 4437 in the WIDE layer of HSC-SSP (Figure 2) and found 17 satellite candidates (Figure 1 and Table 2). Our automated detection and visual search are approximately complete down to mag and covers . Then we applied SBF techniques to estimate the distances to the satellite candidates and confirm their membership. Our main results are summarized as follows.
-
1.
Group membership confirmation. Based on the SBF distances, we confirm five dwarf galaxies (Dw3, Dw4, Dw12, Dw15, and Dw16) as members of the NGC 4437 group. We try measuring the SBF with five masking thresholds for eliminating contaminating sources, and mag. From the fluctuation – color diagram, we select five galaxies as likely members and the other twelve as likely background galaxies.
-
2.
Environmental quenching for low-mass systems. The two dwarf galaxies, Dw4 and Dw15, that are located at the shorter projected distance to NGC 4437 and NGC 4592, consist of old stellar populations while the other three show star-forming regions. This is consistent with previous findings that environmental quenching plays an important role for low-mass galaxy groups.
-
3.
Satellite richness of the NGC 4437 group. Although NGC 4437 is an order of magnitude fainter than the MW, it has a similar number of satellites to those of MW-like galaxy groups. It has a richer satellite system than simulated galaxy groups from IllustrisTNG50, selected by host stellar masses . However, it has a typical number of satellites when compared with galaxy groups of similar , defined as an band magnitude difference between the first and the second brightest galaxies.
-
4.
Magnitude gap and the number of member galaxies. We find a stratification of the number of member galaxies by : the smaller the , the larger the number of satellites. This trend is seen both in IllustrisTNG50 (as well as FIRE) simulations and in observed galaxies sample (Figure 11).
-
5.
Magnitude gap and the galaxy assembly history. From simulated spatially-complete galaxy groups in IllustrisTNG50, we find that galaxy groups (for host galaxy stellar mass range ) with smaller assemble their total mass at a later epoch (Figure 14). Thus, they have relatively later halo formation times and , with being more tightly correlated to . While SHMR is correlated significantly with for massive groups (), the correlation gets weaker with decreasing host stellar mass (Figure 15). These findings imply that provides information about assembly histories even for low-mass groups and the diverse assembly histories may account for a large scatter in observed satellite number of nearby galaxy groups. In addition, the correlations increase as the radius limit for group definition increases, showing that satellite galaxies should be searched in a wide area to use as an indicator for galaxy assembly.
References
- Aguerri & Zarattini (2021) Aguerri, J. A. L. & Zarattini, S. 2021, Universe, 7, 132. doi:10.3390/universe7050132
- Aihara et al. (2018) Aihara, H., Arimoto, N., Armstrong, R., et al. 2018, PASJ, 70, S4
- Aihara et al. (2019) Aihara, H., AlSayyad, Y., Ando, M., et al. 2019, PASJ, 71, 114
- Behroozi et al. (2013) Behroozi, P. S., Wechsler, R. H., & Conroy, C. 2013, ApJ, 770, 57. doi:10.1088/0004-637X/770/1/57
- Bennet et al. (2017) Bennet, P., Sand, D. J., Crnojević, D., et al. 2017, ApJ, 850, 109. doi:10.3847/1538-4357/aa9180
- Bennet et al. (2019) Bennet, P., Sand, D. J., Crnojević, D., et al. 2019, ApJ, 885, 153. doi:10.3847/1538-4357/ab46ab
- Bertin & Arnouts (1996) Bertin, E. & Arnouts, S. 1996, A&AS, 117, 393. doi:10.1051/aas:1996164
- Blakeslee et al. (2021) Blakeslee, J. P., Jensen, J. B., Ma, C.-P., et al. 2021, ApJ, 911, 65. doi:10.3847/1538-4357/abe86a
- Bland-Hawthorn, & Gerhard (2016) Bland-Hawthorn, J., & Gerhard, O. 2016, ARA&A, 54, 529
- Bosch et al. (2018) Bosch, J., Armstrong, R., Bickerton, S., et al. 2018, PASJ, 70, S5. doi:10.1093/pasj/psx080
- Bullock & Boylan-Kolchin (2017) Bullock, J. S. & Boylan-Kolchin, M. 2017, ARA&A, 55, 343. doi:10.1146/annurev-astro-091916-055313
- Cantiello et al. (2018) Cantiello, M., Blakeslee, J. P., Ferrarese, L., et al. 2018, ApJ, 856, 126
- Carlin et al. (2016) Carlin, J. L., Sand, D. J., Price, P., et al. 2016, ApJ, 828, L5. doi:10.3847/2041-8205/828/1/L5
- Carlin et al. (2021) Carlin, J. L., Mutlu-Pakdil, B., Crnojević, D., et al. 2021, ApJ, 909, 211. doi:10.3847/1538-4357/abe040
- Carlsten et al. (2019b) Carlsten, S. G., Beaton, R. L., Greco, J. P., et al. 2019, ApJ, 879, 13
- Carlsten et al. (2019a) Carlsten, S. G., Beaton, R. L., Greco, J. P., et al. 2019, ApJ, 878, L16. doi:10.3847/2041-8213/ab24d2
- Carlsten et al. (2020a) Carlsten, S. G., Greco, J. P., Beaton, R. L., et al. 2020, ApJ, 891, 144. doi:10.3847/1538-4357/ab7758
- Carlsten et al. (2020b) Carlsten, S. G., Greene, J. E., Peter, A. H. G., et al. 2020, ApJ, 902, 124. doi:10.3847/1538-4357/abb60b
- Carlsten et al. (2021) Carlsten, S. G., Greene, J. E., Peter, A. H. G., et al. 2021, ApJ, 908, 109. doi:10.3847/1538-4357/abd039
- Chiboucas et al. (2009) Chiboucas, K., Karachentsev, I. D., & Tully, R. B. 2009, AJ, 137, 3009. doi:10.1088/0004-6256/137/2/3009
- Chiboucas et al. (2013) Chiboucas, K., Jacobs, B. A., Tully, R. B., et al. 2013, AJ, 146, 126. doi:10.1088/0004-6256/146/5/126
- Crnojević et al. (2014) Crnojević, D., Sand, D. J., Caldwell, N., et al. 2014, ApJ, 795, L35. doi:10.1088/2041-8205/795/2/L35
- Crnojević et al. (2019) Crnojević, D., Sand, D. J., Bennet, P., et al. 2019, ApJ, 872, 80. doi:10.3847/1538-4357/aafbe7
- D’Onghia et al. (2005) D’Onghia, E., Sommer-Larsen, J., Romeo, A. D., et al. 2005, ApJ, 630, L109. doi:10.1086/491651
- Danieli et al. (2017) Danieli, S., van Dokkum, P., Merritt, A., et al. 2017, ApJ, 837, 136. doi:10.3847/1538-4357/aa615b
- Davis et al. (2021) Davis, A. B., Nierenberg, A. M., Peter, A. H. G., et al. 2021, MNRAS, 500, 3854. doi:10.1093/mnras/staa3246
- de Vaucouleurs et al. (1991) de Vaucouleurs, G., de Vaucouleurs, A., Corwin, H. G., et al. 1991, Third Reference Catalogue of Bright Galaxies (RC3) (New York: Springer)
- Dolag et al. (2009) Dolag, K., Borgani, S., Murante, G., et al. 2009, MNRAS, 399, 497. doi:10.1111/j.1365-2966.2009.15034.x
- Dressler (1980) Dressler, A. 1980, ApJ, 236, 351. doi:10.1086/157753
- Einasto et al. (1974) Einasto, J., Saar, E., Kaasik, A., et al. 1974, Nature, 252, 111. doi:10.1038/252111a0
- Engler et al. (2021) Engler, C., Pillepich, A., Pasquali, A., et al. 2021, MNRAS, 507, 4211. doi:10.1093/mnras/stab2437
- Fattahi et al. (2016) Fattahi, A., Navarro, J. F., Sawala, T., et al. 2016, MNRAS, 457, 844. doi:10.1093/mnras/stv2970
- Font et al. (2021) Font, A. S., McCarthy, I. G., & Belokurov, V. 2021, MNRAS, 505, 783. doi:10.1093/mnras/stab1332
- Garrison-Kimmel et al. (2019) Garrison-Kimmel, S., Hopkins, P. F., Wetzel, A., et al. 2019, MNRAS, 487, 1380. doi:10.1093/mnras/stz1317
- Geha et al. (2017) Geha, M., Wechsler, R. H., Mao, Y.-Y., et al. 2017, ApJ, 847, 4. doi:10.3847/1538-4357/aa8626
- Habas et al. (2020) Habas, R., Marleau, F. R., Duc, P.-A., et al. 2020, MNRAS, 491, 1901. doi:10.1093/mnras/stz3045
- Harrison et al. (2012) Harrison, C. D., Miller, C. J., Richards, J. W., et al. 2012, ApJ, 752, 12. doi:10.1088/0004-637X/752/1/12
- Hearin et al. (2013) Hearin, A. P., Zentner, A. R., Newman, J. A., et al. 2013, MNRAS, 430, 1238. doi:10.1093/mnras/sts699
- Hopkins et al. (2014) Hopkins, P. F., Kereš, D., Oñorbe, J., et al. 2014, MNRAS, 445, 581. doi:10.1093/mnras/stu1738
- Hopkins et al. (2018) Hopkins, P. F., Wetzel, A., Kereš, D., et al. 2018, MNRAS, 480, 800. doi:10.1093/mnras/sty1690
- Ivezić et al. (2019) Ivezić, Ž., Kahn, S. M., Tyson, J. A., et al. 2019, ApJ, 873, 111
- Jarrett et al. (2003) Jarrett, T. H., Chester, T., Cutri, R., et al. 2003, AJ, 125, 525. doi:10.1086/345794
- Javanmardi et al. (2016) Javanmardi, B., Martinez-Delgado, D., Kroupa, P., et al. 2016, A&A, 588, A89. doi:10.1051/0004-6361/201527745
- Jerjen et al. (2000) Jerjen, H., Freeman, K. C., & Binggeli, B. 2000, AJ, 119, 166. doi:10.1086/301188
- Jones et al. (2003) Jones, L. R., Ponman, T. J., Horton, A., et al. 2003, MNRAS, 343, 627. doi:10.1046/j.1365-8711.2003.06702.x
- Karachentsev & Nasonova (2013) Karachentsev, I. D., & Nasonova, O. G. 2013, MNRAS, 429, 2677
- Karachentsev et al. (2013) Karachentsev, I. D., Makarov, D. I., & Kaisina, E. I. 2013, AJ, 145, 101. doi:10.1088/0004-6256/145/4/101
- Karachentseva (1968) Karachentseva, V. E. 1968, Soobshcheniya Byurakanskoj Observatorii Akademiya Nauk Armyanskoj SSR Erevan, 39, 62
- Kim et al. (2011) Kim, E., Kim, M., Hwang, N., et al. 2011, MNRAS, 412, 1881. doi:10.1111/j.1365-2966.2010.18022.x
- Kim et al. (2020) Kim, Y. J., Kang, J., Lee, M. G., et al. 2020, ApJ, 905, 104. doi:10.3847/1538-4357/abbd9
- Kim & Lee (2021) Kim, Y. J. & Lee, M. G. 2021, ApJ, 923, 152. doi:10.3847/1538-4357/ac2d94
- Klypin et al. (1999) Klypin, A., Kravtsov, A. V., Valenzuela, O., et al. 1999, ApJ, 522, 82. doi:10.1086/307643
- Kondapally et al. (2018) Kondapally, R., Russell, G. A., Conselice, C. J., et al. 2018, MNRAS, 481, 1759. doi:10.1093/mnras/sty2333
- Kundert et al. (2017) Kundert, A., D’Onghia, E., & Aguerri, J. A. L. 2017, ApJ, 845, 45. doi:10.3847/1538-4357/aa7b88
- Liske et al. (2003) Liske, J., Lemon, D. J., Driver, S. P., et al. 2003, MNRAS, 344, 307
- Maddox et al. (1990) Maddox, S. J., Sutherland, W. J., Efstathiou, G., et al. 1990, MNRAS, 243, 692
- Mao et al. (2021) Mao, Y.-Y., Geha, M., Wechsler, R. H., et al. 2021, ApJ, 907, 85. doi:10.3847/1538-4357/abce58
- Marinacci et al. (2018) Marinacci, F., Vogelsberger, M., Pakmor, R., et al. 2018, MNRAS, 480, 5113. doi:10.1093/mnras/sty2206
- Martin et al. (2016) Martin, N. F., Ibata, R. A., Lewis, G. F., et al. 2016, ApJ, 833, 167. doi:10.3847/1538-4357/833/2/167
- McConnachie (2012) McConnachie, A. W. 2012, AJ, 144, 4. doi:10.1088/0004-6256/144/1/4
- McConnachie et al. (2018) McConnachie, A. W., Ibata, R., Martin, N., et al. 2018, ApJ, 868, 55. doi:10.3847/1538-4357/aae8e7
- Mei et al. (2005) Mei, S., Blakeslee, J. P., Tonry, J. L., et al. 2005, ApJS, 156, 113
- Mei et al. (2007) Mei, S., Blakeslee, J. P., Côté, P., et al. 2007, ApJ, 655, 144. doi:10.1086/509598
- Metcalfe et al. (1989) Metcalfe, N., Fong, R., Shanks, T., et al. 1989, MNRAS, 236, 207
- Mieske et al. (2007) Mieske, S., Hilker, M., Infante, L., et al. 2007, A&A, 463, 503. doi:10.1051/0004-6361:20066300
- Moore et al. (1999) Moore, B., Ghigna, S., Governato, F., et al. 1999, ApJ, 524, L19. doi:10.1086/312287
- Müller & Jerjen (2020) Müller, O. & Jerjen, H. 2020, A&A, 644, A91. doi:10.1051/0004-6361/202038862
- Müller et al. (2019) Müller, O., Rejkuba, M., Pawlowski, M. S., et al. 2019, A&A, 629, A18. doi:10.1051/0004-6361/201935807
- Müller et al. (2017) Müller, O., Jerjen, H., & Binggeli, B. 2017, A&A, 597, A7. doi:10.1051/0004-6361/201628921
- Naiman et al. (2018) Naiman, J. P., Pillepich, A., Springel, V., et al. 2018, MNRAS, 477, 1206. doi:10.1093/mnras/sty618
- Nelson et al. (2018) Nelson, D., Pillepich, A., Springel, V., et al. 2018, MNRAS, 475, 624. doi:10.1093/mnras/stx3040
- Nelson et al. (2019) Nelson, D., Springel, V., Pillepich, A., et al. 2019, Computational Astrophysics and Cosmology, 6, 2. doi:10.1186/s40668-019-0028-x
- Peng et al. (2002) Peng, C. Y., Ho, L. C., Impey, C. D., et al. 2002, AJ, 124, 266. doi:10.1086/340952
- Pillepich et al. (2018) Pillepich, A., Nelson, D., Hernquist, L., et al. 2018, MNRAS, 475, 648. doi:10.1093/mnras/stx3112
- Raouf et al. (2014) Raouf, M., Khosroshahi, H. G., Ponman, T. J., et al. 2014, MNRAS, 442, 1578. doi:10.1093/mnras/stu963
- Roberts et al. (2021) Roberts, D. M., Nierenberg, A. M., & Peter, A. H. G. 2021, MNRAS, 502, 1205. doi:10.1093/mnras/stab069
- Sawala et al. (2016) Sawala, T., Frenk, C. S., Fattahi, A., et al. 2016, MNRAS, 456, 85. doi:10.1093/mnras/stv2597
- Schlafly & Finkbeiner (2011) Schlafly, E. F., & Finkbeiner, D. P. 2011, ApJ, 737, 103
- Schlegel et al. (1998) Schlegel, D. J., Finkbeiner, D. P., & Davis, M. 1998, ApJ, 500, 525
- Smercina et al. (2018) Smercina, A., Bell, E. F., Price, P. A., et al. 2018, ApJ, 863, 152. doi:10.3847/1538-4357/aad2d6
- Smercina et al. (2021) Smercina, A., Bell, E. F., Samuel, J., et al. 2021, arXiv:2107.04591
- Spencer et al. (2014) Spencer, M., Loebman, S., & Yoachim, P. 2014, ApJ, 788, 146. doi:10.1088/0004-637X/788/2/146
- Springel et al. (2001) Springel, V., White, S. D. M., Tormen, G., et al. 2001, MNRAS, 328, 726. doi:10.1046/j.1365-8711.2001.04912.x
- Springel et al. (2018) Springel, V., Pakmor, R., Pillepich, A., et al. 2018, MNRAS, 475, 676. doi:10.1093/mnras/stx3304
- Tanaka et al. (2017) Tanaka, M., Chiba, M., & Komiyama, Y. 2017, ApJ, 842, 127. doi:10.3847/1538-4357/aa6d11
- Tanaka et al. (2018) Tanaka, M., Chiba, M., Hayashi, K., et al. 2018, ApJ, 865, 125. doi:10.3847/1538-4357/aad9fe
- Tonry & Schneider (1988) Tonry, J., & Schneider, D. P. 1988, AJ, 96, 807
- Trentham & Tully (2009) Trentham, N. & Tully, R. B. 2009, MNRAS, 398, 722. doi:10.1111/j.1365-2966.2009.15189.x
- van den Bergh (1994) van den Bergh, S. 1994, ApJ, 428, 617. doi:10.1086/174270
- Wang et al. (2021) Wang, W., Takada, M., Li, X., et al. 2021, MNRAS, 500, 3776. doi:10.1093/mnras/staa3495
- Wetzel et al. (2016) Wetzel, A. R., Hopkins, P. F., Kim, J.-. hoon ., et al. 2016, ApJ, 827, L23. doi:10.3847/2041-8205/827/2/L23
- Zwicky et al. (1961) Zwicky, F., Herzog, E., Wild, P., et al. 1961, Pasadena: California Institute of Technology (CIT), —c1961