Registered Report:
A Laboratory Experiment on Using Different Financial-Incentivization Schemes in Software-Engineering Experimentation
Abstract
Empirical studies in software engineering are often conducted with open-source developers or in industrial collaborations. This has resulted in few experiments using financial incentives (e.g., money, vouchers) as a strategy to motivate the participants’ behavior; which is typically done in other research communities, such as economics or psychology. Even the current version of the SIGSOFT Empirical Standards does mention payouts for completing surveys only, but not for mimicking the real-world or motivating realistic behavior during experiments. So, there is a lack of understanding regarding whether financial incentives can or cannot be useful for software-engineering experimentation. To tackle this problem, we plan a survey based on which we will conduct a controlled laboratory experiment. Precisely, we will use the survey to elicit incentivization schemes we will employ as (up to) four payoff functions (i.e., mappings of choices or performance in an experiment to a monetary payment) during a code-review task in the experiment: (1) a scheme that employees prefer, (2) a scheme that is actually employed, (3) a scheme that is performance-independent, and (4) a scheme that mimics an open-source scenario. Using a between-subject design, we aim to explore how the different schemes impact the participants’ performance. Our contributions help understand the impact of financial incentives on developers in experiments as well as real-world scenarios, guiding researchers in designing experiments and organizations in compensating developers.
1 Motivation
Experimentation in software engineering rarely involves financial incentives to compensate and motivate participants. However, in most real-world situations it arguably matters whether software developers are compensated, for instance, in the form of wages or bug-bounties [24, 22] of open-source communities. Particularly experimental economists use financial incentives during experiments for two reasons [42]. First, financial incentives improve the validity of the experiment by mimicking real-world incentivisation schemes to motivate participants’ realistic behavior and performance. To this end, in addition to show-up or participation fees, the actual performance of participants during the experiment is rewarded by defining a payoff function that maps the participants’ performance during the experiment to financial rewards or penalties. Second, they allow to study different incentives with respect to their impact on participants’ performance. It is likely that using financial incentives in empirical software engineering can help improve the validity by mimicking and staying true to the real world, too.
Interestingly, there are no guidelines or recommendations on using financial incentives in software-engineering experimentation. Namely, the current SIGSOFT Empirical Standards111https://github.com/acmsigsoft/EmpiricalStandards [29] (as of August 4, 2021; commit b046f37) mention incentives solely in the context of rewarding participation in surveys. Also, to the best of our knowledge and based on a literature review, financial incentives that reward participants’ performance during an experiment are not used systematically in empirical software engineering. Although some studies broadly incentivize performance (e.g., Sayagh et al. [31] or Shargabi et al. [32]), these do not aim to improve the validity of the experiment, only participation. Furthermore, we know from experimental economics [8, 7] that finding a realistic (and thus externally valid) way to reward performance is challenging and no simple one-fits-all solution exists. For instance, the performance of open-source developers depends less on financial rewards than those of industrial developers [3, 43, 19, 4].
As a step towards understanding and systematizing the potential of using financial incentives in software-engineering experimentation, we propose a two-part study comprising a survey and a controlled experiment in the context of bug detection through code reviews. First, we will conduct a survey with practitioners to elicit real-world incentivisation schemes on bug finding. In the survey, we will distinguish between the schemes most participants prefer and those actually employed. Building on the results, we will define two corresponding payoff functions for our experiment. To extend our experiment, we will add two more payoff functions: one that is performance-independent and one that resembles the motives of open-source developers. We derive the latter function using the induced-value method established in experimental economics [35, 42], which induces a controlled willingness of participants to achieve a desired goal (i.e., identify a bug) or obtain a certain good during an experiment by mimicking its monetary value (e.g., a reward). Second, we will employ our actual between-subject experiment to explore to what extent each of the four payoff functions impacts the participants’ behavior. Overall, we primarily contribute to improving researchers’ understanding of whether and how financial incentives can help software-engineering experimentation. However, our experiment also has the potential to reveal whether different incentivisation schemes could improve practitioners’ motivation. Our survey and experimental design artifacts are available for peer-reviewing.222https://osf.io/mcxed/?view_only=602088776ce5498597c473e74bbe0394
2 Related Work
Experiments in software engineering are comparable to “real-effort experiments” in experimental economics, which involve participants who solve certain tasks to increase their payoffs. Consequently, we build on experiences from the field of experimental economics, which involves a large amount of literature on how and when to use financial incentives in real-effort experiments [39, 14, 12, 10]. For instance, some findings indicate gender differences regarding the impact of incentivization schemes, which we have to consider during our experiment. In detail, research has shown that men choose more competitive schemes (e.g., tournaments, performance payments). Similarly, participants with higher social preferences select such competitive schemes more rarely [27, 9]. We will consider such factors when analyzing the results of our experiment (e.g., comparing gender differences if the number of participants allows).
Unfortunately, there is much less research on incentivization schemes in software-engineering experimentation. Mason and Watts [26] have analyzed the impact of financial incentives on crowd performance during software projects using online experiments. The results are similar to those in experimental economics, but the authors also acknowledge that they did not design the incentives to mimic the real world or to improve the participants’ motivation. Other studies have been concerned with the impact of payments on employees’ motivation [33, 37], job satisfaction [21, 36], or job change [6, 16, 13]. For instance, Baddoo et al. [3] conducted a case study and found that developers perceived wages and benefits as an important motivator, but they did not connect payments to objective performance metrics. None of the studies we are aware of decomposes payments or wages into specific components (e.g., performance-dependent versus performance-independent). So, the effectiveness of different payoff schemes on developers’ performance remains unclear.
Software-engineering researchers have investigated the motivations of open-source developers to a much greater extent [11, 18, 15, 43, 19]. From the economics perspective, open-source systems represent a public good [5, 25]: they are available to everyone and their consumption do not yield disadvantages to anyone else. A typical problem of public goods is that individual and group incentives collide, which usually leads to an insufficient provision of the good. While typical explanations for open-source development focus on high intrinsic motivation to contribute or learn, this is not always the case. For instance, Roberts et al. [30] show that financial incentives can actually improve open-source developers’ motivation (in terms of contributions). Still, financial incentives are at least not always the predominant motivators for software developers [4, 33]. As a consequence, we will use the concept of open-source software as a social good [19] as an extreme example (i.e., the developers help solve a social problem, but do not receive a payment) for designing a fourth payoff function in our experiment.
3 Study Protocol
As explained previously, our study involves two data-collection processes, a survey and a laboratory experiment. In Table 1, we provide an overview of our study based on the PCI RR study design template, which we will explain in more detail in this section.
question
hypothesis
sampling plan
analysis plan
sensitivity rationale
interpretation
disproved theory
Which payoff functions are applied/preferred in SE practice? (survey)
N/A
At least 30 participants (personal contacts and social media).
We will analyze the absolute frequency of the combinations of payment components. We compute the mean values of the weights for the MA and MP combinations.
N/A
If MAIT and MPIT should be identical, we will reduce the number of treatments from four to three.
N/A
How do different payoff functions impact the performance of participants in SE experiments? (experiment)
H1: Participants without performance-based incentivization (NPIT) have on average a worse performance than those with performance-based incentivization (e.g., OSIT, MAIT, MPIT).
H2: The experimental performance of participants under performance-based incentivization (e.g., OSIT, MAIT, MPIT) differs between treatments.
We aim to recruit at least 80 (20 per treatment) computer-science students of the Otto-von-Guericke University Magdeburg. Furthermore, we will conduct an a posteriori power analysis to reason on the power of our tests.
If their assumptions are fulfilled, we will use parametric tests to compare between the treatments. Otherwise, we will employ non-parametric tests. For H1, we will pairwise compare the performance-independent treatment to the other treatments:
•
NPIT vs. MPIT
•
NPIT vs. MAIT
•
NPIT vs. OSIT
For H2, we will pairwise compare the performance-dependent treatments:
•
MPIT vs. MAIT
•
MAIT vs. OSIT
•
OSIT vs. MPIT
In total, we will compute six pairwise tests to compare the four treatments with one another and will correct for multiple hypotheses testing (Holm-Bonferroni method).
We will also conduct regression analyses using the treatments as categorical variables (NPIT as base) and age, gender, experience, as well as arousal as exogenous variables
Due to our experimental design, we face the issue of multiple hypotheses testing. We address this issue by applying the Holm-Bonferroni correction.
We find support for H1, if our participants’ performance in NPIT is significantly lower than in any other of our experimental treatments at —after correcting with the Holm-Bonferroni method: (NPIT < MPIT) OR (NPIT < MAIT) OR (NPIT < OSIT).
Confirming H1 means that the performance is better in the specific treatment with performance-based incentives compared to NPIT.
This implies that if performance plays a role in a software-engineering experiment, performance-based incentivization should be considered.
We find support for H2, if our participants’ performance between the treatments differs and the respective tests are significant with —after correcting with the Holm-Bonferroni method: (MPIT < > MAIT) OR (MAIT < > OSIT) OR (OSIT < > MPIT).
Confirming H2 means that the practitioners’ performance differs depending on the type of incentivization.
If we cannot confirm H2, we do not find evidence for OSIT, MAIT, and MPIT to induce different performances.
There is no theory focusing on the role of incentives in software engineering.
Incentivization in software-engineering experiments is scarcely applied.
Our results could improve experimental designs in software engineering by guiding researchers when and how to use incentives in their experiments.
NPIT: No Performance Incentives Treatment – OSIT: Open-Source Incentives Treatment – MAIT: Most-Applied Incentives Treatment – MPIT: Most-Preferred Incentives Treatment
3.1 Survey Design
Goal. With our survey, we aim to explore i) which payment components (e.g., wages only, bug bounties) are most applied (MA) in practice and ii) which payment components are most preferred (MP) by practitioners. We display an overview of these payment components with concrete examples in Table 2. Our intention is to understand what is actually employed compared to what would be preferred as a payment schema to guide the design of our experiment.
Structure. To achieve our goal, we created an online questionnaire with the following structure (cf. Table 3). At first, we will welcome our participants, informing them about the survey’s topic, duration, and their right to withdraw from our experiment at any point in time without any disadvantages. Furthermore, we will ask for consent to collect, process, and publish the data in anonymized from. To allow for questions, we will provide the contact data of at least one author on this first page. Then, we will ask about each participant’s background to collect control variables, for instance, regarding their demographics, role in their organization, the domain they work in, and experience with code reviews. These background questions allow us to monitor whether we have acquired a broad sample of responses from different organizations, and thus on varying practices. Our goal is to mitigate any bias caused by external variables, such as the organizations’ culture. Also, we will discard the answers of participants who have no experience with code reviews. Based on the participants’ roles, the online survey will show the questions on the payment structures in an adaptive manner. We designed these questions as well as their answering options based on established guidelines and our experiences with empirical studies in software engineering [34, 28, 23].
To explore the payment components (target variables), we will display the ones we summarize in Table 2. We will use a checklist in which a participant can select all components that are applied in their organization. Each selected component will have a field in which the participant can enter a percentage to indicate to what extent that component impacts their payment (e.g., 80 % wage and 20 % bug bounty). Then, we present the same checklist and fields again. This time, the participant shall define which subset of the components they would prefer to contribute with what share to the payment. While we present this second list as is to any management role (e.g., project manager, CEO), we ask software engineers (e.g., developer, tester) to decide upon those components from the perspective of being the team or organization lead. To prevent sequence effects, we will randomize the order in which the two treatment questions occur (applied and preferred). Finally, we ask each participant to indicate how many hours per week they work unpaid overtime—which represents a type of performance penalty for our payoff functions—and allow them to enter any additional comments on the survey.
payment component example variable not performance-based hourly wage payment for hours spent on code review payment per task fixed payment for conducting a code review others specified by participants performance-based reward for completing review bonus for finding all bugs reward for quality bonus for correctly found bug (e.g., bug bounty) reward for time bonus for performing reviews fast reward for organization’s performance bonus provided based on the organization’s profits penalty for low quality penalty for mistakes within a certain period (e.g., missed bugs) penalty for checks penalty for marking lines of code in the experiment penalty for required overtime penalty for not completing within working hours others specified by participants
Sampling Participants. We will invite personal contacts and collaborators from different organizations, involving software developers, project managers, and company managers. Note that we exclude self-employed or freelancer developers who typically ask for a fixed payment for a specific task or project. In addition, we will distribute a second version (to distinguish both populations) of our survey through our social media networks. We will test whether there are differences between both samples regarding our variables of interest. If the MA and MP incentives are identical in both samples, we will collapse the data. Otherwise, we will build on the sample of our personal contacts. This allows us to have a higher level of control over the participants’ software-engineering background, and their experience with code reviews.
Our goal is to acquire at least 30 responses to obtain a reasonable understanding of applied and preferred payments. Since we do not evaluate the survey data using inferential statistics, we base our sample-size planning on the limited access to a small, specialized number of potential participants. Note that we will not pay incentives for participating in the survey. We expect that the survey will take 10 minutes at most, but will verify the required time and understandability of the survey through test runs with three PhD students from our work groups.
Analysis Plan. To specify the payoff functions for our experiment, we will consider the absolute frequency of combinations of different payment components. Precisely, to identify the MA and MP combinations, we will choose the respective combination that was selected by the largest number of respondents (i.e., modal value). For these two combinations, we will compute the mean values for their weights. We will perform a graphical-outlier analysis using boxplots [38], excluding participants with extreme values (i.e., three inter quartile ranges above the third quartile or below the first quartile). As an example, assume that most of our participants would state to prefer the combination of fixed wages (with a weight of 75 % on average) and bug bounties (25 % on average). Then, we would define a cost function as .
Threats to Validity. Our survey relies mostly on our personal contacts, which may bias its outcomes. We can mitigate this threat, since we have a broad set of collaborators in different countries and organizations. Moreover, defining the “ideal” payoff function for practitioners may pressure the participants, is hard to define (e.g., considering different countries, organizational cultures, open-source communities, or expectations), and challenging to measure (e.g., what is preferred or efficient). However, this is due to the nature of our experiment and the property we study: financial incentives. Consequently, these threats remain and we have to discuss their potential impact, which can only be mitigated with an appropriately large sample population.
variable description operationalization control variables demographics age, gender, living country, highest level of education nominal (single-choice list) role participant’s role in their organization nominal (single-choice list) experience years of experience in software development and code reviewing 6-level Likert scale (<1 – >15) frequency current involvement in software development and code reviewing 5-level Likert scale (none at all – daily) domain domain of the participant’s organization nominal (single-choice list) size of organization number of employees 5-level Likert scale (<21 – >200) size of team number of members in participant’s team (if applicable) 6-level Likert scale (1 – >50) development process whether agile or traditional development processes are employed agile non-agile target variables MA/MP incentives list of payment components that can be selected (cf. Table 2) nominal (checklist) MA/MP percentage percentage to weigh the payment components chosen before continuous (0–100 %) working hours per week weekly working hours according to the participant’s contract continuous unpaid overtime potential unpaid overtime of employees in proportion to working hours per week ratio MA: most applied; MP: most preferred
3.2 Laboratory Experiment
Goal. After eliciting which payoff functions are used and preferred in practice, we will conduct our actual experiment to measure the impact of different payoff functions in software-engineering experiments. We focus on code reviews and bug identification in this experiment, since these are typical tasks in software engineering that also involve different types of incentives. So, we aim to support software-engineering researchers by identifying which payoff functions can be used to improve the validity of experiments.
Treatments. As motivated, we aim to compare four treatments to reflect different payoff functions that stem from our survey and established research. While we are able to define the payoff functions for the “No Performance Incentives Treatment” (NPIT) and “Open-Source Incentives Treatment” (OSIT) in advance, we need data from our survey to proceed with the “MP Incentives Treatment” (MPIT) and “MA Incentives Treatment” (MAIT). However, we can a priori describe the method we will use to derive the payoff functions for those treatments. Note that some treatments may yield the same payoff function (i.e., NPIT, MAIT, and MPIT). It is unlikely that all three payoff functions will be identical, but we will merge those that are and reduce the number of treatments accordingly (see Table 2 for the variable names):
- No Performance Incentives Treatment (NPIT):
-
For NPIT, we provide a fixed payment (i.e., 10 €) that will be payed out at the end of an experimental session. So, this treatment mimics a participation fee for experiments or fixed wages for the real world. Consequently, the payoff is independent of a participant’s actual performance. Overall, the payoff function () for this treatment is:
- Open-Source Incentives Treatment (OSIT):
-
Again, this treatment does not depend on our survey results, but builds on findings from the software-engineering literature on the motivation of open-source developers [11, 18, 15, 43, 19]. We remark that we focus particularly on those developers that do not receive payments (e.g., as wages or bug bounties), but work for free. In a simplified, economics perspective, such developers still act within a conceptual cost-benefit framework (i.e., they perceive to obtain a benefit from working on the software). We build on the induced-value method [42] from experimental economics to mimic this cost-benefit framework with financial incentives to derive the OSIT treatment. Besides a participation fee, we will involve a performance-based reward for correctly identifying all bugs to resemble goal-oriented incentives (e.g., personal fulfillment of achieving a goal or supporting open-source projects). Furthermore, we consider the opportunity costs of working on open-source software (i.e., less time for other projects and additional effort for performing a number of checks). Overall, the payoff function () for this treatment is:
- MA Incentives Treatment (MAIT):
-
Using our survey results, we will be able the identify a payoff function that represents what is mostly applied in practice. We will then derive a payoff function as explained in Section 3.1.
- MP Incentives Treatment (MPIT):
-
We will use the same method we used for MAIT to define a payoff function for MPIT.
Note that these payoff functions cannot be perfect, but they are mimicking real-world scenarios, and thus are feasible to achieve our goals.
We use the same code-review example for all treatments to keep the complexity of the problem constant. For all treatments, we will calibrate the payoff function so that the expected payoff for each participant in and between treatments is approximately the same (i.e., around 10 €). Implementing similar expected payoffs avoids unfairness between treatments, and ensures that performance differences are caused by different incentive schemes and not the total size of the payoff. After the treatment, we will gather demographic data from the participants (e.g., age, gender) and ask for any concerns or feedback. We estimate that each sessions of the experiment will take 45 minutes.
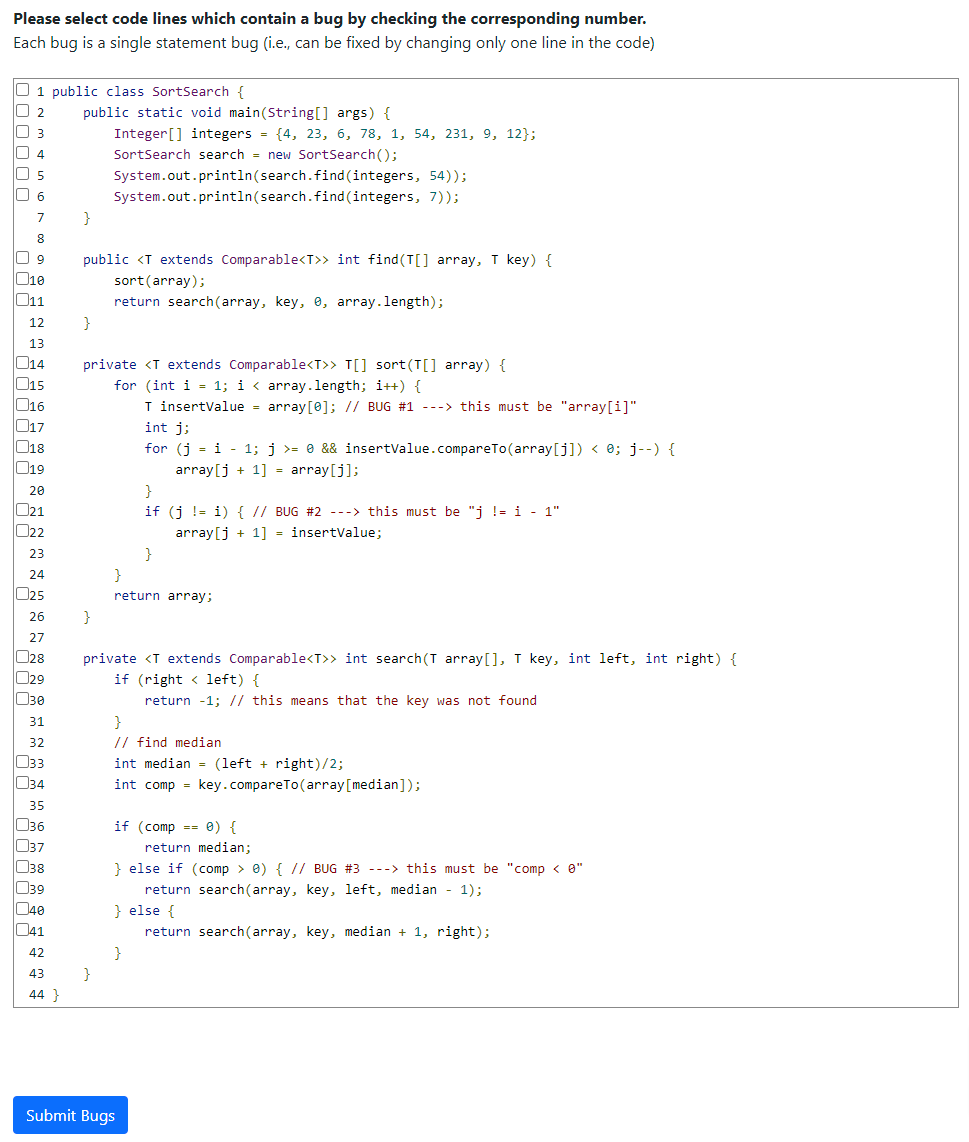
Code Example. We selected and adapted three different Java code examples (i.e., limited calculator, sorting and searching, a Stack), the first from the learning platform LeetCode333https://leetcode.com and the other two from the “The Algorithms” GitHub repository.444https://github.com/TheAlgorithms/Java To create buggy examples, we injected three bugs into each code example by using mutation operators [20]. Note that we partly reworked the examples to make them more suitable for our experiment (e.g., combining searching and sorting), added comments at the top of each example explaining its general purpose, and kept other comments (potentially adapted) as well as identifier names to improve the realism. We aimed to limit the time of the experiment to avoid fatigue and actually allow for a laboratory setting, and thus decided to use only one example. To select the most suitable subject system for our experiment, we performed a pilot study in which we measured the time and performance of the participants. In detail, we asked one M.Sc. student from the University of Glasgow who has worked as a software practitioner in industry and four PhD students from the University of Zurich to perform the code reviews on the buggy examples. Overall, each example was reviewed by three of these participants. Our results indicate that the sorting and searching example would be most feasible (i.e., 12 min, 4/9 bugs correctly identified, 5 false positives), considering that the task should neither be too easy nor to hard, the background of the pilot’s participants and the potential participants for our experiment, as well as the examples’ quality. The other two examples seemed too large or complicated (i.e., 14 min, 2/9 bugs; 4 false positives; 8 min, 5/9 bugs, 8 false positives), which is why we decided to use the sorting and searching example (available in our artifacts).2 We remark that none of the participants from this pilot study will be involved in our actual experiment. In Figure 1, we display a screenshot of the sorting and searching code example as we will show it to participants in the lab.
Sampling Participants. We aim to recruit a minimum of 80 participants (20 per treatment) by inviting students and faculty members of the Faculty for Computer Science of the Otto-von-Guericke University Magdeburg, Germany. In 2019, 1,676 Bachelor and Master students as well as roughly 200 PhD students had been enrolled at the faculty, and 193 (former) members of the faculty are listed in the participant pool of the MaXLab555https://maxlab.ovgu.de/en/ at which we will conduct the laboratory experiment. We will focus on recruiting participants who passed the faculty courses on Java and algorithms (first two semester) or equivalent courses to ensure that our participants have the fundamental knowledge required for understanding our sorting and searching example. If possible (e.g., considering finances, response rate), we will invite further participants (potentially from industry and other faculties) to strengthen the validity of our results. Yet, it is not realistic to have more than 35 participants per treatment, due to the number of possible participants with the required background on software engineering. Applying the Holm-Bonferroni correction for multiple hypothesis testing, we calculate the power analysis for the strictest corrected of () in the range between 20 and 35 participants per treatment. A Wilcoxon-Mann-Whitney test for independent samples with 20/35 participants per group (N=40/70) would be sensitive to effects of with 90 % power (). This means that our experiment would not be feasible to reliably detect effects smaller than Cohen’s within the range of realistic sample sizes. In Figure 2, we illustrate this relation between effect and sample size. It is unlikely that we will identify statistically significant differences. Note that we focus on the Otto-von-Guericke University, since the MaXLab is located there. Regarding the Covid pandemic, it is currently possible to conduct sessions with reduced numbers of participants (i.e., 10 instead of 20). We are not aware of any theory or previous experiments on the effect of financial incentives on developers’ performance during code reviews or other software-engineering activities. As a consequence, we cannot confidentially define what the smallest effect size of interest would be.

Hypotheses. Reflecting on findings in software engineering as well as other domains, we define two hypotheses (H) we want to study in our experiment:
-
H1
Participants without performance-based incentivization (NPIT) have on average a worse performance (lower value in the F1-score, explained shortly) than those with performance-based incentivization (e.g., OSIT, MAIT, MPIT).
-
H2
The experimental performance of participants under performance-based incentivization (e.g., OSIT, MAIT, MPIT) differs between treatments.
Besides analyzing these hypotheses, we will also compare the behavior (e.g. risk taking) and performance between all groups to understand which incentives have what impact. Moreover, we will use eye trackers to explore fixation counts, fixation lengths, and return fixations. This will allows us to obtain a deeper understanding of the search and evaluation processes during code reviews. Also, it enables us to investigate potential differences in eye movements depending on the incentivization. More precisely, we intend to follow similar studies from software engineering [1] to explore how our participants read the source code, for instance, do they focus on the actually buggy code, what lines are they reading more often, or which code elements do they focus on to explore bugs? We will report all findings from the eye-tracking data as exploratory outcomes. The eye-tracking data is preprocessed by the firmware of Tobii (Version 1.181.37603) using the Tobii I-VT (fixation) filter.
Metrics. The performance of our participants is primarily depending on their correctness in identifying bugs during the code review. Since this can be expressed as confusion matrices, we decided to implement the F1-score (defined as ) as the only outcome measure to evaluate our hypotheses. For our experiment, true positives (TP) refer to the correctly identified bugs, false positives (FP) refer to the locations marked as buggy that are actually correct, and false negatives (FN) refer to the undetected bugs. Note that our participants will not be aware of this metric (they will only know about the payoff function) to avoid biases, and any decision based on the payoff function will be reflected by the F1-score (e.g., taking more risks due to missing penalties under NPIT). So, this metric allows us to compare the performances of our participants between treatments considering that they motivate different behaviors, which allows us to test our hypotheses. In summary, our dependent variable is the F1-score, our independent variable is the payoff function, and we will collect additional data via a post experimental survey (e.g., experience, gender, age, stress) as well as eye-tracking data for exploratory analyses.
Experimental Design. Fundamentally, we will employ a 4x1 design (alternatively, if the survey indicates no differences between MPIT and MAIT, a 3x1 design). For each treatment, we only change the payoff function. We will allocate participants to their treatment at random, without anyone repeating the experiment in another treatment. On-site, we can execute the experiment at the experimental laboratory MaXLab of the Otto-von-Guericke University using a standardized experimental environment. We will employ a between-subject design measuring the participants’ performance and measure the eye movement of four participants (restricted by number of devices) in each session using eye trackers (60 Hz Tobii Pro Nano H). Note that we will identify any impact wearing eye-trackers may have on our participants during our analysis. However, it is not likely that they will have an impact, because this type of eye trackers is mounted to the screen and barely noticeable, not a helmet the participants have to wear. The procedure for each session is as follows:
- Welcome and Experimental Instructions:
-
After the participants of a session enter the laboratory, they are randomly allocated to working stations with the experimental environment installed. Moreover, four of them are randomly selected for using eye trackers. To this end, we will already state in the invitation that eye tracking is involved in the experiment. If a participant nonetheless disagrees to participate using eye trackers, we will exclude them from the experiment to avoid selection bias. Once all participants are at their places, the experimenter begins the experiment. The participants receive general information about the experiment (e.g., welcoming text), information about the task at hand (code review), explanation on how to enter data (e.g., check box), and the definition of their payoff function for the experiment (with some examples).
- Review Task:
-
All participants receive the code example with the task to identify any bugs within it. Note that the participants will not be aware of the precise number of bugs in the code. Instead, a message will explain that the code does not behave as expected when it is executed. At the end of the task, we can incorporate unpaid overtime as a payment component by asking participants to stay for five more minutes to work on the task.
- Post Experimental Questionnaire:
-
After the experiment, we will ask our participants a number of demographic questions (i.e., gender, age, study program, study term, programming experience). We will further apply the distress subscale of the Short Stress State Questionnaire [17] to measure arousal and stress of the participants. Eliciting such data on demographics and arousal will enable us to identify potential confounding parameters.
- Payoff Procedure:
-
After we have collected all the data, we will provide information about their performance and payoff to the participants by displaying them on their screen. We will pay out these earnings privately in a separate room in cash immediately afterwards.
Analysis Plan. To analyze our data, we will employ the following steps:
- Data Cleaning:
-
The experimental environment stores raw data in CSV files. We do not plan to remove any outliers or data unless we identify a specific reason for which we believe the data would be invalid, which involves primarily two cases. First, it may happen that the eye-movement recordings of a participant have a low quality (i.e., <70 % gaze sample). Gaze sample is defined as the percentage of the time that the eyes are correctly detected. Since we use eye tracking only for exploratory analyses, we will not replace subjects just because the calibration was not good enough. Moreover, the participants will not be aware of the quality and can simply continue with the actual experiment. However, we will exclude their eye-tracking data from our exploratory analysis. Second, we will exclude participants if they violate the terms of conduct of the laboratory. While this case is unlikely, we will try to replace these participants to achieve the desired sample sizes. Yet, we would do this before data cleaning.
- Descriptive Statistics:
-
We will present descriptive statistics for the demographic, dependent, and independent variables for each treatment by reporting means and standard deviations of the respective variables.
- Observational Descriptions:
-
Since sole statistical testing is often subject to misinterpretation and not recommended [40, 41, 2], we will focus on describing our observations. For this purpose, we will start with reporting the results we obtained, plotting suitable visualizations, and identifying patterns within these. The statistical tests will help us to improve our confidence in these observations.
- Inferential Statistics:
-
For our analysis, we will focus on performance (i.e., F1 score). We will first check whether the assumptions required for parametric tests (e.g., normality) are fulfilled, and if not proceed with non-parametric tests (i.e., Wilcoxon-Mann-Whitney test). Since we are interested in all possible differences between the four treatments, we have to conduct all pairwise treatment tests. In total, this leads to 6 tests, or to 3 tests if our survey indicates that two treatments are mostly identical. For the significance analyses, we will apply a significance level of and correct for multiple hypotheses testing using the Holm-Bonferroni method. Though the share of participants who will use eye trackers will be constant among all treatments, and thus should not affect treatment effects, we will further check whether the presence of eye trackers affected performance. To increase the statistical robustness, we will also conduct a regression analysis using the treatments as categorical variables and NPIT as base. As exogenous variables, we include: age, gender, experience, and arousal of the participants. In contrast to the preregistered tests, we will discuss these results as exploratory outcomes.
Based on these steps, we will obtain a detailed understanding of how different incetivization schemes impact the performance of software developers during code review.
References
- Abid et al. [2019] Nahla J. Abid, Bonita Sharif, Natalia Dragan, Hend Alrasheed, and Jonathan I. Maletic. Developer Reading Behavior While Summarizing Java Methods: Size and Context Matters. In International Conference on Software Engineering (ICSE), pages 384–395. IEEE, 2019. doi: 10.1109/icse.2019.00052.
- Amrhein et al. [2019] Valentin Amrhein, Sander Greenland, and Blake McShane. Retire Statistical Significance: Scientists Rise Up against Statistical Significance. Nature, 567(7748):305–307, 2019. doi: 10.1038/d41586-019-00857-9.
- Baddoo et al. [2006] Nathan Baddoo, Tracy Hall, and Dorota Jagielska. Software Developer Motivation in a High Maturity Company: A Case Study. Software Process: Improvement and Practice, 11(3):219–228, 2006. doi: 10.1002/spip.265.
- Beecham et al. [2008] Sarah Beecham, Nathan Baddoo, Tracy Hall, Hugh Robinson, and Helen Sharp. Motivation in Software Engineering: A Systematic Literature Review. Information and Software Technology, 50(9-10):860–878, 2008. doi: 10.1016/j.infsof.2007.09.004.
- Bitzer et al. [2007] Jürgen Bitzer, Wolfram Schrettl, and Philipp J. H. Schröder. Intrinsic Motivation in Open Source Software Development. Journal of Comparative Economics, 35(1):160–169, 2007. doi: 10.1016/j.jce.2006.10.001.
- Burn et al. [1994] Janice M. Burn, Eugenia M. W. Ng Tye, Louis C. K. Ma, and Ray S. K. Poon. Job Expectations of IS Professionals in Hong Kong. In Conference on Computer Personnel Research (CPR), pages 231–241. ACM, 1994. doi: 10.1145/186281.186327.
- Carpenter and Huet-Vaughn [2019] Jeffrey Carpenter and Emiliano Huet-Vaughn. Real-Effort Tasks. In Handbook of Research Methods and Applications in Experimental Economics, pages 368–383. Edward Elgar Publishing, 2019. doi: 10.4337/9781788110563.00030.
- Charness and Kuhn [2011] Gary Charness and Peter Kuhn. Lab Labor: What Can Labor Economists Learn from the Lab? In Handbook of Labor Economics, pages 229–330. Elsevier, 2011. doi: 10.1016/s0169-7218(11)00409-6.
- Dohmen and Falk [2011] Thomas Dohmen and Armin Falk. Performance Pay and Multidimensional Sorting: Productivity, Preferences, and Gender. The American Economic Review, 101(2):556–590, 2011. doi: 10.1257/aer.101.2.556.
- Erkal et al. [2018] Nisvan Erkal, Lata Gangadharan, and Boon H. Koh. Monetary and Non-Monetary Incentives in Real-Effort Tournaments. European Economic Review, 101:528–545, 2018. doi: 10.1016/j.euroecorev.2017.10.021.
- Gerosa et al. [2021] Marco Gerosa, Igor Wiese, Bianca Trinkenreich, Georg Link, Gregorio Robles, Christoph Treude, Igor Steinmacher, and Anita Sarma. The Shifting Sands of Motivation: Revisiting What Drives Contributors in Open Source. In International Conference on Software Engineering (ICSE), pages 1046–1058. IEEE, 2021. doi: 10.1109/icse43902.2021.00098.
- Gill and Prowse [2012] David Gill and Victoria Prowse. A Structural Analysis of Disappointment Aversion in a Real Effort Competition. The American Economic Review, 102(1):469–503, 2012. doi: 10.1257/aer.102.1.469.
- Graziotin and Fagerholm [2019] Daniel Graziotin and Fabian Fagerholm. Happiness and the Productivity of Software Engineers. In Rethinking Productivity in Software Engineering, pages 109–124. Apress, 2019. doi: 10.1007/978-1-4842-4221-6_10.
- Greiner et al. [2011] Ben Greiner, Axel Ockenfels, and Peter Werner. Wage Transparency and Performance: A Real-Effort Experiment. Economics Letters, 111(3):236–238, 2011. doi: 10.1016/j.econlet.2011.02.015.
- Hars and Ou [2002] Alexander Hars and Shaosong Ou. Working for Free? Motivations for Participating in Open-Source Projects. International Journal of Electronic Commerce, 6(3):25–39, 2002. doi: 10.1080/10864415.2002.11044241.
- Hasan et al. [2021] Khalid Hasan, Partho Chakraborty, Rifat Shahriyar, Anindya Iqbal, and Gias Uddin. A Survey-Based Qualitative Study to Characterize Expectations of Software Developers from Five Stakeholders. In International Symposium on Empirical Software Engineering and Measurement (ESEM), pages 4:1–11. ACM, 2021. doi: 10.1145/3475716.3475787.
- Helton [2004] William S. Helton. Validation of a Short Stress State Questionnaire. In Human Factors and Ergonomics Society Annual Meeting (HFES), pages 1238–1242. Sage, 2004. doi: https://doi.org/10.1177%2F154193120404801107.
- Hertel et al. [2003] Guido Hertel, Sven Niedner, and Stefanie Herrmann. Motivation of Software Developers in Open Source Projects: An Internet-Based Survey of Contributors to the Linux Kernel. Research Policy, 32(7):1159–1177, 2003. doi: 10.1016/s0048-7333(03)00047-7.
- Huang et al. [2021] Yu Huang, Denae Ford, and Thomas Zimmermann. Leaving My Fingerprints: Motivations and Challenges of Contributing to OSS for Social Good. In International Conference on Software Engineering (ICSE), pages 1020–1032. IEEE, 2021. doi: 10.1109/icse43902.2021.00096.
- Jia and Harman [2011] Yue Jia and Mark Harman. An Analysis and Survey of the Development of Mutation Testing. IEEE Transactions on Software Engineering, 37(5):649–678, 2011. doi: 10.1109/tse.2010.62.
- Klenke and Kievit [1992] Karin Klenke and Karen-Ann Kievit. Predictors of Leadership Style, Organizational Commitment and Turnover of Information Systems Professionals. In Conference on Computer Personnel Research (CPR), pages 171–183. ACM, 1992. doi: 10.1145/144001.144056.
- Krishnamurthy and Tripathi [2006] Sandeep Krishnamurthy and Arvind K. Tripathi. Bounty Programs in Free/Libre/Open Source Software. In The Economics of Open Source Software Development, pages 165–183. Elsevier, 2006. doi: 10.1016/b978-044452769-1/50008-1.
- Krüger et al. [2019] Jacob Krüger, Gül Çalıklı, Thorsten Berger, Thomas Leich, and Gunter Saake. Effects of Explicit Feature Traceability on Program Comprehension. In Joint European Software Engineering Conference and Symposium on the Foundations of Software Engineering (ESEC/FSE), pages 338–349. ACM, 2019. doi: 10.1145/3338906.3338968.
- Krüger et al. [2020] Jacob Krüger, Sebastian Nielebock, and Robert Heumüller. How Can I Contribute? A Qualitative Analysis of Community Websites of 25 Unix-Like Distributions. In International Conference on Evaluation and Assessment in Software Engineering (EASE), pages 324–329. ACM, 2020. doi: 10.1145/3383219.3383256.
- Lerner and Tirole [2003] Josh Lerner and Jean Tirole. Some Simple Economics of Open Source. The Journal of Industrial Economics, 50(2):197–234, 2003. doi: 10.1111/1467-6451.00174.
- Mason and Watts [2009] Winter Mason and Duncan J. Watts. Financial Incentives and the “Performance of Crowds”. In Workshop on Human Computation (HCOMP), pages 77–85. ACM, 2009. doi: 10.1145/1600150.1600175.
- Niederle and Vesterlund [2007] Muriel Niederle and Lise Vesterlund. Do Women Shy Away From Competition? Do Men Compete Too Much? The Quarterly Journal of Economics, 122(3):1067–1101, 2007. doi: 10.1162/qjec.122.3.1067.
- Nielebock et al. [2019] Sebastian Nielebock, Dariusz Krolikowski, Jacob Krüger, Thomas Leich, and Frank Ortmeier. Commenting Source Code: Is It Worth It for Small Programming Tasks? Empirical Software Engineering, 24(3):1418–1457, 2019. doi: 10.1007/s10664-018-9664-z.
- Ralph [2021] D. Paul Ralph. ACM SIGSOFT Empirical Standards Released. ACM SIGSOFT Software Engineering Notes, 46(1):19–19, 2021. doi: 10.1145/3437479.3437483.
- Roberts et al. [2006] Jeffrey A. Roberts, Il-Horn Hann, and Sandra A. Slaughter. Understanding the Motivations, Participation, and Performance of Open Source Software Developers: A Longitudinal Study of the Apache Projects. Management Science, 52(7):984–999, 2006. doi: 10.1287/mnsc.1060.0554.
- Sayagh et al. [2020] Mohammed Sayagh, Noureddine Kerzazi, Fabio Petrillo, Khalil Bennani, and Bram Adams. What Should Your Run-Time Configuration Framework Do to Help Developers? Empirical Software Engineering, 25(2):1259–1293, 2020. doi: 10.1007/s10664-019-09790-x.
- Shargabi et al. [2020] Amal A. Shargabi, Syed A. Aljunid, Muthukkaruppan Annamalai, and Abdullah M. Zin. Performing Tasks Can Improve Program Comprehension Mental Model of Novice Developers. In International Conference on Program Comprehension (ICPC), pages 263–273. ACM, 2020. doi: 10.1145/3387904.3389277.
- Sharp et al. [2009] Helen Sharp, Nathan Baddoo, Sarah Beecham, Tracy Hall, and Hugh Robinson. Models of Motivation in Software Engineering. Information and Software Technology, 51(1):219–233, 2009. doi: 10.1016/j.infsof.2008.05.009.
- Siegmund et al. [2014] Janet Siegmund, Christian Kästner, Jörg Liebig, Sven Apel, and Stefan Hanenberg. Measuring and Modeling Programming Experience. Empirical Software Engineering, 19(5):1299–1334, 2014. doi: 10.1007/s10664-013-9286-4.
- Smith [1976] Vernom L. Smith. Experimental Economics: Induced Value Theory. The American Economic Review, 66(2):274–279, 1976.
- Storey et al. [2021] Margaret-Anne Storey, Thomas Zimmermann, Christian Bird, Jacek Czerwonka, Brendan Murphy, and Eirini Kalliamvakou. Towards a Theory of Software Developer Job Satisfaction and Perceived Productivity. IEEE Transactions on Software Engineering, 47(10):2125–2142, 2021. doi: 10.1109/tse.2019.2944354.
- Thatcher et al. [2002] Jason B. Thatcher, Yongmei Liu, and Lee P. Stepina. The Role of the Work Itself: An Empirical Examination of Intrinsic Motivation’s Influence on IT Workers Attitudes and Intentions. In Conference on Computer Personnel Research (CPR), pages 25–33. ACM, 2002. doi: 10.1145/512360.512365.
- Tukey [1977] John W. Tukey. Exploratory Data Analysis. Reading, 1977.
- van Dijk et al. [2001] Frans van Dijk, Joep Sonnemans, and Frans van Winden. Incentive Systems in a Real Effort Experiment. European Economic Review, 45(2):187–214, 2001. doi: 10.1016/s0014-2921(00)00056-8.
- Wasserstein and Lazar [2016] Ronald L. Wasserstein and Nicole A. Lazar. The ASA Statement on p-Values: Context, Process, and Purpose. The American Statistician, 70(2):129–133, 2016. doi: 10.1080/00031305.2016.1154108.
- Wasserstein et al. [2019] Ronald L. Wasserstein, Allen L. Schirm, and Nicole A. Lazar. Moving to a World Beyond “p < 0.05”. The American Statistician, 73(sup1):1–19, 2019. doi: 10.1080/00031305.2019.1583913.
- Weimann and Brosig-Koch [2019] Joachim Weimann and Jeannette Brosig-Koch. Methods in Experimental Economics. Springer, 2019. doi: 10.1007/978-3-319-93363-4.
- Ye and Kishida [2003] Yunwen Ye and Kouichi Kishida. Toward an Understanding of the Motivation of Open Source Software Developers. In International Conference on Software Engineering (ICSE), pages 419–429. IEEE, 2003. doi: 10.1109/icse.2003.1201220.